Single-Cell Analysis of Breast Cancer Subtypes Reveals Distinct Epithelial Biology, Microenvironment Interactions, and Therapeutic Opportunities
This comprehensive single-cell RNA sequencing analysis characterizes the cellular landscape and molecular features of breast cancer, comparing normal tissue with ER+, HER2+, and TNBC subtypes. We observe distinct genomic instability in tumor epithelial cells, significant shifts in immune and stromal cell populations, and subtype-specific cell-cell interaction networks. Key findings highlight unique metabolic reprogramming, immune evasion strategies, and altered proliferative programs across the different breast cancer classifications, providing insights for targeted therapeutic development.
Contents
- Dataset overview
- UMAP Visualization of Single-Cell RNA-Seq Data by Metadata Categories
- Major Cell Type Score and Annotation Mapping on UMAP
- Validation of Cell Type Subsets using Marker Gene Expression
- Epithelial Cell Copy Number Variation Analysis Across Breast Cancer Subtypes
- CNV-Informed UMAP Analysis of Breast Tissue Single-Cell Data
- Minor Cell Type Population Analysis Across Breast Cancer Subtypes and Normal Tissue
- T cell Subset Population Analysis Across Breast Cancer Subtypes and Normal Tissue
- T cell Subpopulation Dynamics Across Breast Cancer Subtypes
- Macrophage Subset Population Analysis Across Breast Cancer Subtypes and Normal Tissue
- Macrophage Subset Population Analysis in Breast Cancer Conditions
- Ploidy Distribution in Epithelial Cells Across Breast Cancer Subtypes and Normal Tissue
- Cell-Cell Interaction Analysis Across Breast Cancer Subtypes and Normal Tissue
- Cell-Cell Interaction Analysis of Immune Checkpoint and Cell Cycle Pathway Genes in Breast Cancer Subtypes
- Condition-Specific Cell-Cell Interaction Patterns in Breast Cancer Subtypes
- Epithelial Cell Surfaceome Marker Expression Across Breast Cancer Subtypes
- Macrophage Condition-Specific Surfaceome Markers in Breast Cancer
- Fibroblast Condition-Specific Surfaceome Markers in Breast Cancer Subtypes
- CD4+ T cell Marker Expression in Breast Cancer Subtypes
- Differential Expression of Cell Cycle Genes in Epithelial Cells Across Breast Cancer Subtypes
- Gene Ontology (GSA) Analysis of Epithelial Cells Across Breast Cancer Conditions
- Gene Set Enrichment Analysis (GSEA) Across Breast Cancer Cell Types and Conditions
- Discussion
- Query List
0. Dataset overview
데이터셋 요약:
- 이 데이터셋은 85,449개의 단일 세포와 26,440개의 유전자를 포함하는 단일세포 RNA 시퀀싱(scRNA-seq) 데이터입니다.
- 종은 인간(human)이며, 조직은 유방(Breast)입니다.
- 주요 조건(conditions)으로는 Normal, TNBC, HER2+, ER+가 있습니다.
- 세포 유형은 major, minor, subset 수준으로 분류되어 있으며, 주요 세포 유형(celltype_major)은 Epithelial cell, Stromal cell, Endothelial cell, T cell, Myeloid cell, B cell, Mast cell 등입니다.
- 종양 기원 세포는 Epithelial cell로 확인되었습니다.
- 세포 배수성(ploidy) 정보는 Diploid, Aneuploid, Unclear로 구분되어 제공됩니다.
- CNV(Copy Number Variation) 추정치가 사용 가능하며, CNV heatmap 플로팅 도구가 제공됩니다.
포함된 전처리 및 분석 결과:
- AnnData의 obs 컬럼에는 환자 정보, 조건, 세포 유형, CNV 예측(copykat_pred, scevan_pred), 플로이드 점수 등 다양한 세포 메타데이터가 포함되어 있습니다.
- var 컬럼에는 유전자 관련 정보와 염색체 밴드(cytogenetic_band)가 있습니다.
- 다음 분석 결과가 uns 필드에 미리 계산되어 저장되어 있습니다:
- CCI: 세포-세포 상호작용 (CellPhoneDB) 결과 (조건별 및 샘플별).
- DEG: 차등 발현 유전자 (Differential Expression Gene) 결과 (세포 유형별).
- GSEA: 유전자 세트 농축 분석 (Gene Set Enrichment Analysis) 결과 (세포 유형별).
- GSA_up: 유전자 온톨로지(GO) 분석 결과 (세포 유형별).
- DEG_vs_ref, GSEA_vs_ref, GSA_vs_ref_up와 같이 'Normal' 조건을 참조하여 계산된 결과도 포함되어 있습니다.
1. UMAP Visualization of Single-Cell RNA-Seq Data by Metadata Categories
[Analysis Visualization Results]...
Analysis Overview
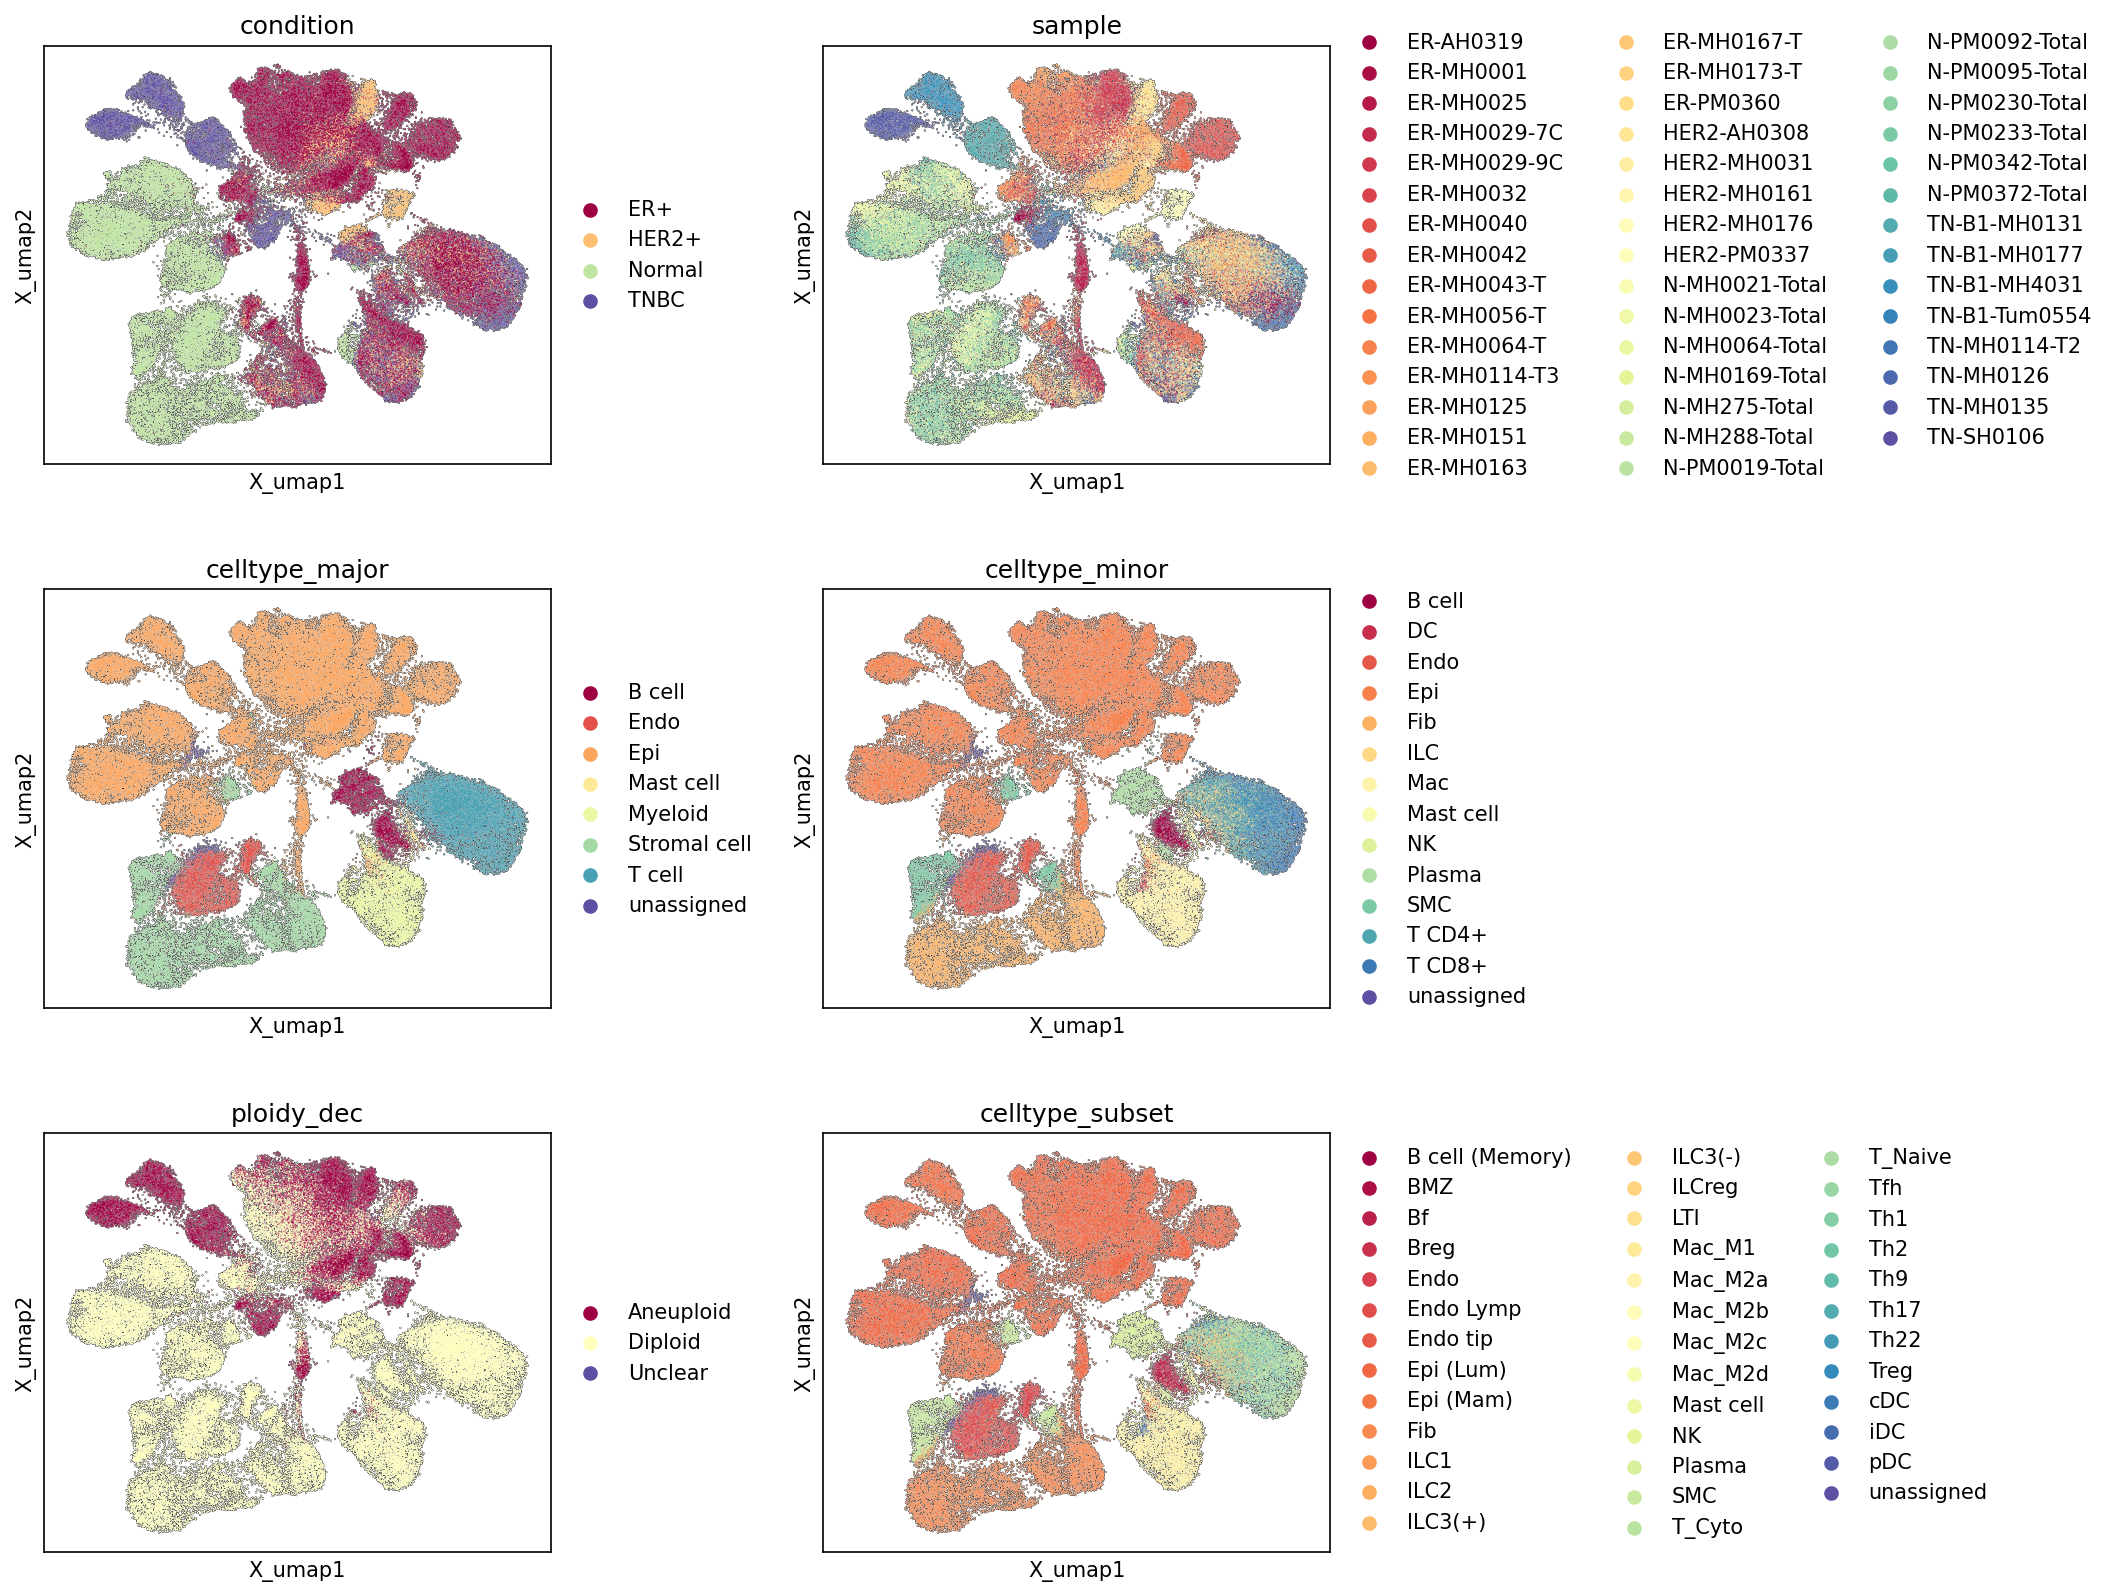
This analysis presents a series of Uniform Manifold Approximation and Projection (UMAP) plots, visualizing the global transcriptional landscape of 85,449 single cells derived from breast tissue. Each UMAP projection is colored by a specific metadata category (condition, sample, major cell type, minor cell type, ploidy status, and cell type subset) to assess data structure, cell identity, and the distribution of biological and technical variables across the dataset. These visualizations are critical for evaluating the quality of the embedding, confirming cell type annotations, and understanding the overall heterogeneity and relationships within the dataset, particularly in the context of breast cancer.
Visual Summary
Condition UMAP
The UMAP colored by condition (Normal, TNBC, HER2+, ER+) shows clear separation of the 'Normal' cells (light green) into distinct clusters, primarily occupying the left and bottom-left regions of the UMAP space. The tumor conditions (ER+, HER2+, TNBC) show significant overlap but also form distinct regions. 'ER+' (red) cells largely populate the upper-left and central areas, while 'HER2+' (light yellow) cells are more distributed but also contribute to the central-upper clusters. 'TNBC' (dark blue) cells appear less prominent in distinct large clusters and show some mixing, particularly with other tumor conditions. This suggests that while normal tissue is transcriptionally distinct, there is considerable transcriptional similarity or overlap among different breast cancer subtypes in the aggregated cell population.
Sample UMAP
The UMAP colored by sample reveals that cells from individual samples generally cluster together, indicating sample-specific transcriptional profiles. While there is some mixing, many distinct clusters are dominated by cells from a single or a few samples. This indicates potential sample-specific effects or true biological variability across patients. The 'Normal' samples (e.g., N-PM0092-Total, N-PM0095-Total, etc., in various shades of green) tend to cluster distinctly from tumor samples, consistent with the 'condition' UMAP. Within tumor conditions, cells from different samples often co-locate in shared regions, suggesting shared biological characteristics among different patients of the same or similar tumor subtype, but also distinct "sub-clusters" which could represent unique patient-specific features or subtle batch effects.
Celltype_major UMAP
The celltype_major UMAP demonstrates good separation of the major cell types into well-defined clusters. 'Epithelial cell' (orange) forms the largest and most diffuse cluster, occupying a significant central and upper portion of the UMAP, consistent with its inferred role as the tumor-origin cell type and its expected heterogeneity. 'Stromal cell' (light green) forms distinct clusters, largely adjacent to the epithelial cell clusters. Immune cells, including 'T cell' (cyan), 'Myeloid cell' (light yellow), 'B cell' (dark red), and 'Mast cell' (pink), form their own coherent, smaller clusters, often distinct from the epithelial and stromal compartments. 'Endothelial cell' (red-orange) also forms a clear, compact cluster. The separation indicates robust cell type identification at the major level.
Celltype_minor UMAP
At the celltype_minor level, the UMAP further resolves the major cell type clusters into finer subpopulations. For instance, 'Epithelial cell' (orange) remains a dominant population, but within it, more subtle variations might exist. Immune cell types like 'T cell CD4+' (dark blue), 'T cell CD8+' (blue), 'Macrophage' (light yellow), 'Fibroblast' (light orange), 'Endothelial cell' (red-orange), 'Plasma cell' (light green), and 'Smooth muscle cell' (cyan) show distinct, often compact clusters, indicating successful resolution of these cell identities. 'unassigned' cells (dark purple) are sparsely distributed, suggesting that most cells have been confidently assigned a cell type.
Ploidy_dec UMAP
The ploidy_dec UMAP clearly distinguishes between 'Diploid' (light yellow) and 'Aneuploid' (dark red) cells. The 'Aneuploid' cells predominantly cluster within the large 'Epithelial cell' regions observed in the cell type UMAPs, particularly in the central and upper parts of the embedding. This strong co-localization is highly suggestive of these aneuploid cells being the tumor epithelial cells. 'Diploid' cells are widely distributed across the UMAP, encompassing all non-tumor cell types (stromal, immune, endothelial) and likely normal epithelial cells. 'Unclear' (dark blue) cells are a very small population and are scattered.
Celltype_subset UMAP
The celltype_subset UMAP provides the highest resolution of cell identities. It reveals numerous fine-grained clusters, further subdividing the celltype_minor populations. For instance, different macrophage subtypes (e.g., 'Mac_M1', 'Mac_M2A', 'Mac_M2B', 'Mac_M2C', 'Mac_M2D'), T cell subsets (e.g., 'T_Naive', 'T_Cyto', 'Treg', 'Th1', 'Th2', 'Th17'), and epithelial cell subtypes (e.g., 'Epi (Lum)', 'Epi (Mam)') are identifiable as distinct small clusters or sub-regions. This level of detail confirms the extensive heterogeneity within the breast tissue and tumor microenvironment, further validating the cell type annotation pipeline.
Biological Interpretation
The UMAP visualizations provide crucial insights into the cellular composition and disease-associated changes in breast cancer.
- Tumor vs. Normal Segregation: The distinct clustering of 'Normal' condition cells from the breast cancer subtypes (ER+, HER2+, TNBC) highlights fundamental transcriptional differences between healthy and cancerous tissues. This suggests that the gene expression profiles are sufficiently altered in cancer to allow for clear separation.
- Heterogeneity of Breast Cancer Subtypes: While 'Normal' cells form a distinct block, the tumor subtypes show considerable overlap, indicating shared biological programs or cellular components across different breast cancer molecular classifications. However, the presence of some subtype-specific regions implies unique molecular characteristics that differentiate ER+, HER2+, and TNBC cells, even when viewed globally.
- Concordance of Ploidy with Tumor Identity: The strong co-localization of 'Aneuploid' cells with the dominant 'Epithelial cell' clusters, especially in regions enriched for tumor conditions, robustly supports the identification of these epithelial cells as the primary tumor cells. Aneuploidy is a hallmark of cancer, and its specific association with epithelial cells aligns with the known origin of most breast carcinomas. Normal epithelial cells and all other stromal and immune cells are predominantly diploid.
- Robust Cell Type Annotation: The hierarchical separation of cell types from major to minor and subset levels, with distinct and coherent clusters, indicates a high quality of cell type annotation. This robust annotation is fundamental for downstream analyses such as differential gene expression, pathway analysis, and cell-cell interaction studies, ensuring that these analyses are performed on biologically meaningful cell populations.
- Complex Tumor Microenvironment: The detailed resolution into numerous immune and stromal cell subsets (e.g., various macrophage polarizations, T cell effector states, fibroblast subtypes) underscores the complexity and heterogeneity of the breast tumor microenvironment. Understanding the precise composition and spatial organization of these cell types is critical for dissecting tumor progression and therapeutic response.
Annotation Notes
- The UMAPs demonstrate generally high quality clustering, with distinct biological populations forming coherent groups, supporting the robustness of the dimensionality reduction and cell annotation.
- The minor presence of 'unassigned' cells, particularly in less populated regions or at the boundaries of larger clusters, suggests that the majority of cells have been confidently annotated. Any 'unassigned' cells could represent rare cell types or cells with ambiguous transcriptional profiles that warrant further investigation.
- While individual samples do show some clustering, there is also considerable mixing of cells from different samples within the same condition and cell type clusters. This suggests that biological signals, such as condition and cell type, largely dominate over strong technical batch effects. However, subtle sample-specific effects contributing to heterogeneity within biological clusters cannot be entirely ruled out without further batch effect specific analysis.
- The diffuse nature of the 'Epithelial cell' cluster and its various subsets across the UMAP suggests high transcriptional heterogeneity within this population, which is expected for tumor cells that undergo clonal evolution and exhibit diverse phenotypes.
2. Major Cell Type Score and Annotation Mapping on UMAP
[Analysis Visualization Results]...
Analysis Overview
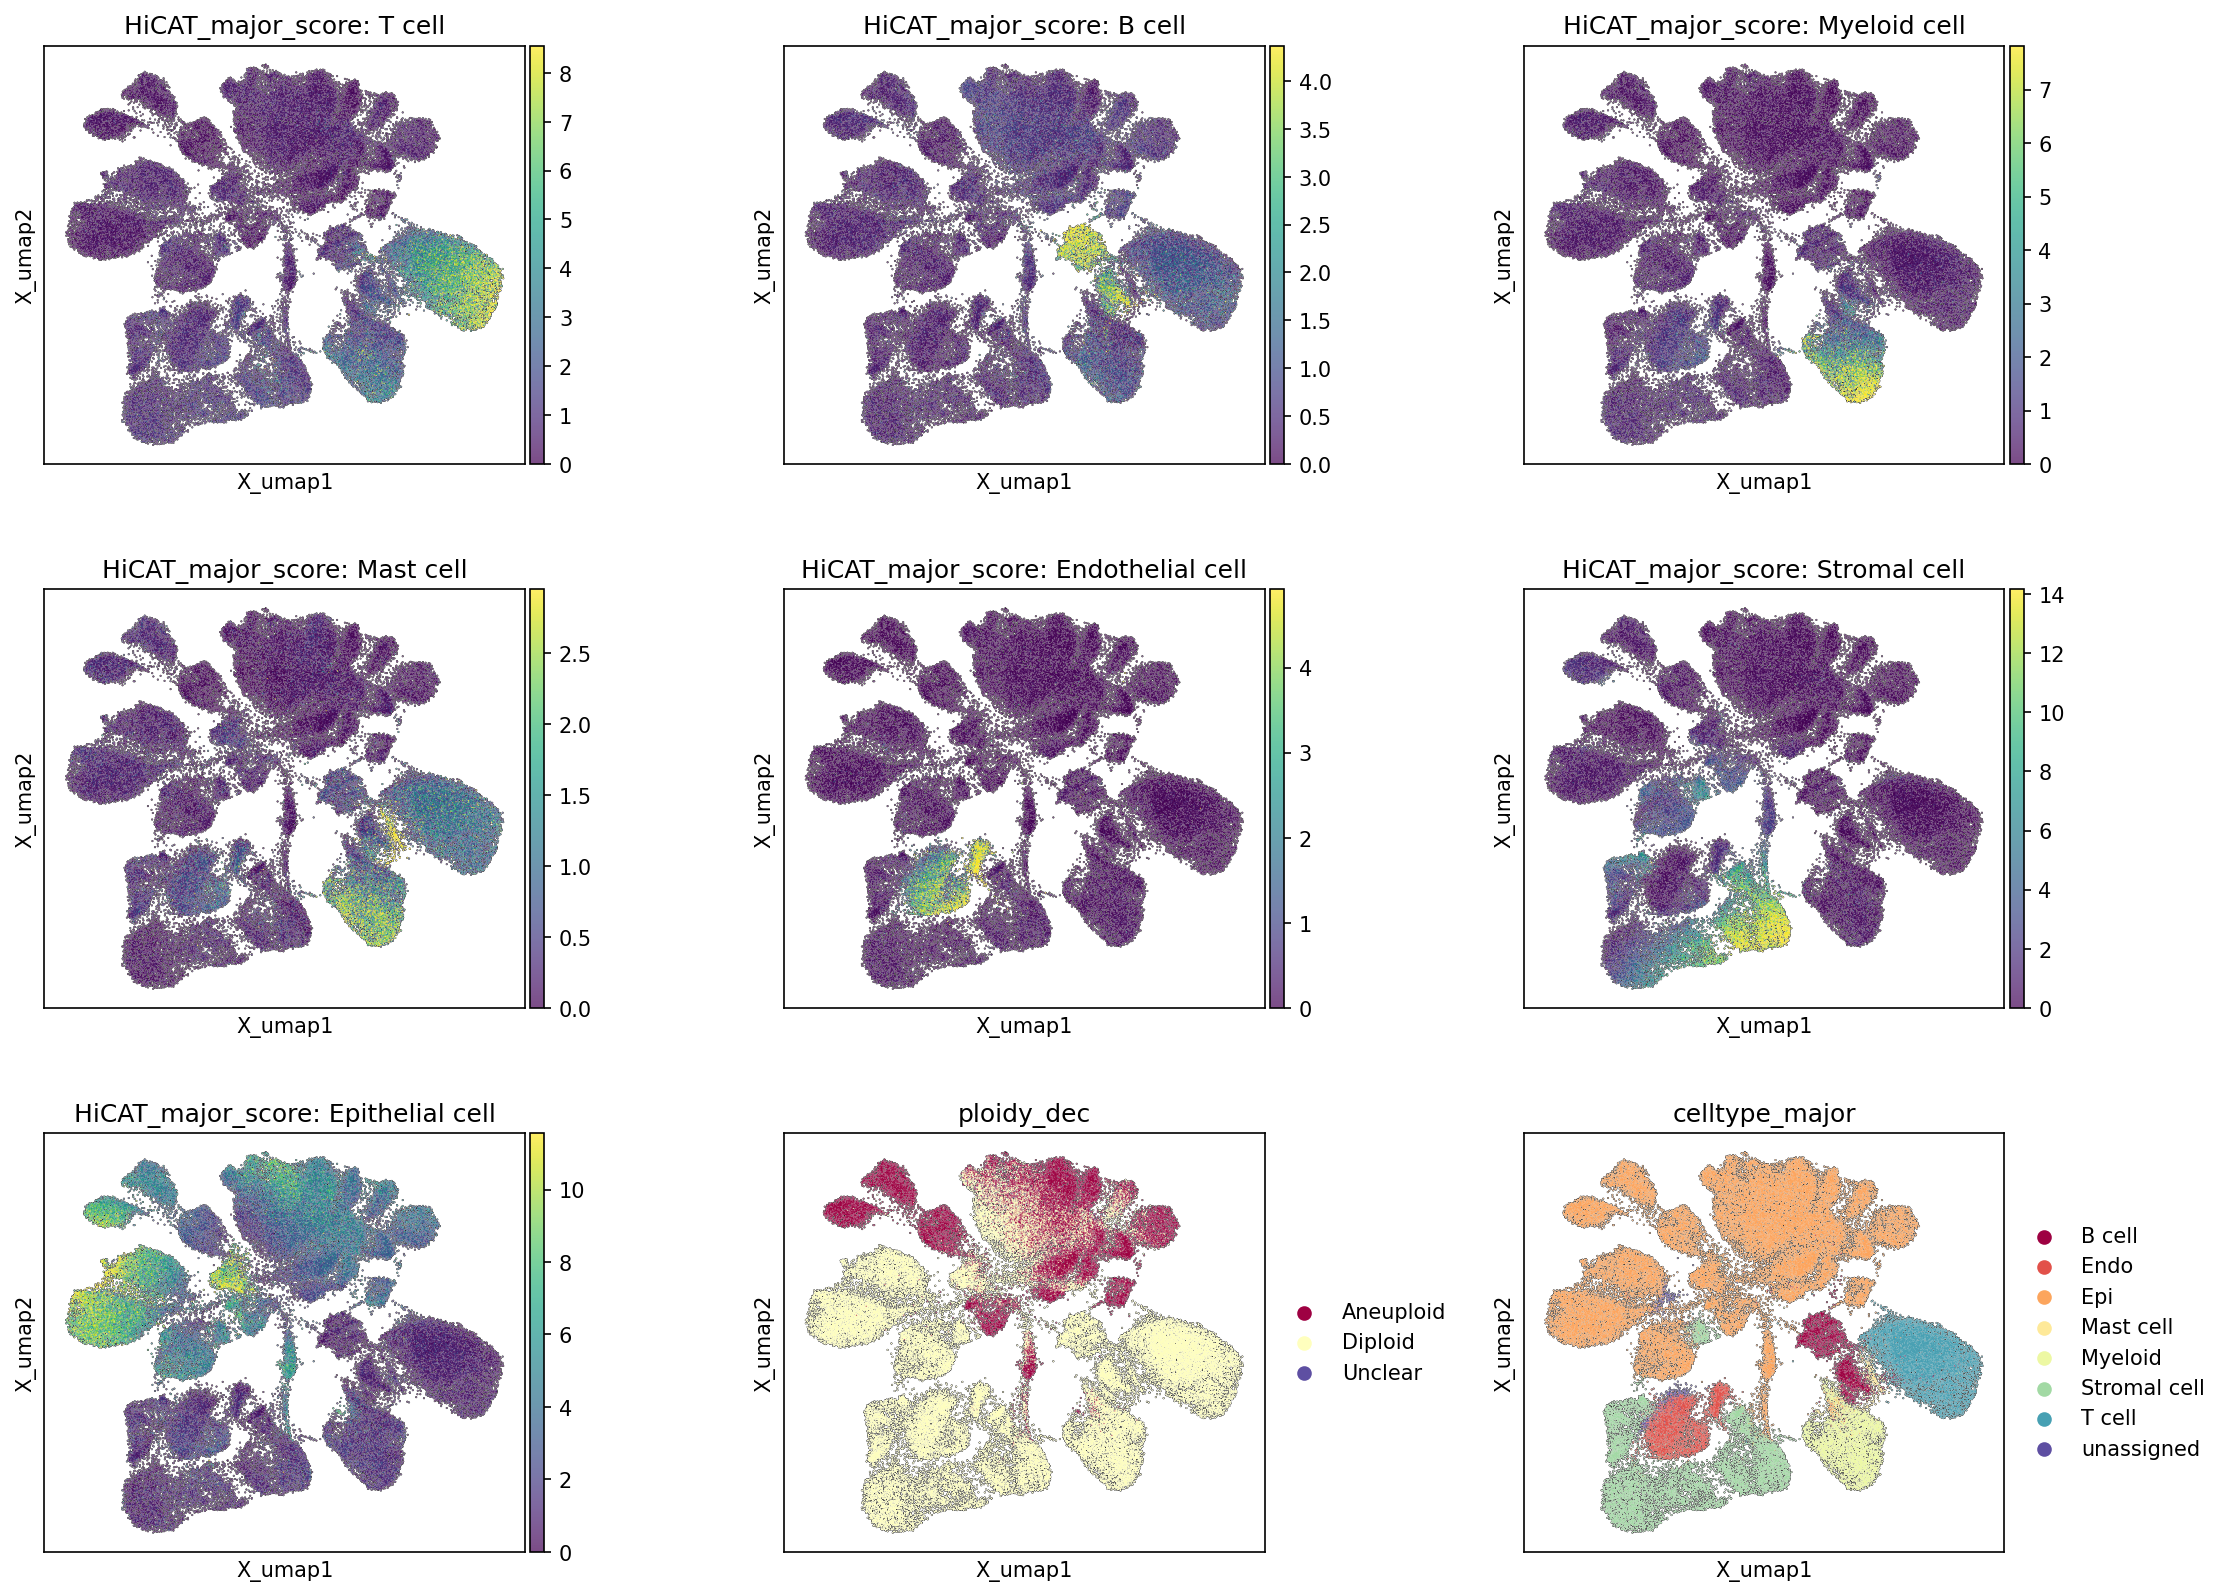
This analysis presents UMAP embeddings of single-cell RNA-seq data from breast tissue, visualizing the distribution of major cell type scores, ploidy status, and the final major cell type assignments. These plots serve to validate the consistency of cell type identification and to highlight the genomic characteristics (ploidy) of different cell populations within the dataset.
Visual Summary
The UMAP visualizations reveal a complex and heterogeneous cellular landscape, characteristic of breast tissue, particularly in the context of cancer.
- Major Cell Type Scores (HiCAT_major_score plots): Each major cell type (T cell, B cell, Myeloid cell, Mast cell, Endothelial cell, Stromal cell, Epithelial cell) shows distinct regions of high scores on the UMAP. This indicates that cells belonging to a specific major type tend to cluster together, possessing unique transcriptional profiles that differentiate them from other cell types. For instance, high "HiCAT_major_score: Epithelial cell" is concentrated in the upper-left and central regions, while high "HiCAT_major_score: T cell" is largely confined to a distinct cluster on the far right.
- Ploidy Status (ploidy_dec plot): The plot for ploidy_dec shows a clear segregation of aneuploid (red) and diploid (yellow) cells. Aneuploid cells are predominantly localized to specific clusters, most notably the large cluster in the upper-left and some central regions. Diploid cells are widely distributed across the remaining clusters, suggesting they constitute the majority of non-malignant cell populations. Cells labeled "Unclear" (dark blue) are sparse.
- Final Major Cell Type Assignment (celltype_major plot): This plot provides the final major cell type labels. Crucially, the spatial distribution of each assigned major cell type (e.g., Epithelial cell, T cell, Stromal cell) on the UMAP corresponds almost perfectly with the high-score regions observed in their respective HiCAT_major_score plots. For example, the orange cluster labeled "Epithelial cell" in the celltype_major plot precisely matches the areas with high "HiCAT_major_score: Epithelial cell."
Biological Interpretation
The consistent clustering and scoring observed across these UMAPs provide strong support for the robustness and accuracy of the major cell type annotations.
- Cellular Heterogeneity and Identity: The clear spatial separation of different major cell types on the UMAP reflects their distinct gene expression programs and functional identities within the breast tissue microenvironment. This heterogeneity is expected in a tissue comprising various resident cell types, immune infiltrates, and potentially malignant cells.
- Confirmation of Cell Type Annotation Quality: The high congruence between the calculated HiCAT major cell type scores and the final celltype_major assignments validates the accuracy of the cell type annotation process. This robust identification of major cell populations is foundational for subsequent differential expression, pathway, and cell-cell interaction analyses.
- Identification of Putative Tumor Cells: Given the inferred breast cancer context and the resolved tumor-origin cell type being "Epithelial cell," the co-localization of aneuploid cells (red in ploidy_dec) predominantly within the major epithelial cell clusters (orange in celltype_major) is a critical finding. This strongly suggests that these aneuploid epithelial cells represent the malignant population in the tumor. Aneuploidy is a hallmark of cancer, indicating genomic instability and often associated with tumor progression [PubMed search: aneuploidy cancer biomarker].
- Tumor Microenvironment Composition: The presence of distinct clusters for T cells, B cells, Myeloid cells, Endothelial cells, and Stromal cells, which are largely diploid, represents the diverse non-malignant components of the tumor microenvironment (TME) or normal breast tissue. These cells play crucial roles in tumor progression, immune response, and therapeutic efficacy [PubMed search: tumor microenvironment breast cancer].
Annotation Notes
The UMAP plots demonstrate excellent concordance between the computationally derived major cell type scores and the final assigned celltype_major labels. This indicates a high quality of cell clustering and annotation at the major cell type level. Furthermore, the distinct localization of aneuploid cells primarily within the epithelial compartment provides strong biological validation for the identification of potential tumor cells. The distributions observed are highly consistent with the known cellular composition and genomic alterations found in breast cancer.
3. Validation of Cell Type Subsets using Marker Gene Expression
[Analysis Visualization Results]...
Analysis Overview
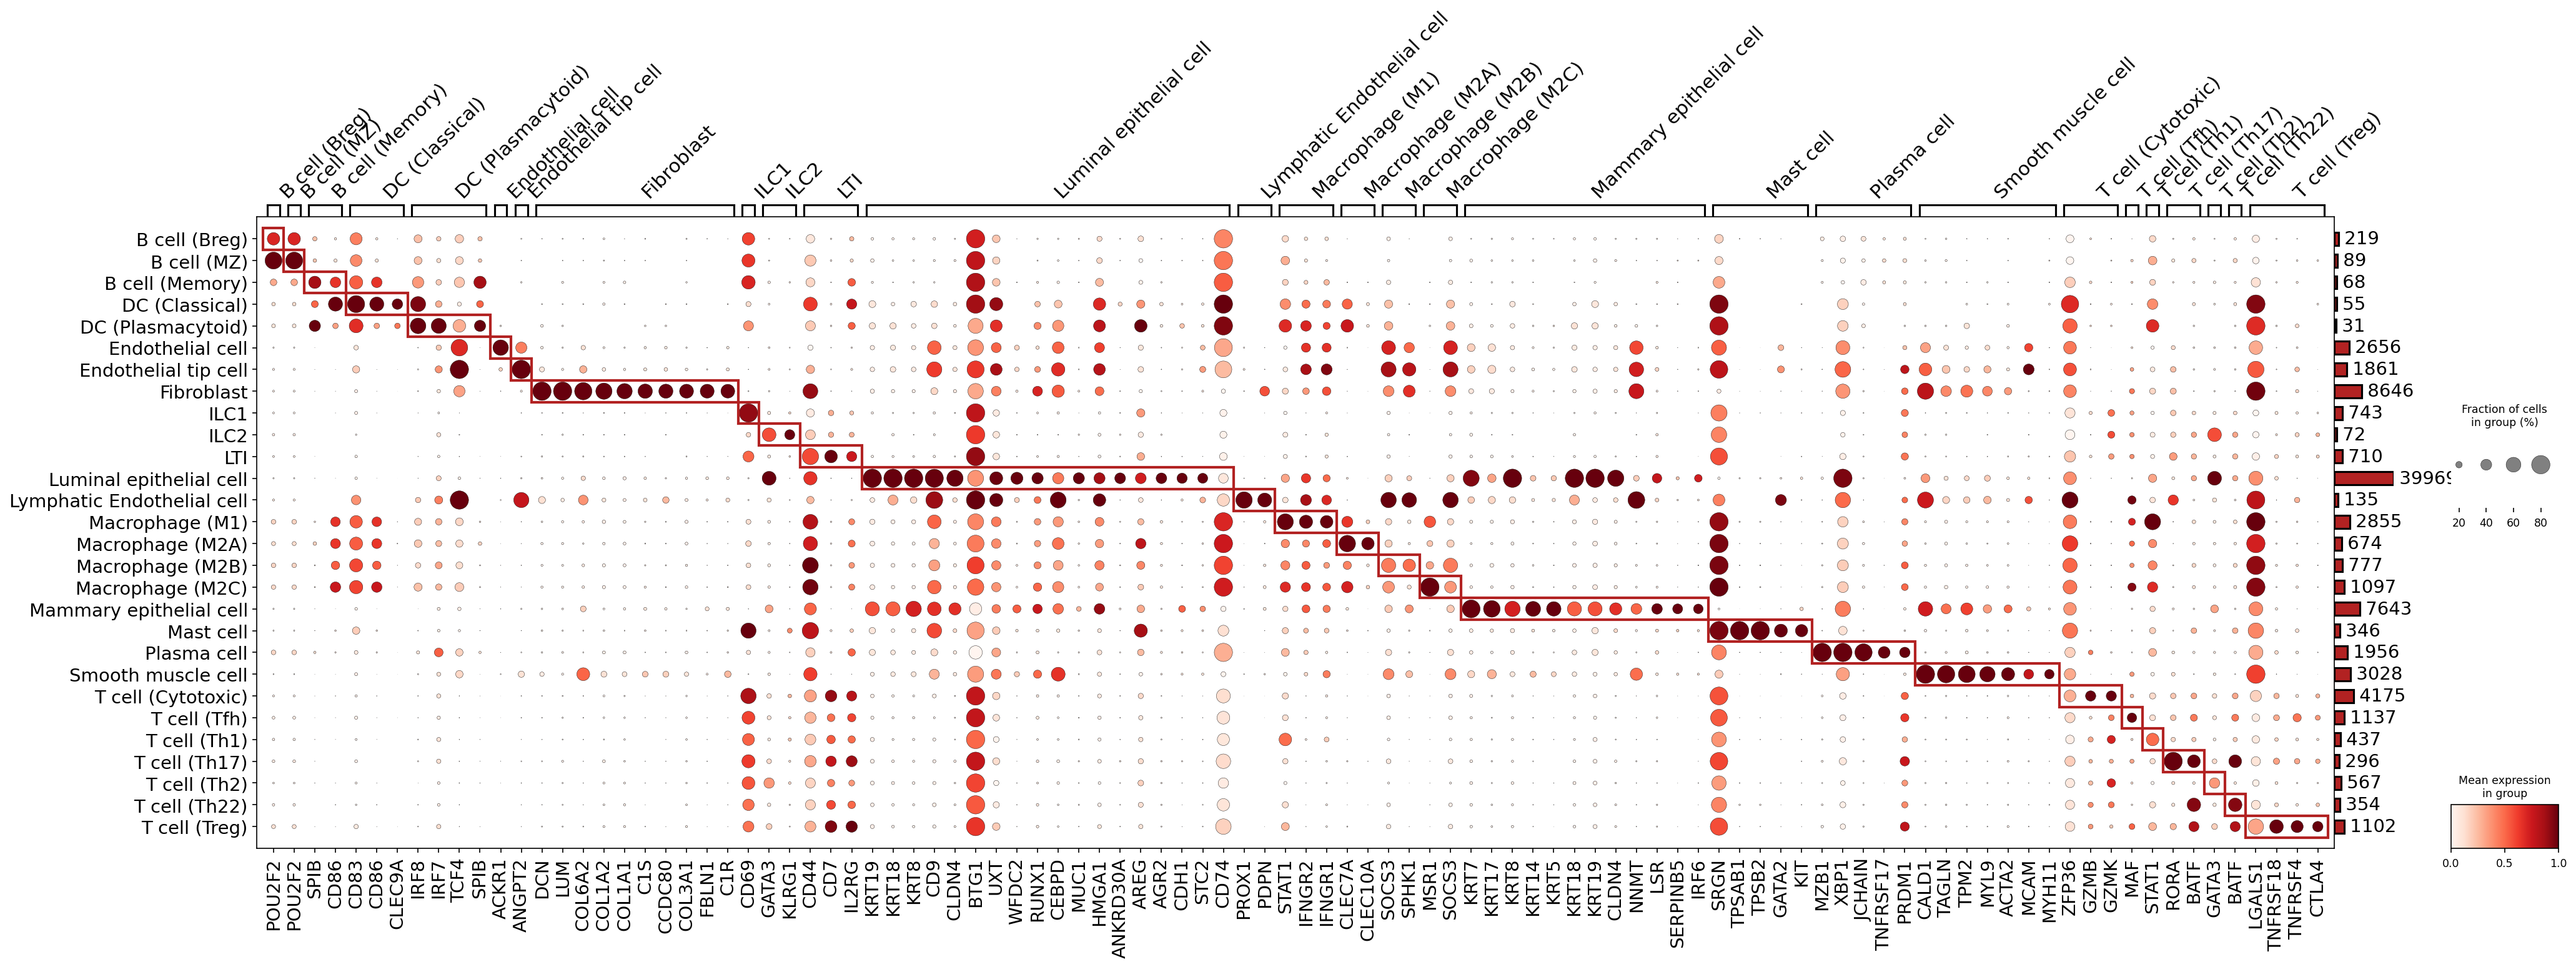
This analysis presents a marker expression dot plot generated from single-cell RNA-seq data, visualizing the expression levels and prevalence of selected marker genes across various celltype_subset annotations. The primary objective is to evaluate and confirm the fidelity of these cell type subset assignments based on their distinctive gene expression profiles. The plot displays genes identified as markers (X-axis) against the assigned celltype_subset categories (Y-axis). The size of each dot represents the fraction of cells within a group expressing a given gene, while the color intensity indicates the mean expression level of that gene within the group. Red boxes are used to highlight clusters of markers that are highly specific to particular cell types.
Visual Summary
The dot plot clearly shows distinct and often highly specific expression patterns for numerous marker genes across the different celltype_subset categories. Most cell subsets display a unique signature of elevated expression for a defined set of genes, indicated by large, darkly colored dots.
- Immune Cell Subsets: B cell subsets (Breg, MZ, Memory), DC subsets (Classical, Plasmacytoid), Macrophage subsets (M1, M2A, M2B, M2C, M2D), Mast cells, Plasma cells, and various T cell subsets (Cytotoxic, Tfh, Th1, Th17, Th2, Th22, Treg) exhibit characteristic marker profiles. For instance, IRF7 is highly specific to DC (Plasmacytoid), and GZMB/GZMK are potent markers for T cell (Cytotoxic).
- Stromal and Endothelial Cells: Fibroblast, Smooth muscle cell, Endothelial cell, Endothelial tip cell, and Lymphatic Endothelial cell populations also show clear and specific marker expression. PROX1 is highly specific to Lymphatic Endothelial cell, and ACTA2 is a strong marker for Smooth muscle cell.
- Epithelial Cells: Mammary epithelial cell and Luminal epithelial cell demonstrate well-differentiated marker profiles, with distinct sets of cytokeratins and other epithelial-specific genes.
- Specificity and Overlap: While many markers are highly specific to a single celltype_subset (e.g., KIT in Mast cells, PRDM1 in Plasma cells), some genes exhibit expression across related cell types or functional states (e.g., GATA3 in ILC2 and T cell (Th2)). The macrophage subsets, while distinct, show less pronounced specialization with the selected markers MSR1 and SOCS3 appearing broadly.
The presence of red boxes around clusters of highly expressed and specific markers for most cell types indicates a robust identification of these cell subsets based on their transcriptomic signatures.
Biological Interpretation
This marker expression analysis strongly supports the biological identity of the annotated celltype_subset populations within the breast tissue context (Normal and Breast Cancer subtypes).
- B Cell Lineage: The B cell subsets (Breg, MZ, Memory) are well-defined by general B cell-associated transcription factors like POU2F2 and SPIB, reinforcing their lymphoid identity.
- Dendritic Cell Diversity: DC (Classical) cells are characterized by maturation and antigen presentation markers like CD83, CD86, and the cDC1-specific CLEC9A, alongside IRF8 (a key cDC transcription factor). DC (Plasmacytoid) cells are distinctly marked by high expression of IRF7, a master regulator of type I interferon production, confirming their unique identity.
- IRF7 in pDCs: GeneCards: IRF7
- CLEC9A in cDC1: UniProt: CLEC9A
- Endothelial Cell Specialization: Endothelial cell and Endothelial tip cell express pan-endothelial markers such as ACKR1 and ANGPT2. Crucially, Lymphatic Endothelial cell is specifically identified by PROX1, a transcription factor essential for lymphatic vessel development, confirming its distinct lymphatic lineage.
- PROX1 in Lymphatic Endothelial cells: GeneCards: PROX1
- Fibroblast Markers: Fibroblasts are robustly identified by characteristic extracellular matrix (ECM) components and matrix-associated proteins like COL1A1, COL1A2, DCN, LUM, and FBLN1, consistent with their role in tissue structure and remodeling.
- Innate Lymphoid Cells (ILC): ILC2 shows strong expression of GATA3 and IL2RG, consistent with its role in type 2 immune responses. ILC1 shows STAT1 and IFNGR2. LTI (likely an ILC3 subset) is also identified.
- GATA3 in ILC2: GeneCards: GATA3
- Macrophage Heterogeneity: While general macrophage markers like MSR1 and SOCS3 are present, the specific M1/M2 subtypes exhibit more nuanced differences with the selected marker panel, suggesting a continuum or less pronounced polarization states within these categories based on these specific markers.
- Epithelial Cell Differentiation: The clear separation of Mammary epithelial cell (often basal-like) by KRT5, KRT14, and KRT17 and Luminal epithelial cell by KRT8, KRT18, KRT19, CDH1 (E-cadherin), and MUC1 provides strong evidence for the accurate annotation of these critical breast tissue components.
- Keratins in mammary epithelial cells: PubMed search: Keratin 5 14 mammary basal luminal
- Mast Cell Identity: Mast cell annotation is highly validated by the specific expression of KIT (CD117), TPSAB1, TPSB2 (tryptases), and GATA2, which are definitive markers for this lineage.
- KIT in Mast cells: UniProt: KIT
- Plasma Cell Signature: Plasma cell identity is strongly confirmed by the expression of genes such as MZB1, XBP1, JCHAIN, TNFRSF17 (BCMA), and PRDM1 (Blimp-1), which are essential for B cell differentiation into plasma cells and antibody production.
- PRDM1 in Plasma cells: GeneCards: PRDM1
- Smooth Muscle Cell Characterization: Smooth muscle cell populations are unequivocally identified by contractile apparatus proteins like ACTA2 (alpha-SMA), CALD1, TAGLN, TPM2, and MYL9.
- T Cell Subtype Resolution: The T cell subsets display distinct functional markers. T cell (Cytotoxic) cells show granzymes (GZMB, GZMK). T cell (Th17) cells are marked by RORC, a key transcription factor for Th17 development. T cell (Treg) cells express CTLA4 and LGALS1. The specific expression patterns observed for these functional markers validate the resolution of various T cell populations.
- RORC in Th17 cells: GeneCards: RORC
- CTLA4 in Tregs: UniProt: CTLA4
Annotation Notes
The marker expression dot plot serves as an effective quality control for the celltype_subset annotations. The high specificity and strong expression of known lineage-defining markers for the majority of the subsets provide confidence in the accuracy and resolution of the cell type assignments. The clear separation of epithelial and various immune and stromal cell types is particularly reassuring given the inferred breast cancer context where tumor-immune-stromal interactions are critical.
Minor overlaps in marker expression for some genes (e.g., GATA3 in ILC2 and Th2 cells, consistent with their shared developmental pathways and functions in type 2 immunity) or less distinct separation for macrophage subtypes with the current marker set are observed. This indicates areas where further investigation with additional or more specific markers, or functional assays, might be beneficial to fully resolve the precise identities or states of these more closely related cell populations. Overall, the current cell type annotations are well-supported by this marker gene expression analysis.
4. Epithelial Cell Copy Number Variation Analysis Across Breast Cancer Subtypes
[Analysis Visualization Results]...
Analysis Overview
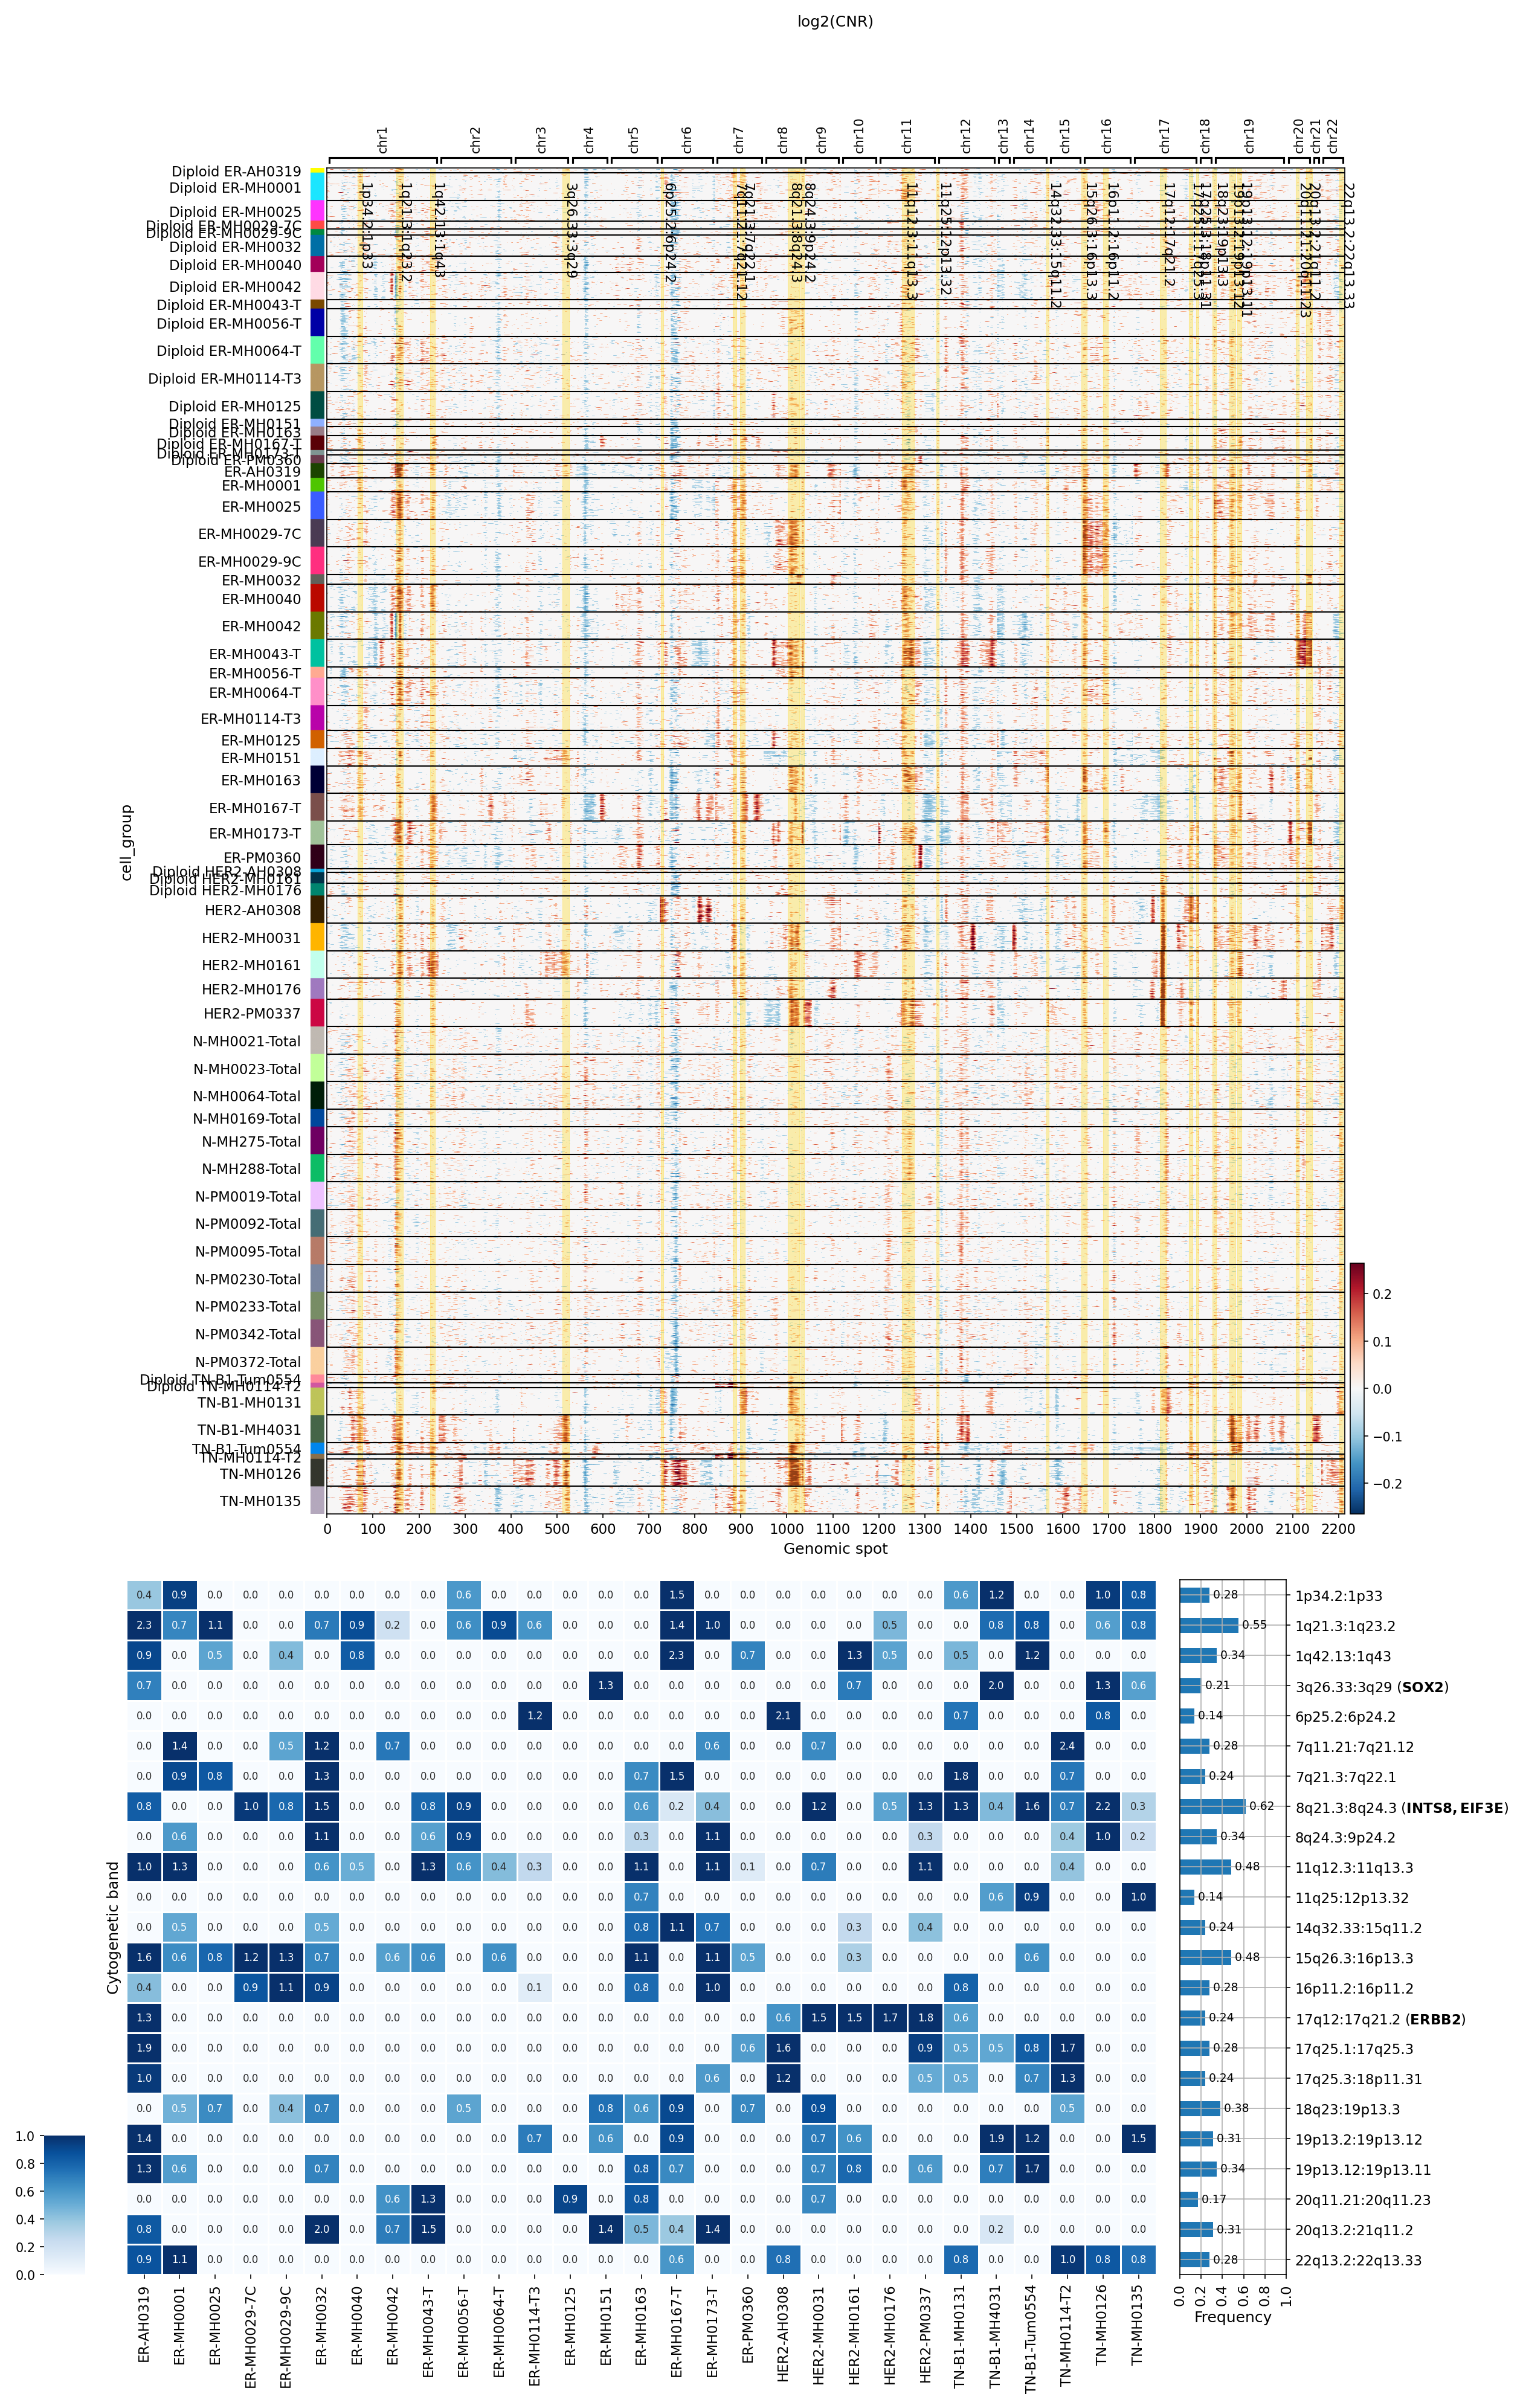
This analysis investigates copy number variations (CNVs) specifically within Epithelial cells, identified as the tumor-origin cell type, across various breast conditions (Normal, ER+, HER2+, TNBC). The objective was to visualize genomic amplifications and deletions in these cells, grouped by sample, and to identify regions with significantly amplified copy numbers. This helps to characterize the genomic landscape of epithelial cells in breast cancer and validate the tumor status and subtypes based on CNV patterns.
Visual Summary
Figure 1: Heatmap of Copy Number Log2 Ratio (log2(CNR)) for Epithelial Cells
The heatmap displays the estimated log2 ratio of copy numbers (log2(CNR)) across chromosomes for Epithelial cells, with samples grouped by cell_group (ploidy status and condition/sample ID). Red/brown indicates amplification (gain), and blue indicates deletion (loss).
- Normal Samples: Epithelial cells from 'Normal' samples (prefixed with 'N-' and 'Diploid N-') generally exhibit a relatively quiet genomic landscape, with few and scattered CNVs, consistent with a non-cancerous, diploid state.
- Cancer Subtypes: Epithelial cells from cancer conditions (ER+, HER2+, TNBC) show distinct and often widespread CNV patterns, reflecting the genomic instability characteristic of cancer.
- HER2+ Samples: Samples identified as HER2+ (e.g., HER2-MH0031, HER2-MH0161, HER2-MH0176) display prominent and consistent amplification on chromosome 17q, particularly in the 17q12 region. This is a hallmark of *ERBB2* gene amplification.
- ER+ Samples: ER+ samples (e.g., ER-MH0001, ER-MH0025, ER-MH0029-7C) show variable CNV patterns, often including gains on 1q and losses on other chromosomes. The Diploid ER- samples show fewer and less pronounced CNVs compared to their aneuploid counterparts within the ER+ group.
- TNBC Samples: Triple-negative breast cancer (TNBC) samples (e.g., TN-B1-MH0031, TN-MH0135) display complex and highly heterogeneous CNV profiles, with numerous amplifications and deletions scattered across the genome, consistent with the aggressive and genomically unstable nature of this subtype.
- Ploidy Status: There is a clear distinction between samples designated 'Diploid' and those without the 'Diploid' prefix (implicitly aneuploid or showing significant CNVs). Diploid samples, irrespective of condition, consistently show fewer and less intense CNVs compared to aneuploid samples, validating the ploidy assignments.
Figure 2: Summary of Significantly Amplified Copy Number Regions
This figure summarizes the frequency of significant copy number amplifications at the cytogenetic band level across the analyzed Epithelial cell samples. The heatmap indicates the level of amplification frequency in each sample for specific bands, and the bar plot on the right shows the overall frequency across all samples.
High-Frequency Amplifications:
- 17q12 (ERBB2): This region shows the highest frequency of amplification (approximately 0.46) across all samples and is particularly prominent in HER2+ samples. This band encompasses the *ERBB2* gene, a well-known oncogene in breast cancer.
- 1q21.3 (SOX2): Amplification at 1q21.3, which includes the *SOX2* gene, is also observed with a high frequency (approximately 0.34) and is present in several ER+, HER2+, and TNBC samples.
- 8q24.3 (EIF3B, INTS8): Another frequently amplified region is 8q24.3 (frequency ~0.37), which contains genes such as *EIF3B* and *INTS8*.
- Other regions like 1q42.13, 3q26.33, 6p25.2, 7p11.2, 7q21.3, 12q13.12, 12q15, 15q26.3, 16p11.2, 17q12, 17q25.3, 18q23, 19p13.3, 20q13.2, 22q13.2-3 are also frequently amplified, albeit at lower overall frequencies.
- Sample-Specific Patterns: While *ERBB2* amplification is predominantly linked to HER2+ samples, other amplifications (e.g., 1q21.3, 8q24.3) are seen across multiple samples and conditions, suggesting broader genomic changes or subtype-independent drivers.
Biological Interpretation
The CNV analysis of Epithelial cells provides critical insights into the genomic alterations driving breast cancer.
- Validation of Breast Cancer Subtypes: The observed amplification of 17q12, containing the *ERBB2* gene, specifically in HER2+ samples, strongly validates the classification of these samples and confirms the known biology of HER2-positive breast cancer. *ERBB2* amplification leads to overexpression of the HER2 protein, a key driver of tumor growth [1].
- Genomic Heterogeneity: The diverse and complex CNV patterns across ER+, HER2+, and TNBC samples highlight the significant genomic heterogeneity among breast cancer subtypes. TNBC, in particular, shows widespread genomic instability, consistent with its aggressive phenotype.
- Role of Ploidy: The clear visual distinction in CNV burden between 'Diploid' and 'Aneuploid' samples supports the robustness of the ploidy assessment. Cancer cells often exhibit aneuploidy, which contributes to tumor evolution and drug resistance [2].
- Potential Oncogenic Drivers:
- The frequent amplification of 1q21.3, harboring *SOX2*, is notable. *SOX2* is a transcription factor involved in maintaining pluripotency and has been implicated as an oncogene in various cancers, including breast cancer, promoting tumor initiation and progression [3].
- Amplifications at 8q24.3, including *EIF3B* and *INTS8*, point towards other genomic regions that may harbor oncogenes or contribute to oncogenic pathways. *EIF3B* is part of the eukaryotic translation initiation factor 3 complex, which plays a role in protein synthesis and has been linked to cancer [4].
Clinical or Translational Implications
- Diagnostic and Prognostic Markers: The clear *ERBB2* amplification in HER2+ breast cancer serves as a crucial diagnostic marker for identifying patients who will benefit from HER2-targeted therapies. Other recurrent CNVs, such as those involving *SOX2* or 8q24.3, could be investigated as potential novel prognostic markers or indicators of disease aggressiveness.
- Therapeutic Targets: While *ERBB2* is a well-established therapeutic target, the identification of other frequently amplified regions suggests potential novel targets. For instance, if *SOX2* amplification is functionally significant in a subset of breast cancers, targeting SOX2 signaling or associated pathways could be a strategy.
- Understanding Tumor Evolution: The detailed CNV landscape provides insights into the genomic evolution of breast cancer, highlighting the genetic aberrations that contribute to different tumor phenotypes and responses to treatment. This information can inform future studies on resistance mechanisms or identification of vulnerabilities.
---
References:
- ERBB2 amplification: For information on *ERBB2* (HER2) and its role in breast cancer, refer to GeneCards: https://www.genecards.org/cgi-bin/carddisp.pl?gene=ERBB2
- Aneuploidy in cancer: For a general overview of aneuploidy and its implications in cancer, search PubMed: https://pubmed.ncbi.nlm.nih.gov/?term=aneuploidy+cancer
- SOX2 in cancer: For information on *SOX2* and its role in cancer, refer to GeneCards: https://www.genecards.org/cgi-bin/carddisp.pl?gene=SOX2
- EIF3B in cancer: For information on *EIF3B* and its potential role in cancer, refer to GeneCards: https://www.genecards.org/cgi-bin/carddisp.pl?gene=EIF3B
5. CNV-Informed UMAP Analysis of Breast Tissue Single-Cell Data
[Analysis Visualization Results]...
Analysis Overview
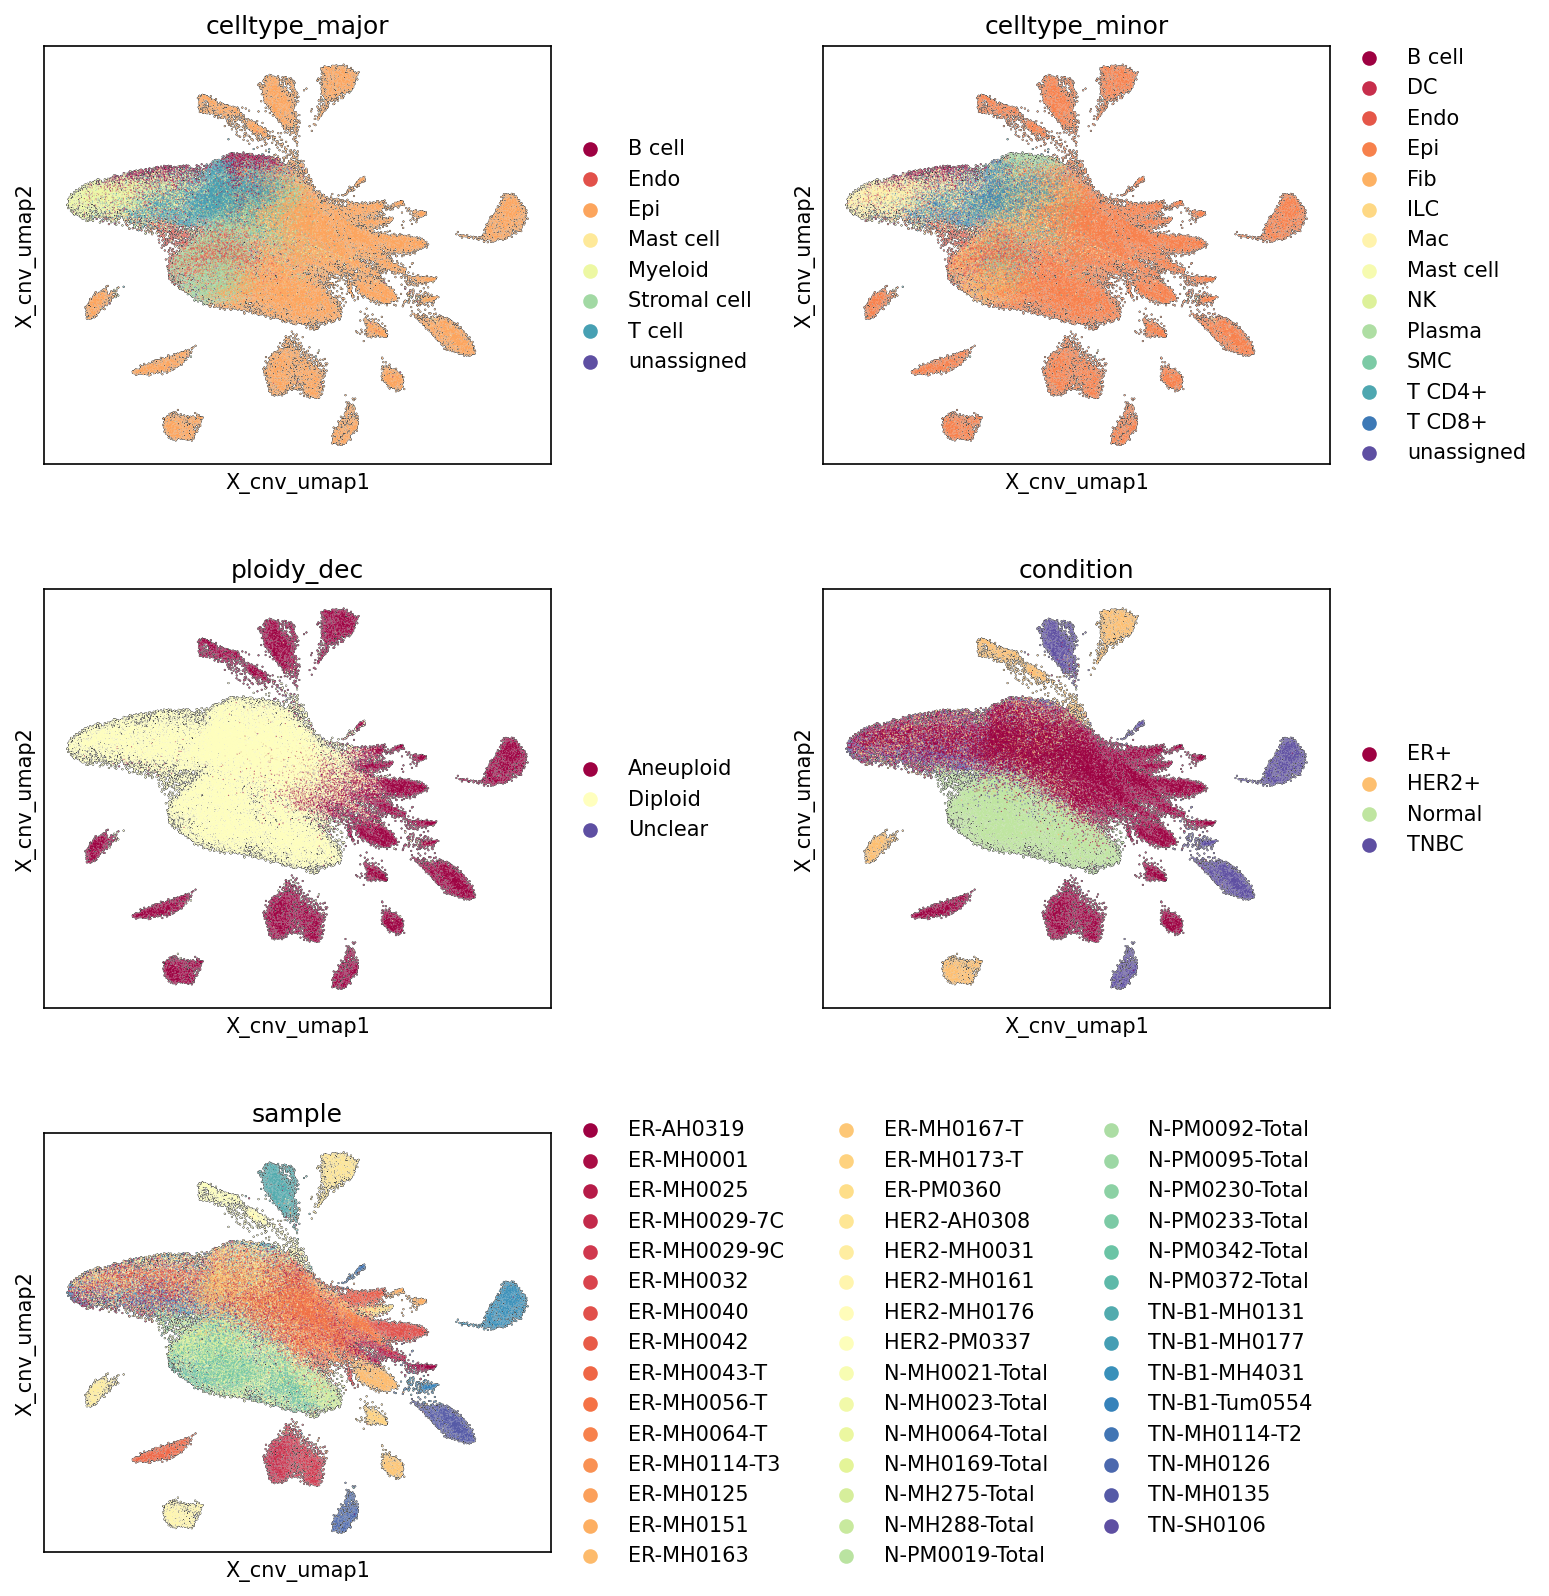
This analysis presents UMAP (Uniform Manifold Approximation and Projection) plots derived from single-cell RNA-seq data, specifically incorporating Copy Number Variation (CNV) estimates in the embedding calculation. These visualizations display the cellular landscape colored by various metadata features: major cell type, minor cell type, ploidy status, disease condition, and individual sample. The primary goal is to examine how cell identities, genomic stability (ploidy), and disease states organize in a dimensionality-reduced space informed by both gene expression and CNV, thereby assessing the quality of annotations and the underlying biological structure of the dataset.
Visual Summary
The UMAP plots reveal distinct patterns of cell distribution based on the colored annotations:
Cell Type Major and Minor:
- The celltype_major plot shows a large, central cluster predominantly composed of Epithelial cells (Epi, orange). Stromal cells (teal) and Endothelial cells (red) form distinct, albeit smaller, clusters, some of which appear intermingled with the main epithelial body or form peripheral groups. Immune cells (T cell, B cell, Myeloid cell, Mast cell - various shades of blue/purple/yellow) tend to form more diffuse clusters or satellite populations around the main epithelial mass, reflecting their distinct transcriptional profiles and potentially their spatial arrangement in the tissue.
- The celltype_minor plot provides a more granular view, reinforcing the separation of cell lineages. For instance, Fibroblasts (Fib, light green) are clearly delineated from Epithelial cells, and different immune cell subsets (e.g., T cell CD4+, T cell CD8+) also exhibit distinct, though sometimes overlapping, localizations within the immune cell clusters.
Ploidy Status (ploidy_dec):
- The ploidy_dec UMAP shows a striking separation. A large, central population is almost entirely composed of Diploid cells (yellow), forming the primary core of the UMAP embedding. In contrast, Aneuploid cells (maroon) form distinct, often smaller, clusters primarily localized at the periphery or as discrete satellite populations, particularly extending from the main epithelial cell body. This clear segregation suggests that CNV patterns are a dominant factor in shaping the UMAP, effectively separating cells based on their genomic integrity. The Unclear category (purple) is very minor and dispersed.
Condition:
- The condition UMAP highlights the distribution of samples from different breast cancer subtypes (ER+, HER2+, TNBC) and Normal tissue. Normal cells (light green) predominantly overlap with the large Diploid cluster observed in the ploidy_dec plot, forming a central, relatively cohesive population.
- Cancer conditions (ER+, HER2+, TNBC) show a more fragmented and distributed pattern. ER+ cells (maroon) constitute a significant portion of the main cluster, especially where aneuploid cells were observed. HER2+ (orange) and TNBC (dark blue) cells appear in more dispersed, often smaller, clusters, suggesting subtype-specific transcriptional or CNV landscapes that drive their separation. Critically, the cancer conditions heavily overlap with the Aneuploid cell populations.
Sample:
- The sample UMAP reveals significant sample-specific clustering, particularly within the cancer conditions. While Normal samples (various shades of green) generally mix well within the central Diploid cluster, cancer samples (ER+, HER2+, TNBC in various colors) often form distinct clusters or sub-clusters. This indicates that while shared disease features exist, there are also substantial patient-to-patient differences in cellular composition and/or CNV profiles that influence the embedding structure. Some of these sample-specific clusters align with the Aneuploid regions, suggesting individual tumor heterogeneity.
Biological Interpretation
The CNV-informed UMAP embeddings provide crucial insights into the cellular heterogeneity and disease pathology in breast cancer:
- Genomic Instability as a Primary Driver of Cell Clustering: The stark separation between Diploid and Aneuploid cells confirms that CNV status is a fundamental biological distinction influencing the global transcriptional and genomic landscape of cells. This is highly relevant in cancer, where aneuploidy is a hallmark of malignancy. The fact that the ploidy_dec UMAP shows such clear separation validates the CNV estimation and integration into the embedding.
- Tumor Cells and Aneuploidy: Consistent with the inferred context of breast cancer, Aneuploid cells predominantly cluster with cells derived from ER+, HER2+, and TNBC conditions, and overlap extensively with Epithelial cells, which are the resolved tumor-origin cell type. This strong association reinforces the understanding that the Aneuploid populations represent the malignant epithelial cells within the breast tumors. Non-epithelial cell types (Stromal, Endothelial, Immune cells) are primarily Diploid, consistent with their role as components of the tumor microenvironment or normal tissue.
- Distinct Disease Subtype Signatures: The UMAP demonstrates that breast cancer subtypes (ER+, HER2+, TNBC) occupy distinct, albeit sometimes overlapping, regions of the embedding. This implies that beyond the general presence of aneuploidy, each subtype possesses unique molecular characteristics (gene expression driven by CNVs) that allow for their segregation in this CNV-informed space. Normal cells are clearly separated from tumor cells, forming a distinct healthy baseline.
- Cell Type Specificity and Tumor Microenvironment: The clustering of celltype_major and celltype_minor shows that even within the tumor-associated regions, the various stromal, endothelial, and immune cell types maintain their distinct identities. This indicates that their transcriptomic profiles are largely preserved, although their functional state might be altered in the tumor microenvironment (not directly visible in these UMAPs but implied by co-localization with tumor cells). The clear separation of immune cells from the main epithelial clusters suggests a robust identification of immune populations.
- Patient-Specific Heterogeneity: The notable sample-specific clustering, particularly within the cancer conditions, highlights the significant inter-patient variability inherent in breast cancer. While this could partly reflect technical batch effects if not properly accounted for during embedding, it more likely points to genuine biological differences in tumor evolution, microenvironmental composition, or specific CNV profiles unique to individual patients. This heterogeneity is a key consideration for understanding disease progression and treatment response.
Annotation Notes
- The clear separation of ploidy_dec and condition groups validates the quality of these annotations and their strong biological relevance within the dataset.
- The celltype_major and celltype_minor annotations show well-defined clusters, suggesting robust cell type identification. The degree of mixing between certain cell types (e.g., some immune cells around the epithelial cluster) is expected given the biological complexity of tissues and potential for continuous cell states.
- The UMAP projection, being informed by CNV, effectively separates cells based on genomic stability, providing a powerful initial view for distinguishing tumor cells from non-tumor cells and normal tissue from diseased states.
Clinical or Translational Implications
The ability to clearly distinguish aneuploid, tumor-associated epithelial cells from diploid, normal, and stromal cells in a CNV-informed embedding has several implications:
- Refined Tumor Cell Identification: This approach can improve the precision of identifying bona fide tumor cells, particularly in heterogeneous samples where tumor content might be low or confounded by stromal cell contamination.
- Understanding Tumor Heterogeneity: The distinct clustering of different breast cancer subtypes and individual patient samples underscores the importance of personalized approaches in breast cancer diagnosis and treatment. Identifying patient-specific CNV patterns could inform prognosis or response to targeted therapies.
- Tumor Microenvironment Analysis: The distinct clustering of immune and stromal cells within the context of tumor-associated aneuploidy allows for focused investigation into how the tumor microenvironment interacts with and is shaped by malignant cells, which is critical for developing immunotherapies or stroma-targeting drugs.
- Biomarker Discovery: The clear separation between normal and diseased states and between different cancer subtypes provides a robust foundation for identifying differentially expressed genes or pathways that drive these distinctions, potentially leading to novel diagnostic or prognostic biomarkers. GeneCards: Breast Cancer biomarkers
6. Minor Cell Type Population Analysis Across Breast Cancer Subtypes and Normal Tissue
[Analysis Visualization Results]...
Analysis Overview
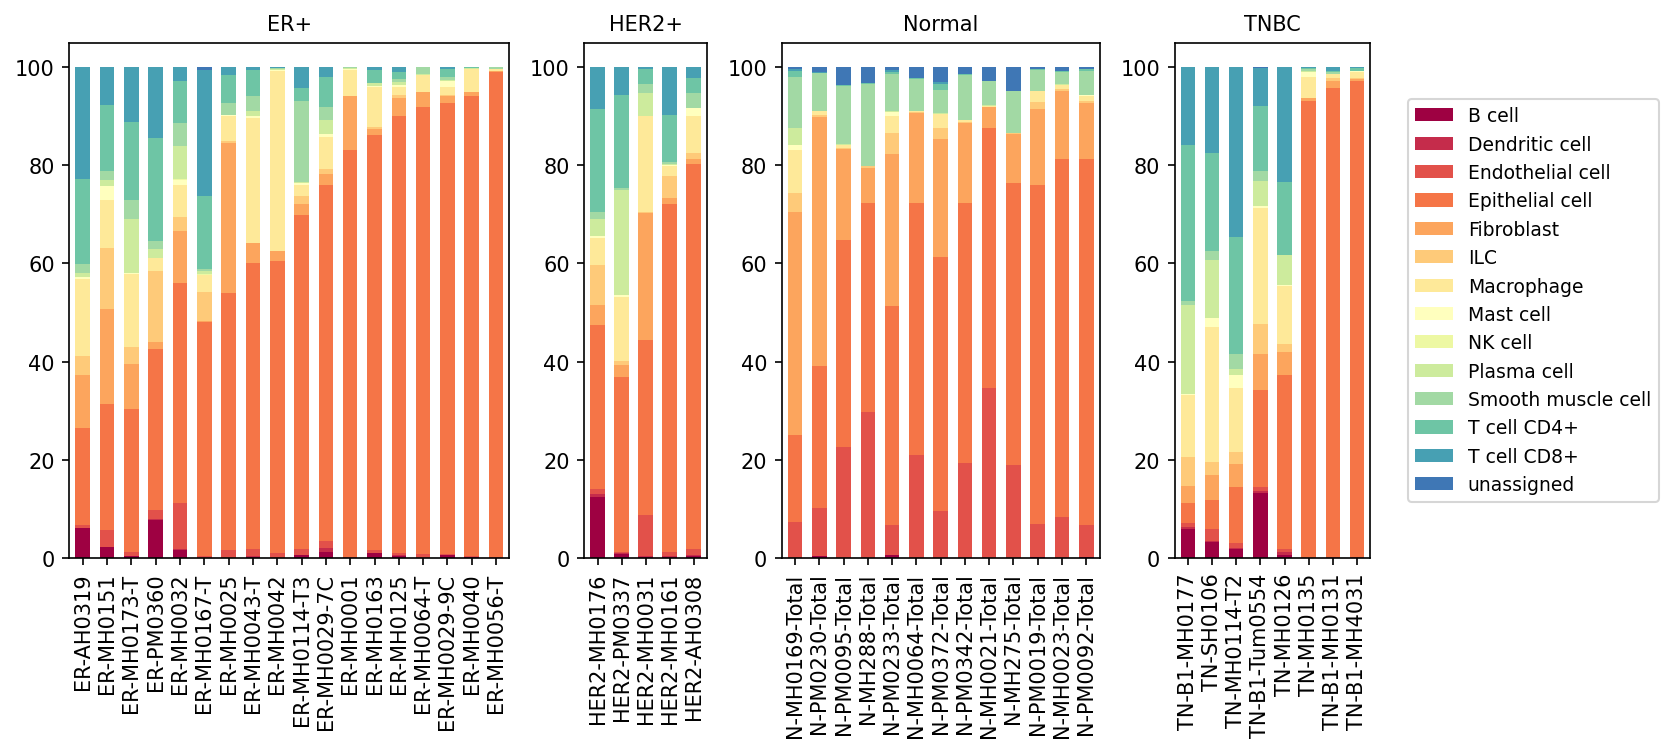
This analysis presents a population bar plot visualizing the relative proportions of minor cell types across individual samples, categorized by their respective conditions: ER+ breast cancer, HER2+ breast cancer, Triple-Negative Breast Cancer (TNBC), and Normal breast tissue. The purpose is to identify general trends and variations in cellular composition within the breast tissue microenvironment under different disease states.
Visual Summary
The stacked bar plots illustrate the percentage contribution of each minor cell type to the total cell population within each sample.
- Dominant Cell Type: Epithelial cells (orange) are the most abundant cell type across nearly all samples, particularly pronounced in tumor conditions (ER+, HER2+, TNBC). This is consistent with breast tissue largely comprising epithelial ducts and lobules, and carcinomas originating from epithelial cells.
- Normal Tissue Composition: Normal samples exhibit a diverse cellular composition, with a significant presence of Epithelial cells, along with notable contributions from Fibroblasts, Endothelial cells, Smooth muscle cells, and various immune cell types such as T cells (CD4+ and CD8+), Macrophages, and Plasma cells.
- Tumor vs. Normal Differences: In tumor conditions, many samples show a higher relative proportion of Epithelial cells compared to Normal tissue, often dominating the cell composition to a greater extent. Concurrently, the relative proportions of other stromal and immune cell types can be reduced in highly epithelial-rich tumor samples.
Heterogeneity Across Cancer Subtypes:
- ER+ and HER2+: These subtypes often display samples with a very high proportion of Epithelial cells, suggesting a dense tumor cell population. Immune cell infiltration, while present, appears to be lower in some samples compared to others.
- TNBC: Several TNBC samples exhibit a relatively higher proportion of immune cells, notably T cells (both CD4+ and CD8+) and B cells, compared to many ER+ and HER2+ samples. This indicates a potentially more 'immune-infiltrated' or 'hot' microenvironment in some TNBC tumors.
- Sample-to-Sample Variability: Significant heterogeneity in cell type proportions is observed even within samples of the same condition, highlighting inter-patient differences in tumor microenvironment composition.
- Unassigned Cells: The proportion of 'unassigned' cells (dark blue) is generally low across all samples, indicating robust cell type annotation.
Biological Interpretation
The observed cellular population shifts provide key insights into the biology of breast cancer and its subtypes:
- Tumor Cell Expansion: The high proportion of Epithelial cells in tumor samples (ER+, HER2+, TNBC) strongly supports their role as the tumor-originating cell type, consistent with the AnnData context indicating 'Epithelial cell' as the resolved tumor-origin. The proliferation of these aneuploid tumor cells leads to their dominance in the tumor mass.
- Tumor Microenvironment (TME) Remodeling: The differences in immune and stromal cell populations between Normal and tumor conditions, and among tumor subtypes, reflect the extensive remodeling of the TME during cancer progression.
- Immune Infiltration in TNBC: The relatively higher presence of T cells (CD4+ and CD8+) and B cells in some TNBC samples aligns with the known immunogenicity of this breast cancer subtype. TNBCs are often characterized by high tumor-infiltrating lymphocytes (TILs) and can be more responsive to immunotherapies compared to other subtypes PubMed Search: "TNBC immune microenvironment immunotherapy".
- Variability in ER+ and HER2+ Immune Context: While some ER+ and HER2+ tumors show lower immune infiltration, others still maintain a significant immune component, suggesting diverse immune landscapes within these subtypes. The immune context of ER+ and HER2+ cancers is increasingly recognized as important for prognosis and treatment response PubMed Search: "ER+ breast cancer immune microenvironment" OR "HER2+ breast cancer immune microenvironment".
- Stromal Contribution: The consistent presence of Fibroblasts and Endothelial cells in both normal and tumor tissues underscores their critical roles in tissue structure, angiogenesis, and cancer-associated fibroblast (CAF) functions within the TME GeneCards: "Fibroblast" OR "Endothelial cell".
Clinical or Translational Implications
- Patient Stratification and Prognosis: The observed differences in immune cell infiltration, particularly the higher T and B cell populations in some TNBC samples, could serve as a biomarker for stratifying patients who might benefit most from immune checkpoint inhibitors. The level of immune infiltration is a known prognostic factor in breast cancer PubMed Search: "tumor infiltrating lymphocytes prognosis breast cancer".
- Therapeutic Target Identification: A detailed understanding of the cellular composition of the tumor microenvironment can guide the development of targeted therapies. For example, tumors with low immune infiltration might require strategies to "hot-up" the tumor, while those with existing immune cells could benefit from therapies that enhance immune effector function.
- Understanding Treatment Resistance: Shifts in cellular populations after treatment could also indicate mechanisms of resistance or predict response, although this specific analysis focuses on baseline populations.
- Biomarker Discovery: Specific ratios or absolute numbers of certain immune or stromal cells could be investigated as potential diagnostic or prognostic biomarkers.
7. T cell Subset Population Analysis Across Breast Cancer Subtypes and Normal Tissue
[Analysis Visualization Results]...
Analysis Overview
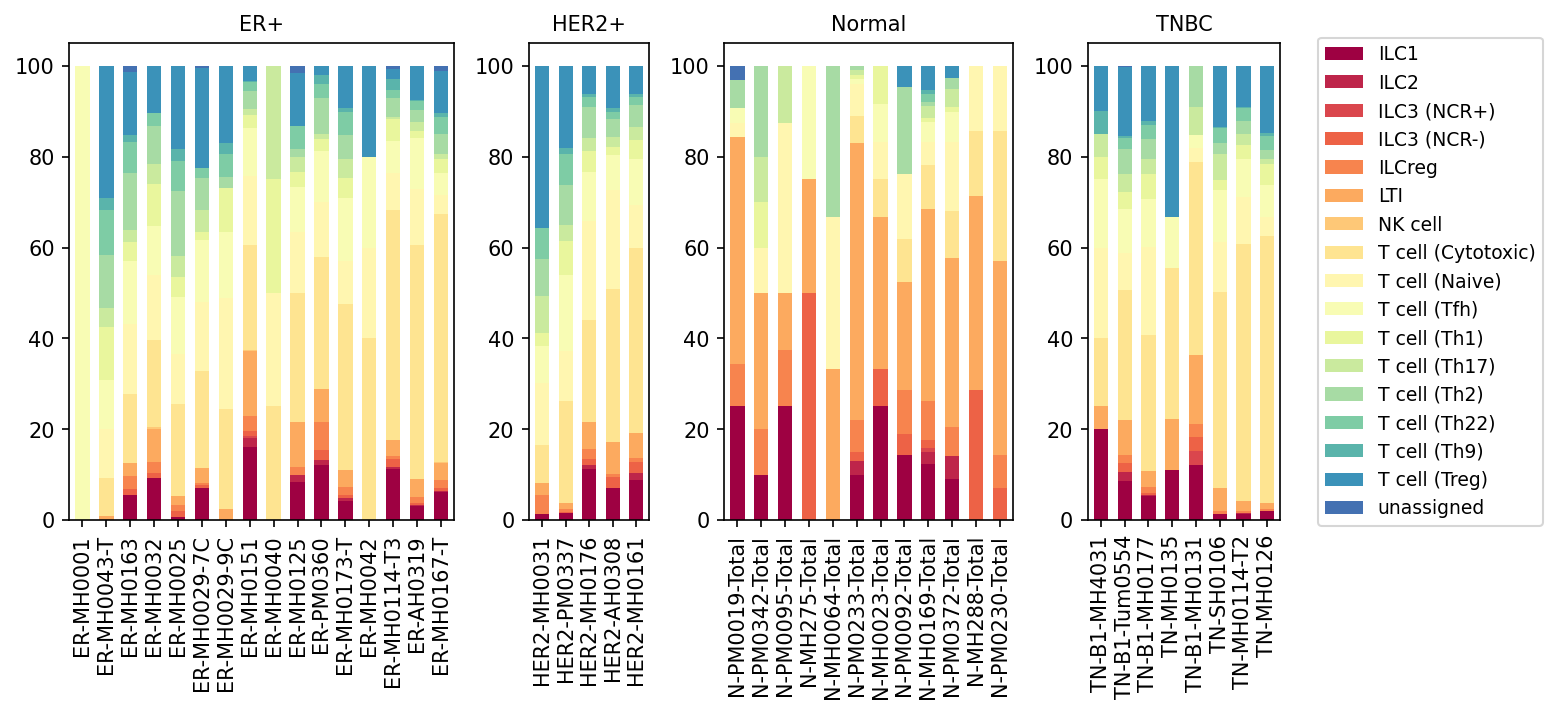
This analysis presents a population bar plot illustrating the relative proportions of various T cell subsets (defined by celltype_subset) across individual samples, grouped by different breast cancer conditions (ER+, HER2+, TNBC) and Normal tissue. The visualization provides insights into the immune cell composition within the tumor microenvironment and healthy breast tissue, specifically focusing on the adaptive T cell compartment. The primary goal is to identify shifts in T cell subset distributions that may be associated with different breast cancer subtypes.
Visual Summary
The stacked bar plot effectively visualizes the proportional representation of nine distinct T cell subsets for each sample.
- T cell (Cytotoxic) (dark red): This subset is notably abundant across all breast cancer conditions (ER+, HER2+, TNBC), consistently forming a significant proportion, often the largest, of the T cell population in most tumor samples. In contrast, its proportion is highly variable in Normal samples, with some showing very low levels.
- T cell (Naive) (red-orange): This subset is more prominent in several Normal samples compared to the cancer conditions. Its proportion appears generally reduced in ER+, HER2+, and especially in TNBC samples, suggesting T cell activation and differentiation within the tumor microenvironment.
- T cell (Treg) (dark blue): Regulatory T cells are observed across all conditions. While present in Normal samples, they contribute a noticeable, albeit variable, proportion in all breast cancer subtypes, indicating potential immune suppressive activity within the tumor microenvironment.
- T cell (Th1) (orange): Th1 cells are consistently present across all conditions and samples, indicating their role in various immune responses.
- T cell (Th17) (light yellow): This subset shows high variability. It is particularly prominent in several Normal samples, sometimes dominating the T cell compartment. In cancer conditions, its proportion is generally lower than in some high-Th17 Normal samples, but still present.
- Other T cell subsets (Tfh, Th2, Th22, Th9): These subsets are present in smaller, more variable proportions across the samples, contributing to the overall diversity of the T cell compartment.
Condition-Specific Observations:
- Normal: Displays the highest heterogeneity in T cell subset composition among individual samples. Some normal samples are rich in T cell (Naive) or T cell (Th17), while others show a balanced distribution including T cell (Cytotoxic).
- ER+ and HER2+: These conditions generally exhibit an increased proportion of T cell (Cytotoxic) compared to the average Normal sample, with a concomitant reduction in T cell (Naive). T cell (Treg) also constitutes a consistent portion.
- TNBC: This subtype shows the most consistent and highest proportion of T cell (Cytotoxic) cells across nearly all samples, often exceeding 50% of the T cell compartment. T cell (Naive) cells are consistently low. T cell (Treg) cells are also regularly observed at moderate levels, suggesting a potentially complex immune microenvironment with both effector and suppressive components.
Biological Interpretation
The observed shifts in T cell subset populations offer critical insights into the immune responses orchestrated within different breast cancer microenvironments.
- Enrichment of Cytotoxic T cells in Breast Cancer: The prominent presence of "T cell (Cytotoxic)" in ER+, HER2+, and especially TNBC samples suggests an active anti-tumor immune response. Cytotoxic T lymphocytes (CTLs) are crucial for directly killing cancer cells expressing tumor-associated antigens PubMed Search: "cytotoxic T cells cancer immunity". This finding aligns with the general understanding of tumor-infiltrating lymphocytes (TILs) playing a role in cancer prognosis and response to therapy. The particularly high and consistent presence in TNBC is noteworthy, as TNBC is often considered an "immunogenic" subtype.
- Decreased Naive T cells in Cancer: The reduction in "T cell (Naive)" in tumor samples compared to some normal tissues indicates T cell activation and differentiation within the tumor microenvironment. Naive T cells are typically abundant in peripheral circulation and healthy tissues, undergoing differentiation upon antigen encounter. Their lower proportion in tumors suggests that T cells are being primed and educated against tumor antigens.
- Presence of Regulatory T cells (Tregs): The consistent presence of "T cell (Treg)" in all cancer subtypes, including TNBC where cytotoxic T cells are also high, points towards an immunosuppressive component within the tumor microenvironment. Tregs are known to suppress anti-tumor immune responses, hindering the effectiveness of cytotoxic T cells and potentially contributing to immune evasion GeneCards: FOXP3. The co-existence of high CTLs and Tregs suggests an 'inflamed' or 'hot' tumor microenvironment that is also attempting to dampen the immune response.
- Variability in Normal Tissue T cell Composition: The substantial heterogeneity in T cell subsets within normal breast tissue samples highlights the natural diversity of immune surveillance and immune states even in the absence of overt pathology. The high proportion of Th17 cells in some normal samples could reflect regional immune activities or differences in tissue microenvironments.
- Subtype-Specific Immunophenotypes:
- TNBC exhibiting the highest and most consistent cytotoxic T cell infiltration, alongside Tregs, is characteristic of its "hot" and often immune-infiltrated nature. This makes TNBC a prime candidate for immunotherapeutic strategies.
- ER+ and HER2+ also show increased cytotoxic T cells compared to normal, but perhaps with more variability or lower overall proportions than TNBC, reflecting a generally less immunogenic profile compared to TNBC.
Clinical or Translational Implications
These findings have several potential clinical and translational implications for breast cancer management:
- Immunotherapy Responsiveness: The high infiltration of cytotoxic T cells in TNBC suggests a strong potential for response to immune checkpoint blockade (ICB) therapies, which aim to unleash these effector T cells by blocking inhibitory pathways like PD-1/PD-L1. The co-presence of Tregs, however, indicates potential mechanisms of resistance that might require combination therapies targeting immune suppression.
- Prognostic Biomarkers: The proportion of tumor-infiltrating lymphocytes (TILs), particularly cytotoxic T cells, is a known prognostic factor in breast cancer, with higher levels often correlating with better outcomes, especially in HER2+ and TNBC subtypes PubMed Search: "TILs breast cancer prognosis". This analysis reinforces the importance of assessing the T cell compartment.
- Therapeutic Targeting: Strategies aimed at enhancing cytotoxic T cell function (e.g., CAR T cell therapy, oncolytic viruses, vaccines) or reducing Treg-mediated suppression (e.g., anti-CTLA-4, cyclophosphamide) could be considered, especially in subtypes with high T cell infiltration.
- Personalized Medicine: Understanding the specific T cell landscape of an individual patient's tumor, as shown by these population plots, could aid in guiding personalized treatment decisions, potentially predicting response to specific immunotherapies or identifying patients who might benefit from immunomodulatory agents.
- Monitoring Disease Progression/Response: Changes in T cell subset populations over time or in response to treatment could serve as biomarkers for disease progression or treatment efficacy.
8. T cell Subpopulation Dynamics Across Breast Cancer Subtypes
[Analysis Visualization Results]...
Analysis Overview
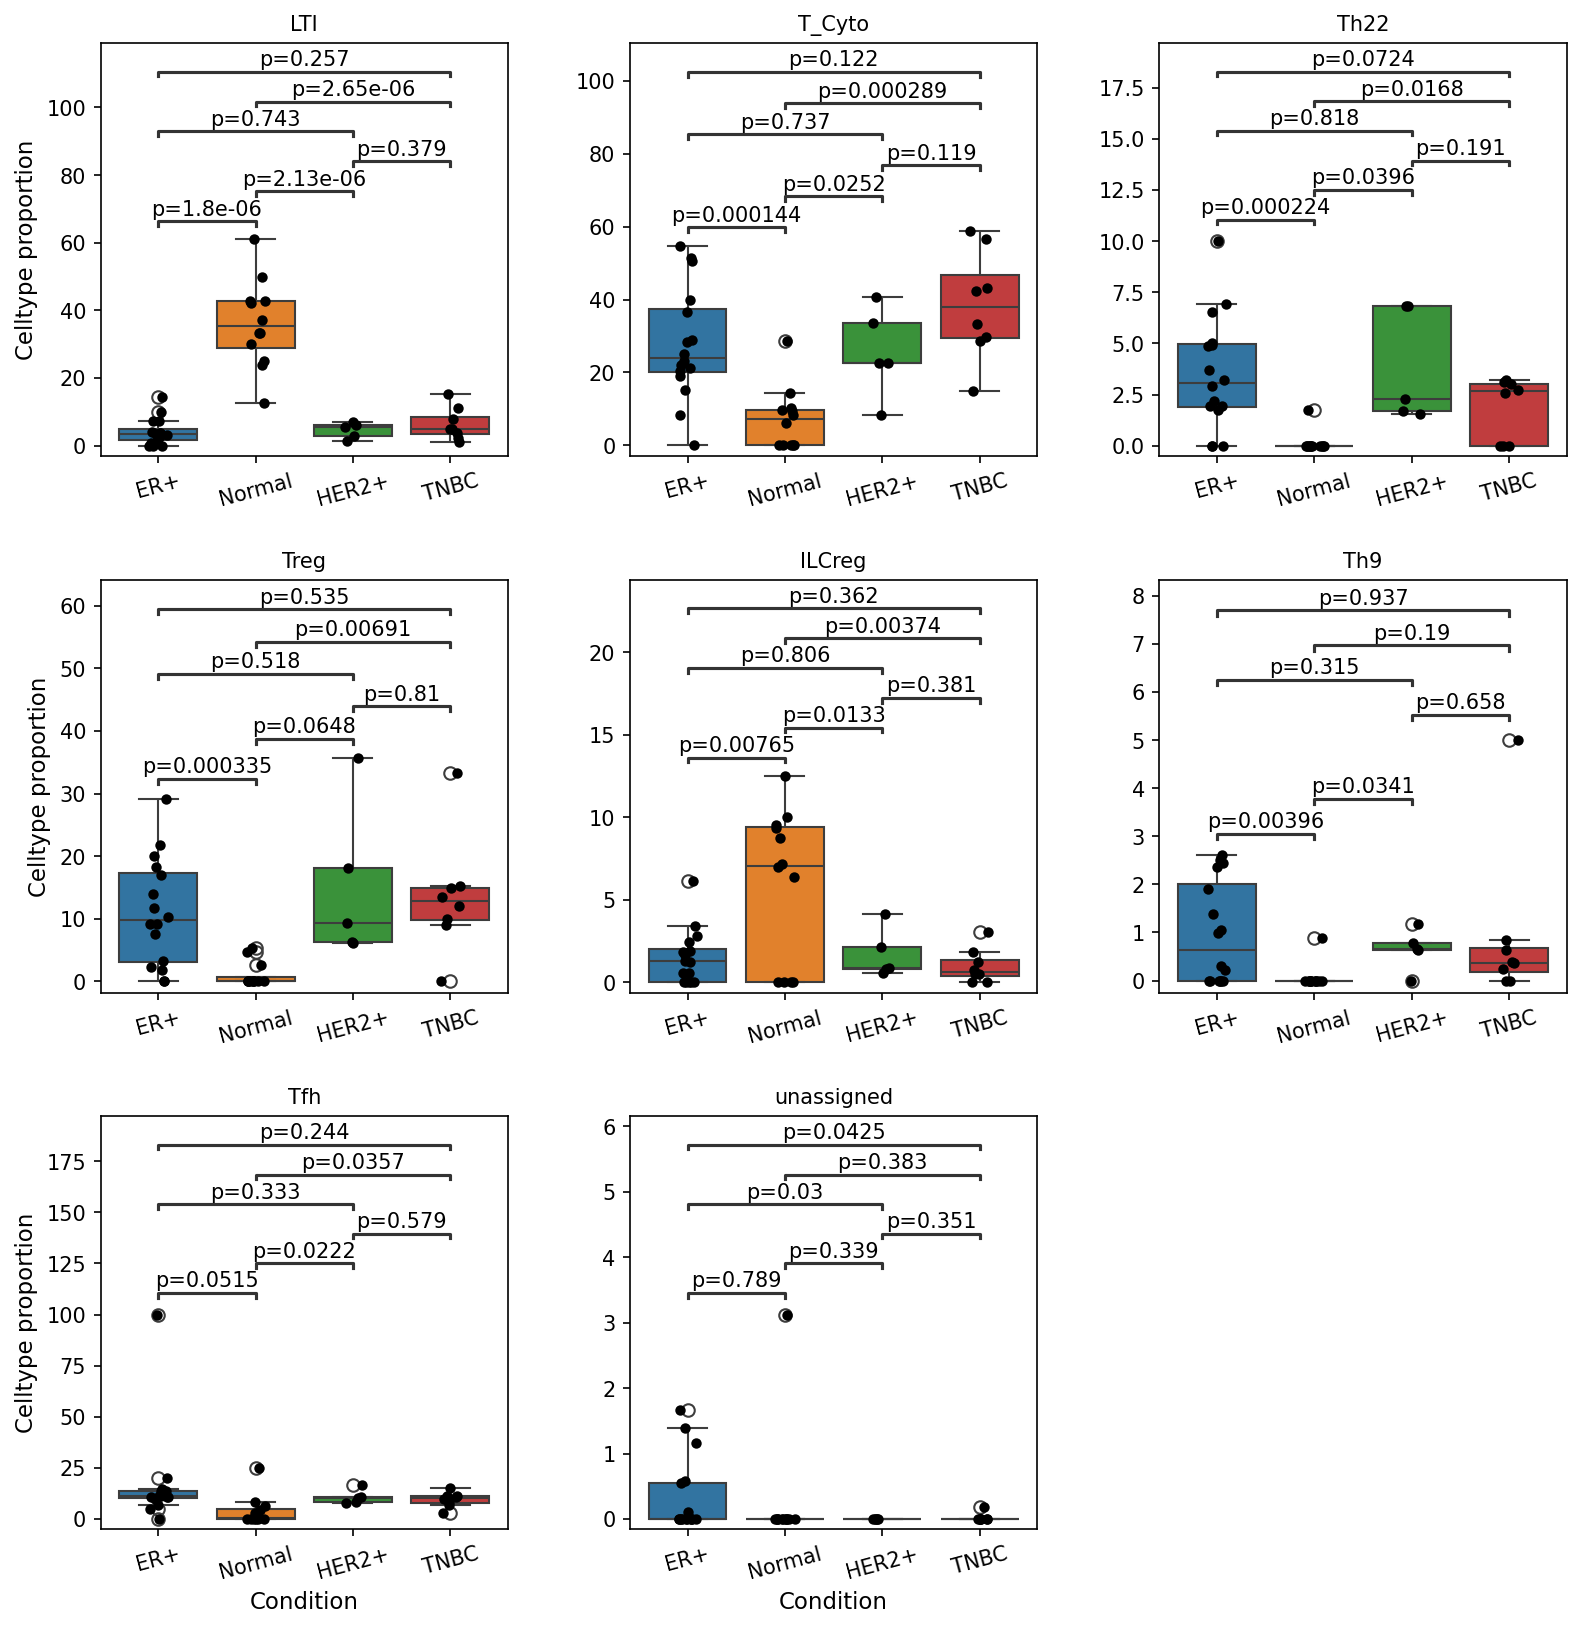
This analysis presents box plots visualizing the proportional distribution of various T cell subsets across different breast cancer conditions (ER+, HER2+, TNBC) and normal breast tissue. The aim is to identify specific T cell subset populations that show statistically significant differences in their proportions between these conditions, potentially highlighting their roles in the tumor microenvironment of different breast cancer subtypes. Statistical significance (p-values) for comparisons against the "Normal" reference group or between cancer subtypes are indicated on the plots.
Visual Summary
The box plots reveal distinct patterns in the proportions of several T cell subsets:
- LTI (Lymphoid Tissue Inducer) cells: Show a significantly higher proportion in Normal tissue compared to all breast cancer subtypes (ER+, HER2+, TNBC) with p-values ranging from 1.8e-06 to 2.65e-06. This indicates a notable reduction of LTI cells in the cancerous conditions.
- T_Cyto (Cytotoxic T cells): Proportions are significantly higher in ER+ (p=0.000144) and TNBC (p=0.000289) conditions compared to Normal tissue. There is also an upward trend in HER2+ compared to Normal, though the direct p-value against Normal is not explicitly shown, but HER2+ is higher than Normal and lower than TNBC and ER+. This suggests an enrichment of cytotoxic T cells in these breast cancer subtypes.
- Th22 cells: Exhibit significantly higher proportions in ER+ (p=0.000224) and HER2+ (p=0.0396) conditions compared to Normal. A significant difference is also observed between HER2+ and TNBC (p=0.0168), with HER2+ having a higher proportion.
- Treg (Regulatory T cells): Show significantly higher proportions in ER+ (p=0.000335) and HER2+ (p=0.00691) conditions compared to Normal tissue. The proportion in TNBC is also elevated compared to Normal, but with a borderline p-value (p=0.0648). This suggests an increased presence of Tregs in breast cancer, particularly ER+ and HER2+ subtypes.
- ILCreg (Regulatory Innate Lymphoid Cells): Display a significantly higher proportion in Normal tissue compared to ER+ (p=0.00765), HER2+ (p=0.0133), and TNBC (p=0.00374), similar to LTI cells.
- Th9 cells: Are significantly more abundant in ER+ condition compared to Normal (p=0.00396) and HER2+ (p=0.0341).
- Tfh (Follicular Helper T cells): Show significantly higher proportions in ER+ compared to Normal (p=0.0515), HER2+ (p=0.0222), and TNBC (p=0.0357).
- Th1 cells: While the plot shows some differences, the indicated p-values (e.g., ER+ vs Normal: p=0.053) are at the cutoff threshold (0.1) or higher, suggesting less robust or consistent statistically significant differences compared to the other T cell subsets across all conditions.
Biological Interpretation
The observed shifts in T cell subset proportions reflect dynamic changes in the immune microenvironment of breast cancer, varying across subtypes:
- Reduction of LTI and ILCreg in Cancer: The significant decrease of LTI and ILCreg cells in all breast cancer subtypes compared to normal tissue is notable. LTI cells are crucial for the development of lymphoid structures (e.g., tertiary lymphoid structures), and ILCregs are involved in immune regulation. Their reduction might indicate a disruption in immune architecture and regulatory capacity within the tumor microenvironment, potentially contributing to immune evasion.
- Increased Cytotoxic T cells in ER+ and TNBC: The elevated proportion of T_Cyto cells in ER+ and TNBC suggests a potential host anti-tumor immune response. Cytotoxic T cells are critical for direct killing of cancer cells. However, their presence does not always equate to effective anti-tumor immunity, as they can become exhausted or dysfunctional within the tumor microenvironment PubMed search: T cell exhaustion breast cancer.
- Treg Enrichment in ER+ and HER2+: The increased proportion of Treg cells in ER+ and HER2+ breast cancer subtypes is a common finding in many cancers. Tregs suppress anti-tumor immune responses, facilitating tumor growth and progression by inhibiting effector T cells. This finding aligns with their established role in promoting an immunosuppressive microenvironment GeneCards: FOXP3, a key marker for Tregs.
- Th22 and Th9 Shifts: The elevated Th22 cells in ER+ and HER2+ and Th9 cells in ER+ suggest distinct inflammatory responses. Th22 cells are involved in tissue inflammation and repair, and their role in cancer is context-dependent, sometimes promoting tumor growth or contributing to an inflammatory phenotype PubMed search: Th22 breast cancer. Th9 cells can exert anti-tumor effects by recruiting cytotoxic cells or, in other contexts, promote chronic inflammation PubMed search: Th9 breast cancer.
- Tfh cells in ER+: The increased Tfh cells in ER+ breast cancer might indicate an active humoral immune response. Tfh cells provide help to B cells for antibody production. While some antibodies can be anti-tumor, others can promote tumor growth or escape PubMed search: B cell follicular helper T cell breast cancer.
Clinical or Translational Implications
These findings offer insights into the immune landscape of breast cancer, which can have clinical implications:
- Immunosuppression in ER+ and HER2+: The elevated proportions of Tregs in ER+ and HER2+ tumors suggest a potentially immunosuppressive microenvironment in these subtypes. This could impact the efficacy of immunotherapies, highlighting the need for strategies to overcome Treg-mediated suppression.
- Immune Hot vs. Cold Tumors: The increased cytotoxic T cells in ER+ and TNBC might classify them as more "immune hot" compared to normal tissue. However, the presence of Tregs in ER+ and HER2+ indicates a complex balance. Understanding this balance is crucial for predicting response to immune checkpoint inhibitors.
- Prognostic and Predictive Biomarkers: Specific T cell subset proportions, like LTI, ILCreg, Treg, T_Cyto, Th22, Th9, and Tfh, could serve as potential prognostic biomarkers for different breast cancer subtypes, indicating disease aggressiveness or recurrence risk. Furthermore, they might predict patient response to various therapeutic interventions, including chemotherapy, targeted therapy, or immunotherapy.
- Therapeutic Targeting: Identifying distinct immune profiles across subtypes opens avenues for subtype-specific immunotherapeutic approaches. For instance, strategies to boost LTI and ILCreg activity or deplete Tregs could be beneficial in breast cancer.
- Understanding Subtype Heterogeneity: The differential enrichment of T cell subsets across ER+, HER2+, and TNBC underscores the significant immunological heterogeneity within breast cancer, which must be considered for personalized treatment strategies.
9. Macrophage Subset Population Analysis Across Breast Cancer Subtypes and Normal Tissue
[Analysis Visualization Results]...
Analysis Overview
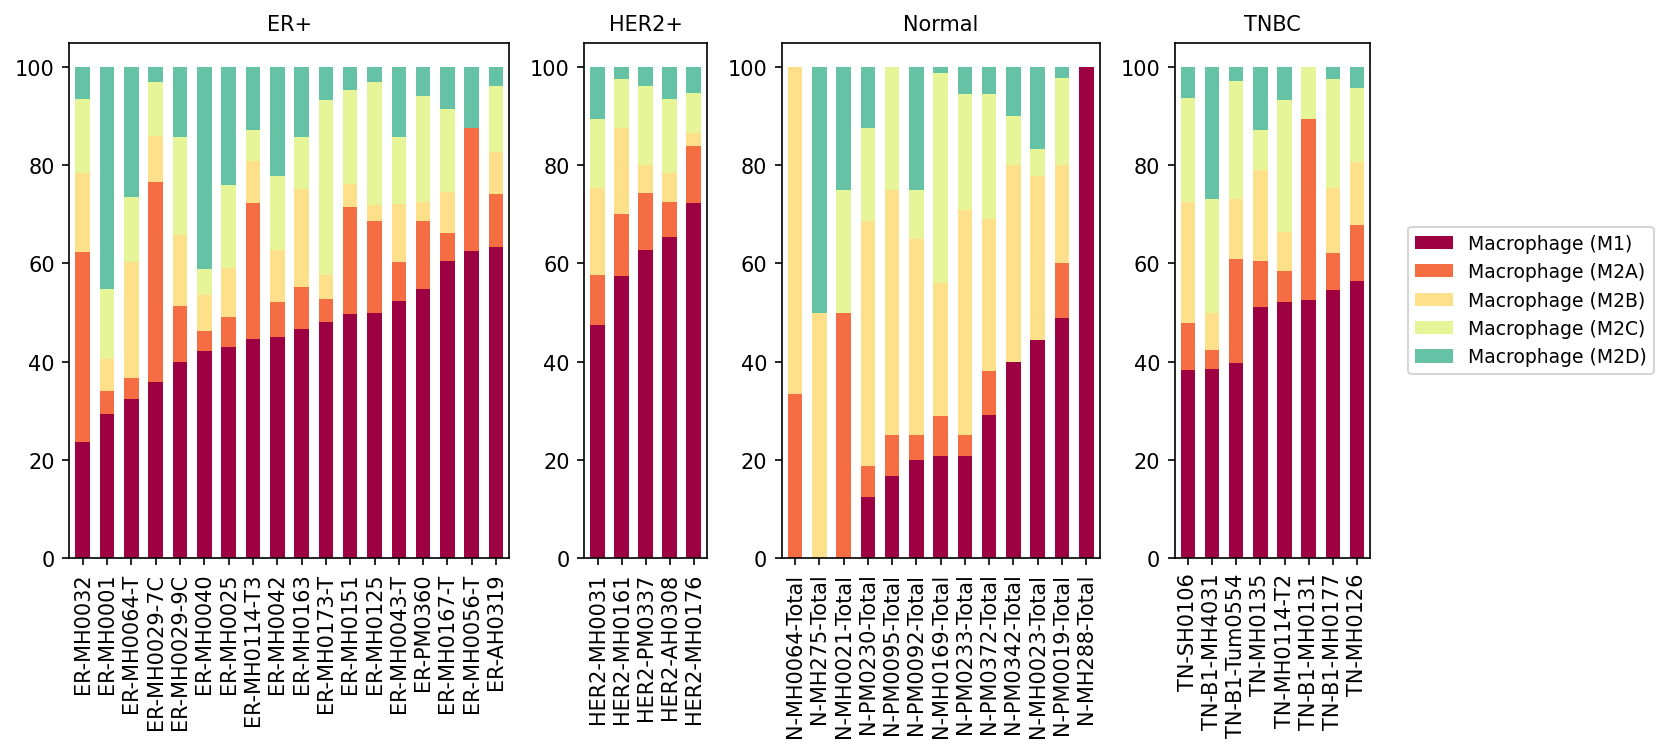
This analysis presents a population bar plot illustrating the relative abundance of different macrophage subsets (Macrophage (M1), Macrophage (M2A), Macrophage (M2B), Macrophage (M2C), and Macrophage (M2D)) within the macrophage cell compartment across individual samples. The samples are grouped by their clinical condition: ER+ breast cancer, HER2+ breast cancer, Normal breast tissue, and Triple-Negative Breast Cancer (TNBC). The plot allows for a visual comparison of macrophage polarization patterns in healthy versus diseased states and across distinct breast cancer subtypes.
Visual Summary
The bar plot displays the proportional distribution of macrophage subsets for each sample, stacked to 100%.
- Overall Macrophage Landscape: Across all breast cancer subtypes (ER+, HER2+, TNBC), Macrophage (M1) (burgundy) consistently constitutes a substantial, often dominant, proportion of the total macrophage population in most samples. Macrophage (M2A) (orange) is frequently observed as the second most abundant subset in these tumor conditions.
- Normal Tissue Comparison: In Normal breast tissue samples, the macrophage subset distribution appears more heterogeneous. While some normal samples show a high M1 proportion, many others exhibit a greater relative abundance of Macrophage (M2B) (light yellow), Macrophage (M2C) (light green/yellow), and Macrophage (M2D) (light teal) compared to the cancer conditions. Specifically, M2B, M2C, and M2D collectively contribute significantly to the macrophage pool in several normal samples (e.g., N-MH0064-Total, N-MH275-Total, N-MH0021-Total).
- ER+ and HER2+ Breast Cancer: Both ER+ and HER2+ samples largely show a prominent M1 population, often exceeding 50% of total macrophages in many individual samples. M2A is consistently present as the next major subset. The proportions of M2B, M2C, and M2D are generally lower and more variable in these tumor types compared to M1 and M2A.
- Triple-Negative Breast Cancer (TNBC): TNBC samples also maintain a high proportion of M1 macrophages. Notably, Macrophage (M2A) appears particularly enriched in several TNBC samples (e.g., TN-B1-Tum0554, TN-MH0135, TN-MH0177), sometimes approaching or even surpassing the M1 proportion. This suggests a potential shift towards the M2A phenotype in TNBC.
- Subset Specifics: Macrophage (M2D) (light teal), a subset often associated with pro-tumor functions, generally maintains a lower relative abundance across most tumor samples compared to M1 and M2A, although it is present in varying degrees in normal tissue.
- Sample Heterogeneity: Significant inter-sample variability in macrophage subset composition is observed within each condition, highlighting the diverse immune microenvironments even within the same cancer subtype.
Biological Interpretation
Macrophages are highly plastic immune cells that play critical roles in the tumor microenvironment (TME), exhibiting either pro-inflammatory, anti-tumor (M1-like) or anti-inflammatory, pro-tumor (M2-like) functions.
- Complex Role of M1-like Macrophages in Tumors: The consistent and high proportion of Macrophage (M1) in all breast cancer subtypes is intriguing. While M1 macrophages are traditionally associated with tumoricidal activity through antigen presentation, phagocytosis, and cytokine production, their elevated presence in tumors does not automatically equate to effective anti-tumor immunity. It's plausible that these M1-like cells in the TME might be functionally suppressed or "re-educated" by tumor-derived signals, adopting a phenotype that retains M1 markers but exhibits impaired anti-tumor effector functions, or representing an initial inflammatory response that is later subverted.
- M2A Enrichment in TNBC: The notable increase in Macrophage (M2A) in several TNBC samples is a significant finding. M2A macrophages are involved in allergic responses, parasite immunity, tissue repair, and fibrosis. In the context of cancer, they can contribute to tumor progression by promoting angiogenesis, extracellular matrix remodeling, and immune evasion. Given the aggressive nature of TNBC, this observed shift towards M2A could represent a crucial component of its pro-tumorigenic microenvironment, facilitating tumor growth and metastasis.
- Macrophage Plasticity and Disease Context: The differences in macrophage subset distribution between normal and cancerous tissues underscore the profound impact of the disease microenvironment on macrophage polarization. The higher diversity of M2B, M2C, and M2D in normal tissue likely reflects their roles in tissue homeostasis and basic immune regulation, which are then perturbed or co-opted in the tumor context, leading to a preferential expansion of specific pro-tumorigenic subsets like M2A in certain cancer types.
Clinical or Translational Implications
- Biomarker Potential: The distinct macrophage subset profiles observed, particularly the increased M2A population in TNBC, could serve as a prognostic or predictive biomarker. A higher proportion of M2A macrophages might correlate with more aggressive disease or differential response to specific therapies in TNBC patients.
- Therapeutic Opportunities: Modulating macrophage polarization is a promising strategy in cancer immunotherapy. Understanding the dominant macrophage subsets in different breast cancer types can inform the design of targeted therapies. For instance, therapeutic interventions aimed at reprogramming M2A macrophages towards an M1-like, anti-tumor phenotype, or inhibiting their recruitment/survival, could be particularly beneficial for TNBC patients. Strategies could include CSF1/CSF1R inhibitors, antibodies targeting specific M2 markers, or agonists that promote M1 polarization.
- Immuno-oncology: These findings highlight the importance of assessing the composition and functional states of tumor-associated macrophages (TAMs) in breast cancer. Integrating such cellular population data with functional assays and clinical outcomes can provide a more comprehensive understanding of immune responses in the TME and guide precision immuno-oncology approaches.
10. Macrophage Subset Population Analysis in Breast Cancer Conditions
[Analysis Visualization Results]...
Analysis Overview
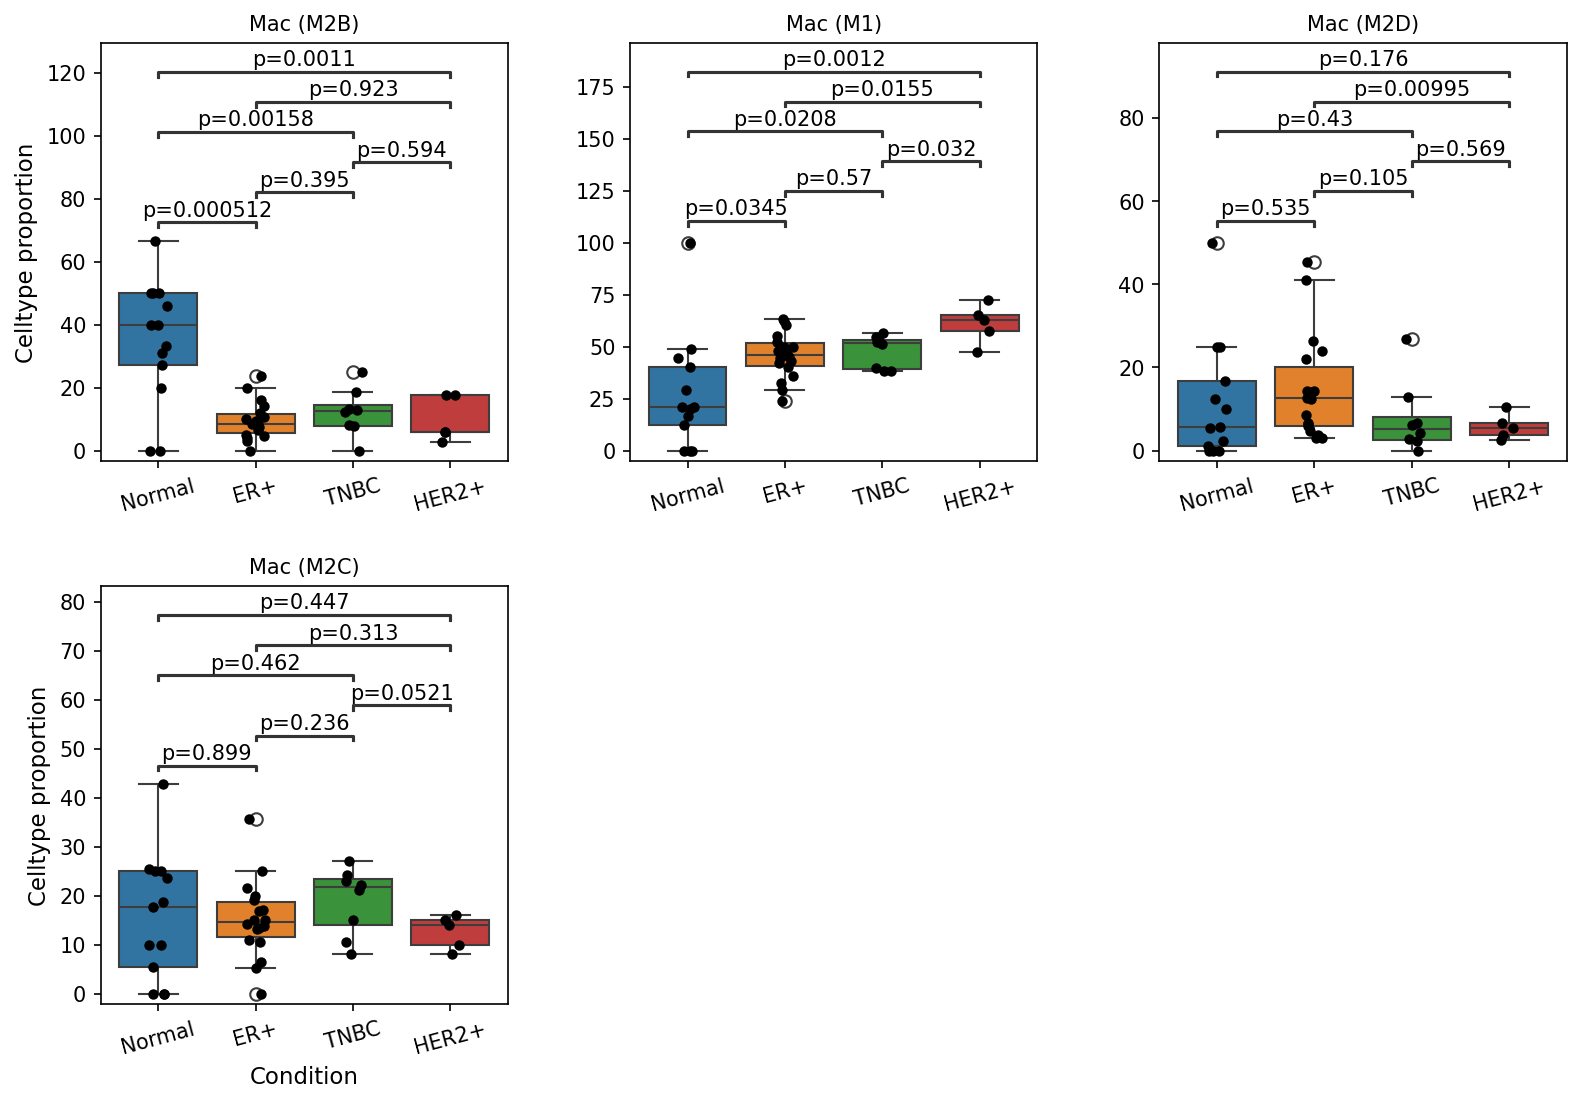
This analysis presents box plots illustrating the proportional distribution of various macrophage subsets (Mac M2B, Mac M1, Mac M2D, and Mac M2C) across different breast cancer conditions: Normal, ER+ (Estrogen Receptor-positive), TNBC (Triple-Negative Breast Cancer), and HER2+ (Human Epidermal Growth Factor Receptor 2-positive). The plots highlight statistically significant differences (p < 0.1) in the relative abundance of these macrophage populations between conditions, offering insights into the immunological landscape of different breast cancer subtypes.
Visual Summary
The box plots reveal distinct patterns of macrophage subset proportions in breast cancer conditions compared to normal breast tissue.
Macrophage (M2B):
- The proportion of Macrophage (M2B) cells is significantly lower in all three breast cancer subtypes (ER+, TNBC, and HER2+) compared to the Normal condition (p < 0.002 for all comparisons).
- Specifically, Normal vs ER+ (p=0.00052), Normal vs TNBC (p=0.00158), and Normal vs HER2+ (p=0.0011) show a marked decrease in M2B proportions in cancer.
Macrophage (M1):
- Conversely, Macrophage (M1) proportions are significantly increased in all breast cancer subtypes compared to Normal tissue. This increase is observed for Normal vs ER+ (p=0.0345), Normal vs TNBC (p=0.0208), and Normal vs HER2+ (p=0.0012).
- Furthermore, HER2+ breast cancer samples exhibit significantly higher proportions of M1 macrophages compared to both ER+ (p=0.0155) and TNBC (p=0.032) subtypes.
Macrophage (M2D):
- The proportion of Macrophage (M2D) cells is significantly reduced in TNBC (p=0.000995) and HER2+ (p=0.00995) conditions when compared to Normal tissue.
Macrophage (M2C):
- Macrophage (M2C) shows a statistically significant decrease only in the HER2+ condition compared to Normal tissue (p=0.0521).
Biological Interpretation
Macrophages are critical components of the tumor microenvironment (TME) and undergo polarization into various functional subsets, broadly categorized as M1 (pro-inflammatory, anti-tumor) and M2 (anti-inflammatory, pro-tumor) phenotypes. The observed shifts in macrophage subsets suggest a complex and dynamically modulated immune response in breast cancer.
- Shift towards M1-like Activation: The consistent and significant increase in Macrophage (M1) populations across all breast cancer subtypes, and particularly pronounced in HER2+ cancer, is notable. M1 macrophages are traditionally associated with anti-tumor immunity, promoting inflammation and direct cytotoxicity against cancer cells [1]. This increase might indicate an active, albeit possibly insufficient, immune response attempting to combat tumor progression. The higher M1 proportion in HER2+ tumors could reflect their often more immunogenic nature compared to ER+ tumors, which may be more "cold" or immune-excluded [2].
- Reduction in Specific M2 Subsets: The widespread reduction in Macrophage (M2B), and more selectively in Macrophage (M2D) (in TNBC and HER2+) and Macrophage (M2C) (in HER2+), compared to normal tissue is an intriguing finding. While M2 macrophages are generally considered pro-tumoral, these specific subsets (M2B, M2C, M2D) have distinct roles.
- M2B macrophages are involved in immune regulation and can exhibit both pro- and anti-inflammatory characteristics. Their decrease could imply a shift away from this specific regulatory phenotype in the breast TME.
- M2C macrophages are typically associated with immune suppression, tissue remodeling, and wound healing, often contributing to tumor progression [3]. A decrease in HER2+ could suggest a unique immunomodulatory strategy in this subtype, or that other pro-tumoral immune cells or macrophage phenotypes dominate.
- M2D macrophages, often linked to hypoxia, are known to promote angiogenesis and tumor growth [4]. Their reduction in TNBC and HER2+ might suggest that these particular breast cancer subtypes rely less on M2D-mediated mechanisms for progression compared to other macrophage subsets or that the "Normal" tissue baseline has a higher proportion of M2D for other physiological reasons.
These findings suggest that rather than a simple increase in all "pro-tumor" M2 macrophages, the breast cancer TME, especially in different subtypes, leads to specific reprogramming or selection of macrophage subsets. The increase in M1 could be a host response, while the decrease in certain M2 subsets might indicate that the tumor avoids inducing these specific M2 types, or that these types are outcompeted or reprogrammed into other pro-tumorigenic states not captured or specifically defined here.
Clinical or Translational Implications
The differential proportions of macrophage subsets across breast cancer subtypes hold potential clinical significance:
- Biomarker Potential: The distinct immune signatures, particularly the M1/M2 balance, could serve as prognostic or predictive biomarkers for different breast cancer subtypes. For instance, a higher M1 proportion in HER2+ tumors might correlate with responsiveness to immunotherapies or other targeted treatments.
- Therapeutic Targets: Understanding which macrophage subsets are altered and in which direction can inform therapeutic strategies. If certain M2 subsets are suppressed in cancer (e.g., M2B, M2C, M2D), it might imply a less prominent role for therapeutic approaches aimed at depleting these specific populations, or conversely, suggest that their restoration could be beneficial. The increased M1 population in cancer could indicate an existing, but perhaps ineffective, anti-tumor immune response that could be potentiated by immunomodulatory drugs.
References:
- Orecchioni, M., et al. (2019). "Macrophage Polarization: Different Molecular Mechanisms, Different Metabolic Responses." *Biomedicines*, 7(4), 93. PubMed Search: Macrophage M1 M2 cancer review
- Denkert, C., et al. (2018). "Immunogenicity of breast cancer subtypes: from in situ to metastatic disease." *Journal of the National Cancer Institute*, 110(11), 1162-1170. PubMed Search: HER2+ breast cancer immunogenicity ER+
- Mantovani, A., et al. (2017). "Tumor-associated macrophages as a paradigm of functional plasticity, diversity, and intercellular communication." *Immunological Reviews*, 276(1), 229-241. PubMed Search: Macrophage M2C cancer role
- Rizzo, A., et al. (2020). "Tumor Associated Macrophages (TAMs) in the Tumor Microenvironment." *Frontiers in Immunology*, 11, 584988. PubMed Search: Macrophage M2D angiogenesis cancer
11. Ploidy Distribution in Epithelial Cells Across Breast Cancer Subtypes and Normal Tissue
[Analysis Visualization Results]...
Analysis Overview
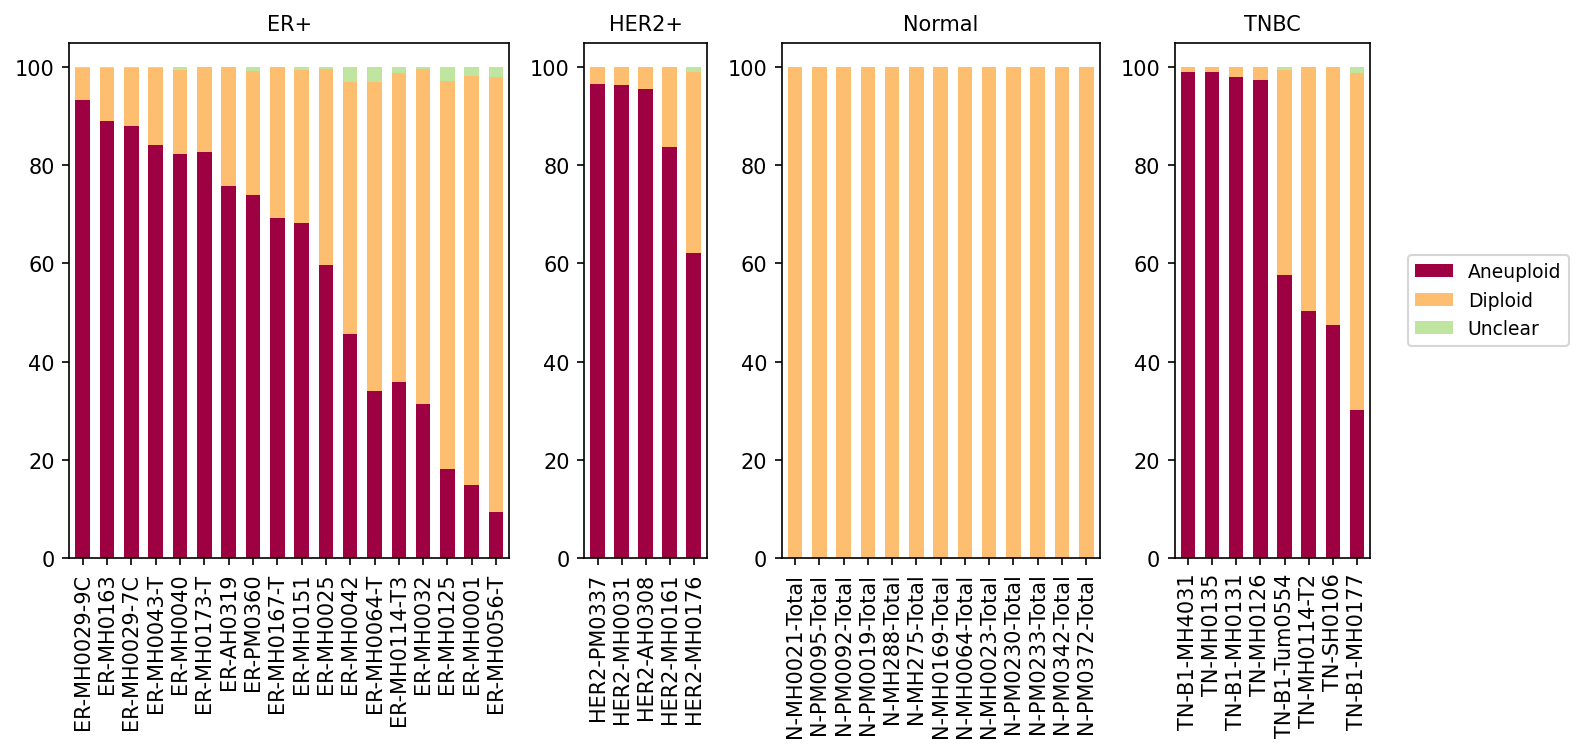
This analysis investigates the ploidy status (Aneuploid, Diploid, or Unclear) of Epithelial cells within individual samples, categorized by their tissue condition: Normal, ER+ breast cancer, HER2+ breast cancer, and Triple-Negative Breast Cancer (TNBC). The objective is to understand the genomic stability of epithelial cells, particularly in the context of breast cancer, where epithelial cells are the primary cell type of origin for most carcinomas.
Visual Summary
The bar plot displays the percentage of Epithelial cells classified as Aneuploid (maroon), Diploid (light orange), or Unclear (light green) for each sample, grouped by condition.
- Normal Condition: All samples from normal breast tissue show an almost exclusive presence of Diploid Epithelial cells, consistently near 100%. Aneuploid and Unclear cells are virtually absent in these samples.
- ER+ Condition: This group exhibits significant heterogeneity in ploidy distributions across samples.
- Many ER+ samples (e.g., ER-MH0029-9C, ER-MH0163, ER-MH0043-T) are dominated by Aneuploid Epithelial cells, with proportions ranging from approximately 70% to over 90%.
- Conversely, some ER+ samples (e.g., ER-MH0064-T, ER-MH0001, ER-MH0056-T) show a lower proportion of Aneuploid cells, sometimes dropping below 20%, with a higher prevalence of Diploid cells.
- Unclear cells are present in a few samples but constitute a very small fraction.
- HER2+ Condition: Epithelial cells from HER2+ samples consistently show a very high proportion of Aneuploid cells, generally ranging from approximately 60% to over 95%. Diploid cells are present but represent a minority population. Unclear cells are negligible.
- TNBC Condition: Similar to HER2+, TNBC samples predominantly feature Aneuploid Epithelial cells. Most samples exhibit aneuploidy levels exceeding 90% (e.g., TN-B1-MH4031, TN-B1-MH0135). A few samples show lower, but still substantial, aneuploid fractions, ranging from roughly 30% to 60% (e.g., TN-B1-Tum0554, TN-MH0114-T2, TN-B1-MH0177). Unclear cells are minimal.
Biological Interpretation
The observed ploidy patterns within Epithelial cells provide critical insights into the genomic characteristics of breast tissue in health and disease.
- Genomic Stability in Normal Tissue: The nearly exclusive diploid state of Epithelial cells in normal breast tissue is a hallmark of healthy, non-malignant cells, indicating stable genomes with the correct number of chromosomes. This serves as a vital baseline for comparison.
- Aneuploidy as a Cancer Hallmark: The striking prevalence of aneuploid Epithelial cells in the ER+, HER2+, and TNBC conditions is a strong indicator of malignancy. Aneuploidy, defined as an abnormal number of chromosomes, is a well-established feature of most cancers, contributing to tumor initiation, progression, and heterogeneity due to genomic instability [PMID: 25482464]. The finding that the resolved tumor-origin cell type is Epithelial cell, combined with these ploidy results, robustly supports their role as the primary malignant population.
Subtype-Specific Genomic Instability:
- HER2+ and TNBC appear to be characterized by a consistently high degree of aneuploidy in their epithelial cell populations across almost all samples. This suggests that these more aggressive breast cancer subtypes frequently harbor substantial chromosomal abnormalities, which can drive their rapid proliferation and resistance to therapy.
- ER+ breast cancer displays more variability. While many ER+ tumors are highly aneuploid, some samples show a notable proportion of diploid epithelial cells. This heterogeneity could reflect the diverse clinical and biological behavior within the ER+ subtype, potentially distinguishing less aggressive, genomically stable tumors from more advanced, unstable ones. It could also suggest varying degrees of tumor purity or the presence of non-malignant epithelial cells within the tumor microenvironment.
Clinical or Translational Implications
The differential ploidy patterns observed in Epithelial cells across breast cancer subtypes hold several clinical and translational implications:
- Diagnostic and Prognostic Significance: A high proportion of aneuploid epithelial cells can serve as a strong indicator of malignancy, especially when detected in breast tissue. The degree of aneuploidy could potentially be a prognostic marker, with highly aneuploid tumors (e.g., consistently seen in HER2+ and TNBC) possibly correlating with more aggressive disease or higher risk of recurrence.
- Therapeutic Stratification: The varying levels of aneuploidy across subtypes, particularly the heterogeneity within ER+ breast cancer, suggest that genomic instability could influence therapeutic response. Tumors with high aneuploidy might be more sensitive to therapies targeting DNA repair pathways or cell cycle checkpoints, while those with lower aneuploidy might respond better to other targeted treatments. This supports the need for personalized approaches to treatment based on the genomic landscape of individual tumors.
- Understanding Tumor Heterogeneity: The presence of both aneuploid and diploid epithelial cells within some tumor samples (especially ER+) highlights tumor heterogeneity. This can involve subclones with different genomic profiles or the co-existence of malignant and benign epithelial cells within the tumor sample. Understanding this heterogeneity is crucial for predicting treatment resistance and disease progression.
12. Cell-Cell Interaction Analysis Across Breast Cancer Subtypes and Normal Tissue
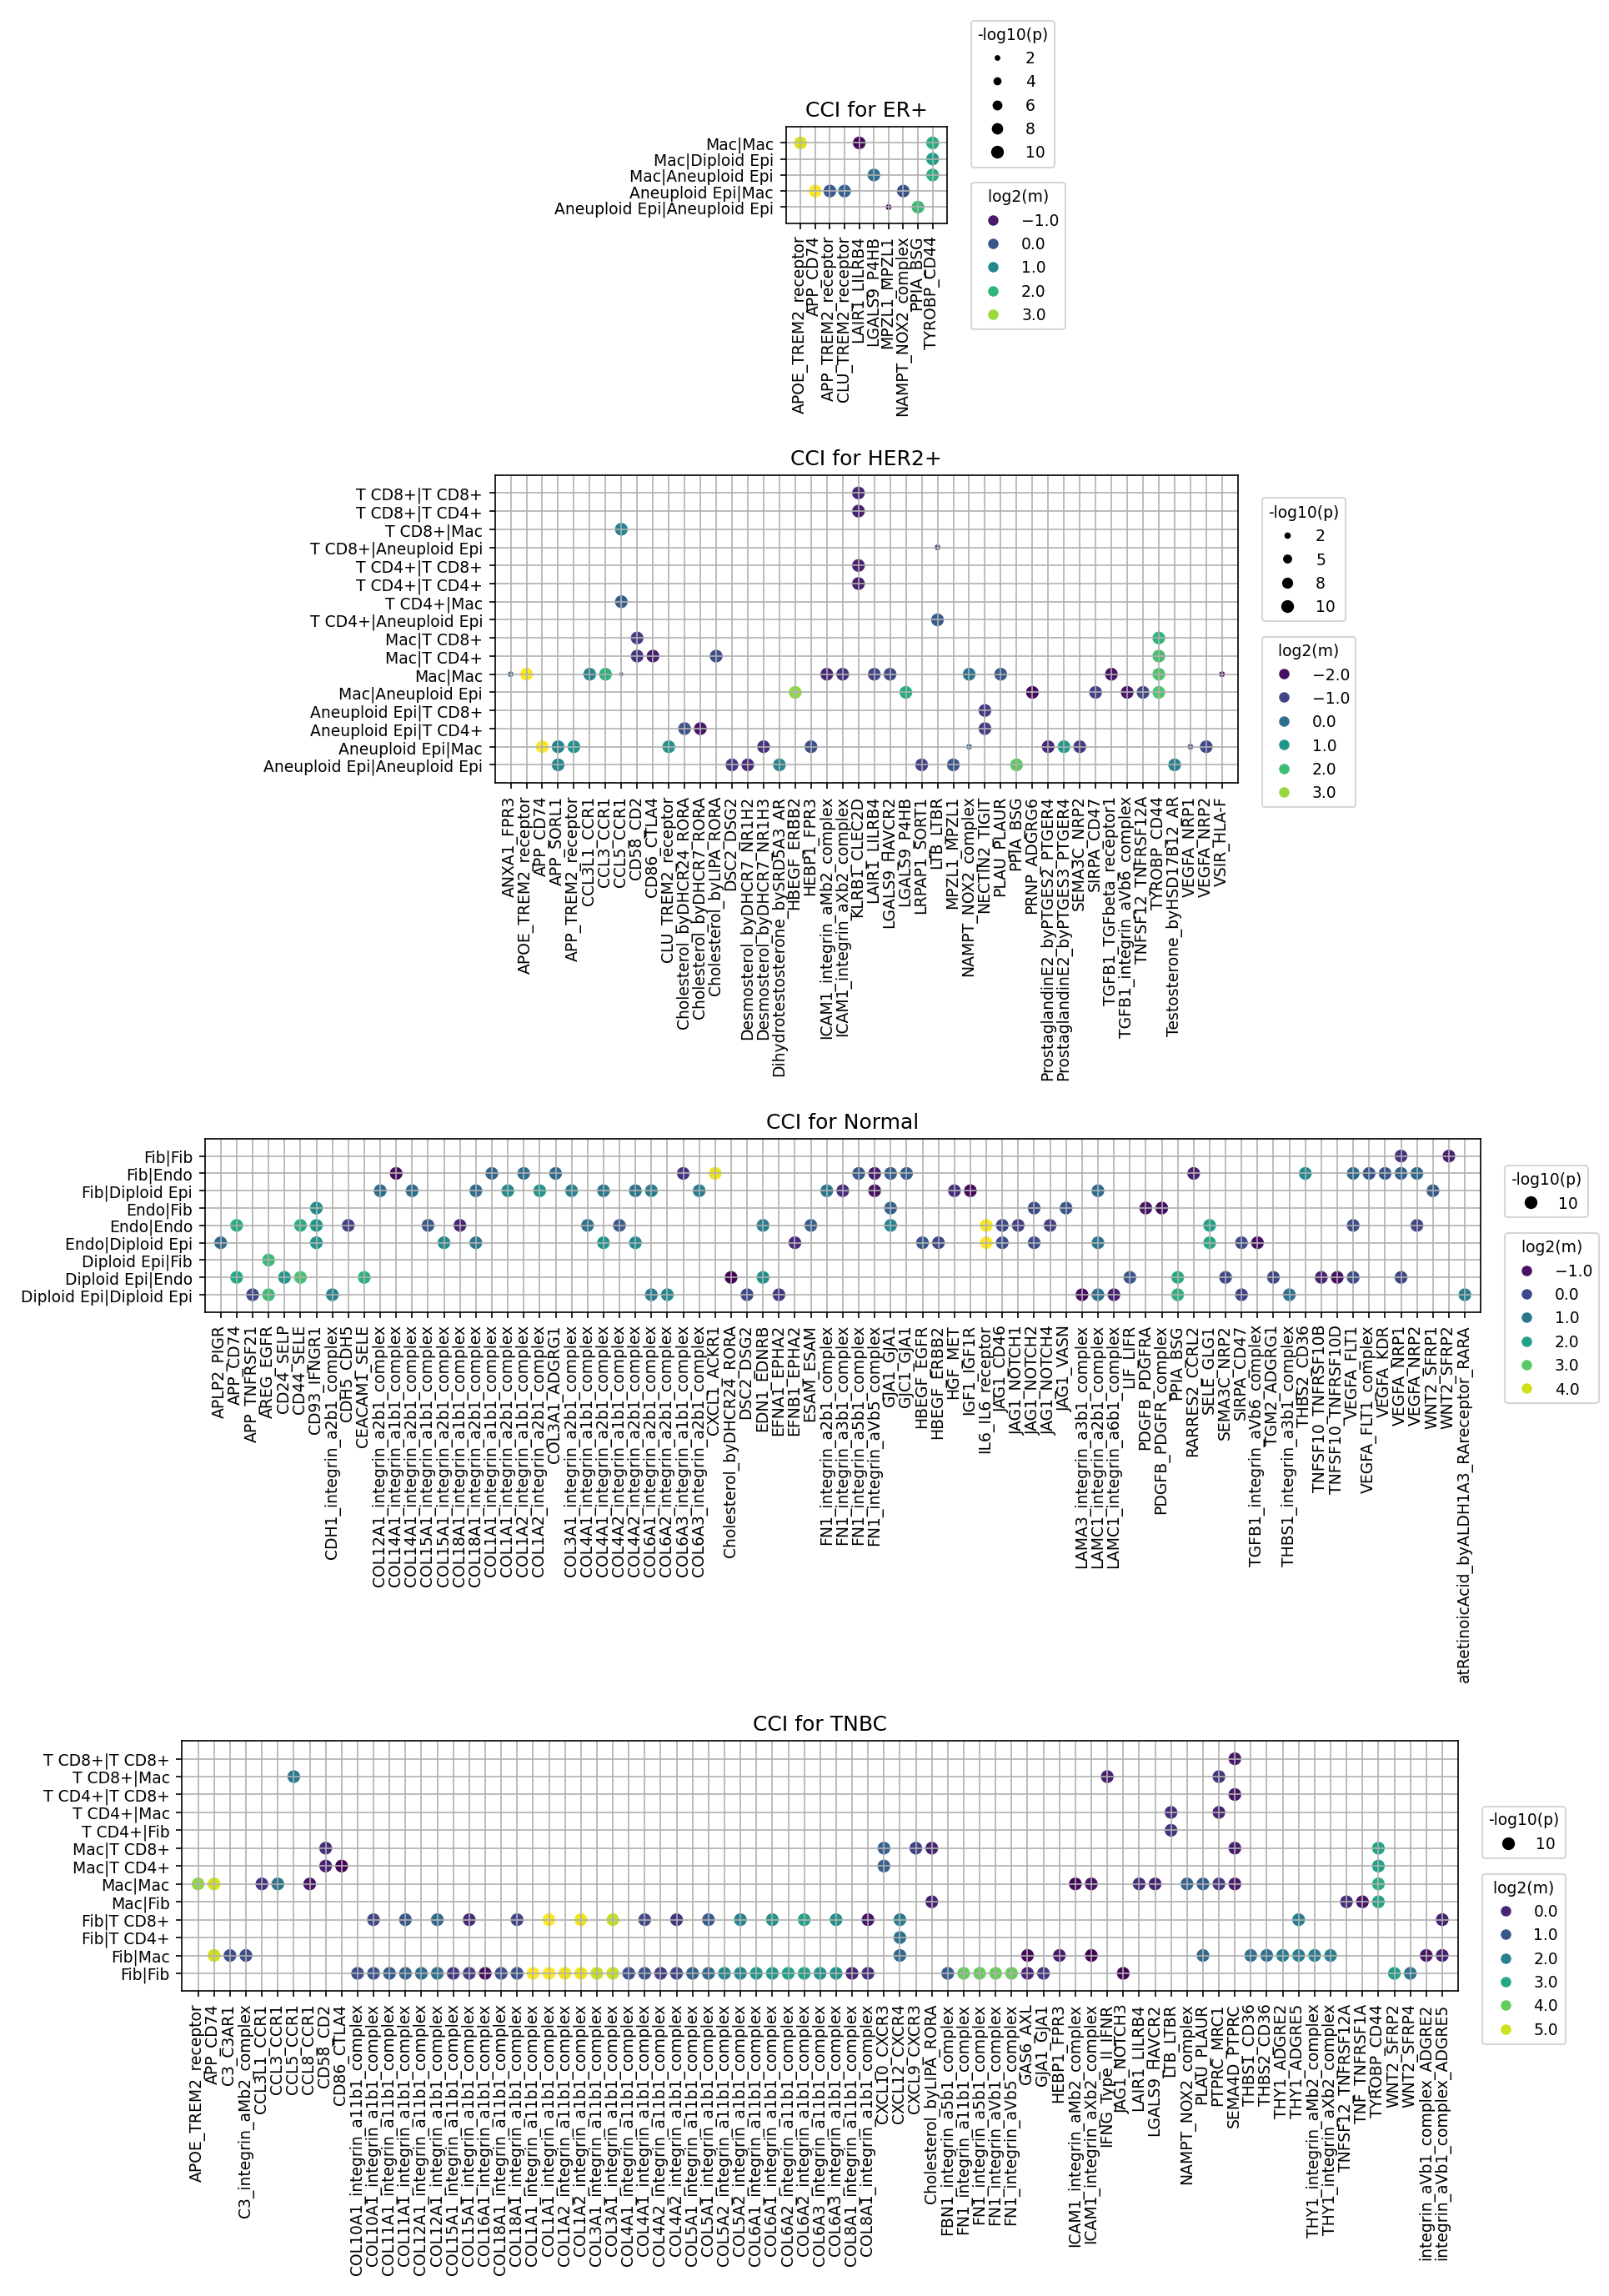
[Analysis Visualization Results]...
Analysis Overview
This analysis investigates cell-cell interaction (CCI) patterns using CellPhoneDB across various breast cancer conditions (ER+, HER2+, TNBC) and Normal breast tissue. The focus is on interactions involving key cell types within the tumor microenvironment: Epithelial cells (categorized by ploidy as Diploid Epi or Aneuploid Epi), Fibroblasts (Fib), Macrophages (Mac), and T cells (T CD4+, T CD8+). The dot plots display the significance (-log10(p-value), dot size) and strength (log2(mean expression), dot color) of ligand-receptor interactions.
Visual Summary
The visualizations reveal distinct and progressively more complex cell-cell interaction landscapes from Normal tissue to ER+, HER2+, and TNBC subtypes.
- Normal Tissue (CCI for Normal): Interactions are primarily restricted to Fibroblasts and Diploid Epithelial cells, characterized by strong extracellular matrix (ECM) components like various Collagen/Integrin, Fibronectin/Integrin, and Laminin/Integrin complexes. Basic growth factor signaling (IGF1, WNT2) is also observed, reflecting tissue homeostasis. Immune cell interactions are notably absent.
- ER+ Breast Cancer (CCI for ER+): This subtype shows interactions predominantly between Macrophages and Aneuploid Epithelial cells. Key signals involve macrophage activation (APOE/APP/CLU-TREM2_receptor, APP_CD74, TYROBP_CD44), inhibitory immune signaling (LAIR1_LILRB4, LGALS9_P4HB), and general inflammatory/proliferative pathways (NAMPT_NOX2_complex, PPIA_BSG). T cell involvement is minimal.
- HER2+ Breast Cancer (CCI for HER2+): Presents a significantly broader and more intense interaction network compared to ER+. Aneuploid Epithelial cells engage extensively with both T cells and Macrophages. Notably, direct HER2 pathway components (ERBB2_NRG1, ERBB3_EREG) are highly active within Aneuploid Epithelial cells. Immune evasion mechanisms are prominent, including PVR_TIGIT, NECTIN4_PVRIG, VSIR_HLA-F, and the "don't eat me" signal SIRPA_CD47, alongside immunosuppressive TGFB1_TGFbeta_receptor interactions. Co-stimulatory signals (CD28_CD80/CD86) are also active within T cell populations. Angiogenesis (VEGFA) and cholesterol metabolism pathways are also evident.
- TNBC (CCI for TNBC): Displays the most intricate and widespread interaction network, involving all queried cell types (Aneuploid Epithelial cells, Fibroblasts, Macrophages, T cells). The tumor microenvironment is characterized by:
- Extensive ECM Remodeling: Numerous Collagen/Integrin and Fibronectin/Integrin interactions, particularly strong between Fibroblasts, Macrophages, and Aneuploid Epithelial cells.
- Profound Immune Evasion: Widespread and robust immune checkpoint interactions (PVR_TIGIT, CD86_CTLA4, LAIR1_LILRB4, LGALS9) and highly active SIRPA_CD47 signaling across nearly all cell pair combinations.
- Immunosuppression and Inflammation: Pervasive and strong TGFB1_TGFbeta_receptor interactions, active CXCL12_CXCR4/CXCR7 axes, and prominent SPP1-CD44/Integrin signaling.
- Active Macrophage and T cell Responses: Chemokine signaling (CCL3/4-CCR1/5) indicates immune cell recruitment, while co-stimulatory (CD28) and inhibitory signals highlight the complex immune modulation.
Biological Interpretation
The observed CCI patterns offer critical insights into the distinct biological characteristics of each breast cancer subtype:
- Normal Tissue Homeostasis: The Normal tissue interactions are dominated by structural and maintenance signals, emphasizing the role of Fibroblasts and Epithelial cells in maintaining tissue integrity and basic cellular functions through ECM-receptor binding (e.g., various integrins binding collagens, fibronectin, laminins) and growth factor signaling. This serves as a crucial baseline, showing absence of significant immune cell infiltration or tumor-promoting interactions.
- ER+ - Macrophage-Centric Microenvironment: In ER+ breast cancer, the tumor microenvironment appears to be significantly shaped by macrophage activity. The strong presence of TREM2-ligand interactions (APOE, APP, CLU) suggests activation of tumor-associated macrophages (TAMs), which can drive tumor growth, angiogenesis, and immune suppression [PMID: 35140306]. Inhibitory signals like LAIR1_LILRB4 and LGALS9_P4HB further point towards an immunosuppressive role for these macrophages. The relative lack of T cell interactions suggests a "cold" or immune-excluded microenvironment, characteristic of some ER+ tumors.
- HER2+ - Integrated Tumor-Immune-Angiogenic Microenvironment: HER2+ breast cancer displays a highly active and integrated microenvironment, reflecting its aggressive nature. The direct engagement of HER2 pathway components (ERBB2, ERBB3) within Aneuploid Epithelial cells underscores the oncogenic drive of this subtype. The extensive interactions between Aneuploid Epithelial cells, T cells, and Macrophages, encompassing both co-stimulatory (CD28-CD80/86) and a multitude of immune checkpoint pathways (PVR_TIGIT, NECTIN4_PVRIG, VSIR_HLA-F, SIRPA_CD47, TGFB1), suggests a complex immune response that is simultaneously activated and suppressed by the tumor. The robust VEGFA signaling highlights active angiogenesis, crucial for tumor growth and metastasis. Altered cholesterol metabolism pathways further connect to tumor cell and immune cell reprogramming [PMID: 36774619].
- TNBC - Desmoplastic, Highly Immunosuppressive, and Invasive Microenvironment: TNBC exhibits the most aggressive and complex interaction profile, indicative of a highly malignant and immunosuppressive tumor microenvironment. The pronounced ECM remodeling via numerous collagen and fibronectin-integrin interactions, largely driven by Fibroblasts and Macrophages, points to a desmoplastic stroma that facilitates invasion and metastasis [PMID: 32747754]. The pervasive nature of immune evasion mechanisms, including multiple checkpoint axes (PVR_TIGIT, CTLA4) and especially the "don't eat me" signal SIRPA_CD47 across diverse cell types, strongly indicates active suppression of anti-tumor immunity. The ubiquitous and strong TGFB1 signaling is a hallmark of immunosuppression and fibrogenesis in cancer [PMID: 32665809]. The CXCL12-CXCR4 axis is well-known for its roles in tumor growth, metastasis, and recruitment of immunosuppressive cells [PMID: 32908020]. SPP1 (Osteopontin) interactions further reinforce its role in promoting tumor progression, inflammation, and immune modulation in TNBC [PMID: 32152331].
Clinical or Translational Implications
The detailed CCI maps provide actionable insights for therapeutic targeting and experimental validation:
- ER+ Targeted Therapies: For ER+ tumors, modulating macrophage activity could be a promising therapeutic strategy. Targeting TREM2 or its ligands, or blocking inhibitory receptors like LAIR1/LILRB4 on macrophages, could potentially reprogram TAMs towards an anti-tumor phenotype. Given the relatively "cold" immune environment, combination therapies focusing on macrophage modulation alongside endocrine therapy could be explored.
- HER2+ Immunotherapy and Angiogenesis: Beyond existing anti-HER2 therapies, the strong presence of multiple immune checkpoints (PVR_TIGIT, NECTIN4_PVRIG, VSIR_HLA-F) suggests that combining anti-HER2 treatments with novel immunotherapies targeting these axes could enhance anti-tumor responses. SIRPA-CD47 blockade, which aims to overcome phagocytosis resistance, is also a highly relevant strategy for HER2+ [PubMed Search: SIRPA CD47 cancer immunotherapy]. Furthermore, the active VEGFA signaling reinforces the potential utility of anti-angiogenic agents.
- TNBC - Multifaceted Immunotherapy and Stromal Targeting: TNBC presents numerous opportunities for combination therapies due to its highly complex and immunosuppressive TME.
- Immune Checkpoint Blockade: The extensive involvement of PVR-TIGIT, CTLA4, and other inhibitory pathways supports the continued development and combination of immunotherapies targeting these checkpoints.
- SIRPA-CD47 Blockade: Given its pervasive activity, CD47 inhibition has very strong rationale in TNBC to unleash macrophage-mediated phagocytosis.
- TGFB1 Inhibition: The widespread and strong TGFB1 signaling makes it a prime therapeutic target to reduce immunosuppression, remodel the ECM, and enhance the efficacy of other treatments [PubMed Search: TGFB1 inhibitor TNBC].
- CXCL12-CXCR4/CXCR7 Axis: Targeting this axis could disrupt critical signaling for tumor growth, metastasis, and recruitment of immunosuppressive cells.
- SPP1-CD44/Integrin Inhibition: Modulating this axis could reduce inflammation and tumor progression, especially in the context of metastatic disease [GeneCards: SPP1].
- Stromal Reprogramming: The prominent ECM remodeling highlights the potential for therapies that target CAFs or ECM components to improve drug delivery and reduce metastasis.
In summary, this CCI analysis provides a comprehensive overview of the intercellular communication networks in different breast cancer subtypes, highlighting key ligand-receptor interactions that could serve as diagnostic markers or therapeutic targets. Further experimental validation of these interactions could pave the way for novel therapeutic strategies, especially in the challenging context of HER2+ and TNBC.
13. Cell-Cell Interaction Analysis of Immune Checkpoint and Cell Cycle Pathway Genes in Breast Cancer Subtypes
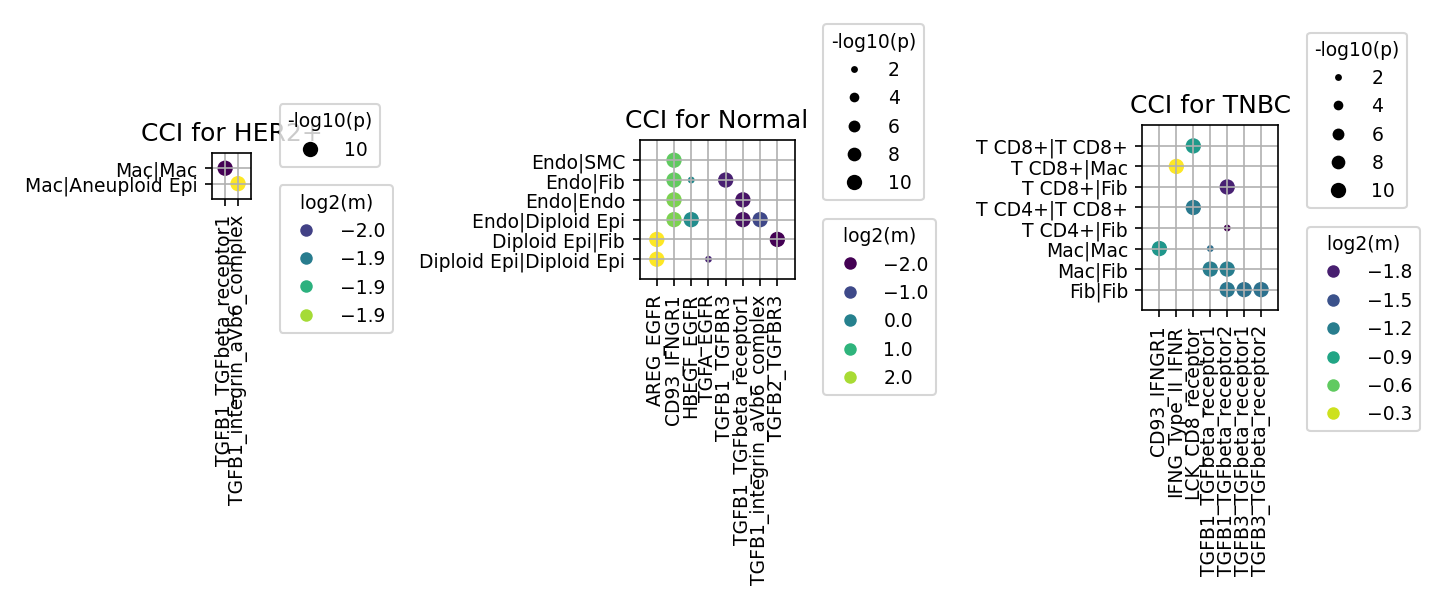
[Analysis Visualization Results]...
Analysis Overview
This analysis visualizes cell-cell interactions (CCI) using CellPhoneDB for a pre-selected set of genes associated with immune checkpoint and cell cycle pathways. The interactions are examined across different breast cancer conditions (ER+, HER2+, TNBC) and compared to normal breast tissue. The plot_cci_dots tool displays significant ligand-receptor interactions between specified cell types. In these plots, the size of each dot indicates the statistical significance (-log10(p-value)) of the interaction, while its color represents the log2-transformed mean expression of the ligand-receptor pair. This analysis aims to identify distinct communication patterns within the tumor microenvironment (TME) that may underpin subtype-specific biological behaviors and therapeutic vulnerabilities.
Visual Summary
General Observations
- Normal Tissue (Normal): The CCI profile in normal breast tissue is characterized by extensive interactions primarily involving extracellular matrix (ECM) components (e.g., various Collagen-Integrin complexes, Fibronectin-Integrin complexes) and growth factors (e.g., PDGFB-PDGF receptor, TGFB1-TGFB receptor). These interactions predominantly occur between stromal cells (Fibroblasts, Endothelial cells, Smooth Muscle cells) and Diploid Epithelial cells, reflecting structural and homeostatic functions. Immune checkpoint-related interactions are notably scarce, consistent with a healthy, non-inflamed tissue microenvironment.
- Cancer Subtypes (ER+, HER2+, TNBC): In stark contrast to normal tissue, all three breast cancer subtypes show a significant shift in the composition of interacting cell types. There is a prominent involvement of "Aneuploid Epithelial" cells (likely tumor cells) and an increased presence of various immune cells, including Macrophages, T CD4+ cells, and T CD8+ cells. The interaction landscapes become markedly more complex, featuring numerous immune checkpoint, inflammatory, and oncogenic signaling pathways.
Condition-Specific Highlights
ER+ Breast Cancer
- Interactions are largely concentrated between Macrophages (Mac) and Aneuploid Epithelial cells (Aneuploid Epi), as well as within Macrophage populations (Mac|Mac).
- Key interactions include those involving TREM2 receptor (e.g., APOE_TREM2_receptor, APP_TREM2_receptor, CLU_TREM2_receptor) and CD74 (e.g., APP_CD74), primarily with Macrophages. This suggests a significant role for TREM2-expressing macrophages in the ER+ TME.
- The inhibitory receptor pair LAIR1_LILRB4 is also observed in macrophage self-interactions and with diploid epithelial cells, indicating potential immune suppressive mechanisms.
- PPIA_BSG (CD147) and TYROBP_CD44 interactions are also notable between Macrophages and Aneuploid Epithelial cells.
HER2+ Breast Cancer
- This subtype exhibits a very rich and diverse array of interactions among T cells (CD8+, CD4+), Macrophages, and Aneuploid Epithelial cells.
- Growth Factor Signaling: Robust interactions involving EGFR ligands (EGF_EGFR, HBEGF_EGFR, EREG_EGFR) are highly prominent, especially in Aneuploid Epi self-interactions and with Macrophages. This is consistent with the known oncogenic driver role of EGFR/HER2 pathways in HER2+ cancer.
- Immune Checkpoint: The inhibitory CD86_CTLA4 interaction is observed between T cells (CD8+, CD4+) and Aneuploid Epithelial cells, indicating a potential mechanism for T cell anergy or exhaustion.
- Chemokine Signaling: Active chemokine-receptor interactions such as CCL3L1_CCR1, CCL3_CCR1, and CCL4_CCR1 are frequently observed among Macrophages and T cells, suggesting active recruitment and communication of immune cells within the TME.
- TGF-beta Signaling: TGFB1_TGFB_receptor interactions are widespread across tumor and immune cells, implying a potentially immunosuppressive microenvironment.
- Angiogenesis: Interactions involving VEGFA_NRP1 and VEGFA_NRP2 are present, particularly among Aneuploid Epithelial cells, indicative of active angiogenesis.
TNBC Breast Cancer
- TNBC demonstrates a highly immune-active and inflammatory microenvironment with extensive interactions involving T cells (CD8+, CD4+), Macrophages, Fibroblasts, and Aneuploid Epithelial cells.
- Prominent Immune Checkpoint Activation: Crucially, PD-L1 (CD274) interactions (CD274_CD80, CD274_CD28) are highly prominent. These interactions engage T cells (CD8+, CD4+), Macrophages, Fibroblasts, and Aneuploid Epithelial cells, highlighting a strong activation of the PD-1/PD-L1 axis within the TNBC microenvironment.
- The CD86_CTLA4 interaction is also observed, similar to HER2+, suggesting additional immune evasion pathways.
- Chemokine Signaling: Strong CCL and CXCL mediated interactions (e.g., CCL3/4-CCR1, CXCL10-CXCR3, CXCL12-CXCR4) are pervasive across multiple cell types, indicating dynamic immune cell trafficking and communication.
- TGF-beta Signaling: Similar to HER2+, TGFB1_TGFB_receptor and TGFB3_TGFB_receptor interactions are broadly observed, likely contributing to immunosuppression and fibrosis.
- MET Signaling: MET_MET self-interaction is particularly strong in Aneuploid Epithelial cells, suggesting active MET pathway signaling, which is associated with proliferation and metastasis in TNBC.
Biological Interpretation
The analysis unveils profound and subtype-specific alterations in cell-cell communication within the breast cancer microenvironment compared to normal tissue. These changes are crucial for understanding disease progression and designing targeted therapies.
- Tumor Microenvironment Rewiring: The stark contrast between the structured ECM interactions in normal tissue and the immune-rich, growth factor-driven milieu in cancer subtypes underscores the extensive remodeling of the TME. The consistent involvement of aneuploid epithelial cells and diverse immune populations highlights how tumor cells co-opt stromal and immune cells to foster their growth and evade detection.
- Diverse Immune Evasion Strategies:
- PD-L1 Axis in TNBC: The prominent CD274 (PD-L1) interactions in TNBC with T cells, macrophages, and fibroblasts signify the active engagement of the PD-1/PD-L1 pathway, a primary mechanism by which tumors induce T cell exhaustion and suppress anti-tumor immunity [1]. This observation strongly supports the clinical rationale for PD-1/PD-L1 blockade in TNBC.
- CTLA-4 Pathway in HER2+ and TNBC: The CD86_CTLA4 interaction in both HER2+ and TNBC indicates another critical inhibitory checkpoint pathway. CTLA-4 expressed on T cells dampens T cell activation by outcompeting CD28 for CD80/CD86 binding, leading to immune tolerance [2].
- Macrophage-Mediated Suppression (ER+, HER2+): The prevalence of TREM2_receptor interactions (with APOE, APP, CLU) in ER+ and HER2+ tumors suggests a significant role for TREM2-expressing macrophages. These macrophages are often associated with a pro-tumorigenic and immunosuppressive phenotype, contributing to tumor growth and metastasis [3].
- Myeloid Cell Inhibition (ER+): The LAIR1_LILRB4 interaction in ER+ could represent another pathway of myeloid cell-mediated immune suppression, further highlighting the complex interplay of inhibitory signals within the TME.
- Oncogenic Signaling Driving Subtype-Specific Biology:
- EGFR Pathway Activation in HER2+: The robust EGF_EGFR, HBEGF_EGFR, and EREG_EGFR interactions in HER2+ are a hallmark of this subtype, indicating constitutive activation of the EGFR/HER2 signaling pathway, which drives cell proliferation and survival. This reinforces the importance of therapies targeting this pathway [4].
- MET Signaling in TNBC: The strong MET_MET self-interaction among aneuploid epithelial cells in TNBC points to active MET pathway signaling. This pathway is implicated in cell growth, survival, and metastasis and can contribute to aggressive behavior in TNBC [5].
- Pro-Tumorigenic Microenvironment Dynamics:
- TGF-beta Signaling: Elevated TGFB_TGFB_receptor interactions across HER2+ and TNBC underscore the pervasive role of TGF-beta. It acts as a potent immunosuppressor, promotes epithelial-mesenchymal transition (EMT), enhances angiogenesis, and drives fibrosis, all contributing to tumor progression and resistance to therapy [6].
- Chemokine Networks: The diverse CCL/CXCL-CCR/CXCR interactions in HER2+ and TNBC orchestrate the recruitment and positioning of various immune and stromal cells within the TME. These gradients can influence the balance between pro- and anti-tumor immunity, promoting either tumor growth or immune surveillance depending on the specific chemokine axes involved [7].
Clinical or Translational Implications
The distinct CCI patterns uncovered in this analysis provide critical insights for the development of more precise diagnostic and therapeutic strategies in breast cancer.
Optimizing Immune Checkpoint Blockade
- The clear evidence of CD274 (PD-L1) interactions in TNBC provides strong support for the continued and refined application of PD-1/PD-L1 inhibitors. Further research into the specific cellular sources and targets of PD-L1 within the TNBC TME could improve patient selection and treatment efficacy.
- The presence of CD86_CTLA4 interactions in both HER2+ and TNBC suggests that combination therapies involving CTLA-4 inhibitors, potentially alongside PD-1/PD-L1 blockade, could offer enhanced therapeutic benefits by targeting complementary immune evasion pathways.
- Targeting Tumor-Associated Macrophages (TAMs): The prominent TREM2_receptor interactions in ER+ and HER2+ tumors highlight TAMs as promising therapeutic targets. Strategies aimed at depleting pro-tumorigenic TREM2+ macrophages, reprogramming their phenotype, or blocking their specific interactions could enhance anti-tumor immunity and improve responses to existing therapies in these subtypes.
Rational Combination Therapies
- For HER2+ disease, the co-occurrence of strong EGFR-family signaling with immune checkpoint and TGF-beta interactions suggests that combining HER2-targeted therapies with immunotherapies or TGF-beta inhibitors could overcome resistance mechanisms and improve patient outcomes.
- In TNBC, the extensive interplay between PD-L1, chemokine networks, and MET signaling points to a need for multi-modal approaches. Combining immune checkpoint inhibitors with agents targeting chemokine receptors or the MET pathway could disrupt multiple pro-tumorigenic axes simultaneously.
- Biomarker Identification: The identified subtype-specific ligand-receptor pairs (e.g., specific TREM2 interactions in ER+, EGFR interactions in HER2+, CD274 interactions in TNBC) could serve as valuable diagnostic or prognostic biomarkers. Their expression or interaction strength could potentially be used to stratify patients for specific targeted therapies or predict response.
- Pre-clinical Validation: These findings establish a strong foundation for further experimental validation in relevant in vitro and in vivo models. Functional studies are crucial to confirm the causal role of these specific cell-cell interactions in breast cancer progression, immune modulation, and therapeutic response.
---
References:
[1] Ribas, A., & Wolchok, J. D. (2018). Cancer immunotherapy using checkpoint blockade. *Science*, 359(6382), 1350-1355. PubMed search: "cancer immunotherapy checkpoint blockade"
[2] Pardoll, D. M. (2012). The blockade of immune checkpoints in cancer immunotherapy. *Nature Reviews Cancer*, 12(4), 252-264. PubMed search: "immune checkpoints cancer immunotherapy"
[3] Wu, J., & Li, R. (2020). The role of TREM2 in tumor immunity. *Frontiers in Immunology*, 11, 2197. PubMed search: "TREM2 tumor immunity"
[4] Yarden, Y. (2001). The EGFR family and its signaling network. *Experimental Cell Research*, 264(1), 1-16. GeneCards: EGFR
[5] Gherardi, E., et al. (2012). The MET signalling pathway in cancer. *Nature Reviews Cancer*, 12(2), 89-103. GeneCards: MET
[6] Massagué, J. (2008). TGFbeta in Cancer. *Cell*, 134(2), 215-230. PubMed search: "TGFbeta cancer immunity"
[7] Mantovani, A., et al. (2006). The chemokine system in cancer biology and therapy. *Immunity*, 25(5), 717-730. PubMed search: "chemokines cancer microenvironment"
14. Condition-Specific Cell-Cell Interaction Patterns in Breast Cancer Subtypes
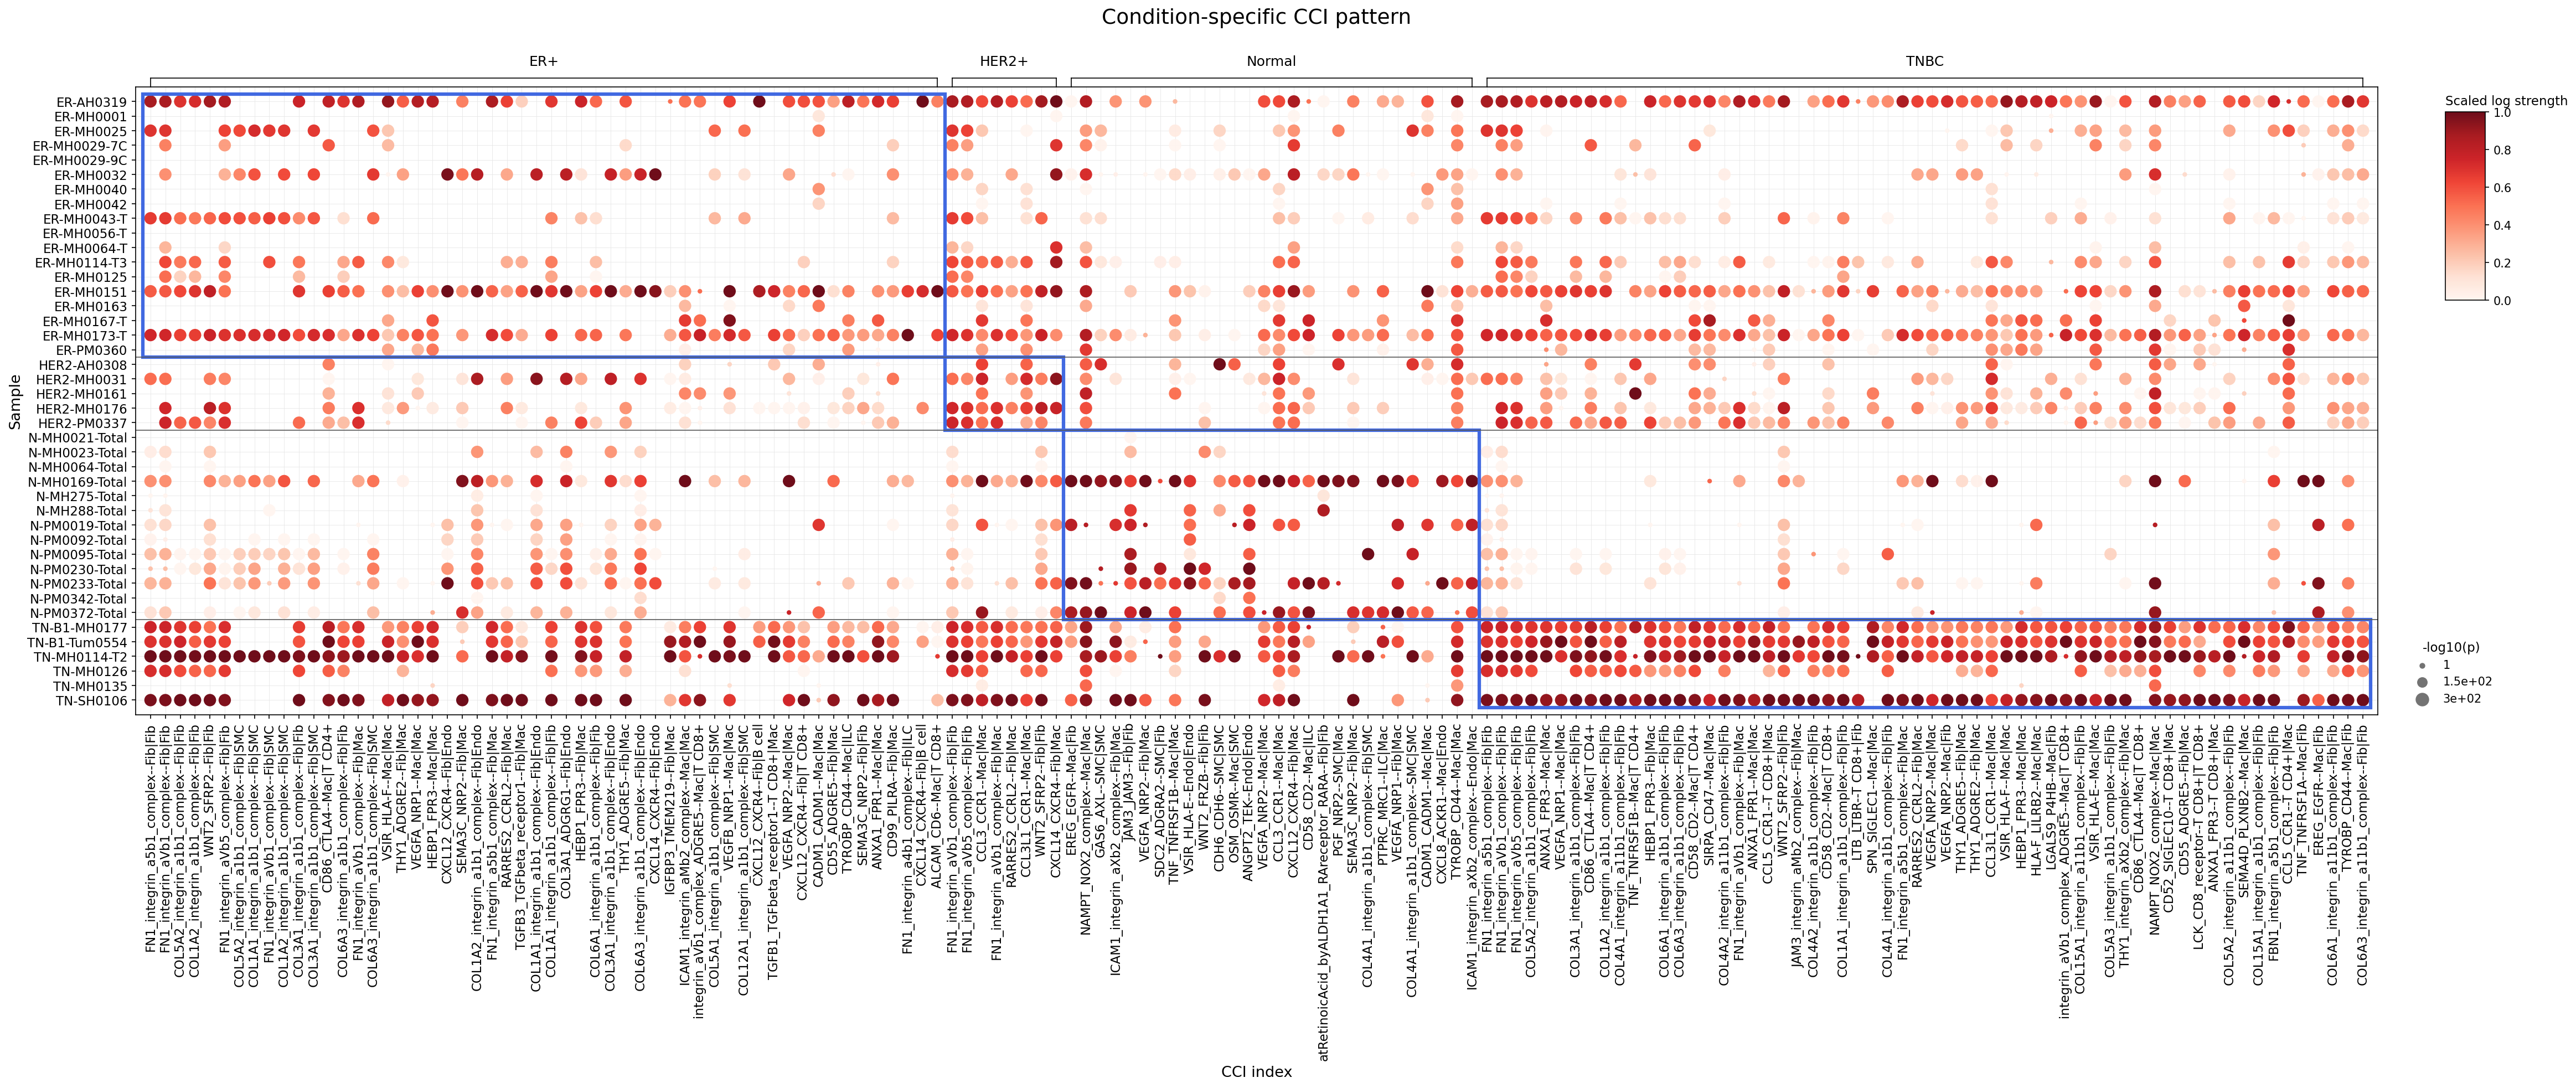
[Analysis Visualization Results]...
Analysis Overview
This analysis investigates condition-specific cell-cell interaction (CCI) patterns involving major immune and stromal cell types across different breast cancer subtypes (ER+, HER2+, TNBC) and normal breast tissue. The results are presented as a dot plot, where each dot represents a specific ligand-receptor pair interaction between two cell types. The size of the dot corresponds to the statistical significance (-log10(p-value)), and the color intensity reflects the scaled interaction strength. The analysis highlights key differences in the tumor microenvironment (TME) composition and communication across breast cancer conditions.
Visual Summary
The dot plot visualizes a comprehensive matrix of cell-cell interactions, with samples grouped by condition on the Y-axis and specific CCI pairs on the X-axis.
- Overall Pattern: There is a clear distinction in CCI activity between normal samples and breast cancer subtypes. Cancer conditions (ER+, HER2+, TNBC) exhibit a substantially higher frequency, strength, and significance of interactions compared to normal tissue.
- Normal Condition: Samples from the "Normal" group generally display fewer and less intense interactions. While some interactions are present, they are typically weaker (lighter red dots) and less significant (smaller dots) compared to the tumor samples. This suggests a less active and less remodeled microenvironment in healthy tissue.
Cancer Subtypes
- ER+: This group shows a notable increase in strong interactions, particularly involving Fibroblast-Fibroblast and Fibroblast-Macrophage communication, often mediated by various integrin-extracellular matrix (ECM) components like Fibronectin (FN1) and multiple Collagen (COL) types.
- HER2+: Similar to ER+, HER2+ samples display robust integrin-ECM interactions. Additionally, interactions involving VEGFA-Neuropilin (NRP) between Macrophages and Endothelial cells are prominent, suggesting active angiogenesis.
- TNBC: Samples classified as TNBC exhibit the most extensive and strongest CCI patterns. A broad spectrum of interactions, including ECM-integrin, chemokine (e.g., CXCL12-CXCR4, CCL3-CCR1), adhesion molecules (e.g., ICAM1-integrin_aM_b2, CD58-CD2), and immune checkpoints (e.g., CD86-CTLA4), are highly active. This indicates a profoundly dynamic and complex TME in TNBC.
Biological Interpretation
The observed condition-specific CCI patterns provide critical insights into the biological processes driving breast cancer progression in different subtypes, focusing on immune and stromal cell crosstalk.
- ECM Remodeling and Fibroblast Activation:
- Interactions: Multiple interactions involving various collagens (COL1A1, COL3A1, COL4A1, COL5A1, COL6A1) and Fibronectin (FN1) binding to different integrin complexes (e.g., integrin_a1b1, integrin_a5b1) within Fibroblast-Fibroblast and Fibroblast-Macrophage pairs are consistently strong across all cancer subtypes (ER+, HER2+, TNBC), but significantly reduced in normal tissue.
- Mechanism: These interactions are central to ECM remodeling, tissue stiffness, and the activation of cancer-associated fibroblasts (CAFs). Integrin signaling mediates cell adhesion, migration, and survival, and also senses mechanical cues from the ECM.
- Relevance to Breast Cancer: In breast cancer, activated fibroblasts and altered ECM composition (desmoplasia) promote tumor growth, invasion, and metastasis, and can contribute to therapeutic resistance. GeneCards: FN1 PubMed search: Collagen integrin breast cancer fibroblast
- Immune Cell Recruitment and Modulation:
- Chemokine Axes (CXCL12-CXCR4, CCL3/CCL3L1-CCR1, CCRL2): These interactions, particularly prominent in TNBC, involve Fibroblasts, Macrophages, and Endothelial cells.
- Mechanism: Chemokines such as CXCL12 (SDF-1) and CCL3/CCL3L1 recruit immune cells expressing their respective receptors (CXCR4, CCR1) to the TME, influencing immune cell trafficking and polarization.
- Relevance to Breast Cancer: The CXCL12-CXCR4 axis is a well-known pathway promoting angiogenesis, metastasis, and the recruitment of immune suppressive cells. GeneCards: CXCL12 GeneCards: CXCR4 Chemokines like CCL3 can attract pro-tumorigenic macrophages (TAMs), further shaping an immunosuppressive environment.
- Adhesion Molecules (ICAM1-integrin_aM_b2, CD58-CD2): These are observed in cancer subtypes, facilitating interactions between Fibroblasts/Macrophages and T cells.
- Mechanism: ICAM1 and CD58 are adhesion molecules that mediate cell-cell contact, crucial for immune cell extravasation, antigen presentation, and T cell activation or regulation.
- Relevance to Breast Cancer: Upregulation of these molecules in the TME can facilitate the infiltration and interaction of immune cells, including TAMs, influencing their function within the tumor.
- Chemokine Axes (CXCL12-CXCR4, CCL3/CCL3L1-CCR1, CCRL2): These interactions, particularly prominent in TNBC, involve Fibroblasts, Macrophages, and Endothelial cells.
- Immune Checkpoint Pathways:
- CD86-CTLA4--Mac|T CD4+: This interaction is distinctly observed across cancer subtypes, notably in TNBC.
- Mechanism: CD86, expressed on antigen-presenting cells like macrophages, binds to CTLA4 on T cells (especially CD4+ T cells, including Tregs), delivering an inhibitory signal that dampens T cell activation and promotes immune tolerance.
- Relevance to Breast Cancer: This is a critical immune checkpoint pathway contributing to immune evasion in the TME, allowing tumor cells to escape destruction by the immune system. GeneCards: CTLA4
- CD86-CTLA4--Mac|T CD4+: This interaction is distinctly observed across cancer subtypes, notably in TNBC.
- Angiogenesis:
- VEGFA-NRP1/NRP2: Interactions involving VEGFA with Neuropilins (NRP1, NRP2) on Macrophages and Endothelial cells are particularly visible in HER2+ and TNBC.
- Mechanism: VEGFA is a potent angiogenic factor, and NRPs act as co-receptors, enhancing VEGFA signaling to promote the formation of new blood vessels.
- Relevance to Breast Cancer: Tumor angiogenesis is essential for providing nutrients and oxygen to rapidly growing tumors and facilitating metastasis. Macrophages can be key producers of pro-angiogenic factors like VEGFA. PubMed search: VEGFA Neuropilin breast cancer angiogenesis
- VEGFA-NRP1/NRP2: Interactions involving VEGFA with Neuropilins (NRP1, NRP2) on Macrophages and Endothelial cells are particularly visible in HER2+ and TNBC.
Clinical or Translational Implications
The significant and condition-specific CCI patterns revealed by this analysis offer several promising avenues for therapeutic intervention in breast cancer.
- Targeting ECM Remodeling and CAFs:
- Potential: Disrupting integrin-ECM interactions (e.g., FN1-integrin, Collagen-integrin) could inhibit CAF activation, reduce desmoplasia, and prevent tumor invasion and metastasis, potentially also improving drug delivery by normalizing the TME.
Therapeutic Agents
- Integrin inhibitors: Drugs like cilengitide (targeting αvβ3 and αvβ5 integrins) or specific antibodies against key integrin subunits (e.g., α5β1, α1β1) have been explored, though their efficacy in solid tumors requires further refinement.
- Anti-fibrotic agents: Modulators of collagen synthesis or cross-linking (e.g., LOX inhibitors like simtuzumab, although it failed in breast cancer trials, or newer agents) could reduce tumor stiffness.
- Modulating Immune Cell Recruitment:
- Potential: Blocking chemokine axes (e.g., CXCL12-CXCR4, CCL3-CCR1) could prevent the infiltration of pro-tumorigenic immune cells, such as TAMs and some T cell subsets, thereby reducing immunosuppression and tumor growth.
Therapeutic Agents
- CXCR4 antagonists: Plerixafor (AMD3100) is a clinically approved CXCR4 inhibitor used in hematologic malignancies, and other CXCR4 inhibitors are in development for solid tumors.
- CCR1 antagonists: Several CCR1 inhibitors are under investigation for inflammatory diseases and some cancers, aiming to disrupt macrophage recruitment.
- Enhancing Anti-Tumor Immunity:
- Potential: The robust CD86-CTLA4 interaction highlights the presence of immunosuppressive mechanisms. Targeting CTLA4 can unleash anti-tumor T cell responses.
Therapeutic Agents
- CTLA4 inhibitors: Ipilimumab (Yervoy) is an FDA-approved immune checkpoint inhibitor that blocks CTLA4, enhancing T cell activation and has demonstrated efficacy in various cancers, including subsets of breast cancer.
- Inhibiting Angiogenesis:
- Potential: The identified VEGFA-NRP interactions represent potential targets to curb tumor blood vessel formation, which is crucial for tumor sustenance and dissemination.
Therapeutic Agents
- VEGFA inhibitors: Bevacizumab (Avastin) is an anti-VEGFA antibody widely used to inhibit angiogenesis.
- VEGFR tyrosine kinase inhibitors (TKIs): Drugs like pazopanib or sunitinib target VEGFRs and other kinases involved in angiogenesis.
- NRP1/2 inhibitors: Small molecules or antibodies targeting Neuropilins are emerging as potential anti-angiogenic and anti-tumor agents.
The pronounced CCI activity in TNBC suggests a highly inflamed and complex TME, aligning with its typically aggressive nature but also its higher immunogenicity and potential responsiveness to immunotherapy compared to other subtypes. Further characterization of these specific interactions could lead to novel combination therapies tailored to each breast cancer subtype.
15. Epithelial Cell Surfaceome Marker Expression Across Breast Cancer Subtypes
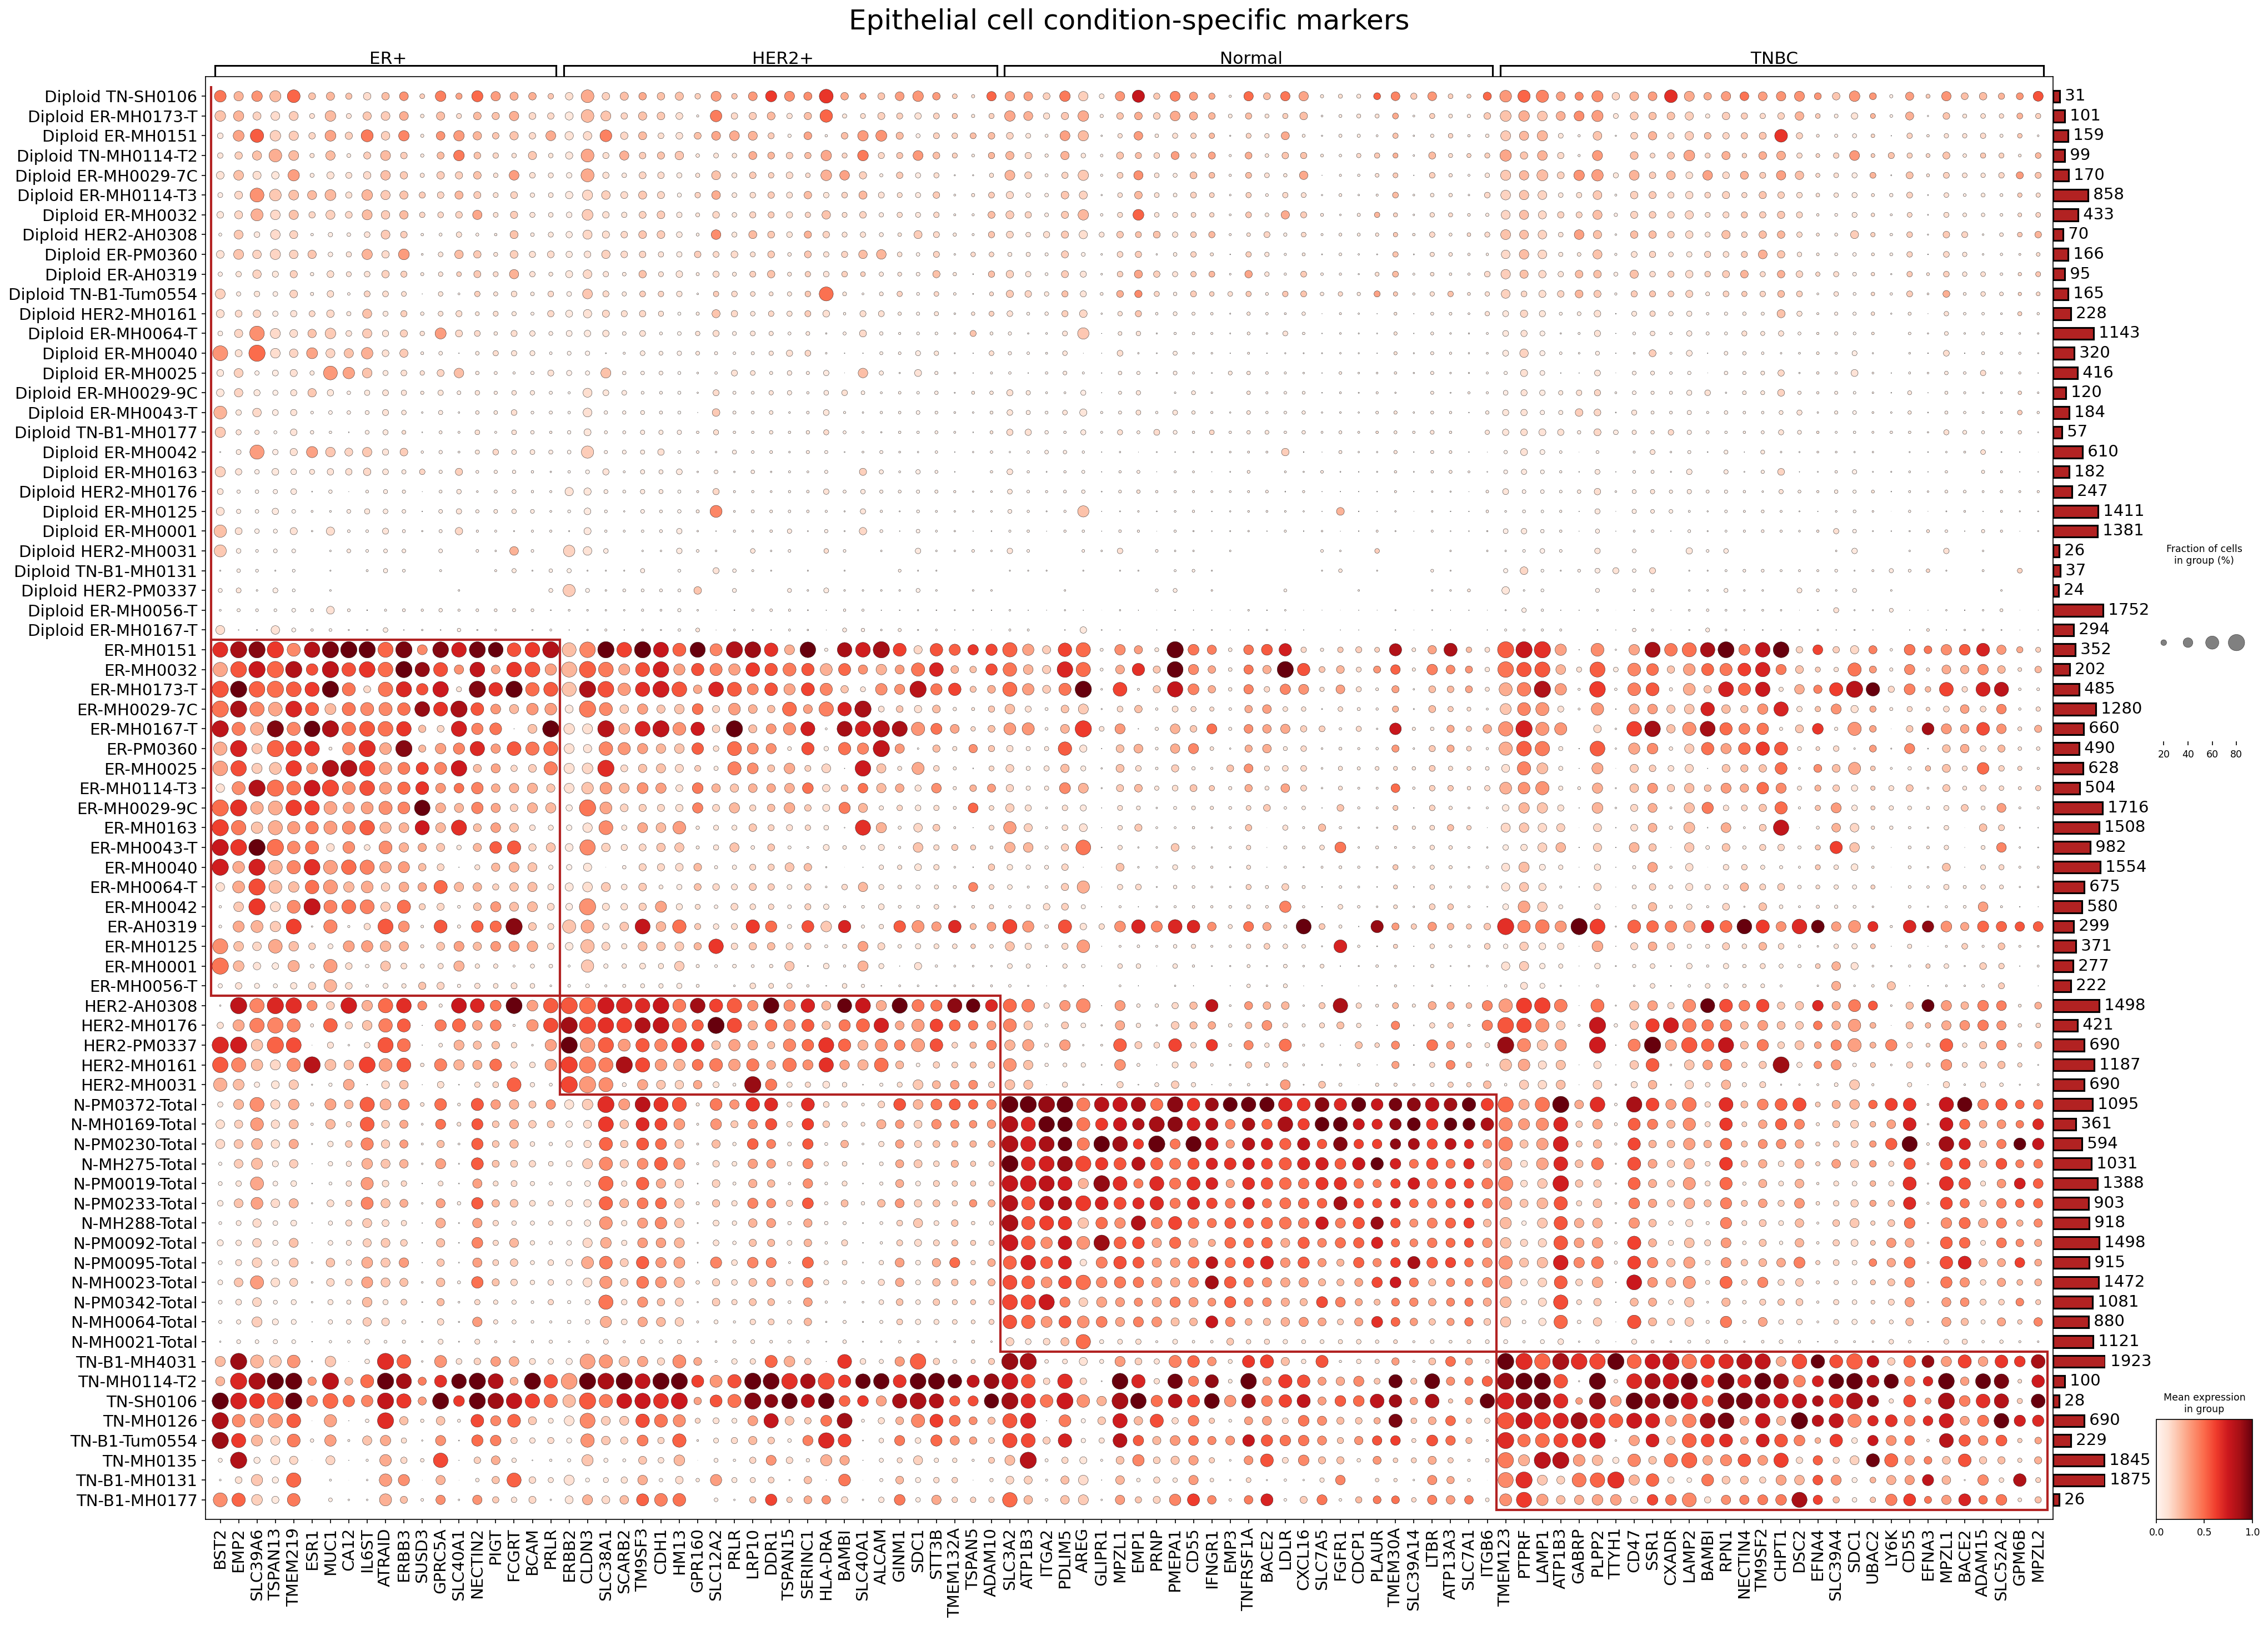
[Analysis Visualization Results]...
Analysis Overview
This analysis investigates the expression of surfaceome markers in Epithelial cells across different breast cancer conditions (ER+, HER2+, TNBC) and Normal breast tissue, based on single-cell RNA sequencing data. The goal is to identify condition-specific surface markers that could serve as established or potential therapeutic targets. The dot plot visualizes the mean expression level (color intensity) and the fraction of cells expressing each marker (dot size) for each patient sample within their respective conditions.
Visual Summary
The dot plot effectively highlights differential expression patterns of surfaceome markers across the four conditions: ER+, HER2+, Normal, and TNBC.
- Condition-Specific Expression Patterns:
- ER+ Samples: A distinct cluster of markers shows high mean expression and high fraction of expressing cells predominantly in ER+ samples (e.g., *ESR1*, *MUC1*, *ERBB3*, *AREG*). These markers are generally expressed at lower levels or in fewer cells in Normal, HER2+, and TNBC samples.
- HER2+ Samples: The defining marker *ERBB2* (HER2) exhibits very high expression and prevalence specifically in HER2+ samples. Other markers like *CDH1*, *SDC1*, and *CD47* also show elevated expression in this group.
- TNBC Samples: This subtype displays a broad, distinct set of highly expressed markers, often with high cell prevalence (e.g., *BST2*, *EMP2*, *SLC39A6*, *LY6K*, *EPHA2*, *MUC1*, *CD55*). These markers are generally less pronounced in Normal and other cancer subtypes.
- Normal Samples: In contrast to the cancer subtypes, Normal samples generally show lower mean expression and smaller fractions of cells expressing most of the identified cancer-associated markers. Markers like *CDH1* may show some expression but without the pronounced upregulation seen in certain cancer contexts.
- Pan-Cancer vs. Subtype-Specific Markers: Some markers appear highly specific to a single breast cancer subtype (e.g., *ERBB2* for HER2+, *ESR1* for ER+), while others, such as *MUC1* and *ERBB3*, show elevated expression across multiple cancer subtypes (ER+, TNBC for MUC1; ER+, HER2+, TNBC for ERBB3), indicating broader roles in breast cancer pathophysiology.
- Overall Trend: There is a clear pattern of increased expression and/or prevalence of numerous surfaceome markers in cancer cells compared to normal epithelial cells, reinforcing their potential utility as disease markers and therapeutic targets. The heterogeneity in marker expression across different patient samples within the same condition is also observable, reflecting inter-patient variability.
Biological Interpretation
The analysis reveals several surfaceome markers with significant differential expression in breast cancer epithelial cells, indicating their potential roles in disease progression and as therapeutic targets. We differentiate between established therapeutic targets and less characterized markers with potential.
Markers Elevated in ER+ Breast Cancer
- ESR1 (Estrogen Receptor 1)
- Description: *ESR1* encodes the Estrogen Receptor alpha, a ligand-activated transcription factor crucial for mammary gland development and a primary driver of proliferation in ER+ breast cancer.
- Signaling Pathways/Mechanisms: Upon binding estrogen, ESR1 dimerizes and translocates to the nucleus, binding to estrogen response elements (EREs) in target genes, thereby promoting cell cycle progression, survival, and differentiation. It can also engage in non-genomic signaling.
- Therapeutic Agents: Established Therapeutic Target.
- Selective Estrogen Receptor Modulators (SERMs) like Tamoxifen.
- Aromatase Inhibitors (AIs) like Anastrozole, Letrozole, Exemestane.
- Selective Estrogen Receptor Degraders (SERDs) like Fulvestrant.
- Supporting Evidence: ESR1 is the defining diagnostic and prognostic biomarker for ER+ breast cancer, and endocrine therapy targeting ESR1 is the cornerstone of treatment for this subtype.
- MUC1 (Mucin 1, Cell Surface Associated)
- Description: *MUC1* encodes a transmembrane glycoprotein expressed on the apical surface of most glandular epithelial cells. In cancer, it is often aberrantly overexpressed, hypoglycosylated, and loses its polarized distribution.
- Signaling Pathways/Mechanisms: MUC1 can interact with various signaling molecules, including ERBB receptors and β-catenin, influencing cell adhesion, proliferation, differentiation, and immune evasion. It activates pathways like MAPK/ERK and PI3K/Akt.
- Therapeutic Agents: Potential Therapeutic Target.
- Various MUC1-targeting agents, including antibodies (e.g., OncoMab-B7) and vaccines, are in preclinical and clinical development for several cancers, including breast cancer.
- Supporting Evidence: MUC1 overexpression is associated with poor prognosis and drug resistance in breast cancer.
- ERBB3 (Erb-B2 Receptor Tyrosine Kinase 3)
- Description: *ERBB3* (HER3) is a member of the epidermal growth factor receptor (EGFR/ERBB) family. Unlike other HER family members, it has impaired kinase activity but serves as a crucial signaling hub.
- Signaling Pathways/Mechanisms: ERBB3 primarily functions by forming heterodimers with other HER family members, especially ERBB2 (HER2) and EGFR, leading to potent activation of the PI3K/Akt pathway, which promotes cell survival and proliferation. It is often involved in resistance to endocrine therapies and HER2-targeted therapies.
- Therapeutic Agents: Potential Therapeutic Target / Emerging Target.
- Antibodies targeting ERBB3 (e.g., Lumretuzumab) or its dimerization with ERBB2 (e.g., Pertuzumab, which primarily targets HER2 but blocks HER2-HER3 dimerization) are being investigated.
- Supporting Evidence: ERBB3 activation is a known mechanism of resistance to standard therapies in ER+ and HER2+ breast cancers, making it an attractive target to overcome resistance.
Markers Elevated in HER2+ Breast Cancer
- ERBB2 (Erb-B2 Receptor Tyrosine Kinase 2)
- Description: *ERBB2* (HER2) encodes a receptor tyrosine kinase that is frequently amplified and overexpressed in HER2+ breast cancer. It is a critical driver of tumor growth.
- Signaling Pathways/Mechanisms: ERBB2 lacks a direct ligand but forms preferential heterodimers with other ERBB family members (e.g., ERBB3), leading to constitutive activation of downstream pathways such as MAPK/ERK, PI3K/Akt, and PLCγ, promoting cell proliferation, survival, angiogenesis, and metastasis.
- Therapeutic Agents: Established Therapeutic Target.
- Monoclonal antibodies: Trastuzumab, Pertuzumab.
- Tyrosine kinase inhibitors (TKIs): Lapatinib, Neratinib, Tucatinib.
- Antibody-drug conjugates (ADCs): Trastuzumab emtansine (T-DM1), Trastuzumab deruxtecan (Enhertu).
- Supporting Evidence: ERBB2 overexpression is a defining feature of HER2+ breast cancer, and anti-HER2 therapies have revolutionized its treatment, significantly improving patient outcomes.
- CD47 (CD47 Molecule)
- Description: *CD47* is a transmembrane glycoprotein that acts as a "don't eat me" signal by binding to SIRPα on phagocytic cells (e.g., macrophages), thereby inhibiting phagocytosis and promoting immune evasion.
- Signaling Pathways/Mechanisms: Interaction with SIRPα transmits inhibitory signals to macrophages, preventing them from engulfing cancer cells. High CD47 expression allows cancer cells to evade innate immune surveillance.
- Therapeutic Agents: Emerging Therapeutic Target.
- CD47-blocking antibodies (e.g., Magrolimab) are in clinical development for various solid tumors and hematologic malignancies, including breast cancer.
- Supporting Evidence: Overexpression of CD47 is observed in many cancers, including breast cancer, and is associated with poor prognosis and increased metastatic potential. Targeting CD47 aims to reactivate anti-tumor immunity.
- SDC1 (Syndecan 1)
- Description: *SDC1* is a heparan sulfate proteoglycan abundantly expressed on the surface of epithelial cells. It plays complex roles in cell adhesion, growth factor binding, and signaling.
- Signaling Pathways/Mechanisms: SDC1 interacts with growth factors (e.g., FGF, HGF), extracellular matrix components, and integrins, modulating cell proliferation, migration, invasion, and angiogenesis. Its shedding from the cell surface is associated with tumor progression.
- Therapeutic Agents: Potential Therapeutic Target.
- Targeting SDC1 or its shedding mechanisms is under investigation, with some preclinical studies showing promise.
- Supporting Evidence: SDC1 is often upregulated in various cancers, including breast cancer, and its expression correlates with tumor grade, invasiveness, and poor prognosis.
Markers Elevated in TNBC Breast Cancer
- BST2 (Bone Marrow Stromal Antigen 2)
- Description: *BST2* (also known as CD317 or tetherin) is an interferon-inducible transmembrane glycoprotein. While initially characterized for its role in innate antiviral immunity, it is increasingly recognized in cancer biology.
- Signaling Pathways/Mechanisms: BST2 has been implicated in cell proliferation, migration, and drug resistance. It can interact with signaling molecules to promote tumor progression and may modulate immune responses in the tumor microenvironment.
- Therapeutic Agents: Potential Therapeutic Target.
- Given its cell surface localization and upregulation in TNBC, BST2 is being explored as a target for antibody-drug conjugates or other immunotherapies.
- Supporting Evidence: Elevated BST2 expression has been observed in various cancers, including TNBC, where it can be associated with aggressive phenotypes and resistance to chemotherapy.
- EPHA2 (EPH Receptor A2)
- Description: *EPHA2* is a receptor tyrosine kinase that belongs to the largest family of receptor tyrosine kinases. It is involved in mediating cell-cell contact-dependent bidirectional signaling.
- Signaling Pathways/Mechanisms: EPHA2 engagement with its ligand ephrin-A1 can trigger cell-cell repulsion, promoting cell migration and invasion, critical processes in metastasis. In cancer, EPHA2 is often overexpressed and aberrantly activated, driving tumor growth, angiogenesis, and resistance to therapy. It can activate the FAK/Src pathway.
- Therapeutic Agents: Potential Therapeutic Target.
- Antibodies and small molecule inhibitors targeting EPHA2 are in preclinical and early clinical development for various cancers, including TNBC.
- Supporting Evidence: EPHA2 overexpression and activation are frequently observed in TNBC, where they correlate with aggressive disease and poor patient outcomes, making it a promising target.
- LY6K (Lymphocyte Antigen 6 Family Member K)
- Description: *LY6K* encodes a glycosylphosphatidylinositol (GPI)-anchored cell surface protein belonging to the Lymphocyte antigen 6 (Ly6) superfamily.
- Signaling Pathways/Mechanisms: While its precise signaling mechanisms are still being elucidated, LY6K has been implicated in promoting cell proliferation, survival, and stemness in various cancers. It can potentially interact with other membrane proteins to facilitate these processes.
- Therapeutic Agents: Potential Therapeutic Target.
- Antibodies targeting LY6K are being explored in preclinical studies for their therapeutic potential, particularly in TNBC.
- Supporting Evidence: LY6K is significantly upregulated in several cancers, including breast cancer, with particularly high expression in TNBC, where it is associated with poor prognosis and increased invasiveness.
- CD55 (CD55 Molecule)
- Description: *CD55* (Decay-accelerating factor, DAF) is a GPI-anchored cell surface protein that regulates the complement cascade, protecting host cells from complement-mediated lysis.
- Signaling Pathways/Mechanisms: By preventing the assembly of C3 and C5 convertases, CD55 inhibits complement activation. In cancer, overexpression of CD55 can protect tumor cells from immune attack, contributing to immune evasion. It can also be involved in cell proliferation and angiogenesis.
- Therapeutic Agents: Potential Therapeutic Target.
- Strategies to inhibit CD55 or enhance complement-dependent cytotoxicity are under investigation for cancer therapy.
- Supporting Evidence: CD55 is frequently overexpressed in various cancers, including breast cancer, and its expression can correlate with tumor aggressiveness and resistance to therapy.
Clinical or Translational Implications
The identification of condition-specific surfaceome markers in breast cancer epithelial cells holds significant clinical and translational implications:
- Enhanced Diagnostic and Prognostic Biomarkers: Markers like *ESR1* and *ERBB2* are already established diagnostic and predictive biomarkers. Other highly specific markers identified in this analysis (e.g., *BST2*, *EPHA2*, *LY6K* for TNBC) could refine breast cancer subtyping, predict treatment response, and inform prognosis, particularly for challenging subtypes like TNBC which lack targeted therapies.
- Novel Therapeutic Targets: The distinct expression profiles suggest opportunities for developing new targeted therapies.
- For ER+ and HER2+ cancers, identifying markers involved in resistance mechanisms (e.g., *ERBB3*) could lead to combination therapies that overcome treatment failure.
- For TNBC, which currently lacks specific therapeutic targets, the identified surface markers (*BST2*, *EPHA2*, *LY6K*, *CD55*, *MUC1*) represent promising candidates for developing novel antibody-drug conjugates (ADCs), monoclonal antibodies, or CAR T-cell therapies. Their surface localization makes them highly accessible for such modalities.
- Immunotherapy Strategies: Markers involved in immune evasion, such as *CD47* (HER2+), present opportunities for developing immunotherapies that reactivate anti-tumor immune responses, potentially in combination with other agents.
- Patient Stratification for Clinical Trials: These markers can be used to stratify patients for clinical trials, ensuring that novel agents are tested in patient populations most likely to benefit from them.
- Translational Research and Validation: Further validation of these potential markers using immunohistochemistry (IHC) or flow cytometry on larger patient cohorts, coupled with functional studies to elucidate their precise roles in tumor biology, is warranted to accelerate their translation into clinical practice. Their utility as companion diagnostics to guide personalized medicine approaches in breast cancer should also be explored.
16. Macrophage Condition-Specific Surfaceome Markers in Breast Cancer
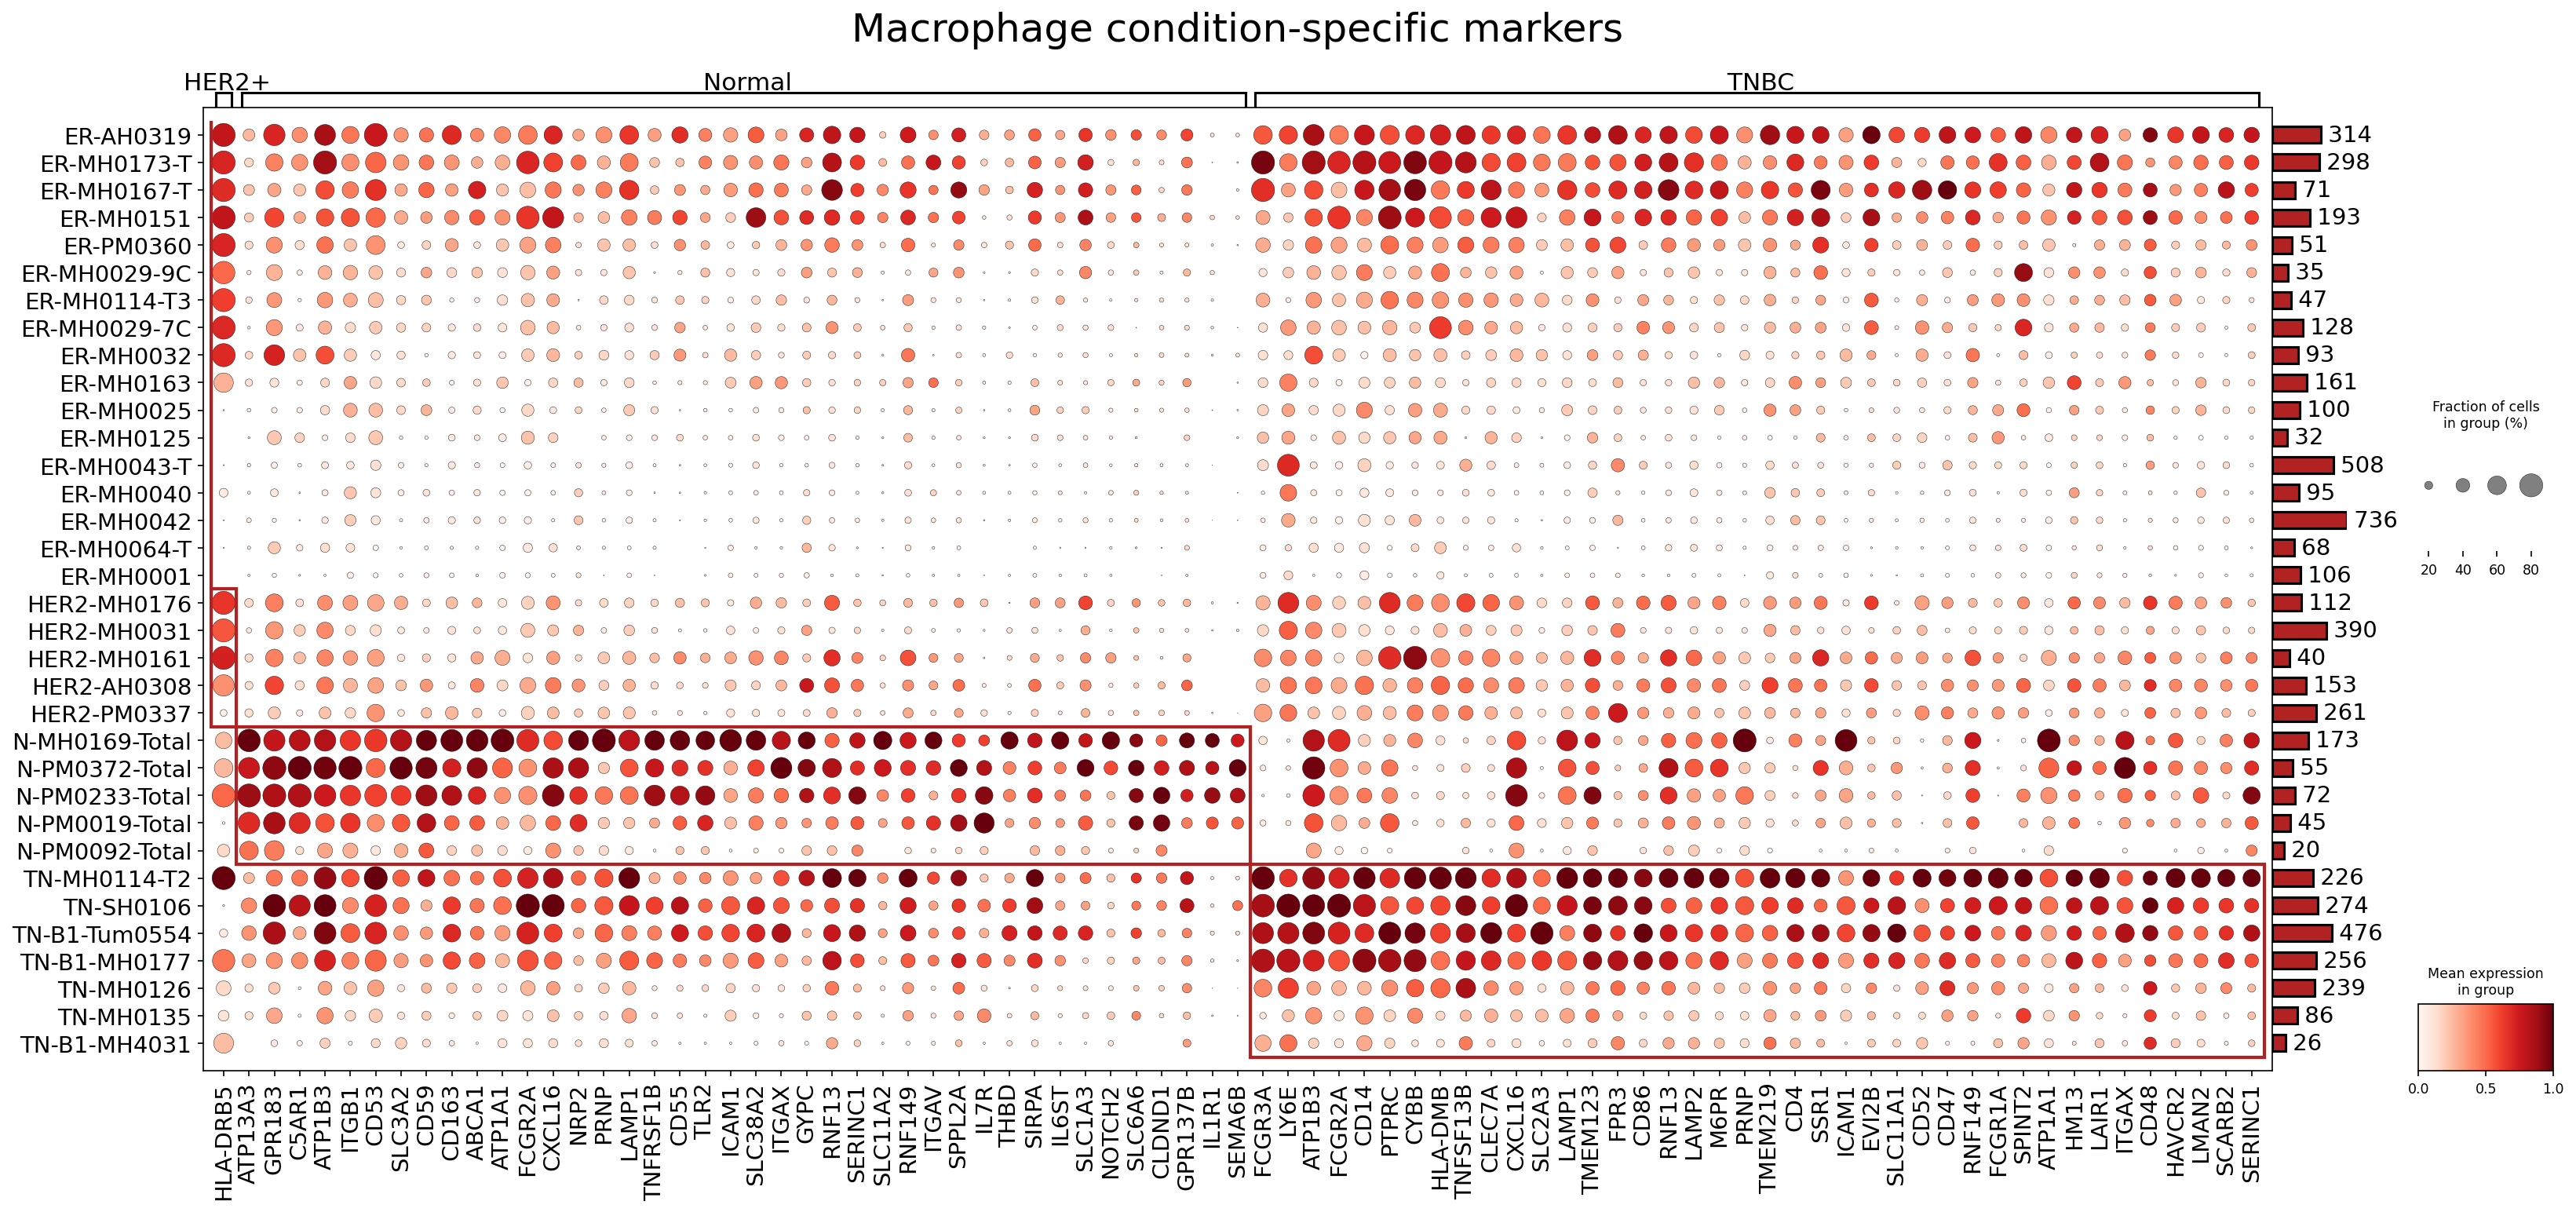
[Analysis Visualization Results]...
Analysis Overview
This analysis identifies and visualizes surfaceome markers specifically expressed by macrophages across different breast cancer conditions (HER2+, TNBC) and normal breast tissue samples. The dot plot displays the mean expression level (color intensity) and the fraction of cells expressing a given marker (dot size) for each sample group. The primary goal is to identify macrophage markers that are differentially expressed in various breast cancer subtypes compared to normal tissue, highlighting their potential roles in the tumor microenvironment (TME) and as therapeutic targets. The analysis focused on finding up to 40 surfaceome markers per condition for macrophages.
Visual Summary
The dot plot categorizes samples by condition: HER2+, Normal, and TNBC. Within each condition, individual patient samples are listed on the y-axis, and specific surfaceome markers are displayed on the x-axis.
- Normal Samples (N-MH*, N-PM*): Macrophages from normal tissue samples (indicated by the red box) generally show high and broad expression of several markers, including *HLA-DRB5*, *CD163*, *CD55*, *ICAM1*, *NRP2*, *TLR2*, *ITGAX*, and *ITGAV*. The dots are often large and dark red, indicating both high expression and a high fraction of expressing cells.
- TNBC Samples (TN-*): Macrophages from Triple-Negative Breast Cancer (TNBC) samples exhibit a distinct marker profile. Notably, there is a prominent upregulation of markers such as *FCGR3A*, *CD86*, *M6PR*, *FCGR1A*, *CD47*, *CD48*, *SCARB2*, *FCGR2B*, *TREM1*, and *CLEC5A*. Many of these markers show high expression and a high fraction of positive cells across multiple TNBC samples, indicating a potential shift towards a distinct macrophage phenotype in this aggressive subtype.
- HER2+ Samples (HER2-* and ER-* with HER2+ suffix): Macrophages from HER2+ breast cancer samples show a more heterogeneous pattern. Some samples, like ER-AH0319, show high expression of *ATP13A3* and *SLC3A2*. There's also some overlap with markers observed in normal tissue, such as *CD163*, though often with lower expression or cell fraction in comparison to normal samples. Some HER2+ samples show very low overall marker expression.
- Differential Expression Patterns: A clear visual distinction exists between normal and TNBC macrophage marker profiles. Normal tissue macrophages are characterized by markers associated with tissue homeostasis and M2-like characteristics (e.g., CD163), while TNBC macrophages show markers indicative of activation, immune regulation, and pro-tumorigenic functions (e.g., CD47, Fc gamma receptors). HER2+ samples display a mixed profile, suggesting diverse macrophage states or less consistent activation patterns across patients.
Biological Interpretation
Macrophages are critical components of the breast cancer tumor microenvironment (TME), playing complex roles that can either promote or inhibit tumor progression. The observed surfaceome markers offer insights into their functional states and potential interactions within the TME.
Macrophages in Normal Breast Tissue
Macrophages in normal breast tissue are typically involved in tissue maintenance, immune surveillance, and resolution of inflammation.
- CD163: A scavenger receptor and a well-established marker for M2-like macrophages. These macrophages are generally associated with anti-inflammatory responses, tissue repair, and immune suppression GeneCards: CD163. In the TME, CD163+ macrophages often correlate with poor prognosis due to their pro-tumorigenic functions, but their high expression in normal tissue here is expected, reflecting their role in homeostasis.
- HLA-DRB5: A component of MHC class II molecules, involved in presenting antigens to CD4+ T cells UniProt: P04295 (HLA-DRB5). Its presence suggests a capacity for antigen presentation, although M2-like macrophages are generally considered less efficient antigen presenters compared to M1 macrophages.
- CD55 (DAF) and CD59 (MIRL): Complement regulatory proteins that protect host cells from complement-mediated lysis GeneCards: CD55, GeneCards: CD59. Their high expression in normal tissue macrophages indicates a role in maintaining immune homeostasis and preventing excessive inflammation.
- ICAM1 (CD54): An intercellular adhesion molecule involved in cell-cell adhesion, particularly between leukocytes and endothelial cells GeneCards: ICAM1. Its presence suggests roles in immune cell recruitment and tissue interactions.
- NRP2 (Neuropilin-2): A pleiotropic receptor involved in diverse biological processes including angiogenesis, lymphangiogenesis, and neuronal guidance GeneCards: NRP2. Its expression in normal macrophages might relate to tissue remodeling or immune cell trafficking.
Macrophages in Triple-Negative Breast Cancer (TNBC)
TNBC is an aggressive subtype characterized by the absence of ER, PR, and HER2 receptors. Macrophages in TNBC are often highly plastic and contribute significantly to its aggressive phenotype. The observed marker profile suggests an activated, potentially pro-tumorigenic phenotype.
- CD47: A "don't eat me" signal that binds to SIRPα on phagocytic cells, inhibiting phagocytosis GeneCards: CD47. Upregulation of CD47 on TNBC macrophages could contribute to immune evasion, potentially protecting tumor cells or other pro-tumorigenic cells in the TME from phagocytosis. It also suggests that these macrophages themselves might be evading immune clearance or adopting a phenotype that promotes tumor survival.
- FCGR1A (CD64) and FCGR3A (CD16a): High-affinity and low-affinity Fc gamma receptors, respectively. These receptors bind to the Fc region of antibodies and play roles in phagocytosis, antibody-dependent cellular cytotoxicity (ADCC), and immune complex clearance GeneCards: FCGR1A, GeneCards: FCGR3A. Their upregulation indicates activated macrophages that can respond to antibody-coated cells or immune complexes, potentially contributing to both anti-tumor and pro-tumor functions depending on the context and antibody type.
- TREM1: Triggering receptor expressed on myeloid cells 1. TREM1 engagement amplifies inflammatory responses, promoting cytokine and chemokine production GeneCards: TREM1. Its elevated expression in TNBC macrophages suggests a heightened pro-inflammatory state that could fuel chronic inflammation and contribute to tumor progression.
- CD86: A co-stimulatory molecule (B7-2) that binds to CD28 and CTLA-4 on T cells GeneCards: CD86. While primarily associated with antigen-presenting cells like dendritic cells and B cells, its expression on macrophages can indicate an activated state and their capacity to modulate T cell responses, which could be either immune-stimulatory or suppressive within the TME.
- CLEC7A (Dectin-1): A C-type lectin receptor involved in innate immunity, primarily recognizing fungal β-glucans but also involved in inflammatory responses to endogenous ligands GeneCards: CLEC7A. Its role in cancer is emerging, potentially contributing to immune activation or suppression depending on the specific ligands and signaling pathways.
Macrophages in HER2+ Breast Cancer
HER2+ breast cancer is characterized by overexpression of the HER2 receptor.
- ATP13A3: A lysosomal polyamine transporter, involved in cellular polyamine homeostasis GeneCards: ATP13A3. Its role in macrophages within the TME is less characterized, but polyamine metabolism can influence cell growth, differentiation, and immune responses.
- SLC3A2 (CD98hc): The heavy chain of the CD98 amino acid transporter, essential for amino acid uptake and also interacting with integrins, affecting cell adhesion and signaling GeneCards: SLC3A2. Its high expression could indicate increased metabolic activity required for macrophage function or proliferation, or involvement in integrin-mediated interactions within the TME.
The mixed expression patterns in HER2+ samples suggest that macrophage phenotypes might be more diverse or influenced by individual patient factors compared to the more consistent profile observed in TNBC.
Clinical or Translational Implications
The identification of condition-specific macrophage surfaceome markers offers significant potential for diagnostic, prognostic, and therapeutic applications in breast cancer.
- Therapeutic Targeting of CD47 in TNBC:
- Mechanism: The high expression of *CD47* on TNBC macrophages is particularly compelling. CD47 acts as an immune checkpoint, sending a "don't eat me" signal to macrophages via SIRPα, thus allowing tumor cells to evade phagocytosis. Macrophages expressing CD47 might be adopting a more pro-tumorigenic phenotype or simply reflecting the high CD47 expression in the aggressive TNBC environment.
- Therapeutic Potential: Blocking the CD47-SIRPα axis with anti-CD47 antibodies or SIRPα fusion proteins has shown promise in preclinical and clinical studies across various cancers, including breast cancer PubMed Search: CD47 breast cancer therapy. These agents aim to reprogram macrophages to engulf tumor cells.
- Relevant Agents: Magrolimab (an anti-CD47 antibody) is an example currently in clinical trials.
- Validation: Further studies could validate if CD47 expression on macrophages in TNBC is consistently associated with a specific pro-tumorigenic phenotype and if targeting it effectively sensitizes TNBC to immunotherapy.
- Modulating Macrophage Activity via Fc Gamma Receptors (FCGR1A, FCGR3A) in TNBC:
- Mechanism: Upregulation of *FCGR1A* and *FCGR3A* indicates an active role for TNBC macrophages in mediating antibody-dependent immune responses.
- Therapeutic Potential: These receptors are crucial for the efficacy of therapeutic antibodies. Manipulating these receptors could enhance ADCC or Antibody-Dependent Cellular Phagocytosis (ADCP) by macrophages, potentially improving the response to existing or novel antibody-based therapies in TNBC. For example, strategies to engage specific FcRs on anti-tumor macrophages could be explored.
- Validation: Investigating the functional consequences of altered FcR expression in TNBC macrophages and their interaction with therapeutic antibodies could be beneficial.
- Targeting TREM1 to Suppress Pro-tumor Inflammation in TNBC:
- Mechanism: High *TREM1* expression suggests a heightened inflammatory state within the TNBC TME, which can promote tumor growth, angiogenesis, and metastasis.
- Therapeutic Potential: Inhibiting TREM1 signaling could dampen chronic inflammation and its pro-tumor effects, potentially sensitizing TNBC to other treatments.
- Relevant Agents: Small molecules or antibodies targeting TREM1 are under investigation in preclinical settings.
- Validation: Assessing the impact of TREM1 inhibition on TNBC progression and immune cell infiltration in preclinical models is warranted.
- Reprogramming CD163+ Macrophages:
- Mechanism: While *CD163* is also present in normal macrophages, its continued presence in tumor conditions, particularly if enriched in specific TME niches, points to the persistence of M2-like, immune-suppressive, and pro-tumorigenic macrophages (Tumor-Associated Macrophages, TAMs).
- Therapeutic Potential: Targeting CD163+ TAMs directly or reprogramming their M2-like phenotype towards an M1-like anti-tumor phenotype is a key strategy in cancer immunology PubMed Search: CD163 TAM therapy.
- Relevant Agents: Various agents aiming to deplete or re-educate TAMs are being explored, including CSF1R inhibitors, which reduce TAM numbers.
- Validation: Spatial transcriptomics or multiplexed imaging could further elucidate the localization and precise functional context of CD163+ macrophages in the breast cancer TME.
- Biomarker Potential: The distinct marker profiles, especially between normal and TNBC macrophages, could serve as diagnostic or prognostic biomarkers. For instance, a high ratio of CD47 to CD163 expression on macrophages might indicate a more aggressive disease context in TNBC patients.
Experimental Validation and Future Directions:
- Functional Assays: Investigate the functional implications of these marker expressions using *in vitro* and *in vivo* models. For example, assess the phagocytic capacity of macrophages with altered CD47 expression or the inflammatory cytokine production upon TREM1 modulation.
- Spatial Context: Utilize spatial transcriptomics or high-plex imaging techniques to understand the precise location of these macrophage subsets within the breast cancer TME and their interactions with other cell types.
- Patient Cohorts: Validate the prognostic or predictive value of these markers in larger patient cohorts using immunohistochemistry or flow cytometry on tumor biopsies.
- Combination Therapies: Explore the efficacy of combining therapies targeting these macrophage markers with existing standard-of-care treatments or other immunotherapies for breast cancer.
17. Fibroblast Condition-Specific Surfaceome Markers in Breast Cancer Subtypes
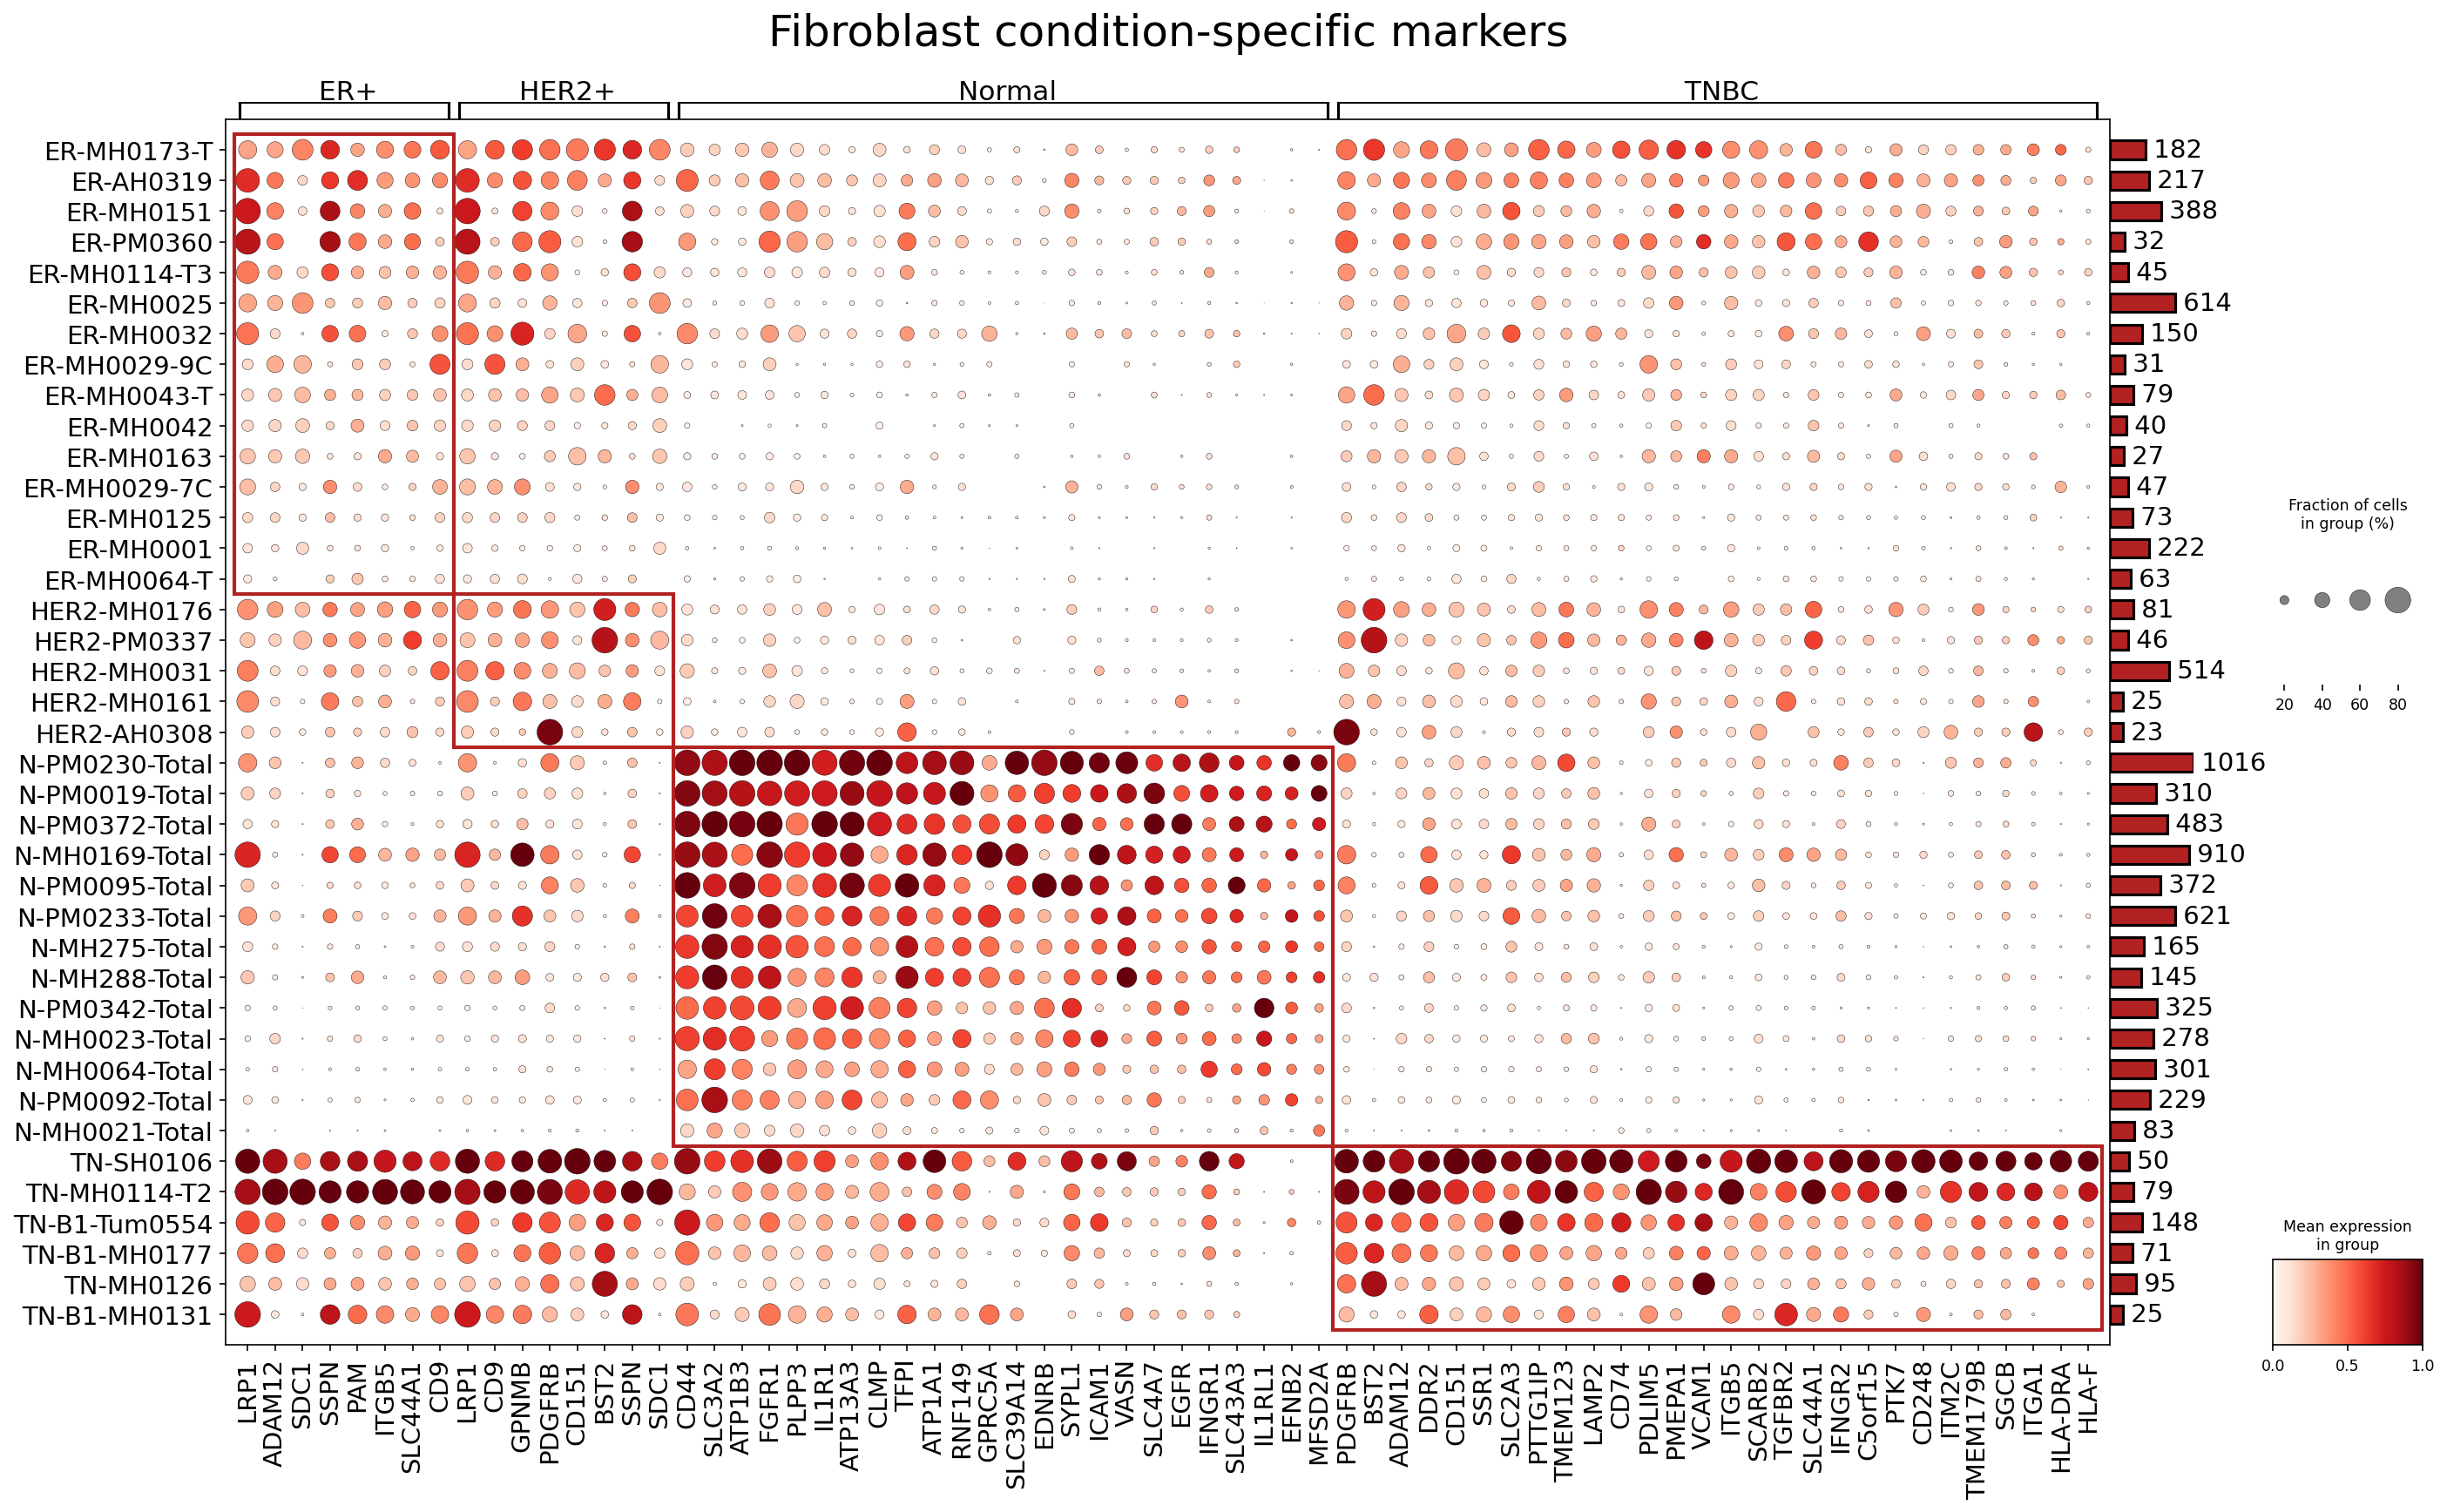
[Analysis Visualization Results]...
Analysis Overview
This analysis investigates the expression of surfaceome markers in fibroblasts across different breast cancer conditions (ER+, HER2+, TNBC) and normal breast tissue using single-cell RNA sequencing data. The goal is to identify condition-specific fibroblast markers that could reveal distinct roles of fibroblasts in the tumor microenvironment (TME) of various breast cancer subtypes and potentially serve as therapeutic targets. The dot plot visualizes the mean expression level (color intensity) and the fraction of cells expressing the marker (dot size) for selected surfaceome genes in fibroblasts from individual patient samples, grouped by condition.
Visual Summary
The dot plot displays a complex landscape of surfaceome marker expression in fibroblasts, revealing distinct signatures associated with normal tissue and different breast cancer subtypes.
- Normal Fibroblast Signature: A prominent cluster of markers (e.g., SDC1, PTPRU, ATP1A1, SLC4A7, IFNGR1, IL1RL1, EFNB2, MSFD2A, PDGFRB, BST2, DDR2, CD151, SSR1, SLC2A3, PTTG1IP, TMEM123, LAMP2, PDLIM5, CD74, PMEPA1, VCAM1, SCARB2, TGFBR2, SLC44A1, IFNGR2, PTK7, CD248, ITM2C, SGCB, ITGA1) shows high expression and prevalence specifically in fibroblasts from Normal samples (e.g., N-PM0230-Total, N-PM0019-Total, N-MH0169-Total). This suggests a baseline or quiescent fibroblast phenotype.
- Tumor-Associated Fibroblast (CAF) Activation: Compared to normal samples, fibroblasts from all tumor conditions (ER+, HER2+, TNBC) generally exhibit increased expression of several common CAF markers. For instance, PDGFRB, LRP1, ADAM12, SSPN, ITGB5, SLC44A1, CD9, and GPNMB are broadly upregulated in tumor samples.
Subtype-Specific Signatures:
- ER+ and HER2+ Fibroblasts: While sharing common CAF markers, these subtypes do not show as profoundly distinct clusters as TNBC. Markers like LRP1, ADAM12, SSPN, SDC1, CD9, ITGB5, and PDGFRB are generally highly expressed across these and TNBC conditions, suggesting a shared core CAF activation program.
- TNBC Fibroblasts: A particularly striking and distinct set of markers shows very high expression and prevalence in TNBC samples (e.g., TN-SH0106, TN-MH0114-T2). This includes markers such as TGFBR2, CD74, HLA-DRA, HLA-F, VCAM1, CD248, and many of the markers also seen in normal tissue but at much higher levels in TNBC. This distinct signature points towards a highly activated and potentially immune-modulatory role for fibroblasts in TNBC.
Overall, the dot plot effectively highlights both shared and subtype-specific fibroblast surfaceome markers, providing insights into their differential activation states and functional roles across breast cancer conditions.
Biological Interpretation
Fibroblasts are crucial components of the tumor microenvironment (TME), often differentiating into cancer-associated fibroblasts (CAFs) which play diverse roles in tumor progression, metastasis, and immune evasion. The identified surfaceome markers provide insights into these roles and potential therapeutic vulnerabilities.
Markers in Normal Fibroblasts
- SDC1 (Syndecan-1)
- Associated Signaling Pathways: SDC1 is a heparan sulfate proteoglycan that interacts with various extracellular matrix (ECM) components, growth factors (e.g., FGF, VEGF, HGF), and chemokines. It can modulate receptor tyrosine kinase signaling, Wnt, and Hedgehog pathways.
- Role of Fibroblasts in the TME (Normal Context): In healthy breast tissue, SDC1 on fibroblasts contributes to tissue homeostasis, cell-matrix interactions, and the maintenance of normal tissue architecture. Its expression in normal fibroblasts may represent a baseline function in tissue organization and support.
- Potential as a Therapeutic Target: While highly expressed in normal tissue, SDC1's dysregulation (e.g., increased expression or shedding) in cancer can promote tumor growth and metastasis. Targeting SDC1 or its interactions might disrupt pro-tumorigenic signaling or ECM remodeling in activated CAFs, but it is not a direct target in normal fibroblasts PubMed Search: SDC1 breast cancer fibroblast role.
- Relevant Therapeutic Agents: No specific agents are currently indicated for targeting SDC1 in normal fibroblasts. In cancer, therapeutic strategies could involve modulating its shedding enzymes or inhibiting its signaling partners.
- Other Pertinent Information: SDC1 can be shed from the cell surface, releasing its extracellular domain into the TME, where it can act as a soluble factor influencing inflammation and tumor growth.
Markers in ER+ and HER2+ Fibroblasts (General CAF Activation)
- PDGFRB (Platelet-Derived Growth Factor Receptor Beta)
- Associated Signaling Pathways: PDGFRB is a receptor tyrosine kinase activated by PDGF ligands (e.g., PDGF-BB, -DD). It initiates crucial signaling cascades, including the PI3K/Akt, MAPK/ERK, and STAT pathways, promoting cell proliferation, survival, and migration.
- Role of Fibroblasts in the TME: PDGFRB is a hallmark marker of activated cancer-associated fibroblasts (CAFs) across various solid tumors, including breast cancer. Its signaling drives fibroblast proliferation, differentiation into myofibroblasts, and excessive deposition of extracellular matrix (ECM), leading to desmoplasia. This creates a stiff, immunosuppressive, and pro-metastatic tumor microenvironment, fostering tumor growth, angiogenesis, and drug resistance in ER+ and HER2+ breast cancers GeneCards: PDGFRB.
- Potential as a Therapeutic Target: PDGFRB is a highly attractive therapeutic target for CAF-targeted therapy. Inhibiting PDGFRB aims to reprogram CAFs, reduce desmoplasia, normalize tumor vasculature, and enhance the efficacy of conventional chemotherapy and immunotherapy.
- Relevant Therapeutic Agents: Small molecule tyrosine kinase inhibitors (TKIs) that target PDGFRB, such as imatinib, sunitinib, sorafenib, and nilotinib, have been evaluated in various cancers, often in combination therapies to overcome stromal-mediated resistance in breast cancer PubMed Search: PDGFRB inhibitor breast cancer.
- Other Pertinent Information: Inhibition of PDGFRB can lead to decreased interstitial pressure within the tumor, potentially improving the delivery of anticancer drugs.
- ADAM12 (ADAM Metallopeptidase Domain 12)
- Associated Signaling Pathways: ADAM12 is a member of the ADAM (A Disintegrin And Metalloprotease) family. It possesses metalloprotease activity, enabling it to cleave and remodel the ECM, and it also functions as an adhesion molecule. It can shed growth factors, thereby activating receptor tyrosine kinases.
- Role of Fibroblasts in the TME: In activated CAFs of ER+ and HER2+ breast cancers, ADAM12 contributes to the proteolytic degradation and remodeling of the ECM, facilitating tumor cell invasion, intravasation, and metastasis. It can also release growth factors like HB-EGF from the cell surface, promoting tumor cell proliferation and survival. Its expression is often associated with more aggressive disease UniProt: ADAM12.
- Potential as a Therapeutic Target: Targeting ADAM12 could inhibit ECM remodeling and tumor cell invasion, potentially reducing metastatic progression.
- Relevant Therapeutic Agents: Specific ADAM12 inhibitors are currently under investigation. Broad-spectrum matrix metalloprotease (MMP) inhibitors have been explored, but specific targeting of ADAM12 could offer greater selectivity.
- Other Pertinent Information: ADAM12 exists in both membrane-anchored and secreted forms, contributing to its diverse roles in cell-matrix interactions and paracrine signaling within the TME.
Markers in TNBC Fibroblasts (Highly Activated and Immune-Modulating CAFs)
- TGFBR2 (Transforming Growth Factor Beta Receptor Type II)
- Associated Signaling Pathways: TGFBR2 is a serine/threonine kinase receptor that binds TGF-β ligands. This binding activates intracellular signaling cascades, primarily through Smad proteins (canonical pathway), but also through non-Smad pathways (e.g., MAPK, PI3K/Akt).
- Role of Fibroblasts in the TME: TGF-β signaling is a paramount driver of CAF differentiation and activation. In TNBC, elevated TGFBR2 expression on fibroblasts indicates a strong TGF-β-driven pro-tumorigenic program. This promotes excessive ECM production, fibrosis (desmoplasia), and a profoundly immunosuppressive TME by recruiting regulatory T cells, suppressing cytotoxic T cell function, and fostering an inflammatory milieu that supports tumor growth, epithelial-mesenchymal transition (EMT), and metastasis GeneCards: TGFBR2.
- Potential as a Therapeutic Target: Targeting the TGF-β pathway in TNBC is a highly promising strategy to revert CAF activation, reduce tumor fibrosis, overcome immune suppression, and thereby enhance the efficacy of immunotherapy and chemotherapy.
- Relevant Therapeutic Agents: TGF-β receptor kinase inhibitors (e.g., galunisertib, vactosertib) and neutralizing antibodies against TGF-β ligands (e.g., fresolimumab, bintrafusp alfa) are in various stages of clinical trials for different cancers, including TNBC, aiming to modulate the immunosuppressive TME PubMed Search: TGFbeta inhibitor TNBC.
- Other Pertinent Information: The often highly desmoplastic nature of TNBC is strongly correlated with elevated TGF-β signaling, underscoring its critical role in this aggressive breast cancer subtype.
- CD74 (MHC Class II Invariant Chain)
- Associated Signaling Pathways: CD74 is primarily known for its role in the processing and presentation of antigens by MHC class II molecules. Beyond this, it acts as a receptor for macrophage migration inhibitory factor (MIF), activating intracellular signaling cascades, including MAPK and PI3K/Akt pathways, which promote cell survival, proliferation, and migration.
- Role of Fibroblasts in the TME: In TNBC fibroblasts, high CD74 expression, particularly in conjunction with its role as a MIF receptor, can contribute to CAF activation, proliferation, and ECM remodeling, fostering a pro-tumorigenic niche. Its role in antigen presentation might also influence immune responses or immune evasion within the TNBC TME GeneCards: CD74.
- Potential as a Therapeutic Target: Targeting CD74 or the MIF-CD74 axis could disrupt pro-tumorigenic fibroblast functions, reduce desmoplasia, and potentially modulate immune suppression specific to TNBC.
- Relevant Therapeutic Agents: Anti-CD74 antibodies (e.g., milatuzumab) have been developed and are in clinical use for certain hematologic malignancies. MIF inhibitors are also under investigation for various inflammatory and cancer indications. These agents could be explored for targeting TNBC CAFs.
- Other Pertinent Information: CD74's dual functionality in immune regulation and direct growth factor signaling makes it an intriguing candidate for stromal modulation in TNBC.
- HLA-DRA (Major Histocompatibility Complex, Class II, DR Alpha) and HLA-F (Major Histocompatibility Complex, Class I, F)
- Associated Signaling Pathways: HLA-DRA is a component of the MHC Class II complex, presenting exogenous antigens to CD4+ T cells. HLA-F is a non-classical MHC Class I molecule, known to interact with inhibitory receptors on NK cells and T cells, thereby influencing immune cell activation and evasion.
- Role of Fibroblasts in the TME: The robust expression of HLA-DRA and HLA-F on TNBC fibroblasts is highly significant. While typically associated with professional antigen-presenting cells, their presence on CAFs suggests a dynamic role in shaping the immune landscape of TNBC. Aberrant MHC Class II expression on non-immune cells can modulate T cell responses, potentially contributing to immune tolerance or suppression. HLA-F expression by CAFs suggests a direct involvement in suppressing anti-tumor immunity, which is consistent with the often "cold" or immunosuppressive phenotype of TNBC UniProt: HLA-DRA, UniProt: HLA-F.
- Potential as a Therapeutic Target: Modulating MHC expression on TNBC fibroblasts could represent a novel strategy to enhance anti-tumor immune responses, particularly in combination with immune checkpoint inhibitors, by 're-educating' the immune system or reducing immunosuppressive signals emanating from CAFs.
- Relevant Therapeutic Agents: While no direct agents specifically target HLA-DRA/F on fibroblasts, strategies aimed at improving antigen presentation or blocking inhibitory interactions (e.g., immune checkpoint inhibitors) might show synergistic efficacy by altering the immune-modulatory capacity of TNBC CAFs.
- Other Pertinent Information: This unexpected and prominent expression of MHC molecules on TNBC fibroblasts highlights their complex and active role in immune evasion mechanisms, reinforcing the notion that CAFs are not merely passive bystanders but active participants in shaping the immunosuppressive TME.
Clinical or Translational Implications
The identification of condition-specific surfaceome markers on fibroblasts provides valuable insights for potential therapeutic interventions in breast cancer.
- Targeting CAF Activation: The consistent upregulation of PDGFRB across all breast cancer subtypes (ER+, HER2+, TNBC) strongly supports targeting PDGFRB signaling in CAFs as a pan-breast cancer stromal therapeutic strategy. PDGFRB inhibitors could reduce desmoplasia, improve drug penetration, and enhance the efficacy of existing chemotherapies or immunotherapies. Clinical trials exploring these combinations are ongoing and could benefit from these specific fibroblast marker insights.
- TNBC-Specific Stromal Targeting: The unique signature of TNBC fibroblasts, characterized by high expression of TGFBR2, CD74, HLA-DRA, and HLA-F, suggests a distinct and highly immunosuppressive CAF phenotype. Targeting the TGF-β pathway is particularly relevant for TNBC due to its strong association with fibrosis and immune evasion. Combinatorial therapies that include TGF-β inhibitors could re-sensitize TNBC to immune checkpoint blockade.
- Immune Modulation by CAFs: The expression of MHC molecules (HLA-DRA, HLA-F) and CD74 on TNBC fibroblasts is a critical finding. It implies that TNBC CAFs are actively involved in immune regulation, potentially contributing to the "cold" immune phenotype often observed in TNBC. Therapeutically, strategies that either block immunosuppressive signals from these CAFs (e.g., targeting HLA-F interactions) or that enhance antigen presentation/immune recognition in the presence of these fibroblasts could represent novel approaches to overcome immune resistance in TNBC.
- Biomarker Development: These identified markers could serve as biomarkers for stratifying patients, predicting response to stromal-targeted therapies, or monitoring disease progression in specific breast cancer subtypes. For instance, high PDGFRB expression could indicate a patient likely to benefit from PDGFRB inhibitors, while the TNBC-specific immune-modulatory markers could guide combination strategies with immunotherapies.
In summary, characterizing the surfaceome of fibroblasts in a condition-specific manner offers a deeper understanding of breast cancer pathobiology and paves the way for developing more precise, stromal-targeted therapies to improve patient outcomes.
18. CD4+ T cell Marker Expression in Breast Cancer Subtypes
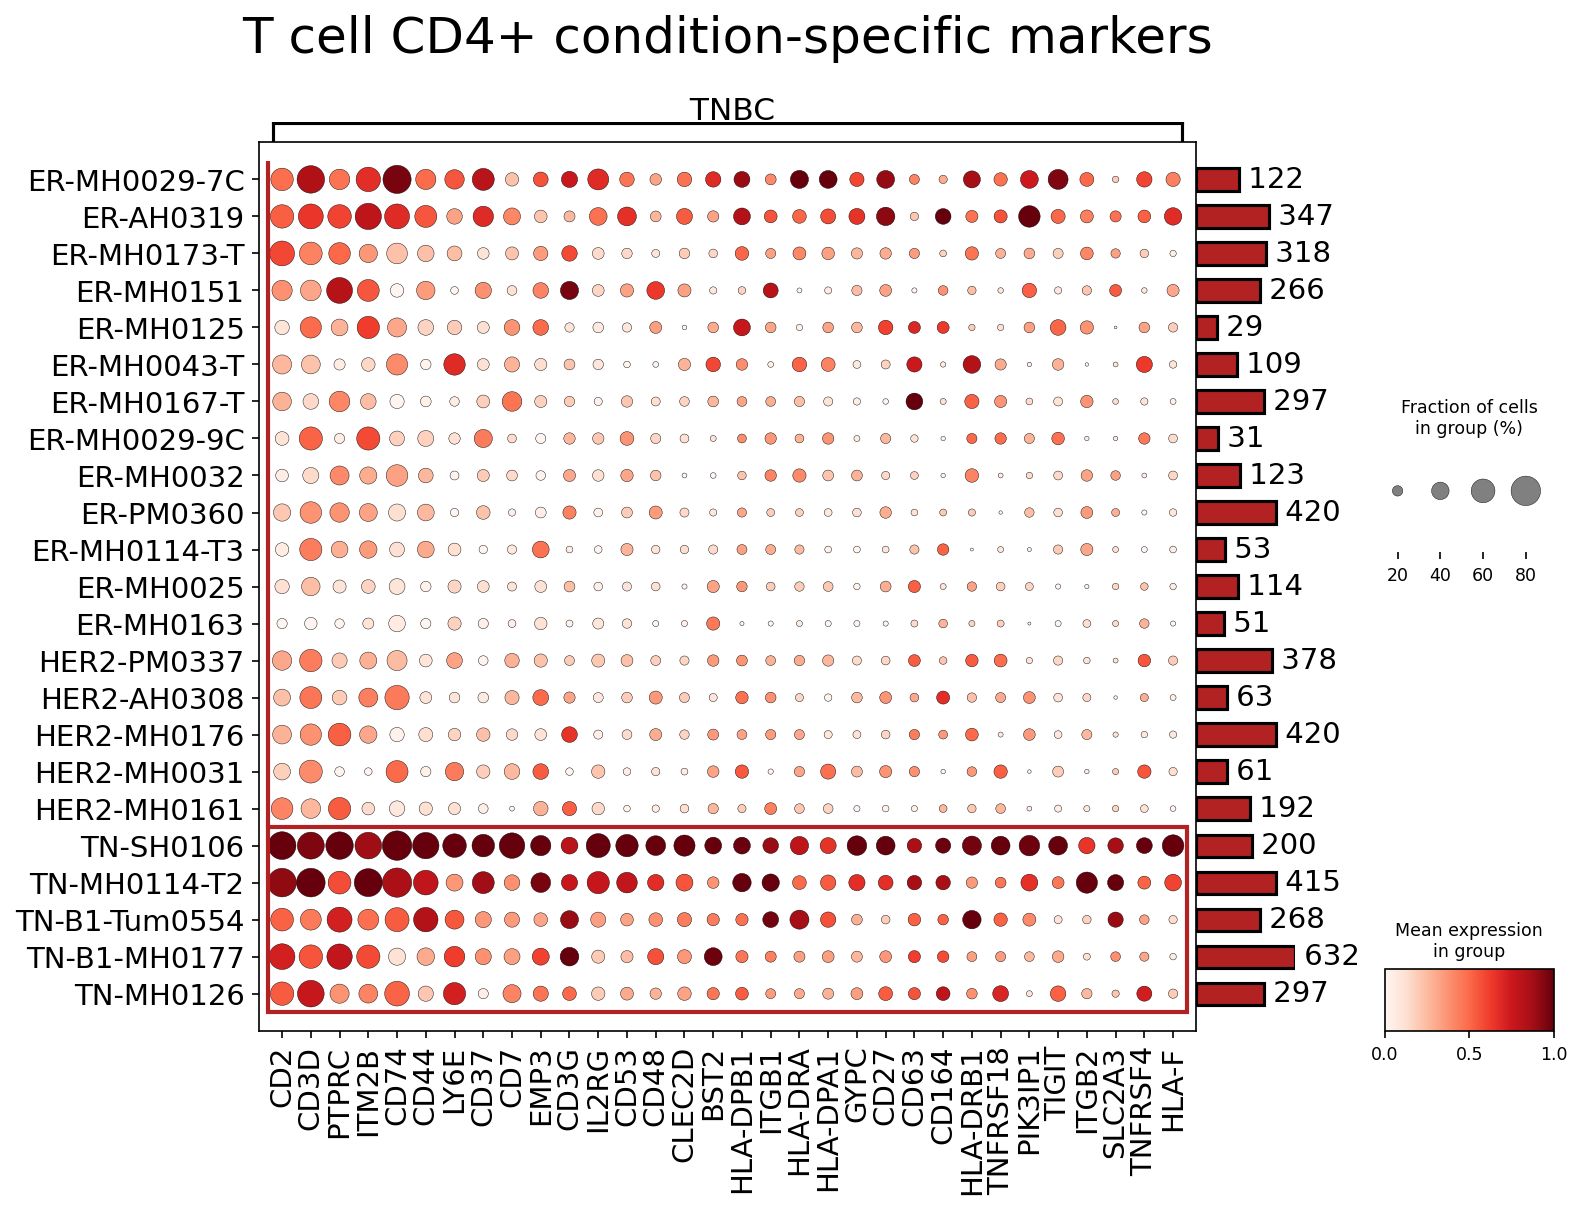
[Analysis Visualization Results]...
Analysis Overview
This analysis presents a dot plot illustrating the mean expression and fraction of cells expressing various surfaceome markers within CD4+ T cell populations across different breast cancer subtypes (ER+, HER2+, and TNBC) at the individual sample level. The objective was to identify condition-specific markers for CD4+ T cells, focusing on surfaceome proteins which have potential as therapeutic targets. The dot plot visualizes the relative expression level (color intensity) and the proportion of cells expressing the marker (dot size) for each gene in CD4+ T cells from multiple patient samples. The analysis successfully identified a panel of markers, with a notable upregulation and higher prevalence in CD4+ T cells from TNBC samples compared to ER+ and HER2+ samples.
Visual Summary
The dot plot, titled "T cell CD4+ condition-specific markers," effectively highlights the differential expression patterns of selected surfaceome markers.
- Overall Pattern: A distinct pattern of higher marker expression (darker red) and greater cell fraction (larger dot size) is evident in CD4+ T cells derived from Triple-Negative Breast Cancer (TNBC) samples, particularly in the lower section of the plot (samples starting with "TN-").
- TNBC Specificity: Samples classified as TNBC (e.g., TN-SH106, TN-MH0114-T2, TN-B1-Tum0554) exhibit robust and widespread expression of numerous markers including pan-T cell markers (CD2, CD3D, PTPRC/CD45, CD7, CD3G), adhesion molecules (CD44, ITGB1, ITGB2), antigen presentation machinery (HLA-DRA, HLA-DPA1, HLA-DRB1, CD74), and critical immune checkpoint/co-stimulatory receptors (TIGIT, CD27, TNFRSF18/GITR, TNFRSF4/OX40). This suggests a more activated or functionally distinct CD4+ T cell phenotype within the TNBC tumor microenvironment.
- ER+ and HER2+ Samples: In contrast, CD4+ T cells from ER+ and HER2+ samples (e.g., ER-MH0029-7C, HER2-PM0337) generally show lower and more heterogeneous expression of these markers. While core T cell markers are present, the co-stimulatory and immune checkpoint molecules, as well as MHC Class II proteins, are less uniformly or intensely expressed.
- Consistent Markers: Some markers like CD2, CD3D, PTPRC (CD45), and CD7, which are essential for T cell identity and function, show relatively consistent presence across various samples, but their expression intensity still appears elevated in TNBC.
Biological Interpretation
The observed upregulation of numerous surfaceome markers in CD4+ T cells within the TNBC microenvironment points towards a highly active and potentially exhausted immune cell state. This is particularly relevant given TNBC's aggressive nature and higher lymphocytic infiltration compared to other breast cancer subtypes.
Role of CD4+ T cells in the Tumor Microenvironment (TME)
CD4+ T cells, often referred to as T helper cells, play a central role in orchestrating anti-tumor immune responses. They can promote cytotoxic T lymphocyte (CTL) activity, recruit other immune cells, and directly exert anti-tumor effects through cytokine secretion. However, in the context of cancer, CD4+ T cells can also adopt pro-tumorigenic functions, such as supporting tumor growth or promoting immune evasion, depending on their polarization (e.g., Th1, Th2, Treg, Th17). The specific markers expressed can provide clues about their functional state.
Key Markers and their Implications:
- CD3D / CD3G (T Cell Receptor Complex Components)
- Signaling Pathways: CD3D and CD3G are invariant components of the T cell receptor (TCR) complex, essential for antigen recognition and signal transduction upon binding to MHC-peptide complexes. They initiate downstream signaling cascades involving LCK, ZAP70, LAT, and SLP76, leading to T cell activation, proliferation, and effector functions. GeneCards: CD3D, GeneCards: CD3G
- Role in TME: High expression of CD3 components indicates the presence and potential activity of T cells. In TNBC, the robust expression suggests a significant T cell presence, which could either be actively anti-tumorigenic or, if in an exhausted state, contributing to immune suppression.
- Therapeutic Potential: While not direct therapeutic targets for anti-cancer immunity due to their pan-T cell nature, they serve as crucial markers for T cell presence in the TME. Bi-specific antibodies targeting CD3 can redirect T cells to tumor cells.
- Therapeutic Agents: Bispecific T-cell engagers (BiTEs) like blinatumomab (for B-ALL) target CD3 to engage T cells.
- PTPRC (CD45) (Protein Tyrosine Phosphatase Receptor Type C)
- Signaling Pathways: CD45 is a transmembrane glycoprotein expressed on hematopoietic cells, functioning as a tyrosine phosphatase. It plays a critical role in modulating TCR signaling by dephosphorylating key kinases like LCK and FYN, thereby regulating T cell activation thresholds. GeneCards: PTPRC
- Role in TME: As a pan-leukocyte marker, its robust expression in CD4+ T cells in TNBC confirms a significant immune infiltrate. Its enzymatic activity is crucial for T cell responsiveness; altered expression or function could impact anti-tumor immunity.
- Therapeutic Potential: Not typically a direct therapeutic target for modulating T cell anti-tumor function, but an important marker for immune cell identification.
- Therapeutic Agents: No direct therapeutic agents commonly used in cancer that specifically target CD45 on T cells for anti-tumor effects, but it's a key marker in immunophenotyping.
- CD44 (Cluster of Differentiation 44)
- Signaling Pathways: CD44 is an adhesion molecule and a major receptor for hyaluronic acid. It is involved in cell-cell and cell-matrix interactions, cell migration, lymphocyte activation, and signal transduction through various pathways including PI3K/Akt and MAPK. GeneCards: CD44
- Role in TME: In CD4+ T cells, CD44 expression is associated with T cell activation, homing to inflammatory sites, and retention in tissues. Its high expression in TNBC CD4+ T cells may indicate activated or memory T cells capable of migrating within the tumor. CD44 also plays a role in regulating the immune suppressive function of regulatory T cells.
- Therapeutic Potential: CD44 has been explored as a therapeutic target in cancer due to its role in tumor progression and metastasis. Targeting CD44 on T cells could potentially modulate their migratory and functional characteristics within the TME.
- Therapeutic Agents: Antibodies targeting CD44 have been investigated in preclinical and clinical settings for various cancers, including some breast cancers.
- HLA-DRA / HLA-DPA1 / HLA-DRB1 (MHC Class II Genes)
- Signaling Pathways: These genes encode components of the Major Histocompatibility Complex (MHC) class II molecules (HLA-DR, HLA-DP, HLA-DQ), which are surface glycoproteins primarily expressed on antigen-presenting cells (APCs). While typically not expressed on resting T cells, their upregulation on activated T cells, particularly CD4+ T cells, can indicate a highly activated state or a regulatory phenotype, allowing them to present antigens to other T cells (e.g., T-T cell interactions). They are crucial for initiating and regulating adaptive immune responses. GeneCards: HLA-DRA, GeneCards: HLA-DPA1, GeneCards: HLA-DRB1
- Role in TME: High expression of MHC class II on CD4+ T cells in TNBC suggests chronic activation or potentially an anergic/exhausted state, as persistent antigen exposure can induce this expression. It may also reflect a subpopulation of regulatory T cells (Tregs) or antigen-presenting T cells within the TME.
- Therapeutic Potential: Modulating MHC class II expression on T cells could impact their interaction with other immune cells and their overall function in the TME.
- Therapeutic Agents: No direct therapeutic agents currently target T cell-expressed MHC class II in cancer.
- TIGIT (T cell immunoreceptor with Ig and ITIM domains)
- Signaling Pathways: TIGIT is an inhibitory immune checkpoint receptor expressed on T cells (CD4+, CD8+, NK cells). It binds to CD155 (PVR) and CD112 (PVRL2) on APCs and tumor cells. TIGIT signaling leads to the inhibition of T cell activation and proliferation, often by competing with the co-stimulatory receptor CD226 for ligand binding and through its ITIM domain. GeneCards: TIGIT
- Role in TME: High TIGIT expression on CD4+ T cells in TNBC suggests an exhausted phenotype, characteristic of dysfunctional T cells in chronic antigen exposure or tumor environments. This contributes to immune evasion by suppressing anti-tumor responses.
- Therapeutic Potential: TIGIT is a promising therapeutic target for immune checkpoint blockade. Blocking TIGIT can restore T cell function and enhance anti-tumor immunity.
- Therapeutic Agents: Anti-TIGIT antibodies (e.g., tiragolumab, domvanalimab) are currently in various stages of clinical trials, often in combination with anti-PD-1 therapy, for multiple cancers including breast cancer. PubMed search: TIGIT breast cancer therapy
- TNFRSF18 (GITR) / TNFRSF4 (OX40) / CD27 (Co-stimulatory Receptors)
Signaling Pathways:
- TNFRSF18 (GITR): Glucocorticoid-induced TNFR-related protein. It provides a co-stimulatory signal to T cells, enhancing their proliferation, survival, and effector functions, while attenuating Treg suppressive activity. GeneCards: TNFRSF18
- TNFRSF4 (OX40): A co-stimulatory receptor that enhances T cell proliferation, cytokine production, and survival, and is critical for the development of robust and long-lasting anti-tumor immune responses. GeneCards: TNFRSF4
- CD27: A co-stimulatory receptor on T cells (and other lymphocytes) that enhances T cell survival, proliferation, and differentiation into memory cells. Its ligand, CD70, is expressed on activated APCs. GeneCards: CD27
- Role in TME: The high expression of these co-stimulatory receptors on CD4+ T cells in TNBC suggests an activated state, potentially indicating efforts by the immune system to respond to the tumor. However, persistent activation in the suppressive TME can also lead to exhaustion. Targeting these pathways aims to boost T cell anti-tumor function.
- Therapeutic Potential: Agonistic antibodies targeting these receptors are being developed to enhance anti-tumor immune responses by promoting T cell activation and persistence.
- Therapeutic Agents: GITR agonists (e.g., TRX518, MEDI1873), OX40 agonists (e.g., MEDI6469, MOXR0916), and CD27 agonists (e.g., varlilumab) are in clinical trials for various cancers, including breast cancer. PubMed search: OX40 agonist breast cancer, PubMed search: GITR agonist breast cancer
Clinical or Translational Implications
The differential expression of these surfaceome markers, particularly their significant upregulation in TNBC CD4+ T cells, holds substantial clinical and translational implications:
- Biomarker for Immunophenotyping: The identified markers can serve as valuable tools for immunophenotyping the CD4+ T cell compartment in breast cancer, especially TNBC. This can help characterize the immune landscape, identify patient subgroups with specific immune profiles, and potentially predict response to immunotherapy.
- Therapeutic Targets in TNBC: The strong upregulation of immune checkpoint receptors like TIGIT and co-stimulatory receptors (GITR, OX40, CD27) in TNBC CD4+ T cells makes them attractive therapeutic targets.
- TIGIT Blockade: Given its inhibitory role, TIGIT blockade could be a promising strategy to revive exhausted T cells and enhance anti-tumor immunity in TNBC, potentially in combination with existing immune checkpoint inhibitors (e.g., anti-PD-1/PD-L1).
- Co-stimulatory Agonism: Activating co-stimulatory pathways via agonists targeting GITR, OX40, or CD27 could augment anti-tumor CD4+ T cell responses, especially in contexts where T cells are present but functionally impaired.
- Understanding T cell Dysfunction: The co-expression of inhibitory (TIGIT) and co-stimulatory (GITR, OX40, CD27) markers often indicates an activated yet potentially exhausted state in CD4+ T cells from the TNBC microenvironment. This complex interplay needs further investigation to devise optimal combinatorial immunotherapy strategies.
- Translational Research: These findings can guide further research into the precise roles of these markers in CD4+ T cell plasticity and function within the TNBC TME. This could involve *in vitro* functional assays, *ex vivo* studies with patient samples, or *in vivo* preclinical models to validate their therapeutic utility.
19. Differential Expression of Cell Cycle Genes in Epithelial Cells Across Breast Cancer Subtypes
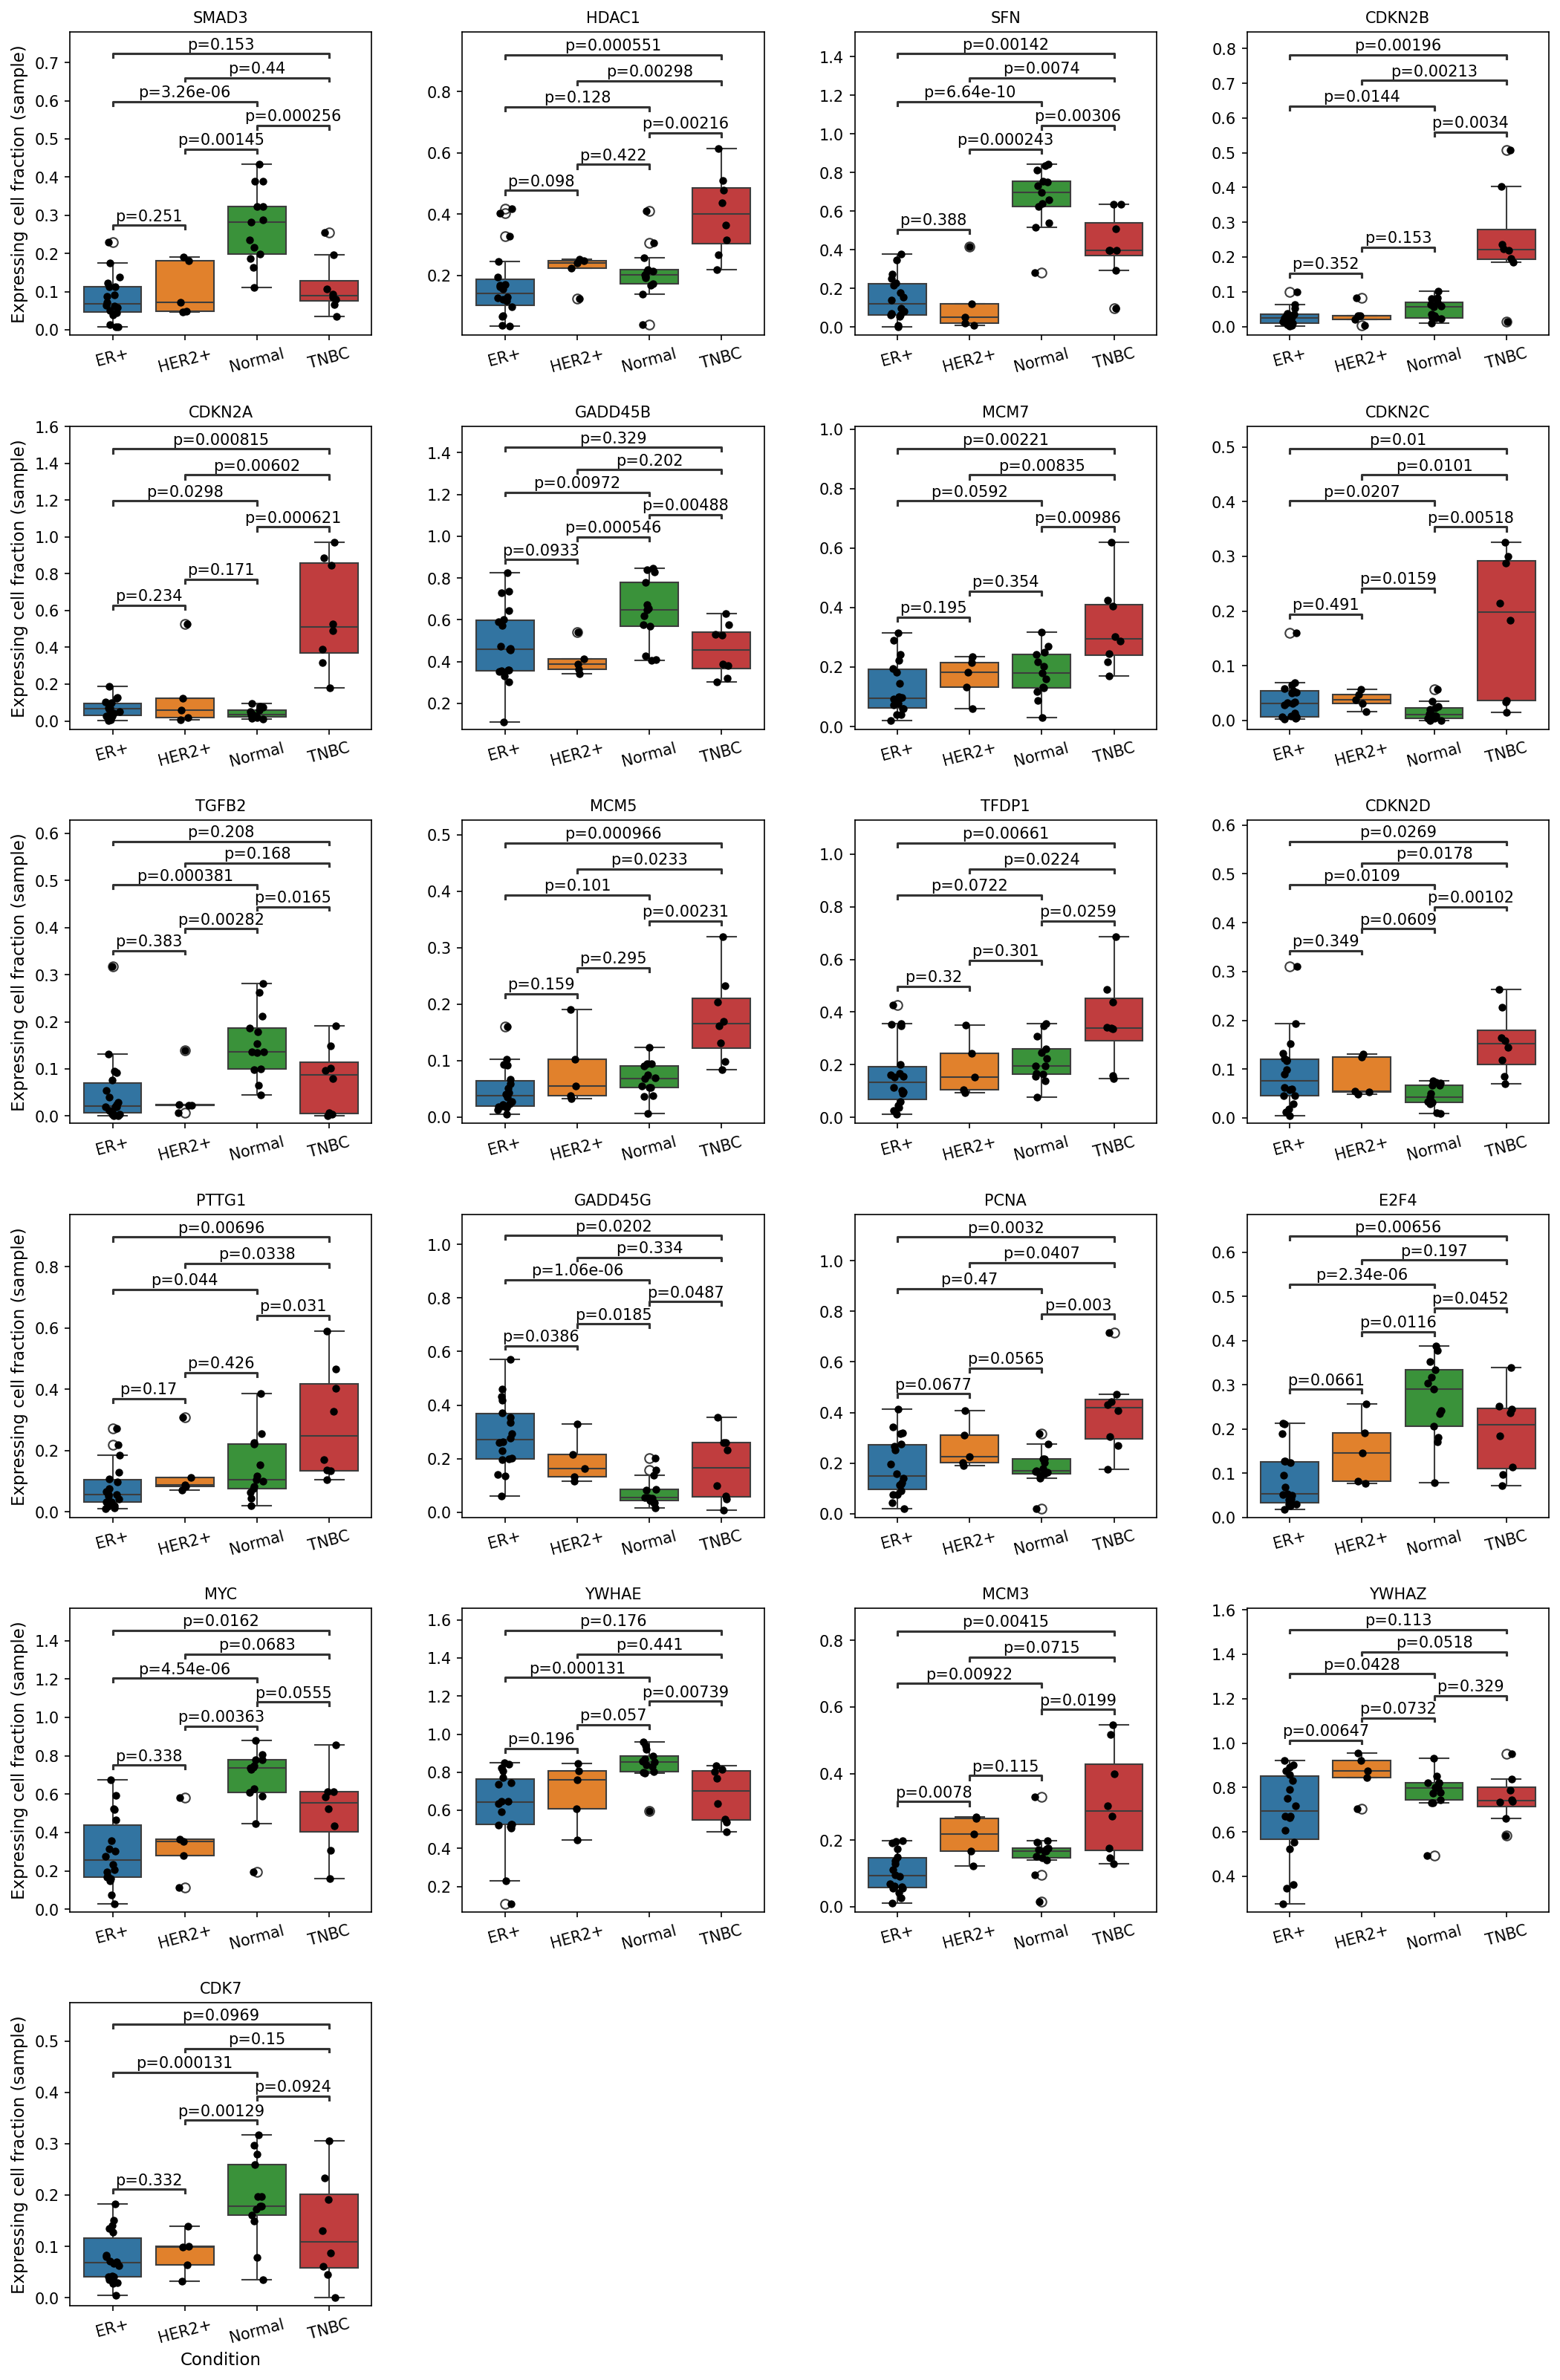
[Analysis Visualization Results]...
Analysis Overview
This analysis investigates the expressing cell fraction of a curated list of cell cycle pathway genes within Epithelial cells across different breast cancer conditions (ER+, HER2+, TNBC) and Normal breast tissue. The goal is to identify genes with statistically significant expression differences between these conditions, shedding light on cell cycle dysregulation in various breast cancer subtypes.
Visual Summary
The box plots display the fraction of cells expressing each gene per sample, grouped by condition. Pairwise comparisons show p-values indicating statistical significance.
Key observations include:
- Increased Proliferative Markers in TNBC: A notable pattern emerges in Triple-Negative Breast Cancer (TNBC) epithelial cells, where a significantly higher fraction of cells express genes associated with active cell cycle progression and proliferation compared to Normal tissue and often other cancer subtypes (ER+, HER2+). This includes:
- DNA Replication Factors: MCM3, MCM5, MCM7, PCNA (Proliferating Cell Nuclear Antigen), and PTTG1 (Pituitary Tumor-Transforming Gene 1). All these genes show significantly elevated expression fractions in TNBC.
- Oncogenes and Pro-proliferative Regulators: MYC, TFDP1 (Transcription Factor Dp-1), HDAC1 (Histone Deacetylase 1), and WEE1. These also exhibit higher expressing cell fractions in TNBC.
Altered Tumor Suppressor and Growth Inhibitory Gene Expression:
- Downregulation in Cancer: SFN (14-3-3 sigma), a tumor suppressor involved in cell cycle arrest, shows a significantly higher expressing cell fraction in Normal tissue compared to all breast cancer subtypes (ER+, HER2+, TNBC). Similarly, SMAD3 and TGFB2, components of the growth-inhibitory TGF-beta pathway, are expressed by a higher fraction of cells in Normal tissue compared to ER+ and TNBC. GADD45G, involved in growth arrest and DNA damage response, is also higher in Normal tissue than in ER+ and TNBC.
- Complex Pattern of CDKNs: Cyclin-Dependent Kinase Inhibitors (CDKN2A, CDKN2B, CDKN2C, CDKN2D) generally function as tumor suppressors. Interestingly, their expressing cell fractions are frequently higher in TNBC compared to Normal and other subtypes. This complex pattern suggests a potential compensatory mechanism or dysregulation where expression does not necessarily equate to effective cell cycle inhibition, especially given the concurrent upregulation of strong proliferative markers.
- Condition-Specific Differences: While TNBC often shows the most pronounced differences, some genes also exhibit significant variations between ER+ and HER2+ or when compared to Normal tissue. For example, SFN expression is also higher in ER+ than HER2+. CDK7 is higher in Normal than ER+ and HER2+.
Biological Interpretation
The observed patterns strongly indicate widespread dysregulation of cell cycle control in breast cancer epithelial cells, particularly in TNBC, aligning with the inferred disease context.
- Heightened Proliferative Activity in TNBC: The consistent upregulation of MCMs (MCM3, MCM5, MCM7), PCNA, PTTG1, MYC, HDAC1, WEE1, and TFDP1 in TNBC epithelial cells is a hallmark of increased cellular proliferation.
- MCM proteins are essential for DNA replication initiation and elongation, and their overexpression is a common feature of aggressive cancers, reflecting active DNA synthesis [PubMed search: "MCM proteins cancer proliferation" - PubMed Search].
- PCNA is a key component of the DNA replication machinery.
- PTTG1 is an oncogene contributing to chromosomal instability and promoting tumor progression.
- MYC is a powerful oncogene that drives cell growth and division, and its overexpression is a major contributor to tumor development and aggressiveness [GeneCards: MYC - GeneCards].
- HDAC1 impacts gene expression through chromatin remodeling, and its overexpression can promote cell survival and proliferation.
- WEE1 is a G2/M checkpoint kinase. While its role can be complex, its upregulation can allow cancer cells to bypass DNA damage checkpoints and continue dividing.
- Compromised Cell Cycle Checkpoints and Growth Inhibition: The lower expressing cell fraction of SFN, SMAD3, GADD45G, and TGFB2 in cancer subtypes, especially TNBC, points to a breakdown of critical growth-inhibitory and DNA damage response pathways.
- SFN (14-3-3 sigma) acts as a tumor suppressor by mediating G2/M cell cycle arrest and apoptosis [GeneCards: SFN - GeneCards]. Its downregulation in cancer cells would contribute to uncontrolled proliferation.
- SMAD3 and TGFB2 are key mediators of TGF-beta signaling, a pathway that often suppresses tumor growth in early stages by inhibiting cell cycle progression. Reduced expression suggests evasion of this tumor-suppressive mechanism [GeneCards: SMAD3 - GeneCards].
- GADD45G is involved in cell cycle arrest and DNA repair, and its reduced expression can lead to genomic instability.
- Dysregulated CDK Inhibitors (CDKNs): The increased expressing cell fraction of CDKN2A, CDKN2B, CDKN2C, and CDKN2D in TNBC epithelial cells, despite their general role as tumor suppressors, is intriguing. This could represent a compensatory response to robust proliferative signaling, where a higher proportion of cells are attempting to halt the cell cycle, but these attempts are ultimately overridden or rendered ineffective by other pro-oncogenic drivers. Alternatively, their expression might be uncoupled from their functional inhibitory activity in some tumor cells.
Clinical or Translational Implications
The findings highlight critical aspects of breast cancer biology with potential clinical relevance:
- TNBC Aggressiveness: The extensive upregulation of proliferation-driving genes and downregulation of growth-inhibitory genes in TNBC epithelial cells strongly supports its aggressive and highly proliferative nature, aligning with its poor prognosis and limited targeted treatment options compared to ER+ and HER2+ subtypes.
- Potential Biomarkers: Genes such as MCM3, MCM5, MCM7, PCNA, PTTG1, MYC, SFN, and SMAD3, showing significant differential expression, could serve as prognostic or predictive biomarkers for breast cancer, particularly to stratify patients by subtype and predict therapeutic response.
- Therapeutic Targets: The identified genes represent potential therapeutic targets. For instance:
- HDAC1 and WEE1 are already targets for investigational cancer therapies. WEE1 inhibitors are being explored in clinical trials for various solid tumors, including breast cancer, often in combination with DNA-damaging agents [PubMed search: "WEE1 inhibitor cancer clinical trial" - PubMed Search].
- MYC is a challenging but highly sought-after therapeutic target due to its central role in cancer development. Strategies to indirectly inhibit MYC activity or target MYC-driven pathways are under active investigation.
- Targeting the MCM complex or PCNA could inhibit DNA replication, a fundamental process for cancer cell proliferation.
- Pathway-Driven Strategies: The comprehensive dysregulation of cell cycle pathways suggests that combination therapies targeting multiple nodes within the cell cycle or complementary pathways could be more effective in managing breast cancer, especially aggressive subtypes like TNBC.
20. Gene Ontology (GSA) Analysis of Epithelial Cells Across Breast Cancer Conditions
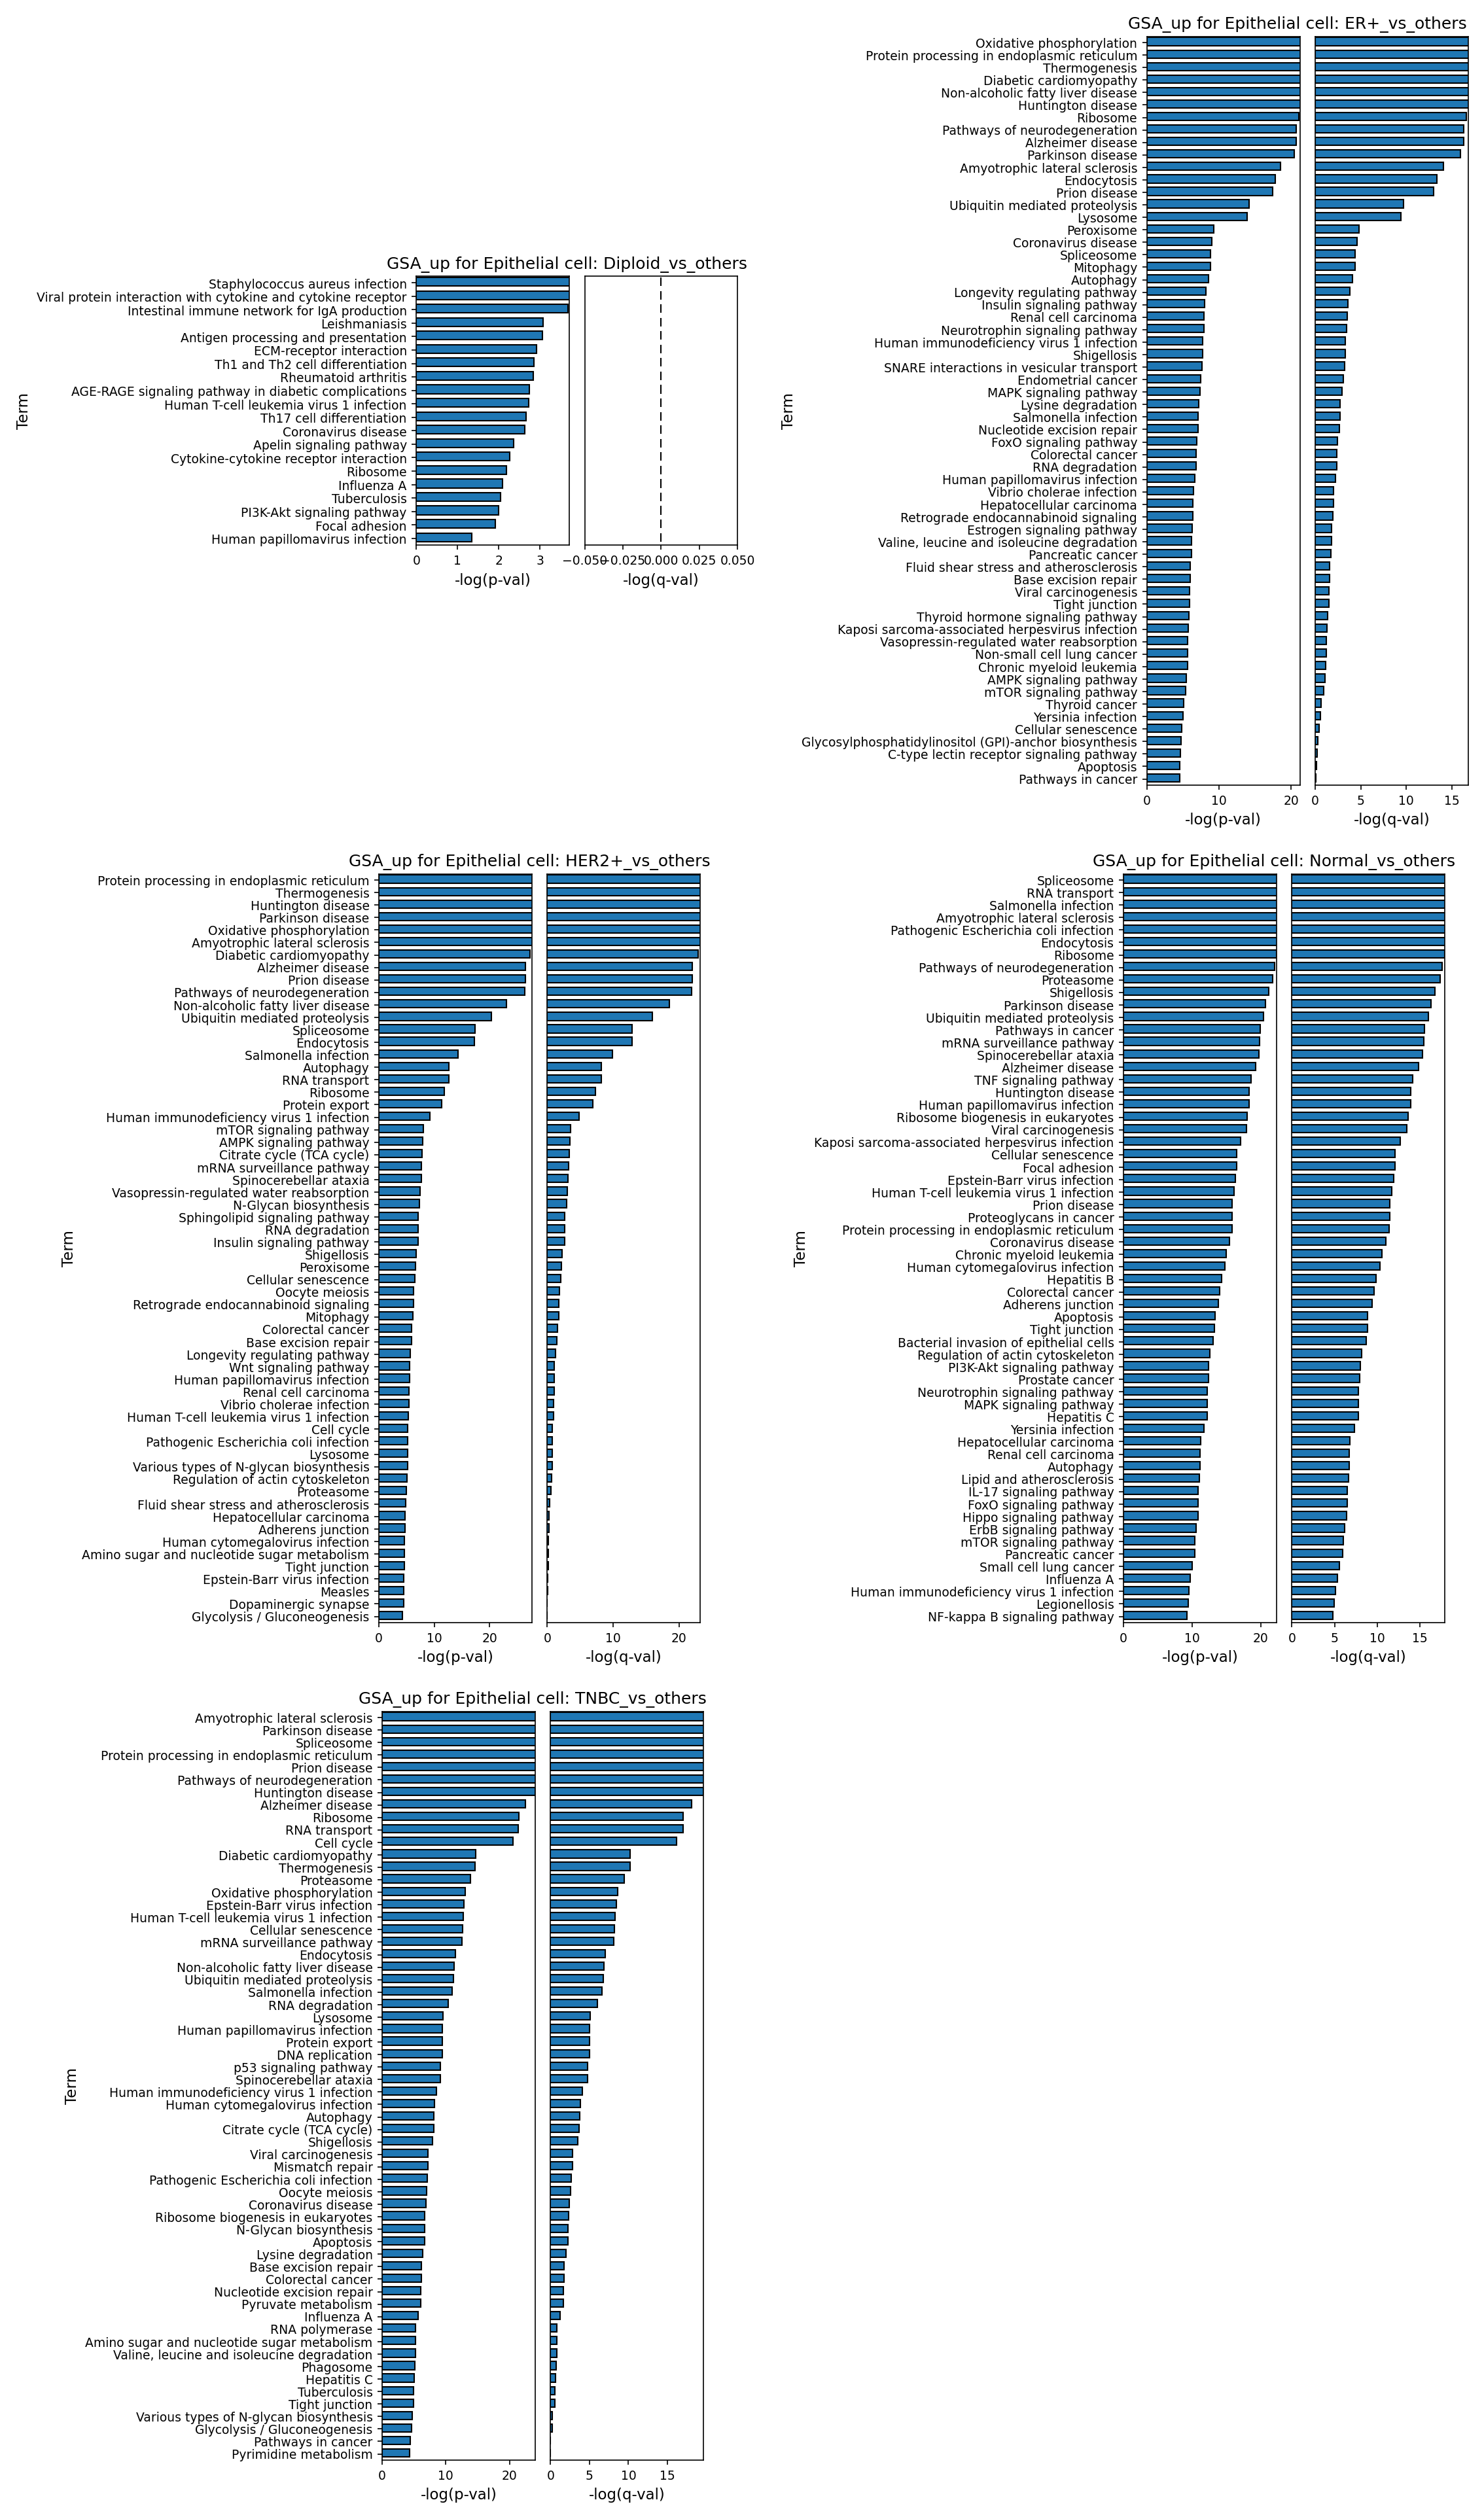
[Analysis Visualization Results]...
Analysis Overview
This analysis presents Gene Ontology (GO) enrichment results (GSA) for Epithelial cells, comparing each specified condition (Diploid, ER+, HER2+, Normal, TNBC) against all other conditions combined. The results highlight biological processes and pathways that are significantly enriched (i.e., upregulated) in Epithelial cells under each specific condition relative to the broader cellular context. The visualization is a bar plot showing the top enriched GO terms ranked by their statistical significance (-log(p-val) and -log(q-val)).
Visual Summary
The analysis generated five bar plots, each representing the top enriched GO terms for Epithelial cells in a specific condition versus all other conditions:
- Diploid_vs_others: This plot shows a limited number of significantly enriched terms, primarily related to immune responses and infectious diseases (e.g., "Staphylococcus aureus infection", "Viral protein interaction with cytokine and cytokine receptor", "Intestinal immune network for IgA production"). The -log(p-val) values are relatively low (around 3), indicating moderate statistical significance compared to other conditions. The -log(q-val) panel shows minimal or no significant terms after FDR correction, suggesting that most of these terms are not robustly enriched.
- ER+_vs_others, HER2+_vs_others, and TNBC_vs_others: These three plots, representing different breast cancer subtypes, exhibit a high degree of overlap and very strong statistical significance for numerous GO terms. The -log(p-val) and -log(q-val) values extend significantly higher (up to 20-25), indicating robust enrichment. Common highly enriched terms across these cancer subtypes include:
- Metabolic processes: "Oxidative phosphorylation", "Thermogenesis", "Protein processing in endoplasmic reticulum", "Ribosome", "Spliceosome", "Lysosome", "Peroxisome".
- Neurodegenerative/Systemic diseases: "Huntington disease", "Parkinson disease", "Alzheimer disease", "Amyotrophic lateral sclerosis", "Diabetic cardiomyopathy", "Non-alcoholic fatty liver disease". These likely represent altered general cellular metabolic and stress response pathways that are also implicated in such diseases.
- Specific to TNBC: "Cell cycle" is notably high, reflecting its proliferative nature.
- Normal_vs_others: This plot also displays a large number of highly significant GO terms, with -log(p-val) and -log(q-val) values comparable to the cancer subtypes. Enriched terms include "Spliceosome", "RNA transport", "Salmonella infection", "Amyotrophic lateral sclerosis", "Endocytosis", "Ribosome", "Proteasome", "Pathways in cancer", "TNF signaling pathway". The appearance of "Pathways in cancer" as enriched in normal cells compared to a mixed "others" group is noteworthy and requires careful interpretation.
Biological Interpretation
- Metabolic Reprogramming in Breast Cancer Epithelial Cells: The consistent enrichment of terms like "Oxidative phosphorylation," "Protein processing in endoplasmic reticulum," "Thermogenesis," "Ribosome," "Spliceosome," "Lysosome," and "Peroxisome" across ER+, HER2+, and TNBC epithelial cells points towards profound metabolic reprogramming and altered protein homeostasis in cancerous cells. Cancer cells often increase oxidative phosphorylation to meet high energy demands and adapt their protein synthesis and degradation machinery to support rapid proliferation and stress responses PubMed search: cancer cell metabolism. This suggests a shared core set of altered biological processes fundamental to breast cancer pathogenesis, irrespective of receptor status.
- Proliferative Signature in TNBC: The strong enrichment of "Cell cycle" pathways specifically in TNBC epithelial cells, alongside other general metabolic terms, aligns with the known aggressive and highly proliferative nature of triple-negative breast cancer PubMed search: TNBC cell cycle. This highlights the elevated need for cell division and replication machinery in this subtype.
- Distinct State of Diploid Epithelial Cells: The "Diploid_vs_others" analysis shows a weaker and different enrichment profile, predominantly related to immune and infectious processes. The low -log(q-val) suggests these findings are less robust after multiple testing correction. This indicates that simple ploidy status (Diploid) alone, without specific disease context, may not drive strong, clearly defined GO pathway enrichments when compared against a heterogeneous "others" group that likely includes various cancer states. This group might represent healthy diploid cells, or less transcriptionally active cells.
- "Pathways in Cancer" in Normal Epithelial Cells: The enrichment of "Pathways in cancer" in "Normal_vs_others" is a complex finding. It could indicate that normal epithelial cells actively maintain homeostatic and tumor-suppressive mechanisms that are classified under the broad "Pathways in cancer" GO term, which might be dysregulated or suppressed in cancer cells. Alternatively, it might reflect a baseline activity of certain genes in normal cells that are also implicated in general cancer processes, and these specific genes/pathways may be relatively less prominent or differently regulated in the highly specialized cancer subtypes comprising the "others" group KEGG Pathways in Cancer. This distinction is crucial for understanding the earliest deviations from normalcy during tumorigenesis.
- General Cellular Stress and Disease Associations: Many terms across cancer subtypes (ER+, HER2+, TNBC) like "Diabetic cardiomyopathy," "Huntington disease," "Parkinson disease," "Amyotrophic lateral sclerosis," and "Non-alcoholic fatty liver disease" appear consistently. These are often broad terms associated with mitochondrial dysfunction, protein misfolding, inflammation, and cellular stress. Their consistent enrichment in breast cancer epithelial cells suggests that these cells experience significant cellular stress and manifest broad metabolic and proteostatic imbalances that share molecular features with other systemic diseases.
Clinical or Translational Implications
- Targeting Metabolic Vulnerabilities: The pervasive metabolic alterations (e.g., oxidative phosphorylation, protein processing) observed across all breast cancer subtypes suggest that therapies targeting these fundamental processes could have broad applicability, potentially improving outcomes for ER+, HER2+, and TNBC patients. Strategies aimed at disrupting energy metabolism or proteostasis could be explored.
- Subtype-Specific Treatment for TNBC: The specific and strong enrichment of "Cell cycle" in TNBC reinforces its highly proliferative nature. This highlights the importance of cell cycle inhibitors or therapies that target rapid cell division as potential treatment avenues tailored for TNBC.
- Biomarker Discovery and Early Detection: The distinct GO profiles between Normal and cancer epithelial cells, particularly the nuanced interpretation of "Pathways in cancer" in normal cells, could inform the discovery of novel biomarkers for early detection or for distinguishing pre-cancerous states from established tumors. Understanding how normal cells regulate these pathways may offer insights into preventing malignant transformation.
- Understanding Cancer Stress Responses: The enrichment of terms related to various systemic diseases points to a generalized cellular stress response within tumor epithelial cells. Modulating these stress pathways could represent a therapeutic strategy to make cancer cells more vulnerable to existing treatments or to prevent therapy resistance.
21. Gene Set Enrichment Analysis (GSEA) Across Breast Cancer Cell Types and Conditions
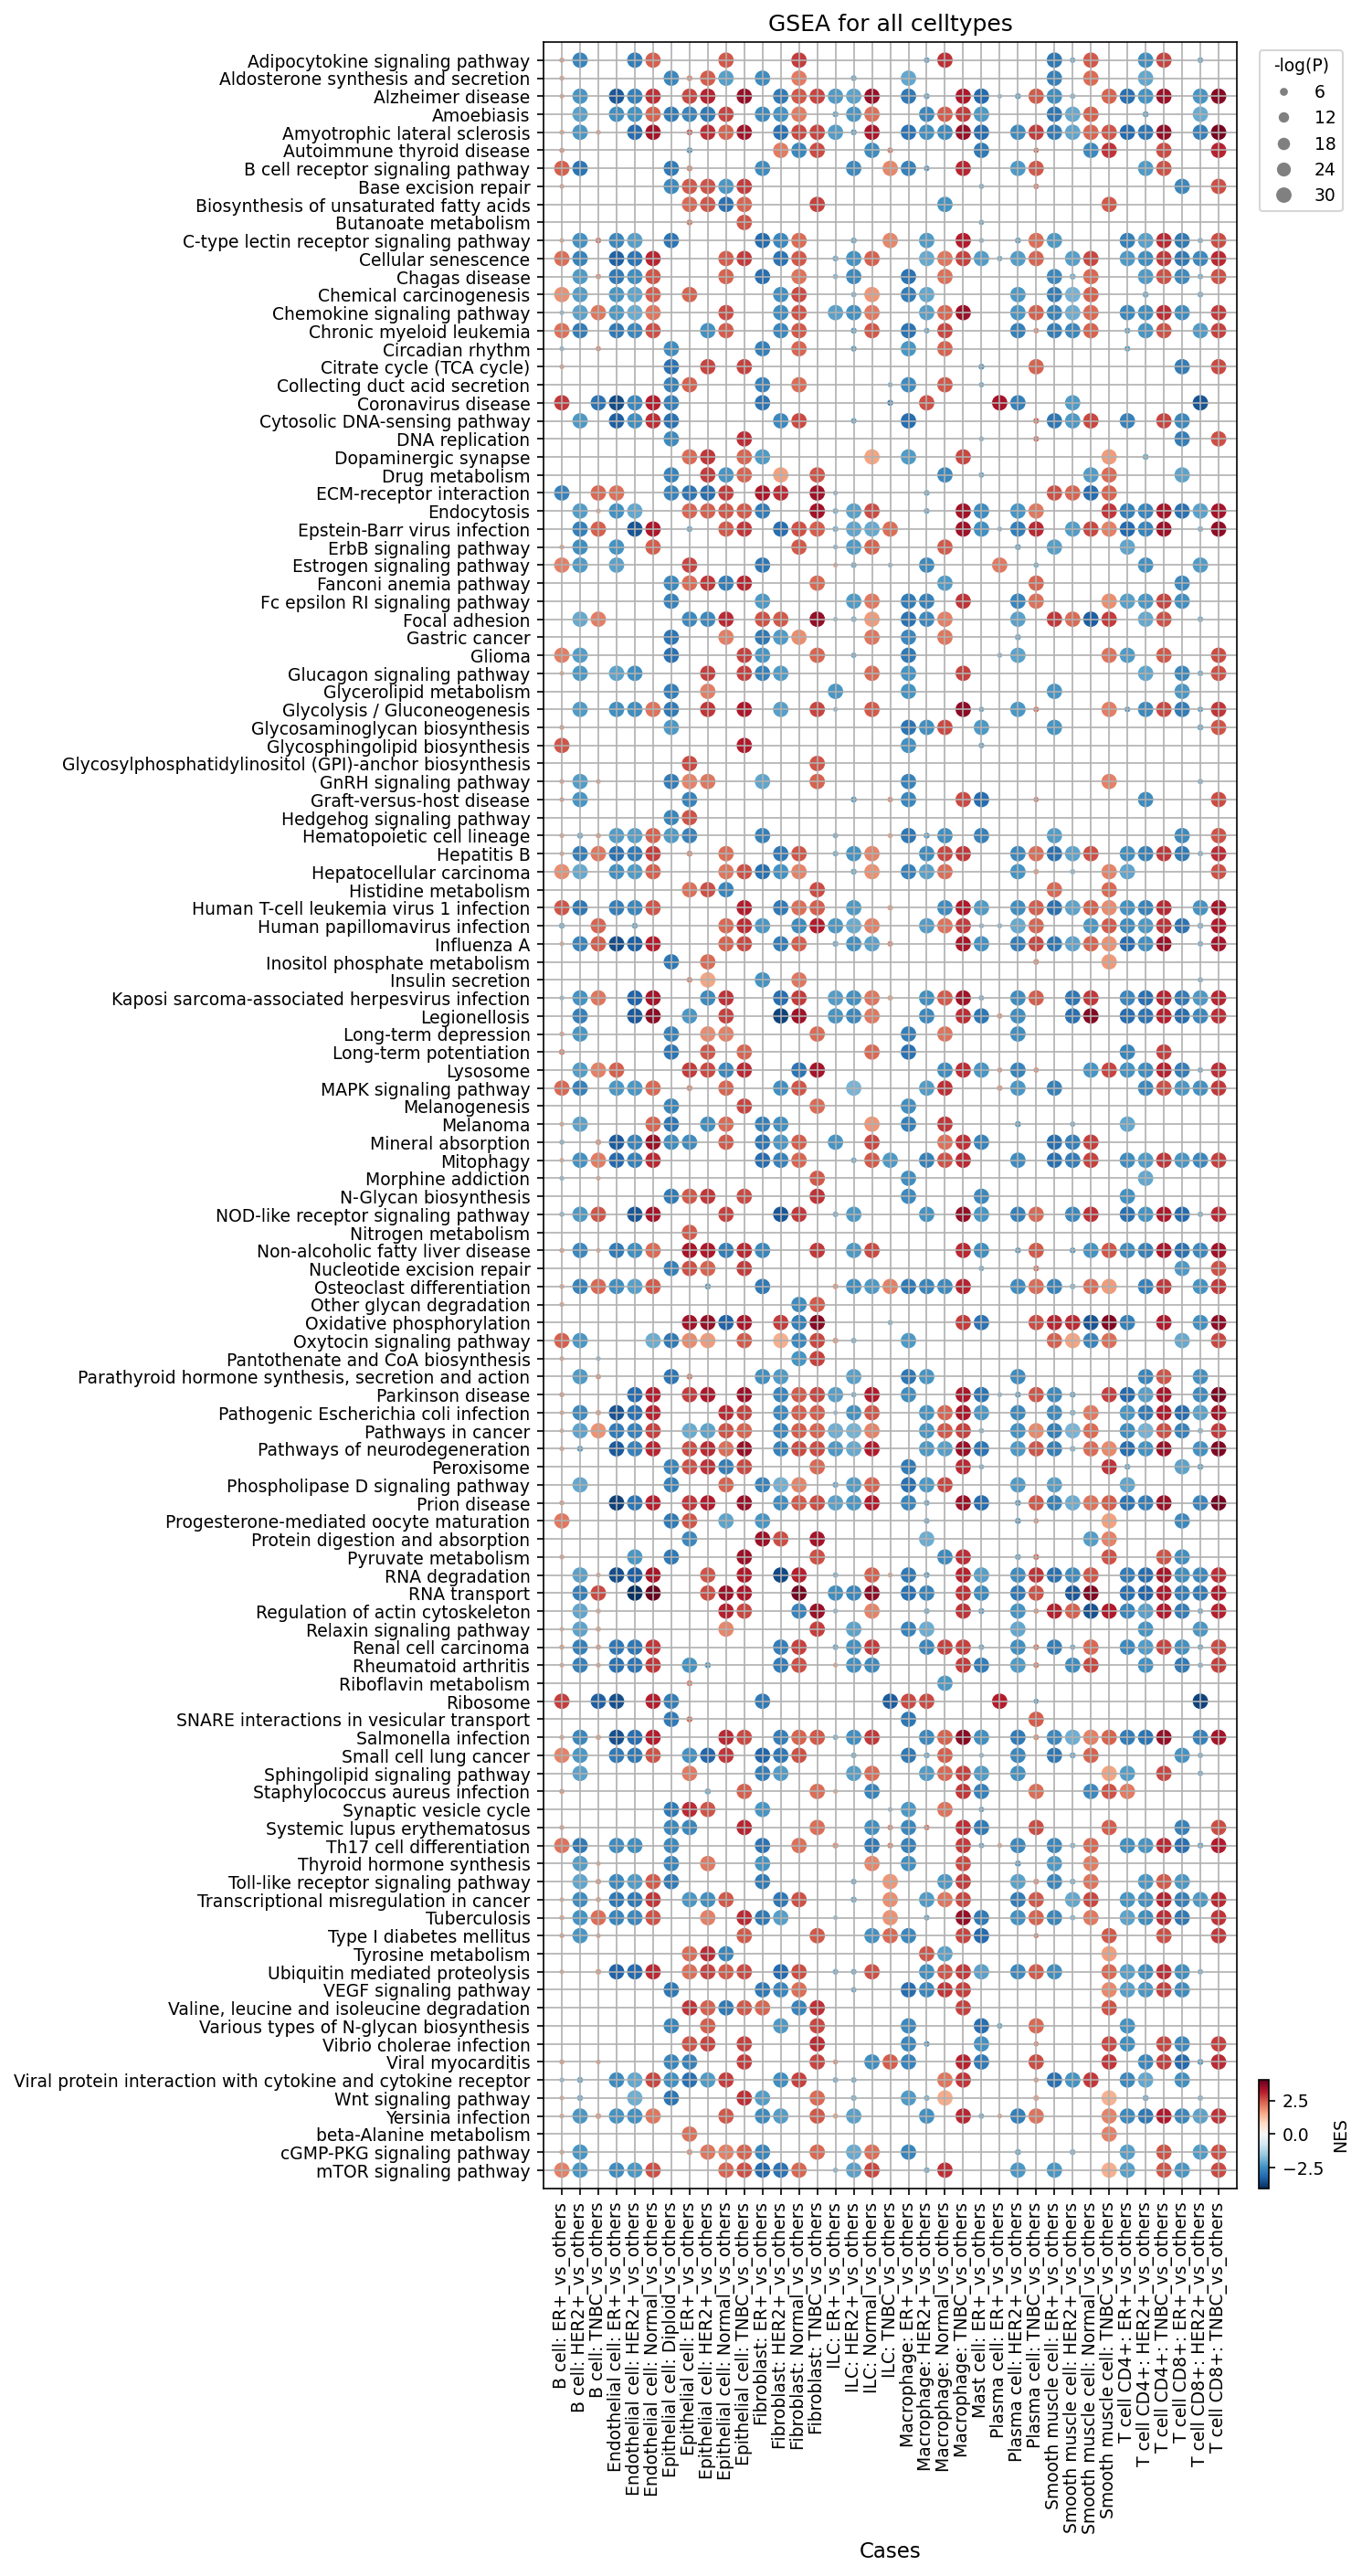
[Analysis Visualization Results]...
Analysis Overview
This analysis presents Gene Set Enrichment Analysis (GSEA) results visualized as a dot plot. The plot displays the enrichment of 120 gene sets (pathways) across various celltype_minor populations, comparing different breast cancer conditions (ER+, HER2+, TNBC) against all other conditions, or normal/diploid cells against others, where target_cells was set to None to include all relevant cell types. Each dot represents a specific gene set and its enrichment in a given cell type/condition comparison. The size of the dot corresponds to the statistical significance (-log(p-val)), while the color indicates the Normalized Enrichment Score (NES), with red signifying positive enrichment (upregulation) and blue signifying negative enrichment (downregulation). The RdBu_r colormap visually distinguishes these directional enrichments.
Visual Summary
The dot plot reveals distinct and varied pathway enrichment patterns across different cell types and breast cancer conditions.
- Condition-Specific Pathway Signatures: Clear patterns emerge for each breast cancer subtype (ER+, HER2+, TNBC). For example, "Estrogen signaling pathway" shows strong positive enrichment (large red dots) specifically in Epithelial cells from ER+ breast cancer, as expected. Similarly, "ErbB signaling pathway" is prominently enriched in Epithelial cells from HER2+ and TNBC conditions.
- Widespread Cancer-Related Pathway Activation: General cancer hallmarks such as "Pathways in cancer", "Wnt signaling pathway", "VEGF signaling pathway", "MAPK signaling pathway", "Glycolysis / Gluconeogenesis", and "Transcriptional misregulation in cancer" are frequently and significantly upregulated (large red dots) across Epithelial cells in all breast cancer subtypes (ER+, HER2+, TNBC vs. others), and also in associated stromal and immune cells (Fibroblasts, Endothelial cells, Macrophages).
- Metabolic Reprogramming: "Glycolysis / Gluconeogenesis" shows consistent positive enrichment in Epithelial cells across all cancer conditions, suggesting a common metabolic shift (Warburg effect) in tumor cells. Other metabolic pathways show more varied enrichments.
- Tumor Microenvironment Engagement: Fibroblasts, Endothelial cells, and various immune cell types (Macrophages, T cells) exhibit significant enrichment in pathways related to the tumor microenvironment (TME). "ECM-receptor interaction" and "VEGF signaling pathway" are notably upregulated in Fibroblasts and Endothelial cells in cancer conditions, indicating active stromal remodeling and angiogenesis. Immune cell types show differential enrichment in "Toll-like receptor signaling pathway", "Chemokine signaling pathway", and "Cytokine-cytokine receptor interaction", reflecting their active, yet potentially dysregulated, roles in the TME.
- Immune Response Pathways: Immune cells like Macrophages and T cells (CD4+, CD8+) show enrichment in various immune signaling pathways (e.g., "Toll-like receptor signaling pathway", "Th17 cell differentiation", "T cell receptor signaling pathway"). These enrichments suggest active immune responses, which can be either anti-tumorigenic or pro-tumorigenic depending on the context of the TME.
- Cellular Senescence: "Cellular senescence" pathway shows significant positive enrichment in Epithelial cells and Fibroblasts across multiple cancer conditions, suggesting its complex role in both tumor suppression and promotion within the breast cancer context.
- Normal vs. Cancer Contrast: Epithelial cells from "Normal_vs_others" and "Diploid_vs_others" comparisons generally show a less pronounced enrichment of cancer-associated pathways, and sometimes negative enrichment (blue dots), reflecting a healthier cellular state compared to their cancerous counterparts.
Biological Interpretation
The GSEA results provide profound insights into the perturbed biological processes underlying breast cancer progression across different cell types.
Epithelial Cell Transformation and Subtype Specificity:
- The strong enrichment of "Estrogen signaling pathway" in ER+ Epithelial cells underscores the critical role of hormone receptor signaling in this subtype, driving proliferation and survival through estrogen-dependent mechanisms PubMed search: Estrogen receptor breast cancer signaling.
- Activation of the "ErbB signaling pathway" (which includes HER2/ERBB2) in HER2+ Epithelial cells highlights the known oncogenic role of HER2 amplification and signaling in this aggressive subtype. Its enrichment in TNBC epithelial cells also points to the basal-like characteristics and potential compensatory signaling in this subtype GeneCards: ERBB2.
- The consistent upregulation of "Pathways in cancer," "Wnt signaling pathway," "MAPK signaling pathway," and "VEGF signaling pathway" in Epithelial cells across all cancer subtypes indicates widespread activation of fundamental oncogenic processes that drive cell proliferation, survival, invasion, and angiogenesis.
- The prominent enrichment of "Glycolysis / Gluconeogenesis" pathways confirms the Warburg effect, a metabolic reprogramming strategy employed by cancer cells to fuel rapid growth even in the presence of oxygen PubMed search: Warburg effect cancer metabolism.
Tumor Microenvironment Remodeling and Support:
- Fibroblasts and Endothelial Cells: The upregulation of "ECM-receptor interaction" and "VEGF signaling pathway" in Fibroblasts and Endothelial cells, particularly in the tumor conditions, reflects their critical roles in desmoplasia (fibrosis) and angiogenesis. Cancer-associated fibroblasts (CAFs) actively remodel the extracellular matrix and secrete factors like VEGF, promoting tumor growth, invasion, and metastasis by fostering new blood vessel formation PubMed search: CAFs tumor microenvironment breast cancer.
- Immune Cell Dysregulation: The enrichment of "Toll-like receptor signaling pathway," "Chemokine signaling pathway," and "Cytokine-cytokine receptor interaction" in various immune cells (Macrophages, T cells) suggests an active, but often dysregulated, immune landscape within the TME. Macrophages, for instance, can be polarized towards an M2-like phenotype, promoting immunosuppression and tumor growth, consistent with the enrichment of these immune response pathways in Macrophages from cancer conditions. T cell pathways may reflect activation but also exhaustion or differentiation into specific pro-tumor subsets like Th17 cells.
Broader Cellular Mechanisms:
- The recurrent enrichment of "Transcriptional misregulation in cancer" across cancer cells emphasizes the widespread genomic and epigenomic alterations that lead to aberrant gene expression, a hallmark of cancer.
- "Cellular senescence" enrichment in tumor-associated cells (Epithelial cells, Fibroblasts) points to a complex role. While senescence can initially halt proliferation as a tumor-suppressive mechanism, senescent cells in the TME can secrete pro-inflammatory and pro-tumorigenic factors, contributing to tumor progression.
Clinical or Translational Implications
The comprehensive GSEA findings have several important clinical and translational implications for breast cancer:
- Targeted Therapy Development: The identification of highly enriched and specific oncogenic pathways (e.g., Estrogen signaling, ErbB signaling, Wnt, MAPK, VEGF) in distinct breast cancer subtypes provides a strong rationale for developing or optimizing targeted therapies. For instance, drugs targeting components of the Wnt pathway might be particularly effective in TNBC given its significant enrichment in this subtype.
- Personalized Medicine: The differential pathway activation across ER+, HER2+, and TNBC subtypes reinforces the need for personalized treatment strategies. Molecular profiling to identify active pathways in a patient's tumor could guide the selection of the most effective therapy.
- Tumor Microenvironment Modulation: The pronounced involvement of stromal and immune cells in cancer-associated pathways suggests that targeting the TME, not just the tumor cells themselves, could be a powerful therapeutic approach. Interventions aimed at inhibiting CAF activation, anti-angiogenesis, or reprogramming immune cells (e.g., Macrophages) could enhance treatment efficacy.
- Metabolic Intervention: The consistent upregulation of glycolysis in tumor epithelial cells suggests that targeting cancer metabolism could be a viable therapeutic strategy, potentially by inhibiting glycolytic enzymes or glucose uptake.
- Immuno-Oncology Strategies: Understanding the specific immune pathways activated or suppressed in different immune cell types within the TME can inform the design of more effective immunotherapies, aiming to overcome immunosuppression or redirect anti-tumor immunity.
- Biomarker Discovery: Pathways showing strong and specific enrichment in certain conditions or cell types could serve as potential diagnostic or prognostic biomarkers, or as pharmacodynamic markers to monitor treatment response.
22. Discussion
This comprehensive single-cell analysis dissects the intricate cellular and molecular landscape of breast cancer, revealing fundamental distinctions between normal breast tissue and its major malignant subtypes: ER+, HER2+, and TNBC. The UMAP visualizations, consistently informed by ploidy and condition, unequivocally demonstrate the genomic instability of epithelial cells within tumor samples, validating their identification as the primary malignant population. Normal epithelial cells consistently maintain a diploid state, contrasting sharply with the widespread aneuploidy observed across all cancer subtypes, although ER+ tumors exhibit greater heterogeneity in ploidy levels than the more consistently aneuploid HER2+ and TNBC samples. This genomic hallmark underpins the distinct biological behaviors observed.
Epithelial cells from all breast cancer subtypes undergo profound metabolic reprogramming, as evidenced by the consistent enrichment of pathways such as oxidative phosphorylation and endoplasmic reticulum protein processing. However, TNBC epithelial cells stand out with significantly elevated cell cycle activity, marked by the upregulation of DNA replication factors (MCMs, PCNA, PTTG1), oncogenes (MYC, HDAC1, WEE1), and a concurrent downregulation of tumor suppressors (SFN, SMAD3, GADD45G, TGFB2). This hyper-proliferative signature underscores the aggressive nature of TNBC, which aligns with its clinical characteristics.
Significant remodeling of the tumor microenvironment (TME) is a pervasive feature. All cancer subtypes demonstrate robust extracellular matrix (ECM) remodeling, driven by activated fibroblasts exhibiting increased expression of integrin-binding collagens and fibronectin. These cancer-associated fibroblasts (CAFs) actively contribute to desmoplasia and tumor progression. Immune cell populations also display marked shifts: cytotoxic T cells are elevated across all cancer subtypes, most prominently in TNBC, suggesting an active but often suppressed anti-tumor immune response. Concurrently, regulatory T cells are increased in ER+ and HER2+ tumors, contributing to immunosuppression. Macrophages exhibit complex reprogramming; while M1-like macrophages are generally increased in tumors (especially HER2+), specific M2 subsets (M2B, M2C, M2D) are reduced compared to normal tissue. Notably, TNBC macrophages show increased M2A-like features, alongside elevated expression of immune regulatory molecules like CD47 and TREM1, suggesting a pro-tumorigenic and immune evasive phenotype.
Cell-cell interaction (CCI) analysis highlights subtype-specific communication hubs. ER+ tumors feature a macrophage-centric microenvironment with TREM2-ligand and LAIR1-LILRB4 interactions promoting immunosuppression. HER2+ tumors display an integrated tumor-immune-angiogenic network, characterized by direct HER2 pathway activation (ERBB2, ERBB3), extensive immune checkpoint engagement (PVR-TIGIT, SIRPA-CD47, VSIR-HLA-F, TGFB1), and robust angiogenesis (VEGFA signaling). TNBC, in contrast, exhibits the most complex and immunosuppressive TME, driven by pervasive immune checkpoints (PD-L1, CTLA4, PVR-TIGIT, SIRPA-CD47), strong TGF-beta signaling, and active chemokine axes (CXCL12-CXCR4, CCL3-CCR1) mediating immune cell trafficking. The unexpected expression of MHC class II molecules (HLA-DRA/F) on TNBC fibroblasts further suggests an active role for CAFs in immune modulation.
These findings collectively emphasize the distinct molecular mechanisms driving each breast cancer subtype. While HER2+ and ER+ cancers leverage established oncogenic pathways, TNBC orchestrates a highly proliferative, desmoplastic, and profoundly immunosuppressive microenvironment, highlighting a pressing need for multi-modal therapeutic strategies. The observed heterogeneity within subtypes, particularly for ER+, further underscores the importance of personalized approaches.
Hypotheses:
- The observed reduction of LTI and ILCreg cells in breast cancer microenvironments contributes to impaired immune surveillance and facilitates tumor progression by compromising lymphoid tissue development and immune regulation.
- The distinct upregulation of proliferative pathways (e.g., MCMs, MYC, PTTG1, WEE1) in Triple-Negative Breast Cancer (TNBC) epithelial cells, coupled with the downregulation of tumor suppressors (SFN, SMAD3), drives its aggressive phenotype and forms a vulnerability for cell cycle-targeted therapies.
- Cancer-associated fibroblasts (CAFs) in TNBC, characterized by high expression of TGFBR2, CD74, and MHC Class II molecules (HLA-DRA/F), actively suppress anti-tumor immunity and promote desmoplasia, thereby contributing to immune evasion and therapeutic resistance.
- The upregulation of CD47 on both TNBC epithelial cells and macrophages establishes a pervasive 'don't eat me' signal, allowing tumor cells and pro-tumorigenic macrophages to evade phagocytosis and contribute to immune escape.
- The simultaneous activation of immune checkpoints (e.g., TIGIT, CTLA4, PD-L1) and co-stimulatory receptors (e.g., GITR, OX40) on CD4+ T cells in TNBC indicates an activated-but-exhausted state, suggesting that combinatorial immune checkpoint blockade and co-stimulation strategies could effectively revive anti-tumor immunity.
- The frequent amplification of 1q21.3 (SOX2) and 8q24.3 (EIF3B) in breast cancer epithelial cells represents novel oncogenic drivers that contribute to tumor initiation or progression independently of established receptor status.
Potential therapeutic targets:
- ESR1: ESR1 (Estrogen Receptor alpha) is the primary driver of proliferation in ER+ breast cancer. Its activation promotes cell cycle progression and survival. Evidence: Highly elevated expression in ER+ epithelial cells, defining diagnostic and prognostic biomarker for ER+ breast cancer. Its activity is central to ER+ tumor growth. (Section 15) Validation: Response to established endocrine therapies such as Tamoxifen, Aromatase Inhibitors, and SERDs like Fulvestrant serves as continuous clinical validation. Further patient stratification based on ESR1 expression levels predicts response rates.
- ERBB2 (HER2): ERBB2 amplification and overexpression are critical drivers of tumor growth and aggressiveness in HER2+ breast cancer, leading to constitutive activation of downstream proliferative and survival pathways. Evidence: Very high expression and prevalence specifically in HER2+ epithelial cells. Identified as a hallmark amplification in CNV analysis (17q12). Strong enrichment of ErbB signaling pathway in GSEA. (Sections 4, 15, 21) Validation: Clinical efficacy of HER2-targeted therapies (Trastuzumab, Pertuzumab, Lapatinib, ADCs like T-DM1) directly validates ERBB2 as a therapeutic target. Diagnostic testing for HER2 status guides treatment decisions.
- CD47: CD47 acts as a 'don't eat me' signal, binding to SIRPα on phagocytic cells to inhibit phagocytosis. Its high expression on HER2+ and TNBC epithelial cells, and TNBC macrophages, allows tumor cells to evade innate immune surveillance. Evidence: Elevated expression on HER2+ and TNBC epithelial cells and TNBC macrophages. Cell-cell interaction analysis shows prominent SIRPA_CD47 signaling in HER2+ and TNBC. (Sections 12, 15, 16) Validation: Preclinical studies show CD47-blocking antibodies (e.g., Magrolimab) restore macrophage phagocytosis of cancer cells. Clinical trials are ongoing to assess its efficacy in various cancers, including breast cancer, potentially in combination with other immunotherapies or targeted agents.
- TGFBR2 / TGF-beta Pathway: TGF-β signaling, mediated by TGFBR2 on fibroblasts, is a paramount driver of cancer-associated fibroblast (CAF) differentiation, ECM remodeling, fibrosis, and a profoundly immunosuppressive TME in breast cancer, especially TNBC. Evidence: High expression of TGFBR2 on TNBC fibroblasts. Pervasive and strong TGFB1_TGFbeta_receptor interactions across HER2+ and TNBC. GSEA shows enrichment of TGF-beta signaling pathways in cancer. (Sections 12, 13, 14, 17) Validation: TGF-β receptor kinase inhibitors (e.g., galunisertib) and neutralizing antibodies against TGF-β ligands are in clinical trials. Validation would involve assessing their ability to revert CAF activation, reduce fibrosis, and enhance immune responses in TNBC models and patients.
- PDGFRB: PDGFRB is a hallmark marker of activated cancer-associated fibroblasts (CAFs) across all breast cancer subtypes. Its signaling drives fibroblast proliferation, differentiation into myofibroblasts, and excessive ECM deposition, contributing to desmoplasia and an immunosuppressive TME. Evidence: Consistently high expression and prevalence in fibroblasts from all breast cancer conditions (ER+, HER2+, TNBC) compared to normal. (Section 17) Validation: Small molecule tyrosine kinase inhibitors (TKIs) targeting PDGFRB (e.g., imatinib, sunitinib) are clinically available. Validation involves assessing their ability to reprogram CAFs, reduce tumor stiffness, improve drug delivery, and enhance responses to chemotherapy or immunotherapy in breast cancer patients.
- TIGIT: TIGIT is an inhibitory immune checkpoint receptor highly expressed on CD4+ T cells in TNBC. It suppresses T cell activation and proliferation, contributing to T cell exhaustion and immune evasion. Evidence: Strong upregulation of TIGIT on CD4+ T cells, particularly in TNBC. Cell-cell interaction analysis shows PVR_TIGIT interactions in HER2+ and TNBC. (Sections 12, 13, 18) Validation: Anti-TIGIT antibodies (e.g., tiragolumab) are in clinical trials. Validation would demonstrate that TIGIT blockade restores T cell function and enhances anti-tumor immunity in TNBC, potentially in combination with PD-1/PD-L1 inhibitors.
- EPHA2: EPHA2 is a receptor tyrosine kinase often overexpressed and aberrantly activated in TNBC epithelial cells, driving tumor growth, angiogenesis, and resistance to therapy by promoting cell migration and invasion. Evidence: Significantly elevated expression in TNBC epithelial cells. Correlates with aggressive disease and poor patient outcomes. (Section 15) Validation: Preclinical and early clinical development of antibodies and small molecule inhibitors targeting EPHA2. Validation would involve assessing the impact of EPHA2 inhibition on TNBC cell proliferation, migration, invasion, and tumor growth in vitro and in vivo.
- WEE1: WEE1 is a G2/M checkpoint kinase whose upregulation in TNBC epithelial cells can allow cancer cells to bypass DNA damage checkpoints and continue dividing, contributing to uncontrolled proliferation. Evidence: Significantly higher expressing cell fraction of WEE1 in TNBC epithelial cells compared to normal and other subtypes. (Section 19) Validation: WEE1 inhibitors are being explored in clinical trials for various solid tumors, including breast cancer, often in combination with DNA-damaging agents. Validation would assess whether WEE1 inhibition sensitizes TNBC cells to genotoxic stress or other therapies.
- CXCR4 / CXCL12-CXCR4 axis: The CXCL12-CXCR4 axis is a well-known pathway that promotes angiogenesis, metastasis, and the recruitment of immune suppressive cells to the TME, particularly prominent in TNBC. Evidence: Strong CXCL12_CXCR4/CXCR7 interactions identified in TNBC CCI analysis. (Sections 12, 14) Validation: CXCR4 antagonists (e.g., Plerixafor) are clinically approved for other indications, and other CXCR4 inhibitors are in development for solid tumors. Validation would assess if blocking this axis reduces metastasis and improves the immune microenvironment in TNBC models and patients.
Follow-up validation ideas:
- Flow Cytometry/Immunostaining: Quantify LTI and ILCreg cell populations in larger cohorts of normal and breast cancer tissues using flow cytometry or multiplexed immunostaining to confirm their reduction in tumors and correlate with clinical outcomes.
- Perturbation Assays (in vitro/in vivo): Use genetic (CRISPR/shRNA) or pharmacological inhibition to target MYC, WEE1, or MCMs in TNBC cell lines and organoids. Assess effects on proliferation, apoptosis, and DNA damage response. In vivo studies could involve xenograft models with these inhibitors.
- Functional Assays (Fibroblasts): Culture CAFs from TNBC samples and assess their ability to suppress T cell proliferation or produce ECM components. Perturb TGFBR2, CD74, or HLA-DRA/F expression using CRISPR/shRNA and measure the impact on CAF-mediated immunosuppression and matrix deposition. Use co-culture models with T cells.
- Phagocytosis Assays: Conduct in vitro phagocytosis assays using patient-derived tumor cells and macrophages from TNBC, with and without CD47 blocking antibodies, to quantify the restoration of macrophage-mediated tumor cell engulfment. In vivo validation could involve patient-derived xenograft (PDX) models.
- T cell Functional Assays: Sort CD4+ T cells from TNBC samples with high TIGIT, GITR, and OX40 expression. Perform in vitro T cell activation and exhaustion assays with combinations of TIGIT-blocking antibodies and GITR/OX40 agonists to assess restoration of cytokine production, proliferation, and anti-tumor cytotoxicity.
- FISH/qPCR Validation: Validate the functional significance of SOX2 and EIF3B amplifications by conducting FISH on tumor tissues to confirm amplification at the DNA level, and correlating gene expression with clinical outcomes and tumor characteristics. Functional studies in cell lines with forced overexpression or knockdown could explore their impact on proliferation and metastasis.
- Spatial Transcriptomics/Proteomics: Apply spatial transcriptomics or multiplexed imaging (e.g., CODEX, IMC) to breast cancer tissue sections to map the precise localization of altered macrophage and fibroblast subsets (e.g., CD47+ macrophages, TGFBR2+ fibroblasts, HLA-DRA/F+ fibroblasts) and their physical interactions with tumor cells and T cells within the TME, providing crucial context for functional roles.
Limitations:
The single-cell RNA-seq data provides snapshots of cellular states and inferred interactions; it does not directly capture real-time cellular dynamics or spatial organization within the tumor microenvironment. While CNV estimates and ploidy assignments are valuable, they are computational inferences and require orthogonal genomic validation. The identified therapeutic targets are based on expression patterns and known biological roles; their functional relevance and efficacy in clinical settings would necessitate extensive in vitro, in vivo, and clinical validation. Causality cannot be definitively established from correlative expression or interaction patterns alone. The definition of cell type subsets and macrophage polarization states relies on marker-based annotations, which may not fully capture the continuous spectrum of cellular phenotypes and functional plasticity.
23. Query List
- Show and save UMAPs for condition, sample, major cell type, minor cell type, ploidy_dec, and celltype_subset in two columns.
- Show major cell type scores on UMAP and save the result.
- Show and save a marker expression dot plot for celltype_subset. SET target_cell = None and var_group_rotation = 45. Leave all other arguments at their default values.
- Select Epithelial cells, show a CNV heatmap grouped by sample together with a summary of regions with significantly amplified copy numbers, and save the results.
- Show and save UMAPs of CNV patterns colored by major cell type, minor cell type, ploidy results, condition, and sample in two columns.
- Show and save a population bar plot of minor cell types.
- Show and save a population bar plot of T cell subsets.
- Show and save box plots of T cell subset populations with statistically significant differences between conditions, if any. Choose ncols based on the total number of panels.
- Show and save a population bar plot of macrophage subsets.
- Show and save box plots of macrophage subset populations with statistically significant differences between conditions, if any. Choose ncols based on the total number of panels.
- Select Epithelial cells, show their ploidy populations as a bar plot, and save the result.
- Show and save cell-cell interaction patterns involving Epithelial cells, fibroblasts, macrophages, T cells, and other relevant cell types. Select at most 80 cell-cell interactions per group.
- Select only genes associated with immune checkpoint and cell cycle pathways, show cell-cell interactions for these genes, and save the result.
- Find cell-cell interactions involving major immune and stromal cells that differ significantly between conditions, show them as a dot plot, and save the result. Set max_n_items_per_group to 60. For each interaction identified under each condition, using the provided dataset context, describe the associated signaling pathways and mechanisms, its potential as a therapeutic target, and relevant therapeutic agents.
- Show marker expressions for Epithelial cells in a dot plot, and save the result. Use only surfaceome markers, with at most 60 markers per condition. For the markers identified under each condition, distinguish between established therapeutic targets and less well-characterized markers with potential as therapeutic targets. For each marker, using the provided dataset context, describe the associated signaling pathways and mechanisms, relevant therapeutic agents, and supporting evidence.
- Show marker expressions for macrophages in a dot plot, and save the result. Use only surfaceome markers, with at most 40 markers per condition. For each marker identified under each condition, using the provided dataset context, describe the associated signaling pathways, the role of the corresponding cell type in the tumor microenvironment, the marker’s potential as a therapeutic target, relevant therapeutic agents, and other pertinent information.
- Show marker expressions for fibroblasts in a dot plot, and save the result. Use only surfaceome markers, with at most 40 markers per condition. For each marker identified under each condition, using the provided dataset context, describe the associated signaling pathways, the role of the corresponding cell type in the tumor microenvironment, the marker’s potential as a therapeutic target, relevant therapeutic agents, and other pertinent information.
- Show marker expressions for CD4 T cells in a dot plot, and save the result. Use only surfaceome markers, with at most 40 markers per condition. For each marker identified under each condition, using the provided dataset context, describe the associated signaling pathways, the role of the corresponding cell type in the tumor microenvironment, the marker’s potential as a therapeutic target, relevant therapeutic agents, and other pertinent information.
- Among cell cycle pathway genes, select those with statistically significant expression differences between conditions in Epithelial cells, show box plots, and save the result. Set max_n_items_to_plot to 24 and choose ncols based on the total number of panels for an overall width-to-height ratio of approximately 2:3.
- Show and save Gene Ontology (GSA) analysis results for Epithelial cells as a bar plot.
- Show Gene Set Enrichment Analysis results as a dot plot, and save it. Set the color map to RdBu_r, n_pws_to_show to 120, and target_cells to None.