Single-Cell Transcriptomic Analysis of Peripheral Blood Reveals Systemic Immune Dysregulation in Idiopathic Pulmonary Fibrosis Progression
This single-cell RNA sequencing analysis of peripheral blood reveals significant immune cell compositional and functional shifts in Idiopathic Pulmonary Fibrosis (IPF) patients, particularly those with progressive disease. Key findings include an expansion of monocytes and a reduction in naive T cells, alongside a distinct activation signature in progressive IPF characterized by exhausted CD8+ T cells (TIGIT+) and heightened pro-inflammatory cell-cell interactions. Enriched pathways indicate broad immune activation, enhanced cell migration, and metabolic reprogramming, collectively pointing to a systemic immune dysregulation that likely fuels disease progression.
Contents
- Dataset overview
- UMAP Visualization of Single-Cell Blood Transcriptome in Idiopathic Pulmonary Fibrosis
- UMAP Visualization of Major Cell Type Scores and Annotations
- Marker Expression Dot Plot for Cell Subsets
- Peripheral Blood Immune Cell Population Shifts in Idiopathic Pulmonary Fibrosis
- Population Analysis of T cell Subsets in Idiopathic Pulmonary Fibrosis
- Analysis of Lymphoid Cell Population Proportions in IPF Conditions
- Cell-Cell Interaction Pattern Analysis in Idiopathic Pulmonary Fibrosis (IPF)
- Condition-Specific Cell-Cell Interaction Patterns in Idiopathic Pulmonary Fibrosis
- T cell CD8+ Condition-Specific Surfaceome Marker Expression in Idiopathic Pulmonary Fibrosis
- Monocyte Condition-Specific Surfaceome Marker Expression Analysis in Idiopathic Pulmonary Fibrosis
- Surfaceome Marker Expression in CD4+ T Cells from Progressive Idiopathic Pulmonary Fibrosis
- Gene Ontology (GSA) Analysis of Monocytes across Idiopathic Pulmonary Fibrosis Conditions
- Gene Set Enrichment Analysis Across Blood Cell Types in Idiopathic Pulmonary Fibrosis
- Discussion
- Query List
0. Dataset overview
Dataset Summary
- 이 데이터는 89619개의 세포와 21249개의 유전자를 포함하는 단일 세포 RNA-seq 데이터셋입니다.
- AnnData 객체에는 sample, condition, celltype_major, celltype_minor, celltype_subset, cluster 등의 관측치(obs) 정보와 gene_symbol 등의 유전자(var) 정보가 포함되어 있습니다.
- 데이터는 인간 혈액 조직에서 유래했으며, progressive_ipf, stable_ipf, control 세 가지 조건으로 구성되어 있습니다.
- 주요 세포 유형(celltype_major)으로는 T cell, Myeloid cell, B cell 등이 있으며, 하위 세포 유형(celltype_minor, celltype_subset)으로 더 세분화되어 있습니다.
- 복사수 변이(CNV) 추정치는 이 데이터셋에서 제공되지 않습니다.
- DEG, GSEA, GO/GSA 분석을 위한 참조 조건은 'control'입니다.
- 사전 계산된 결과로는 CCI(세포-세포 상호작용), DEG(차등 발현 유전자), GSEA(유전자 세트 농축 분석), GSA/GO(유전자 온톨로지) 결과가 세포 유형 및 조건별로 저장되어 있습니다.
1. UMAP Visualization of Single-Cell Blood Transcriptome in Idiopathic Pulmonary Fibrosis
[Analysis Visualization Results]...
Analysis Overview
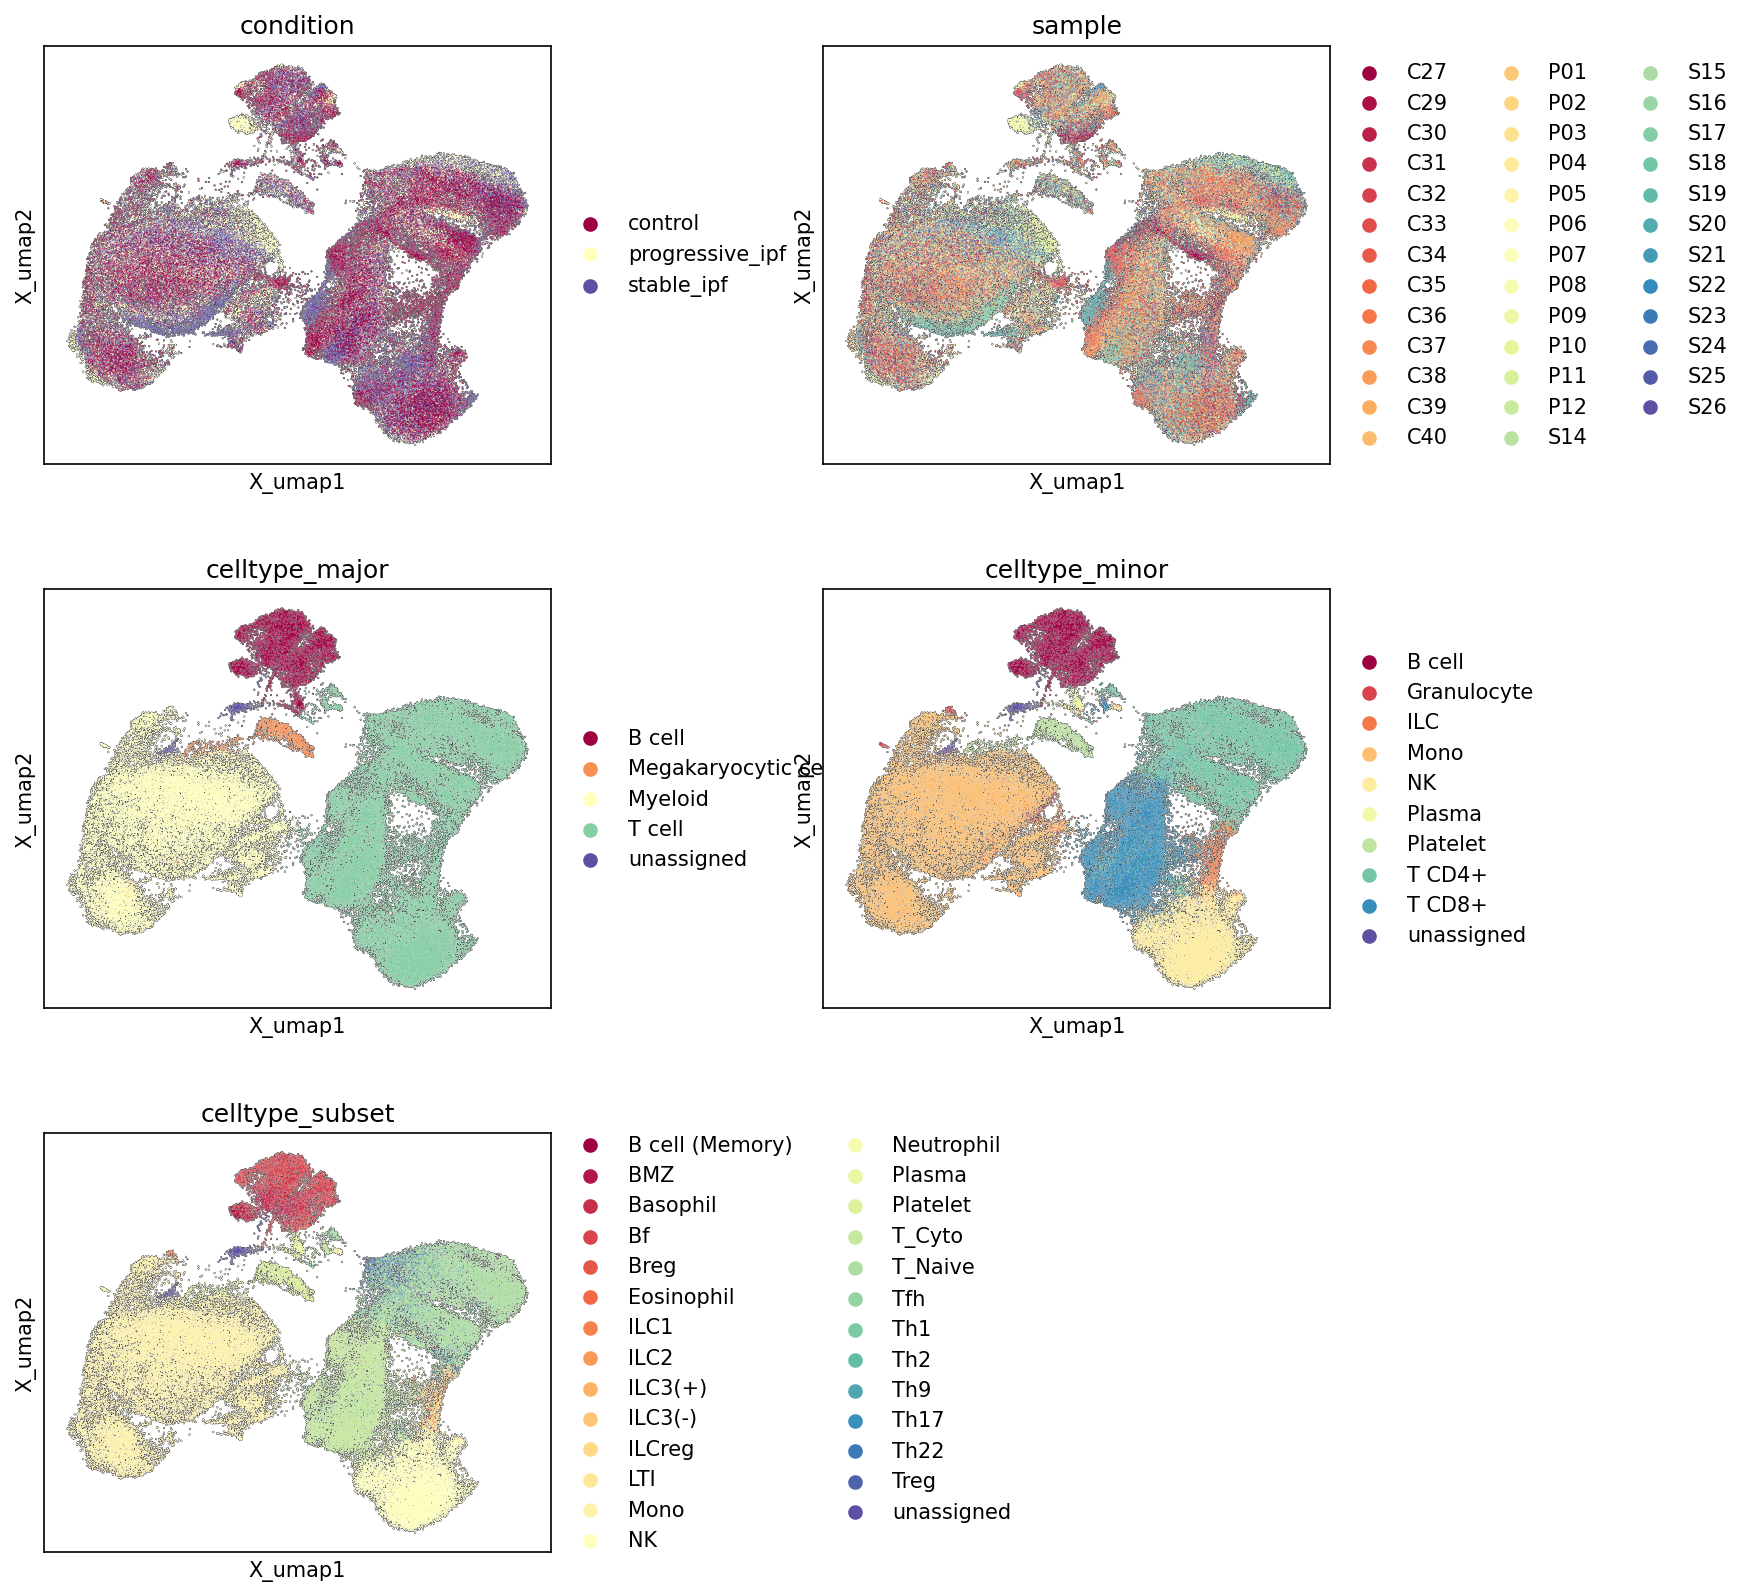
This analysis presents Uniform Manifold Approximation and Projection (UMAP) plots derived from single-cell RNA-sequencing data of human blood. The dataset comprises 89619 cells and 21249 genes, obtained from individuals with different Idiopathic Pulmonary Fibrosis (IPF) conditions (control, progressive_ipf, stable_ipf). The UMAPs visualize the cellular embedding, colored by condition, individual sample, celltype_major, celltype_minor, and celltype_subset. These visualizations serve to evaluate the dataset's global structure, assess the quality of cell type annotations, and identify potential batch effects or condition-specific distributions of cell populations.
Visual Summary
- Condition: The UMAP plot colored by condition shows a general intermingling of cells from control, progressive_ipf, and stable_ipf across the primary cell clusters. This indicates that the global cellular landscape is largely shared between these groups. However, closer inspection suggests subtle differences in cell density or enrichment in specific regions for certain conditions. For instance, some peripheral or smaller clusters might show a slight overrepresentation of cells from progressive_ipf or stable_ipf compared to control, or vice versa. This implies that while major cell types are present across all conditions, their relative proportions or transcriptional states within these cell types may vary subtly with disease status.
- Sample: The sample UMAP demonstrates effective data integration. Cells from numerous individual samples are extensively mixed throughout the UMAP space, with no clear clusters dominated by single samples. This widespread intermingling indicates that batch effects, which could otherwise confound biological interpretation, have been largely mitigated. This is crucial for ensuring that observed differences are attributable to biological variation rather than technical artifacts.
- Celltype_major: This plot clearly delineates major immune cell populations. T cell (light green/teal) forms a prominent, large cluster. Myeloid cell (yellowish-orange) occupies another substantial region, distinct from T cells. B cell (dark red) forms a well-separated cluster, notably in the upper-left quadrant. Megakaryocytic cell (orange) forms a smaller, yet distinct cluster. The unassigned cell population (dark blue) is minimal and scattered, suggesting a high degree of confidence and completeness in the major cell type annotations.
- Celltype_minor: The celltype_minor UMAP provides a higher resolution view, showing distinct sub-populations within the major cell types. Within the T cell cluster, T cell CD4+ (light green) and T cell CD8+ (dark blue) are clearly resolved. The myeloid compartment differentiates into Monocyte (orange) and Granulocyte (red-orange) clusters. NK cell (dark yellow), Plasma cell (light yellow), and Platelet (light green) also form well-defined, separate clusters, indicating robust annotation at this granular level.
- Celltype_subset: The celltype_subset UMAP offers the highest level of detail, revealing fine-grained cellular heterogeneity. Within the B cell compartment, subsets like B cell (Memory), BMZ, Bf, and Breg are discernible. The T cell space further resolves into specific subsets such as T cell (Naive), T cell (Cytotoxic), T cell (Treg), and various Th cell types (Th1, Th2, Th9, Th17, Th22). Similarly, ILC subsets and specific myeloid cells like Neutrophil, Eosinophil, and Basophil are also resolved into distinct regions, confirming the comprehensive and highly resolved nature of the cell type annotations.
Biological Interpretation
The UMAP visualizations of blood cells from IPF patients and controls offer critical insights into the dataset's quality and the potential impact of IPF on circulating immune cells.
- High-Resolution Cell Type Characterization: The excellent separation of cell populations across major, minor, and subset levels demonstrates the high quality and granularity of the cell type annotations. This robust cell type assignment is foundational for any subsequent differential analyses, allowing for precise identification of condition-specific changes within specific immune cell populations. The successful resolution of diverse blood cell types, including various T cell, B cell, ILC, and myeloid subsets, reflects the biological complexity captured by the single-cell RNA-seq data.
- Effective Integration and Minimized Batch Effects: The thorough intermixing of cells from different samples underscores the success of the data integration strategy. This reduces the risk of confounding batch effects influencing the biological interpretation, enabling more confident conclusions about disease-related cellular changes rather than technical variability.
- Subtle Condition-Associated Cellular Shifts: While no dramatic, condition-exclusive cell clusters are observed, the visible overlaps and subtle enrichments of specific conditions in certain UMAP regions suggest that IPF may induce quantitative changes in the composition of circulating immune cells or alter their transcriptional states. For instance, certain T cell or myeloid cell subsets might be expanded or activated/suppressed in progressive_ipf or stable_ipf compared to control. These observations align with the understanding that IPF involves systemic immune dysregulation that can impact peripheral blood cell profiles PMID: 31084206. Further differential abundance testing and cell-type-specific differential gene expression analyses will be crucial to statistically confirm and characterize these changes.
Annotation Notes
The presented UMAPs affirm the high quality of the single-cell dataset and its annotations. The clear hierarchical clustering of cell types, from broad categories to highly specific subsets, indicates robust cell identification. The minimal presence of unassigned cells further supports the comprehensiveness of the annotation. The successful integration across samples, with no apparent batch effects, suggests the dataset is well-prepared for downstream comparative analyses focused on the biological effects of IPF. The next steps should involve quantitative analysis of cell type proportions and gene expression changes to pinpoint the specific cellular alterations associated with IPF progression.
2. UMAP Visualization of Major Cell Type Scores and Annotations
[Analysis Visualization Results]...
Analysis Overview
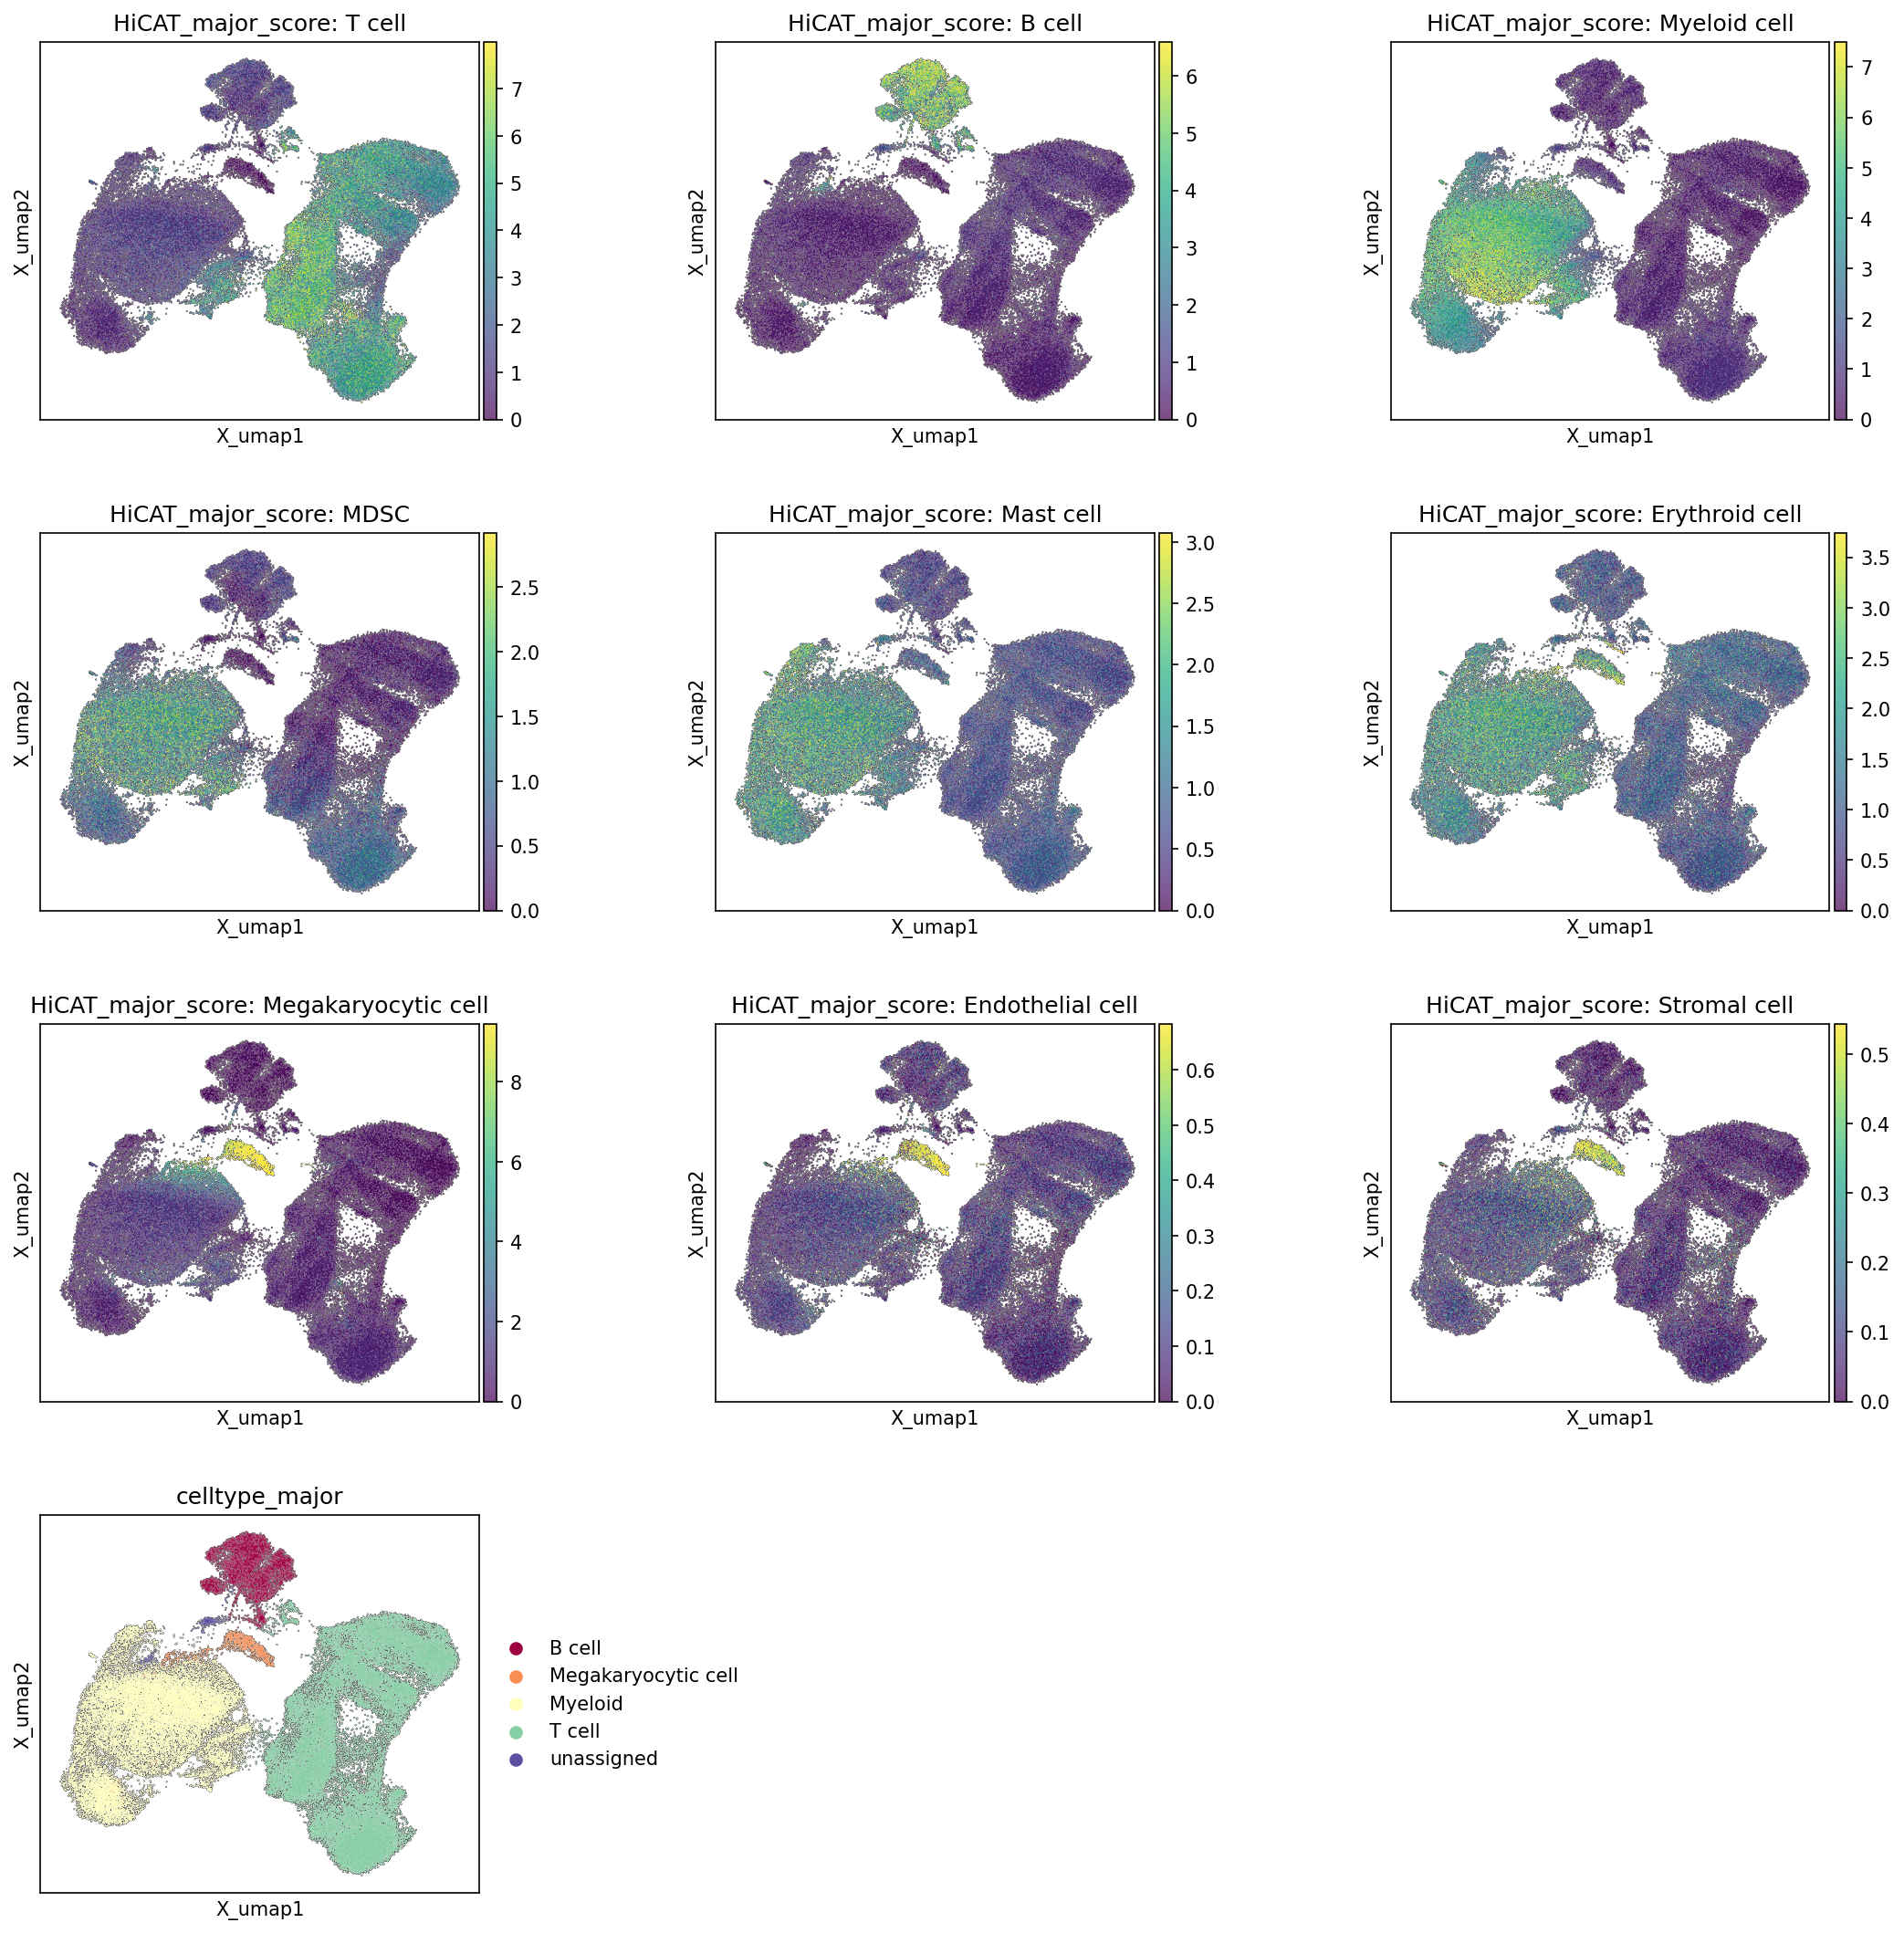
This analysis visualizes major cell type scores, computed using HiCAT, on a Uniform Manifold Approximation and Projection (UMAP) embedding. The purpose is to evaluate how well the calculated cell type scores align with the existing celltype_major annotations and to identify potential additional populations or areas for annotation refinement within the single-cell RNA-seq data from human blood samples in the context of Idiopathic Pulmonary Fibrosis (IPF).
Visual Summary
The UMAP projection displays a clear separation of cellular populations. The celltype_major plot shows five primary annotated cell groups: T cells, Myeloid cells, B cells, Megakaryocytic cells, and an 'unassigned' category.
- Concordant Cell Types: The HiCAT_major_score plots for "T cell", "B cell", "Myeloid cell", and "Megakaryocytic cell" show strong co-localization with their respective discrete clusters in the celltype_major annotation.
- "T cell" scores are highly concentrated in the large cluster on the right side of the UMAP, which is annotated as T cells.
- "Myeloid cell" scores are prominent in the large cluster on the left, corresponding to the Myeloid cell annotation.
- "B cell" scores intensely highlight a distinct, smaller cluster at the top-central region.
- "Megakaryocytic cell" scores identify another distinct, compact cluster adjacent to the B cell cluster.
Additional Cell Type Scores:
- The "MDSC" (Myeloid-derived Suppressor Cell) score shows a localized region of higher intensity, primarily within or adjacent to the Myeloid cell cluster, indicating a potential myeloid subpopulation.
- The "Mast cell" score highlights a distinct, small population, appearing somewhat separate from the main immune clusters.
- The "Erythroid cell" score clearly delineates a compact, specific cluster, not explicitly annotated in celltype_major but representing a common blood component.
- "Endothelial cell" and "Stromal cell" scores are very low and broadly dispersed across the UMAP, with only minimal, sparse areas of slightly elevated signal. This is consistent with their expected low abundance, if any, in a blood-derived single-cell dataset.
- Unassigned Population: The 'unassigned' population in the celltype_major plot is somewhat distributed, appearing within the major T cell and Myeloid lobes, as well as within the smaller top cluster.
Biological Interpretation
The strong concordance between the computed HiCAT_major_score values and the existing celltype_major annotations for key immune cell types (T cells, B cells, Myeloid cells, Megakaryocytic cells) provides robust validation for the initial cell type identification. This suggests that the transcriptomic profiles of these major cell populations are distinct and well-captured by the embedding.
The presence of distinct HiCAT_major_score signals for MDSC, Mast cells, and Erythroid cells, which are not explicitly included in the celltype_major column, is biologically significant. Myeloid-derived suppressor cells (MDSCs) and Mast cells are known to play roles in chronic inflammation and fibrotic diseases like IPF, and their identification in blood could indicate systemic immune dysregulation. Erythroid cells are expected in blood, and their clear identification by the score further confirms the quality of the data and analysis. The very low scores for Endothelial and Stromal cells align with the fact that the sample source is blood, not solid tissue, minimizing potential contamination from non-hematopoietic cells.
Annotation Notes
The HiCAT_major_score plots largely confirm the quality and accuracy of the existing celltype_major annotations for T cells, B cells, Myeloid cells, and Megakaryocytic cells, as their corresponding scores are highly concentrated within their respective annotated clusters.
The analysis also reveals opportunities for refining the existing annotations:
- The unassigned population in celltype_major could potentially be further resolved by examining the regions where it overlaps with higher scores for cell types like MDSC, Mast cell, or Erythroid cell.
- The distinct clusters identified by the MDSC, Mast cell, and Erythroid cell scores suggest that these populations, though not explicitly in celltype_major, are well-represented in the dataset. These scores provide valuable information for a more granular cell type annotation, especially for rare or less common populations within the blood, and can be used to enrich or refine existing classifications.
3. Marker Expression Dot Plot for Cell Subsets
[Analysis Visualization Results]...
Analysis Overview
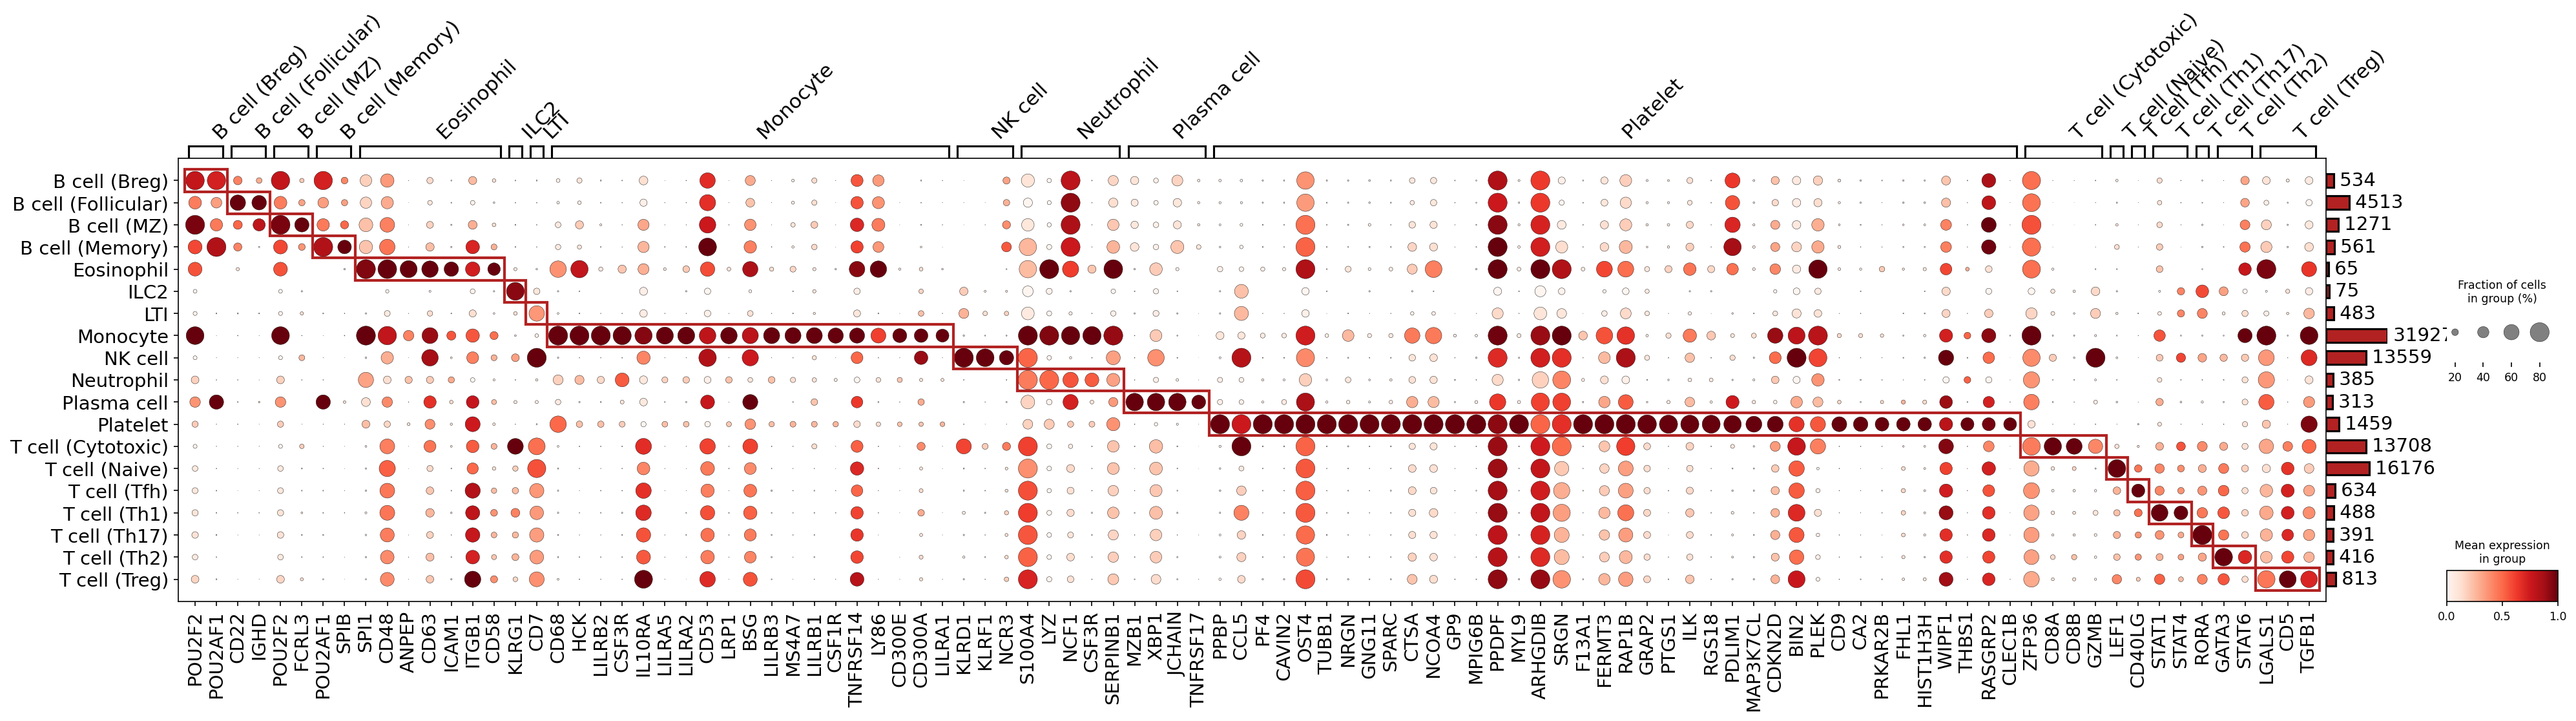
This analysis presents a marker expression dot plot, illustrating the expression patterns of identified marker genes across various fine-grained cell subsets (celltype_subset) in the provided single-cell RNA-seq dataset. Each row represents a celltype_subset, and each column represents a gene. The size of the dot corresponds to the fraction of cells within that group expressing the gene, while the color intensity indicates the mean expression level of the gene in that cell group. The primary goal of this visualization, as per the user query and interpretation priority, is to assess the quality and biological consistency of the assigned celltype_subset annotations by examining their respective marker gene expression profiles.
Visual Summary
The dot plot displays a matrix of marker gene expression across 24 distinct celltype_subset populations. The genes on the x-axis are grouped by the celltype_subset they are identified to mark, and red boxes highlight these expected primary expression patterns.
- Distinct Clusters: Several cell types exhibit strong, highly specific expression of their designated marker genes, forming clear dark red, large dots within their respective red boxes and showing minimal expression elsewhere. This pattern suggests robust and well-defined annotations. Examples include: Monocytes, NK cells, Neutrophils, Plasma cells, Platelets, and T cell (Cytotoxic).
- Shared Markers: Some markers show expression in multiple related cell types (e.g., POU2F2 and POU2AF1 are broad B cell markers expressed across all B cell subsets). Eosinophil markers show some overlap with Monocytes and B cells.
- Ambiguous or Contradictory Patterns: A subset of T cell helper lineages (Th1, Th17, Th2, Tfh, Naive, Treg) and certain innate lymphoid cell types (ILC2, LTI) show less clear or, in some instances, biologically contradictory marker expression profiles. The chosen markers for these groups do not consistently align with canonical gene expression profiles expected for these cell types.
Biological Interpretation
The marker expression analysis serves as a critical quality control step for cell type annotation.
Well-Supported Annotations:
- B cell subsets (Breg, Follicular, MZ, Memory): These subsets generally show canonical B cell markers like POU2F2 (OCT-2) and POU2AF1 (OBF-1), which are crucial for B cell development and function [PubMed Search: POU2F2 B cell]. IGHD, encoding IgD, is prominently expressed in B cell (Follicular), consistent with naive/follicular B cells.
- Monocyte: This group is highly distinctive, expressing a broad array of myeloid-associated markers such as CD68, HCK, LILRB2, and CSF1R, which are characteristic of monocyte/macrophage lineage [GeneCards: CSF1R].
- NK cell: Defined by classical natural killer cell receptors and markers like KLRD1 (CD94), KLRF1, and NCR3 (NKp30), confirming their identity [UniProt: KLRD1].
- Neutrophil: Shows specific expression of LYZ (lysozyme) and NCF1 (neutrophil cytosolic factor 1), key components of neutrophil antibacterial defense [GeneCards: LYZ].
- Plasma cell: Strongly characterized by markers such as MZB1, JCHAIN (joining chain for polymeric immunoglobulins), XBP1 (a transcription factor critical for plasma cell differentiation), and TNFRSF17 (BCMA), all hallmarks of plasma cells [PubMed Search: XBP1 plasma cell differentiation].
- Platelet: An extremely well-defined population with high and specific expression of numerous platelet-associated genes, including PF4 (platelet factor 4) and GP9 (glycoprotein IX, CD42a), which are essential for platelet function and adhesion [GeneCards: PF4].
- T cell (Cytotoxic): Clearly identified by CD8A/B (co-receptor for cytotoxic T cells) and GZMB (Granzyme B), an effector molecule for cytotoxic function [UniProt: GZMB].
Annotations Requiring Further Scrutiny:
- ILC2 and LTI: Markers for ILC2 (KLRG1, CD7) and LTI (CD68) are less specific. KLRG1 is found on multiple ILCs and NK cells, while CD68 is a pan-myeloid marker, making the LTI annotation questionable based on this plot.
- T cell (Naive), T cell (Tfh), T cell (Th1), T cell (Th17), T cell (Th2), T cell (Treg): The markers identified for these T helper and regulatory subsets appear inconsistent with established immunological literature:
- T cell (Th1): Canonical Th1 cells express T-BET (TBX21) and STAT4. The plot shows strong expression of RORA (a Th17/ILC3 regulator) and GATA3 (a Th2 master regulator), which directly contradicts the expected Th1 phenotype.
- T cell (Th17): Canonical Th17 cells express RORC (RORγt) and STAT3. The plot shows GATA3 and STAT6 (both Th2-associated), again indicating a potential misidentification or misassignment of markers.
- T cell (Th2): Canonical Th2 cells express GATA3 and STAT6. These markers are shown as defining for Th1 and Th17 respectively, while Th2 cells show less specific markers like LGALS1 and CD5.
- T cell (Tfh): While STAT4 is shown as a marker, Tfh cells are primarily defined by CXCR5, BCL6, PDCD1 (PD-1), and ICOS. STAT4 is more associated with Th1.
- T cell (Naive): The markers CD40LG and STAT1 are not the most canonical for naive T cells (e.g., CD45RA, CCR7, LEF1, TCF7, SELL).
- T cell (Treg): TGFB1 is relevant to Treg function, but FOXP3 and CD25 (IL2RA) are the definitive markers for Tregs.
Annotation Notes
The celltype_subset annotations for major immune cell types and their well-established subsets (e.g., monocytes, NK cells, plasma cells, platelets, cytotoxic T cells) are strongly supported by the marker gene expression patterns displayed in this dot plot. The markers for these groups are largely canonical and show high specificity and expression within their respective populations.
However, the annotations for several T helper cell subsets (Th1, Th2, Th17, Tfh, Naive, Treg), as well as ILC2 and LTI, are less confidently supported by the marker genes presented. The identified markers for these specific subsets are either non-canonical, shared broadly across T cell populations, or, in the cases of Th1, Th17, and Th2, appear to contradict established biological roles of their master regulators and signaling pathways. This suggests that the marker discovery process (find_cfg) may not have identified the most appropriate or distinguishing markers for these groups, or that the initial clustering and annotation for these particular cell types may warrant further investigation and refinement. It is recommended to re-evaluate the T cell subset annotations using alternative marker sets or more specific annotation strategies, potentially incorporating flow cytometry data or knowledge-based marker lists to ensure accuracy.
4. Peripheral Blood Immune Cell Population Shifts in Idiopathic Pulmonary Fibrosis
[Analysis Visualization Results]...
Analysis Overview
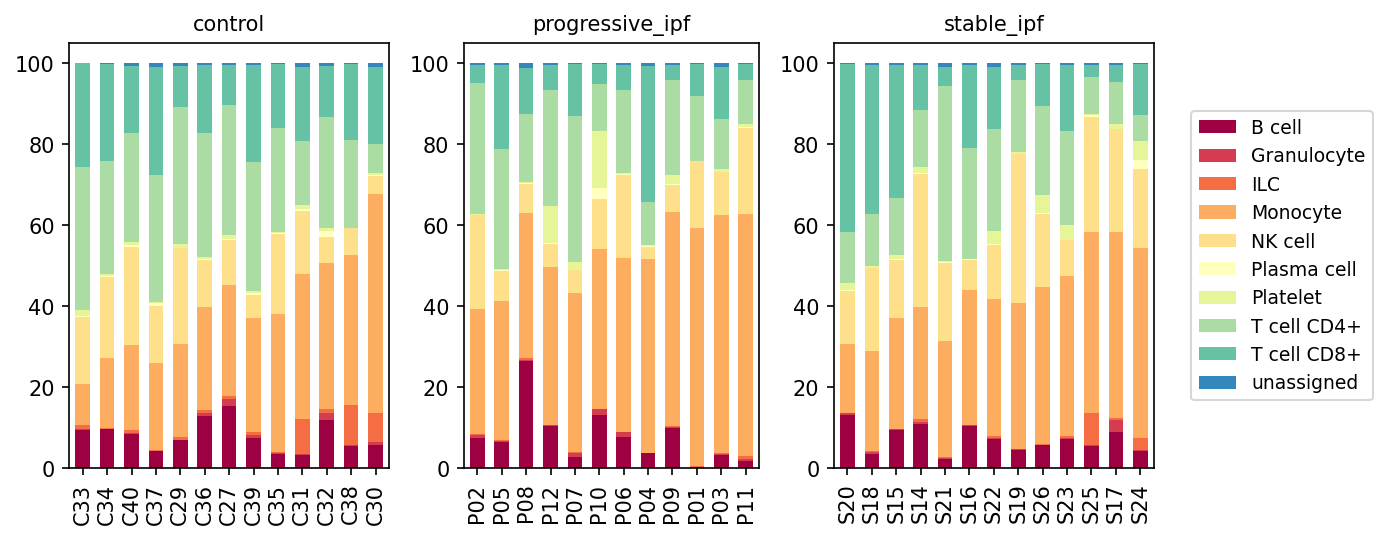
This analysis presents the relative proportions of minor cell types identified in single-cell RNA-seq data from human blood samples. The primary objective is to evaluate potential alterations in immune cell composition across three distinct conditions: 'control' (healthy individuals), 'progressive_ipf' (patients with progressive Idiopathic Pulmonary Fibrosis), and 'stable_ipf' (patients with stable Idiopathic Pulmonary Fibrosis). These comparisons aim to elucidate systemic immune changes associated with IPF pathogenesis and disease progression.
Visual Summary
The stacked bar plots illustrate the proportional distribution of ten minor cell types across individual samples within each condition.
- Monocyte Expansion in IPF: A prominent and consistent increase in the relative proportion of Monocytes (represented by orange segments) is observed in both the 'progressive_ipf' and 'stable_ipf' conditions when compared to the 'control' group. While control samples typically show Monocyte proportions ranging from approximately 20-30%, many IPF samples, particularly in the progressive group, exhibit Monocyte proportions exceeding 40-60%.
- Relative T Cell Reduction: Concurrently, there appears to be a decrease in the combined relative proportion of T cell CD4+ (light green) and T cell CD8+ (dark green) populations in both IPF conditions compared to controls. This reduction contributes to the observed shift in favor of Monocytes. The CD4+ T cell fraction seems particularly reduced in many IPF samples.
- B Cell Variability: The proportion of B cells (dark red) shows more inter-sample variability. Some IPF samples, especially within the 'progressive_ipf' cohort, show a modest increase in B cell proportions, though this is not a universal or as consistent a trend as the monocyte shift.
- Other Cell Types: NK cells (light yellow), Granulocytes (red), ILCs (orange-red), Plasma cells (very light yellow), and Platelets (lightest yellow) constitute smaller fractions of the total immune cells and do not display dramatic, consistent shifts in their proportions across the conditions. The 'unassigned' population (blue) is minimal in all samples.
- Inter-sample Heterogeneity: Notable variability in cell type proportions is present among individual samples, especially within the 'progressive_ipf' and 'stable_ipf' groups, reflecting the heterogeneous nature of IPF and individual immune responses.
Biological Interpretation
The observed shifts in peripheral blood immune cell populations suggest significant systemic immune alterations in IPF patients.
- Monocytosis as a Systemic Inflammatory Marker: The consistent increase in circulating Monocytes in both stable and progressive IPF patients is a key finding. Monocytes are critical innate immune cells that differentiate into macrophages, which are known to play a central role in the inflammatory and fibrotic processes within the lung in IPF. An elevated monocyte count in the blood could signify a heightened systemic inflammatory state, increased production of monocytes in the bone marrow, and/or increased recruitment of these cells to the inflamed and fibrotic lung tissue. These recruited monocytes can differentiate into pro-fibrotic macrophages that drive collagen deposition and tissue remodeling.
- T Cell Dysregulation and Redistribution: The relative decrease in peripheral blood T cell CD4+ and CD8+ populations suggests a potential systemic T cell dysregulation or redistribution. This could indicate:
- Sequestration in Lung: T cells, particularly pro-fibrotic subsets, may be actively recruited and retained within the fibrotic lung microenvironment, leading to their depletion in the peripheral circulation.
- Altered Homeostasis: The chronic inflammatory environment of IPF could alter T cell lymphopoiesis, survival, or induce T cell exhaustion, leading to reduced numbers in blood. Specific T cell subsets, such as Th2, Th17, and Treg cells, are known to contribute to IPF pathology in the lung.
- Potential B Cell Involvement: While variable, the trend of increased B cells in some IPF patients points to a possible contribution of humoral immunity. B cells can participate in IPF through autoantibody production, antigen presentation, and cytokine secretion, potentially contributing to autoimmune features or chronic inflammation observed in some IPF cases.
Clinical or Translational Implications
These systemic immune profiling results from peripheral blood have several potential clinical and translational implications for IPF:
- Biomarker for Disease Activity/Progression: The pronounced increase in circulating monocytes and the relative decrease in T cells could serve as non-invasive, accessible peripheral blood biomarkers for diagnosing, monitoring disease activity, or predicting progression in IPF. Further studies would be needed to establish their predictive value and correlation with clinical parameters.
- Therapeutic Target Identification: Understanding the persistent monocytosis and T cell dysregulation could inform the development of novel immunomodulatory therapies. Targeting the recruitment, activation, or differentiation of pro-fibrotic monocytes/macrophages, or modulating dysfunctional T cell responses, might represent promising therapeutic strategies to slow or halt IPF progression.
- Monitoring Treatment Response: Changes in these peripheral blood cell populations could potentially be used as indicators of response to existing or experimental therapies, allowing for more personalized treatment approaches and earlier assessment of drug efficacy.
5. Population Analysis of T cell Subsets in Idiopathic Pulmonary Fibrosis
[Analysis Visualization Results]...
Analysis Overview
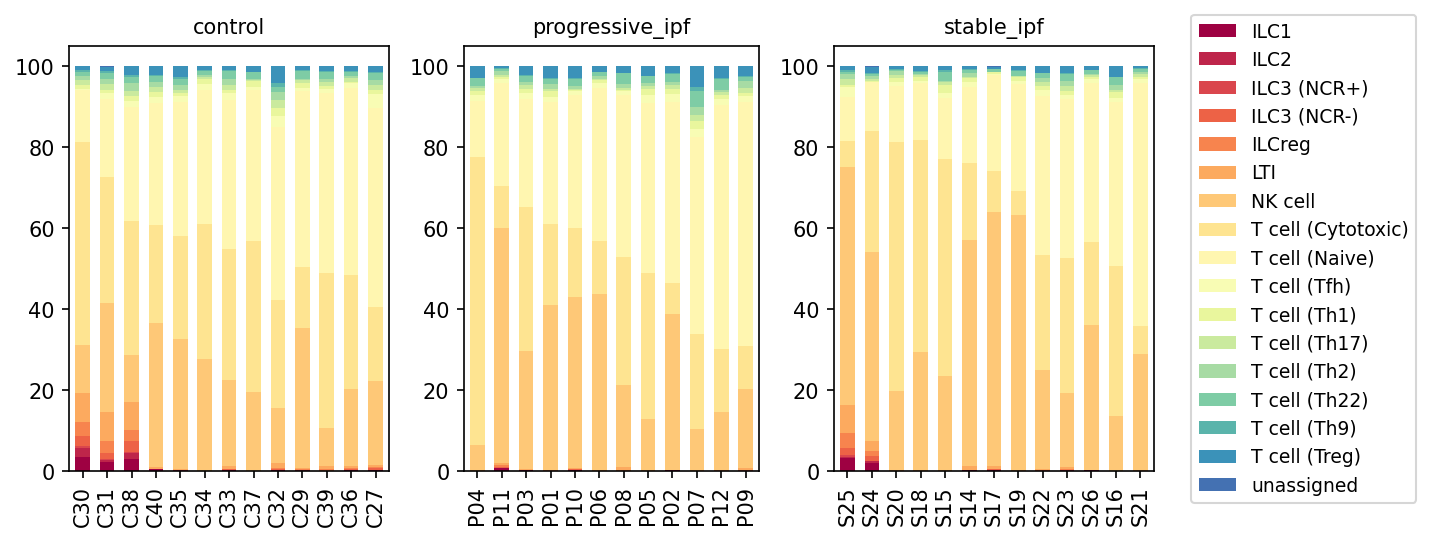
This analysis presents a population bar plot illustrating the proportional distribution of various T cell subsets, NK cells, and Innate Lymphoid Cells (ILCs) within the major 'T cell' compartment across different conditions: control, progressive idiopathic pulmonary fibrosis (IPF), and stable IPF. The visualization is stratified by individual samples within each condition, providing insights into immune cell composition changes associated with disease status. The data is derived from single-cell RNA-seq of human blood samples.
Visual Summary
The stacked bar plots display the relative proportions of T cell (Naive), T cell (Cytotoxic), T cell (Treg), NK cells, and various ILC subsets (ILC1, ILC2, ILC3 (NCR+), ILC3 (NCR-), ILCreg, LTI), along with other T helper subsets (Tfh, Th1, Th17, Th2, Th22, Th9), and an 'unassigned' category.
Key observations include:
- Control Condition: Samples from the control group generally exhibit a higher proportion of T cell (Naive) cells (lightest yellow) and a substantial presence of T cell (Cytotoxic) cells (medium yellow). NK cells (orange) are also present, while ILCs (red/burgundy tones at the bottom) and T cell (Treg) cells (dark blue at the top) constitute relatively smaller fractions. The composition appears somewhat consistent across control samples, though with individual variability.
- Progressive IPF Condition: In the progressive_ipf group, a distinct shift in cell proportions is observed compared to controls. There is a noticeable decrease in T cell (Naive) proportions across most samples, often accompanied by a proportional increase in T cell (Cytotoxic) cells and NK cells. Furthermore, the proportions of ILCs (red/burgundy hues) and T cell (Treg) cells (dark blue) appear to be slightly but consistently elevated in many progressive_ipf samples compared to controls.
- Stable IPF Condition: The stable_ipf condition exhibits a more heterogeneous pattern. Some samples within this group (e.g., S25, S24) show a compositional profile resembling that of progressive_ipf, with reduced T cell (Naive) and increased T cell (Cytotoxic) and NK cell fractions. Conversely, other stable_ipf samples (e.g., S14, S17, S19) maintain a composition closer to that of the control group, with higher proportions of T cell (Naive) cells. Generally, ILCs and T cell (Treg) cells also show varied but often increased proportions in the stable_ipf group relative to controls.
- Overall Trend: The data suggests a general shift from a naive T cell dominance towards an increased presence of cytotoxic T cells, NK cells, and possibly regulatory T cells and ILCs in IPF patients, particularly those with progressive disease.
Biological Interpretation
The observed shifts in the peripheral blood T cell and ILC populations in IPF patients, especially those with progressive disease, point towards significant systemic immune dysregulation.
- Naive to Effector/Cytotoxic Shift: The decrease in T cell (Naive) and concomitant increase in T cell (Cytotoxic) and NK cell populations in progressive IPF suggests a more activated and potentially effector-driven immune state. This could reflect persistent antigenic stimulation, chronic inflammation, or tissue damage. In the context of IPF, increased cytotoxic activity (from T cell (Cytotoxic) and NK cells) could contribute to alveolar epithelial cell injury, a key event in fibrosis initiation and progression, by releasing pro-fibrotic mediators and driving further inflammation.
- Role of Regulatory T cells (Tregs): The apparent increase in T cell (Treg) cells in IPF conditions might represent a compensatory mechanism to quell ongoing inflammation and limit tissue damage. However, the efficacy of these Tregs could be impaired in the fibrotic microenvironment, or their increased presence could reflect a chronic attempt to resolve inflammation that ultimately fails in progressive disease. The role of Tregs in fibrosis is complex, with both protective and pathogenic effects reported depending on the specific context and functional state https://pubmed.ncbi.nlm.nih.gov/33941459/.
- Innate Lymphoid Cells (ILCs) in IPF: The subtle but consistent increase in ILCs (ILC1, ILC2, ILC3) in IPF samples is noteworthy. ILCs are key regulators of immune responses and tissue homeostasis.
- ILC2s are known to produce type 2 cytokines (IL-4, IL-5, IL-13) that are often associated with allergic inflammation and can promote fibrosis https://pubmed.ncbi.nlm.nih.gov/35926521/. Their increase could contribute to the profibrotic milieu in IPF.
- ILC1s (IFN-γ producers) and ILC3s (IL-17, IL-22 producers) can also contribute to inflammation and tissue remodeling, although their specific roles in human IPF are still being elucidated. The observed increase suggests a broader activation of innate lymphoid immunity.
- Systemic vs. Local Changes: As these findings are from peripheral blood, they reflect systemic immune changes. While these changes are likely indicative of processes occurring in the primary affected organ (lung), further studies on lung tissue are needed to confirm local immune cell alterations and their direct contribution to lung pathology.
Clinical or Translational Implications
The distinct immune cell population shifts observed in the peripheral blood of IPF patients, particularly in progressive disease, hold several clinical and translational implications:
- Biomarker Potential: The relative proportions of T cell (Naive), T cell (Cytotoxic), NK cells, and specific ILC subsets could serve as potential blood-based biomarkers for IPF diagnosis, monitoring disease progression, or stratifying patients at risk of rapid decline.
- Therapeutic Targets: Understanding the specific T cell and ILC subsets that are expanded or altered in IPF may highlight novel immunomodulatory therapeutic targets. For example, strategies aimed at dampening excessive cytotoxic responses, modulating Treg function, or inhibiting profibrotic ILC subsets could be explored.
- Disease Heterogeneity: The variability observed within the stable_ipf group underscores the heterogeneity of the disease. This suggests that a precision medicine approach, where patients are stratified based on their specific immune profiles, might be beneficial for optimizing treatment strategies and predicting response.
6. Analysis of Lymphoid Cell Population Proportions in IPF Conditions
[Analysis Visualization Results]...
Analysis Overview
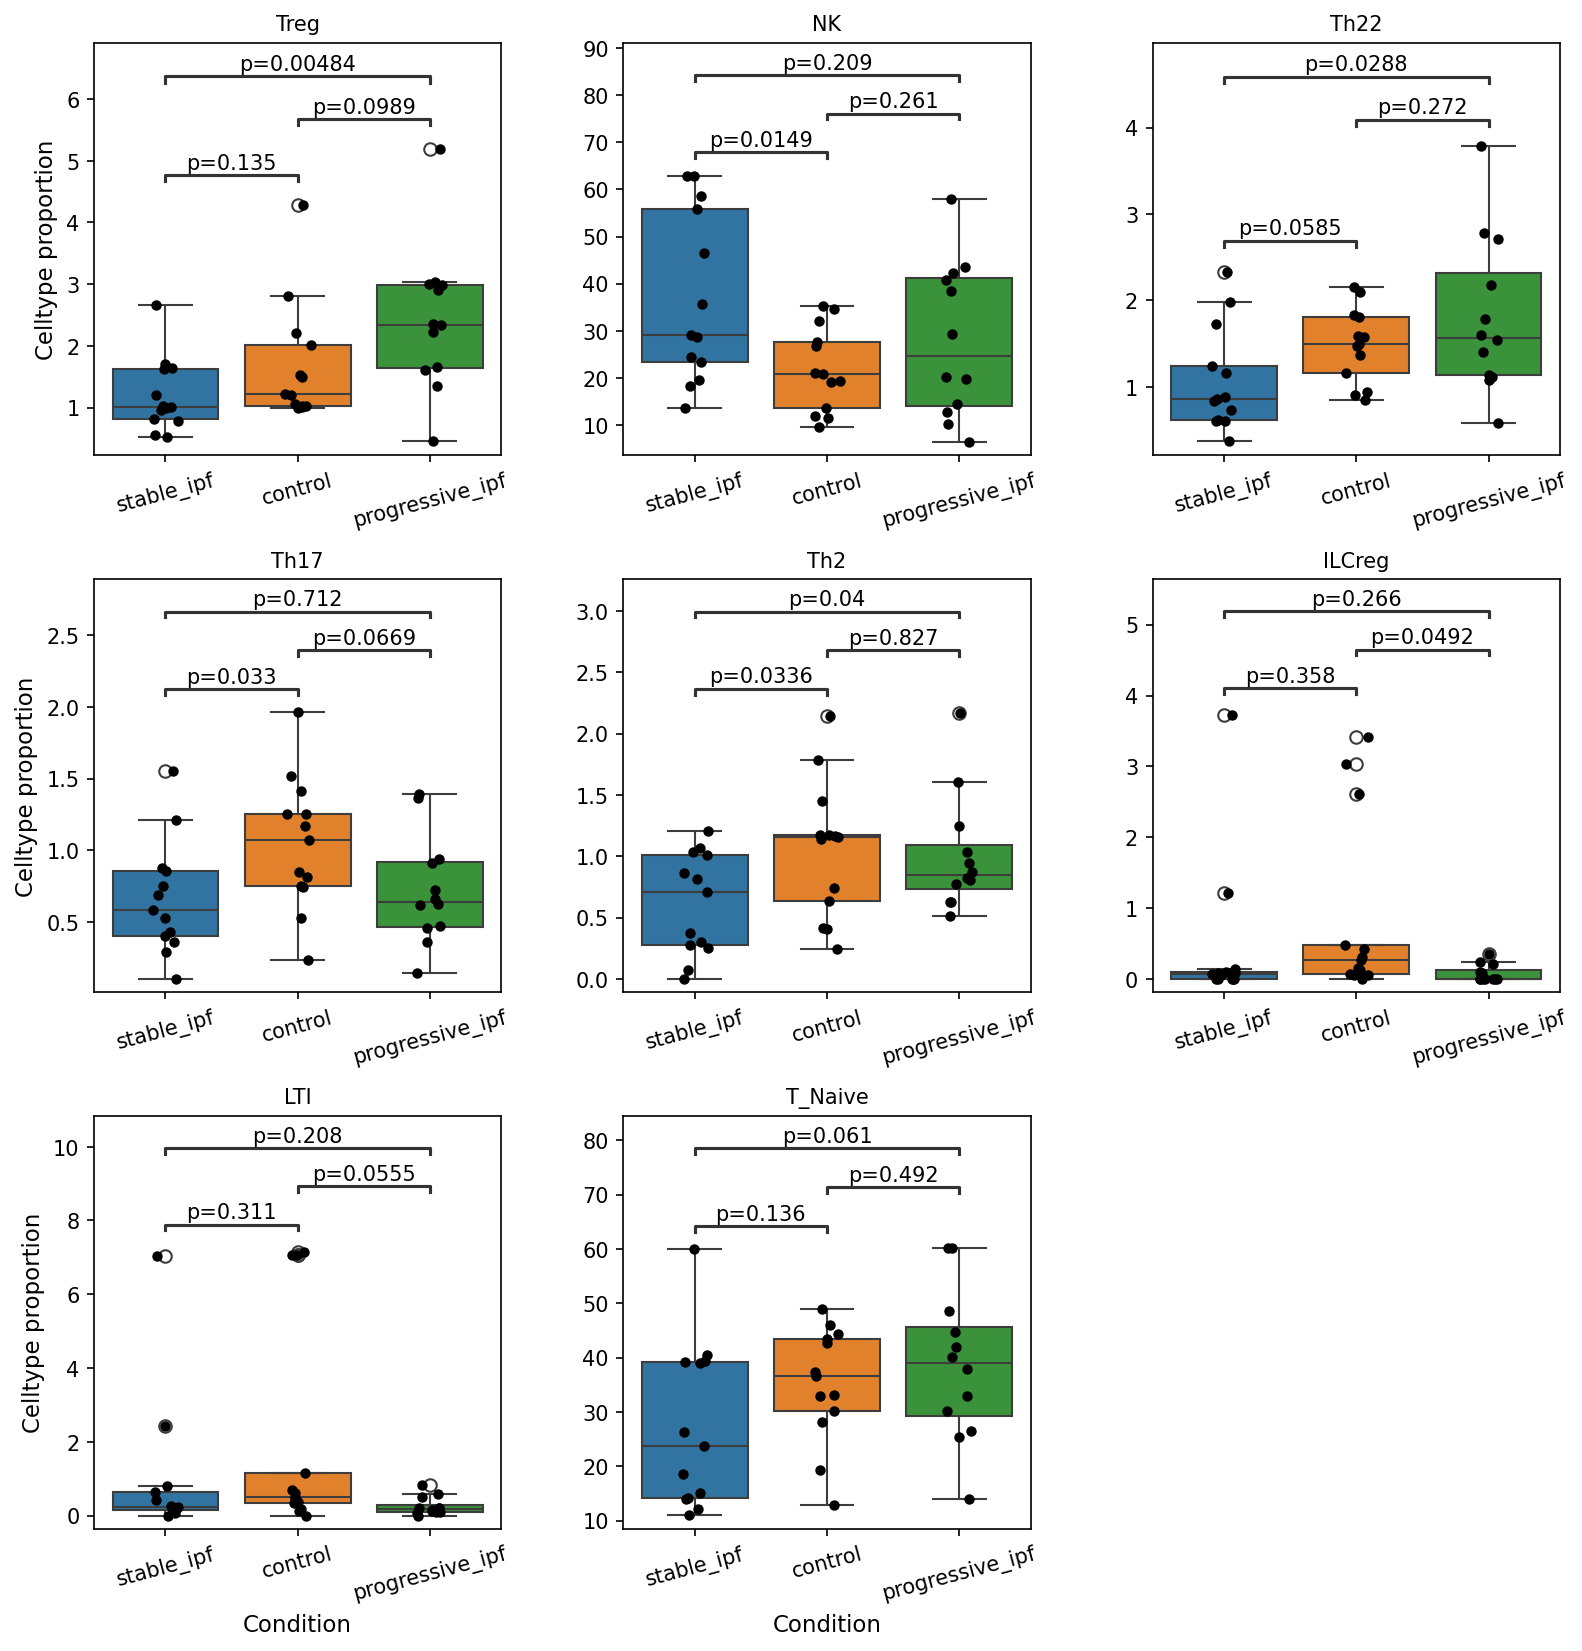
This analysis presents box plots visualizing the proportions of various lymphoid cell populations, including T cell subsets, Natural Killer (NK) cells, and Innate Lymphoid Cells (ILCs), across three conditions: stable Idiopathic Pulmonary Fibrosis (stable_ipf), healthy controls (control), and progressive Idiopathic Pulmonary Fibrosis (progressive_ipf). The goal was to identify statistically significant differences in these cell proportions between conditions in peripheral blood samples. The statistical significance cutoff for p-values was set at 0.1.
Visual Summary
The box plots reveal several statistically significant differences in the proportions of specific lymphoid populations when comparing stable_ipf, control, and progressive_ipf conditions:
Treg (Regulatory T cells)
- The proportion of Treg cells is significantly higher in progressive_ipf compared to stable_ipf (p = 0.00484).
- A trend of increased Treg proportion is also observed in progressive_ipf compared to control (p = 0.0989).
NK (Natural Killer cells)
- NK cell proportions are significantly higher in stable_ipf compared to control (p = 0.0149).
Th22 (T helper 22 cells)
- Th22 cell proportions are significantly higher in progressive_ipf compared to stable_ipf (p = 0.0288).
- A significantly higher proportion is also observed in control compared to stable_ipf (p = 0.0585).
Th17 (T helper 17 cells)
- Th17 cell proportions are significantly lower in stable_ipf compared to control (p = 0.033).
Th2 (T helper 2 cells)
- Th2 cell proportions are significantly lower in stable_ipf compared to control (p = 0.0336).
- Th2 cell proportions are also significantly lower in progressive_ipf compared to control (p = 0.04).
ILCreg (Regulatory Innate Lymphoid Cells)
- ILCreg proportions are significantly lower in progressive_ipf compared to control (p = 0.0492).
LTI (Lymphoid Tissue Inducer cells)
- LTI proportions show a trend towards being lower in progressive_ipf compared to control (p = 0.0555).
T_Naive (Naive T cells)
- T_Naive cell proportions are significantly lower in stable_ipf compared to control (p = 0.061).
Biological Interpretation
These findings highlight notable shifts in peripheral blood lymphoid cell composition in Idiopathic Pulmonary Fibrosis (IPF) patients, particularly differentiating between stable and progressive disease states, and healthy controls. The observed changes suggest dysregulation of both adaptive and innate immune responses, which can significantly influence disease pathogenesis.
- Increased Immunosuppression/Dysregulation in Progressive IPF: The most striking finding is the significant increase in Treg cells in progressive IPF compared to stable IPF and controls. Regulatory T cells are crucial for maintaining immune tolerance and suppressing excessive immune responses. While their increase might be a compensatory mechanism to dampen inflammation, dysregulated or phenotypically altered Tregs can also directly promote fibrosis or fail to resolve pathogenic inflammation in fibrotic diseases like IPF [1, 2].
- Altered Inflammatory and Repair Responses:
- Th22 cells are also elevated in progressive IPF compared to stable IPF. Th22 cells produce IL-22, which plays roles in tissue repair, epithelial cell proliferation, and inflammation. Their increase might reflect chronic tissue damage and dysregulated repair mechanisms or contribute to inflammation in progressive IPF [3].
- Conversely, Th17 and Th2 cells are significantly lower in stable IPF compared to controls, and Th2 cells remain lower in progressive IPF compared to controls. Th17 cells are pro-inflammatory, while Th2 cells are typically associated with allergic responses and fibrosis via cytokines like IL-4 and IL-13 [4]. The decrease in these T helper subsets in peripheral blood might indicate their recruitment to the affected lung tissue, altered differentiation, or a systemic immune deviation not captured by their peripheral blood counts.
- Innate Immune System Dysregulation:
- NK cell proportions are higher in stable IPF compared to controls. NK cells are important for immune surveillance and host defense. Their elevation might represent an early or ongoing innate immune response in stable disease [5].
- ILCreg and LTI cells show decreased proportions in progressive IPF compared to controls. ILCreg cells are regulatory innate lymphoid cells that can help maintain immune homeostasis, while LTI cells are crucial for the development and maintenance of lymphoid tissues. A reduction in these regulatory/organizational innate immune cells could suggest a diminished capacity to control inflammation or organize immune responses in progressive disease.
- T Cell Exhaustion/Differentiation: The lower proportion of T_Naive cells in stable IPF compared to controls might indicate increased T cell activation, differentiation, or exhaustion, potentially driven by chronic antigen exposure or inflammatory signals in the disease environment.
Clinical or Translational Implications
The observed changes in lymphoid cell proportions in peripheral blood provide valuable insights into the immune landscape of IPF and hold potential for clinical applications:
- Biomarkers for Disease Progression: The differential proportions of Treg and Th22 cells, in particular, could serve as peripheral blood biomarkers to distinguish between stable and progressive forms of IPF. Monitoring these cell types might aid in disease stratification and prognostication.
- Therapeutic Targets: Understanding the pathogenic roles of these immune cell subsets opens avenues for targeted therapeutic interventions. For example, strategies aimed at modulating Treg function, balancing Th22 activity, or restoring regulatory innate lymphoid cell populations could be explored to slow disease progression or ameliorate symptoms in IPF [6].
- Understanding Pathogenesis: These findings contribute to a deeper understanding of the complex immune dysregulation in IPF, suggesting a systemic component to the disease beyond local lung pathology. Further investigations into the functional states of these cells in the blood versus the lung are warranted.
References:
- Treg cells in fibrosis: PubMed search for "Treg cells fibrosis IPF"
- Treg role in IPF: GeneCards: FOXP3 (FOXP3 is a key marker for Tregs)
- Th22 cells and IL-22 in lung disease: PubMed search for "Th22 cells IL-22 lung fibrosis"
- Th2 cells and fibrosis: PubMed search for "Th2 cells fibrosis IPF"
- NK cells in IPF: PubMed search for "NK cells IPF"
- Immunomodulation in IPF: PubMed search for "immunomodulation IPF therapy"
7. Cell-Cell Interaction Pattern Analysis in Idiopathic Pulmonary Fibrosis (IPF)
[Analysis Visualization Results]...
Analysis Overview
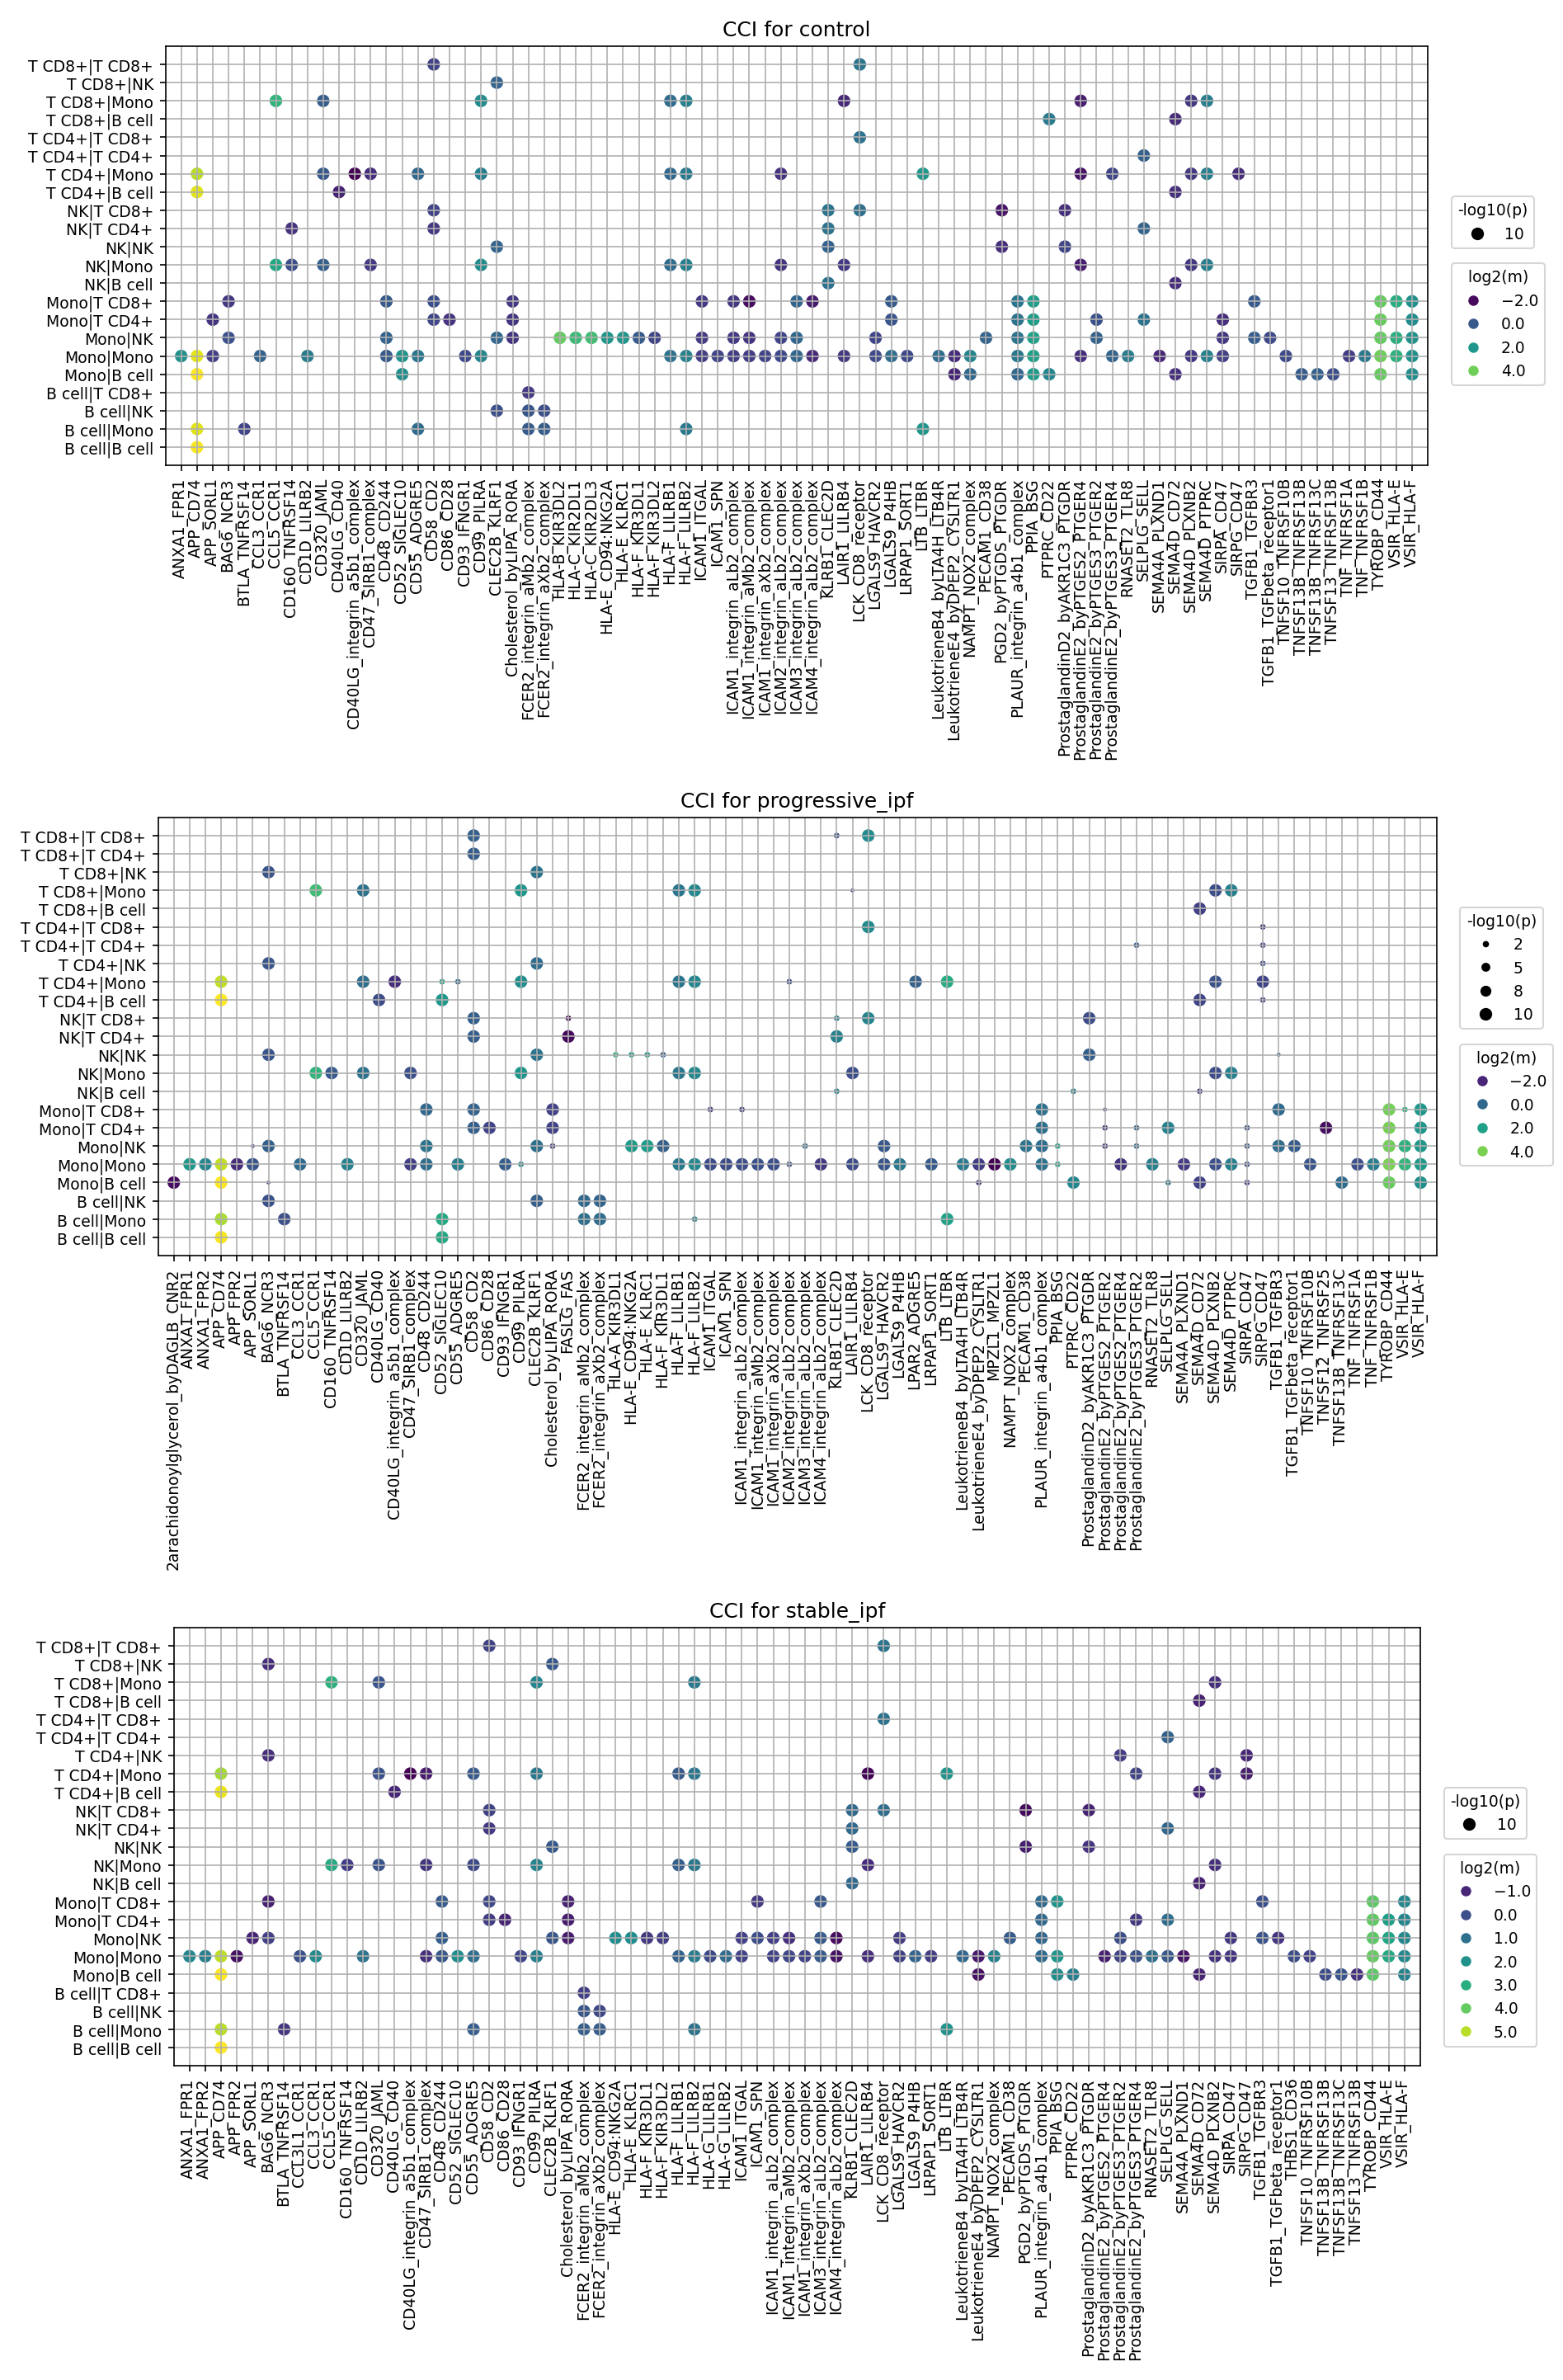
This analysis investigates cell-cell interaction (CCI) patterns in peripheral blood mononuclear cells across different conditions related to Idiopathic Pulmonary Fibrosis (IPF): control, progressive_ipf, and stable_ipf. Using CellPhoneDB, ligand-receptor interactions between various immune cell types (T cells, Monocytes, NK cells, B cells) have been computed and visualized. The results highlight the top 80 most significant cell-cell interactions for each condition, providing insights into potential immune dysregulation and communication changes in IPF patients compared to healthy controls, and differentiating between progressive and stable disease states.
Visual Summary
The dot plots display cell-cell interactions, where the y-axis represents interacting cell pairs and the x-axis represents specific ligand-receptor gene pairs. The size of each dot correlates with the statistical significance of the interaction (-log10(p-value)), and the color intensity indicates the mean expression level of the interacting ligand-receptor pair (log2(mean)).
- Overall Activity: There is a noticeable increase in the number and intensity of significant cell-cell interactions from control to stable_ipf, and further to progressive_ipf. This suggests a heightened state of immune cell communication and activation in IPF, particularly in the progressive form of the disease.
- Dominant Cell Types: Monocytes and T cells (CD4+ and CD8+) are frequently involved in the most significant interactions across all conditions, with Monocyte-Monocyte and Monocyte-T cell interactions being particularly prominent in IPF conditions.
- Key Interaction Pathways in IPF:
- Adhesion and Migration: Interactions involving ICAM1 with integrin_aM_b2_complex and integrin_aX_b2_complex are consistently observed, suggesting sustained or altered cell adhesion capabilities.
- Pro-fibrotic Signaling: The SPP1-integrin_aV_b1_complex interaction (where SPP1 is Osteopontin) emerges as highly significant and strongly expressed in progressive_ipf for various cell pairs, notably Monocyte-Monocyte, Monocyte-T cell CD8+, and Monocyte-T cell CD4+. This interaction is less prominent in control.
- Chemokine Signaling: The CXCL12-CXCR4 axis appears more active and significant in both stable_ipf and progressive_ipf, especially for Monocyte-Monocyte and Monocyte-T cell interactions, compared to control.
- Inflammatory Mediators: Interactions involving ProstaglandinD2_byPTGDS_PTGDR2 show increased significance and expression in IPF conditions, predominantly for Monocyte-Monocyte and Monocyte-T cell pairs.
- Immune Checkpoint/Regulation: The VSIR_HLA-A interaction (V-set immunoregulatory receptor) shows strong significance in progressive_ipf involving Monocyte-T cell interactions, which is less evident in control.
- HLA-related interactions: Interactions involving HLA-A/B/C_complex-LILRB1 and HLA-DR_HLA-DR also show increased activity in IPF conditions, particularly in progressive_ipf, suggesting altered antigen presentation or immune recognition.
- Condition-Specific Differences:
- Progressive_IPF generally exhibits a higher number of significant interactions, larger dot sizes, and brighter colors (indicating higher mean expression and significance) for many interactions compared to stable_IPF and control. This suggests a more active and dysregulated intercellular communication network during disease progression.
- Stable_IPF shows an intermediate pattern, with some interactions similar to progressive_IPF but often with less intensity, while still distinct from control.
Biological Interpretation
The observed shifts in cell-cell interaction patterns in the blood of IPF patients, particularly the heightened activity in progressive_ipf, provide critical insights into the systemic immune environment associated with the disease.
- Monocyte-centric Activation: The strong involvement of Monocytes in numerous significant interactions underscores their central role in IPF pathogenesis. Monocytes, precursors to macrophages, are key drivers of inflammation and fibrosis. Increased Monocyte-Monocyte and Monocyte-T cell interactions in IPF blood suggest enhanced activation, recruitment, and cross-talk among these critical immune populations.
- Pro-fibrotic Pathways: The robust upregulation of the SPP1-integrin_aV_b1_complex interaction is highly relevant. SPP1 (Osteopontin) is a well-established pro-fibrotic cytokine that promotes fibroblast activation, immune cell recruitment, and extracellular matrix deposition in various fibrotic diseases, including IPF. Its elevated interaction with integrin αVβ1 suggests a potent pro-fibrotic signaling axis active in the circulation, potentially contributing to ongoing lung damage or reflecting systemic fibrotic burden. GeneCards: SPP1
- Immune Cell Trafficking and Inflammation: The CXCL12-CXCR4 axis plays a crucial role in immune cell migration, survival, and tissue homing. Its increased activity in IPF patients suggests enhanced recruitment of monocytes and T cells, potentially to the sites of inflammation and fibrosis in the lung, or contributing to systemic inflammation. PubMed search: CXCL12 CXCR4 IPF
- Immunomodulation and Dysregulation: The prominence of VSIR_HLA-A and other HLA-related interactions points to altered immune regulation. VSIR (V-set immunoregulatory receptor) is an immune checkpoint molecule, and its interactions with HLA molecules can modulate T cell responses. Such changes could lead to inadequate immune resolution or aberrant immune activation contributing to chronic inflammation in IPF. PubMed search: VSIR immune regulation
- Lipid Mediators in Inflammation: The strong ProstaglandinD2_byPTGDS_PTGDR2 interactions indicate an active role for lipid mediators in the immune dysregulation observed in IPF. Prostaglandin D2 has diverse effects on immune cells, and its altered signaling could contribute to the inflammatory milieu. PubMed search: ProstaglandinD2 IPF immune
These systemic blood-based CCI patterns likely reflect the broader immune dysregulation occurring in IPF, with specific interactions potentially driving disease progression or acting as indicators of disease activity.
Clinical or Translational Implications
The findings from this cell-cell interaction analysis offer several important clinical and translational implications:
- Biomarker Discovery: Specific ligand-receptor pairs, such as SPP1-integrin_aV_b1_complex, CXCL12-CXCR4, and VSIR_HLA-A, that are significantly upregulated in progressive_ipf compared to control and stable_ipf, could serve as novel blood-based biomarkers for disease progression or severity. Monitoring these interactions could aid in patient stratification and prognosis.
- Therapeutic Target Identification: The identified highly active interactions, particularly those linked to pro-fibrotic or pro-inflammatory pathways (e.g., SPP1-integrin, CXCL12-CXCR4), represent promising targets for therapeutic intervention. Strategies aimed at blocking these interactions (e.g., small molecule inhibitors or neutralizing antibodies) could potentially ameliorate disease progression in IPF. For example, blocking SPP1 or its integrin receptors could directly target fibrosis-driving mechanisms.
- Monitoring Treatment Response: Changes in the intensity or presence of these specific cell-cell interactions could be utilized to monitor the efficacy of existing or novel therapies, providing an early indication of treatment response in the systemic circulation.
- Understanding Pathogenesis: Elucidating the precise roles of these altered CCI networks in the context of IPF pathogenesis provides a deeper understanding of the disease mechanisms, even in a systemic compartment like blood, which can inform future drug development and clinical trial design.
8. Condition-Specific Cell-Cell Interaction Patterns in Idiopathic Pulmonary Fibrosis
[Analysis Visualization Results]...
Analysis Overview
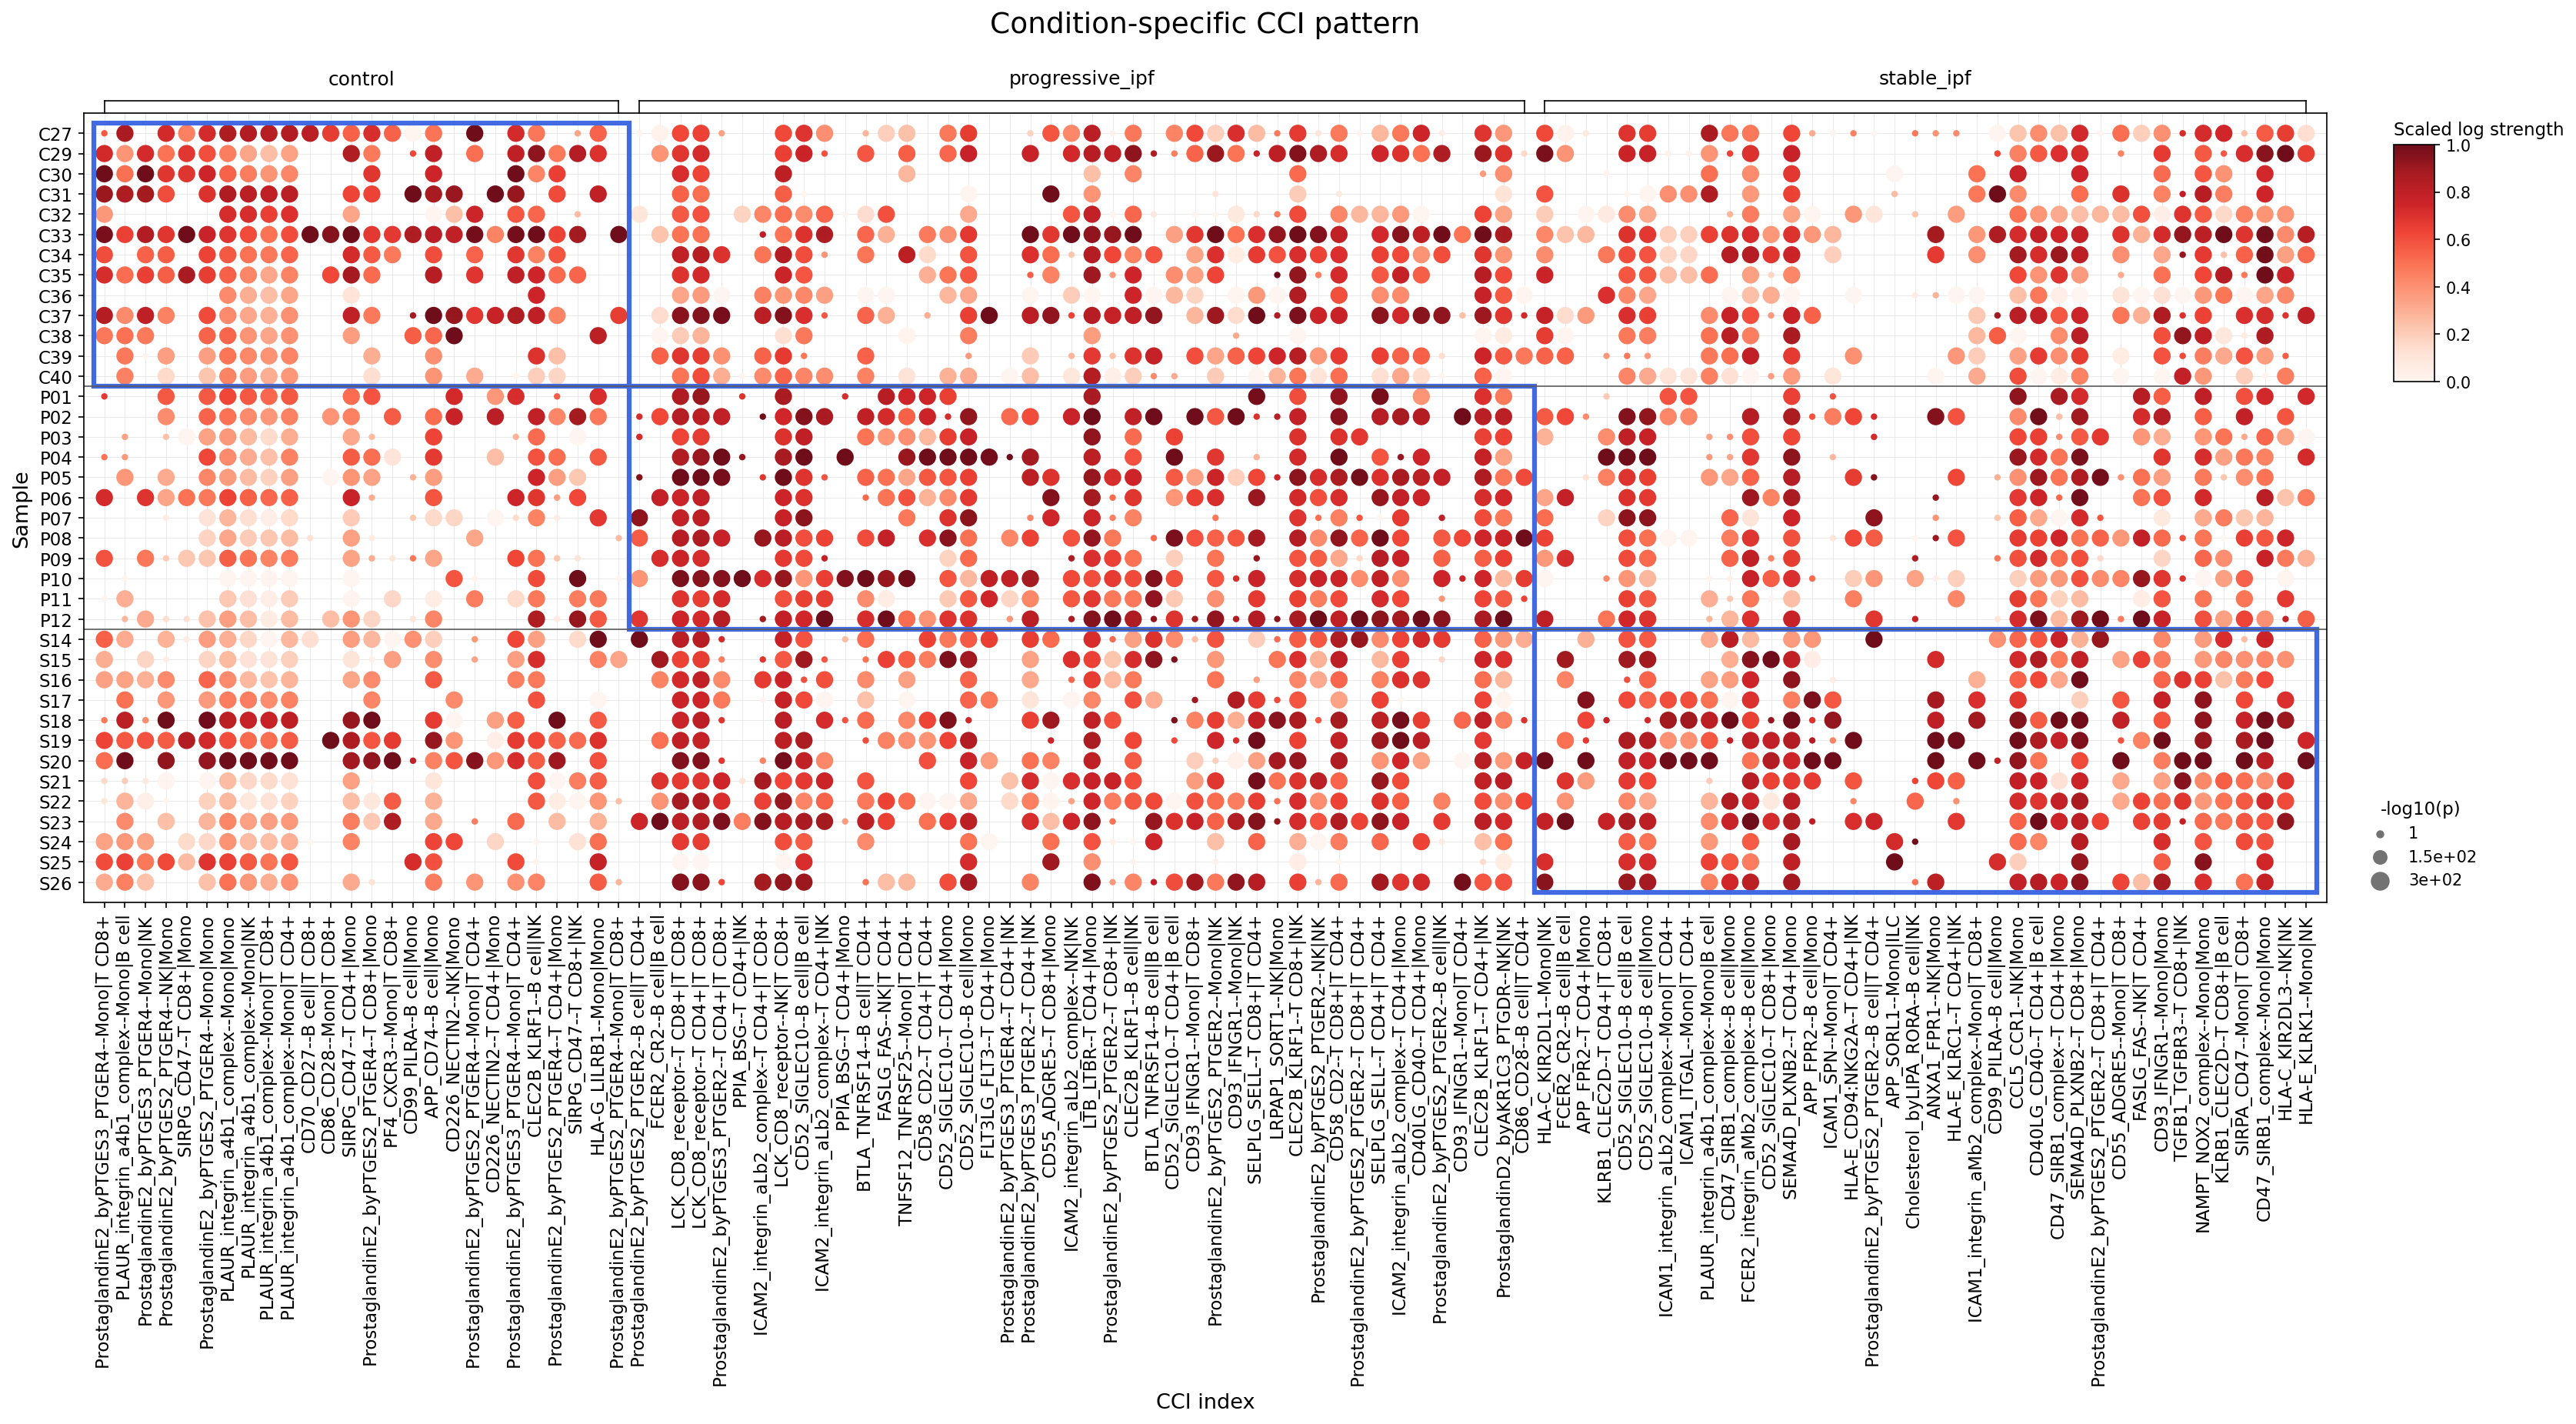
This analysis investigates cell-cell interactions (CCIs) among major immune cells (T cells, Myeloid cells, and B cells) in peripheral blood, comparing individuals with progressive Idiopathic Pulmonary Fibrosis (IPF), stable IPF, and healthy controls. The plot_dot_for_cci_with_signif_difference tool was used to identify and visualize the top 60 most significant CCIs within each condition, based on interaction strength and statistical significance (p-value). The dot plot displays these interactions per sample, with dot color indicating scaled log interaction strength and dot size representing the -log10(p-value) of the interaction.
Visual Summary
The dot plot reveals distinct and shared patterns of cell-cell interactions across the 'control', 'progressive_ipf', and 'stable_ipf' conditions.
- Overall Interaction Landscape: All three conditions display a rich repertoire of significant cell-cell interactions, primarily involving various T cell subsets, Monocytes (a Myeloid cell type), B cells, and NK cells. The widespread presence of large, dark red dots across many interactions indicates robust and highly significant communication among these immune cells in the blood.
Condition-Specific Prominence:
- Control (C27-C40): Shows a baseline of strong and diverse immune cell interactions, including significant Prostaglandin E2 (PGE2)-receptor interactions, integrin-mediated adhesion, and co-stimulatory pathways.
- Progressive IPF (P01-P12): This group appears to maintain or even intensify several interactions observed in controls. Notably, interactions involving PGE2 signaling (e.g., ProstaglandinE2_byPTGES3_PTGER4-Monocyte|T cell), adhesion molecules (e.g., PLAUR_integrin_a4b1_complex-Monocyte|T cell), the "don't eat me" signal (SIRPG_CD47-Monocyte|T cell), and T cell co-stimulation (CD86_CD28-Monocyte|T cell) consistently show high strength and significance across many progressive IPF samples. This suggests an active and potentially dysregulated immune communication landscape.
- Stable IPF (S14-S26): Presents a more heterogeneous pattern. While some interactions remain strong (e.g., certain integrin-mediated interactions), others that were prominent in progressive IPF or controls (e.g., some PGE2-receptor interactions, CD86_CD28-Monocyte|T cell) appear less consistently strong or significant across samples. Conversely, the FCER2_CR2-B cell|T cell interaction, while present in controls, shows strong signals in several stable IPF samples, potentially indicating altered B cell-T cell dynamics in this disease stage.
- Sample Variability: Within each condition, there is some variability in interaction strength and significance among individual samples, which is expected given the biological heterogeneity of human cohorts.
Biological Interpretation
The observed condition-specific patterns of cell-cell interactions in the blood provide insights into systemic immune alterations in IPF.
- Elevated Prostaglandin E2 (PGE2) Signaling in Progressive IPF:
- Mechanism: Prostaglandin E2 (PGE2), synthesized by enzymes like PTGES3, binds to G protein-coupled receptors (PTGERs, such as PTGER4 and PTGER2) on immune cells. PGE2 is a potent lipid mediator with complex immunomodulatory roles, often acting as an immunosuppressant by inhibiting T cell proliferation and cytokine production, promoting regulatory T cell development, and modulating macrophage function. In the context of fibrosis, PGE2 can have both anti-fibrotic and pro-fibrotic effects depending on the specific receptor activated and cellular context.
- Findings: Interactions like ProstaglandinE2_byPTGES3_PTGER4-Monocyte|T cell and ProstaglandinE2_byPTGES2_PTGER2-T cell|T cell are highly significant and strong in both control and, notably, in progressive_ipf samples. This sustained or potentially amplified PGE2 signaling in progressive IPF blood could indicate ongoing attempts at immune regulation or, paradoxically, contribute to immune evasion and persistent inflammation or fibrosis. A relative reduction in some PGE2 interactions in stable_ipf might reflect a different phase of immune activity or a less severe inflammatory state.
- Relevance to IPF: Dysregulated PGE2 signaling is implicated in IPF pathogenesis, contributing to fibroblast activation and impaired host defense. Modulating this pathway could impact disease progression.
- Persistent Integrin-Mediated Adhesion in IPF:
- Mechanism: Integrins are crucial cell surface receptors mediating cell-cell and cell-extracellular matrix interactions, essential for immune cell trafficking, adhesion, and activation. PLAUR (uPAR) can interact with integrins (e.g., α4β1), influencing cell migration and proteolytic activity. ICAM-1 (CD54) interacts with αLβ2 integrin (LFA-1) on leukocytes, facilitating their adhesion to endothelial cells and subsequent extravasation. These interactions are critical for recruiting immune cells to sites of inflammation and tissue damage.
- Findings: Interactions such as PLAUR_integrin_a4b1_complex-Monocyte|T cell and ICAM1_integrin_aLb2_complex-Monocyte|T cell are consistently strong and significant across all conditions, including progressive_ipf and stable_ipf. This suggests active adhesion and trafficking processes involving monocytes and T cells persist in the blood of IPF patients, indicating ongoing systemic immune cell mobilization, potentially towards the inflamed lung tissue.
- Relevance to IPF: Enhanced immune cell infiltration into the lung is a hallmark of IPF. The observed blood interactions reflect the systemic readiness for such trafficking.
- Altered Co-stimulatory and Inhibitory Signaling:
- Mechanism: Co-stimulatory molecules like CD86 (on antigen-presenting cells like monocytes) binding to CD28 (on T cells) provide the critical second signal for full T cell activation. Conversely, inhibitory receptors such as BTLA binding to TNFRSF14 (HVEM) suppress T cell responses, maintaining immune tolerance. FASLG (Fas Ligand) binding to FAS (CD95) mediates programmed cell death (apoptosis), crucial for terminating immune responses and clearing activated or damaged cells.
- Findings: The CD86_CD28-Monocyte|T cell interaction is prominent in control and progressive_ipf samples, suggesting active T cell co-stimulation in these states. Its reduced or less consistent presence in stable_ipf might indicate a dampening of T cell activation or a shift in the immune microenvironment. BTLA_TNFRSF14-B cell|T cell and FASLG_FAS-T cell|T cell interactions also show signals, albeit with more variability.
- Relevance to IPF: Dysregulation of T cell activation and apoptosis contributes to chronic inflammation and impaired tissue repair in fibrotic diseases. Sustained CD86-CD28 signaling in progressive IPF could drive pathogenic T cell responses.
- Prominent "Don't Eat Me" Signaling via SIRPG_CD47 in Progressive IPF:
- Mechanism: CD47, ubiquitously expressed on healthy cells, interacts with SIRPα (SIRPG) on phagocytes (e.g., monocytes, macrophages), delivering a "don't eat me" signal that inhibits phagocytosis. This interaction is crucial for preventing autoimmune attack and immune evasion by cancer cells.
- Findings: The SIRPG_CD47-Monocyte|T cell interaction is strong and highly significant across all conditions, but particularly pronounced and pervasive in progressive_ipf samples. This suggests an active "don't eat me" signaling axis in the blood of progressive IPF patients.
- Relevance to IPF: Increased CD47-SIRPα signaling could impair the clearance of apoptotic cells, cellular debris, or even senescent fibroblasts, which are known to accumulate in fibrotic lungs and drive inflammation and fibrosis. This could contribute to the progressive nature of the disease.
- Differential B cell-T cell Interactions (FCER2_CR2) in IPF:
- Mechanism: FCER2 (CD23) on B cells can interact with CR2 (CD21) on other B cells or follicular dendritic cells, playing roles in B cell activation, antigen presentation, and immune complex handling. CD23 is also a low-affinity IgE receptor.
- Findings: The FCER2_CR2-B cell|T cell interaction appears strong in control and stable_ipf samples but less consistently so in progressive_ipf. This suggests a potential alteration in B cell-T cell dynamics or a shift in humoral immune responses during the progressive phase of IPF, distinct from the stable disease state.
- Relevance to IPF: B cell involvement and autoantibody production are increasingly recognized in IPF. Changes in B cell-T cell communication could reflect different facets of humoral immunity throughout disease progression.
Clinical or Translational Implications
The identification of specific cell-cell interactions that differ across IPF conditions, even in peripheral blood, provides potential avenues for therapeutic intervention and biomarker discovery.
- Targeting PGE2 Signaling: The prominent PGE2-PTGER interactions in progressive IPF suggest that modulating this pathway could be beneficial. Specific PTGER receptor antagonists, particularly for PTGER4 which can be pro-fibrotic, might reduce inflammation and fibrosis.
- Therapeutic Agents: Potential agents could include specific EP receptor antagonists (e.g., PTGER4 antagonists). [PubMed Search: "Prostaglandin E2 receptor antagonist fibrosis"]
- Modulating Integrin-Mediated Trafficking: The sustained integrin-mediated adhesion in IPF suggests that targeting these interactions could limit immune cell recruitment to the lungs.
- Therapeutic Agents: Integrin antagonists (e.g., anti-VLA-4 antibodies like Natalizumab or anti-LFA-1 antibodies) are used in other inflammatory diseases to prevent leukocyte trafficking and could be explored in IPF to reduce pathogenic cell infiltration. [PubMed Search: "Integrin inhibitors fibrosis"]
- Rebalancing T Cell Co-stimulation: The strong CD86-CD28 interaction in progressive IPF indicates ongoing T cell activation.
- Therapeutic Agents: Inhibiting this pathway, for instance with agents like Abatacept (which blocks CD80/86-CD28 interaction), could dampen harmful T cell responses in IPF. [PubMed Search: "Abatacept idiopathic pulmonary fibrosis"]
- Interfering with CD47-SIRPα "Don't Eat Me" Signaling: The heightened SIRPG_CD47 interaction in progressive IPF points to a potential mechanism of immune evasion or impaired clearance.
- Therapeutic Agents: CD47-blocking antibodies, currently under investigation in oncology to promote phagocytosis of cancer cells, might be repurposed to enhance the clearance of senescent or profibrotic cells in IPF, or to modulate macrophage function. [PubMed Search: "CD47 SIRPalpha inhibitor fibrosis"] [GeneCards: CD47: GeneCards]
- Biomarker Potential: The differential patterns of these CCIs in the blood could serve as circulating biomarkers to distinguish between stable and progressive IPF, or to monitor treatment response, given that peripheral blood is easily accessible. Further research is needed to validate these interactions as prognostic or predictive biomarkers.
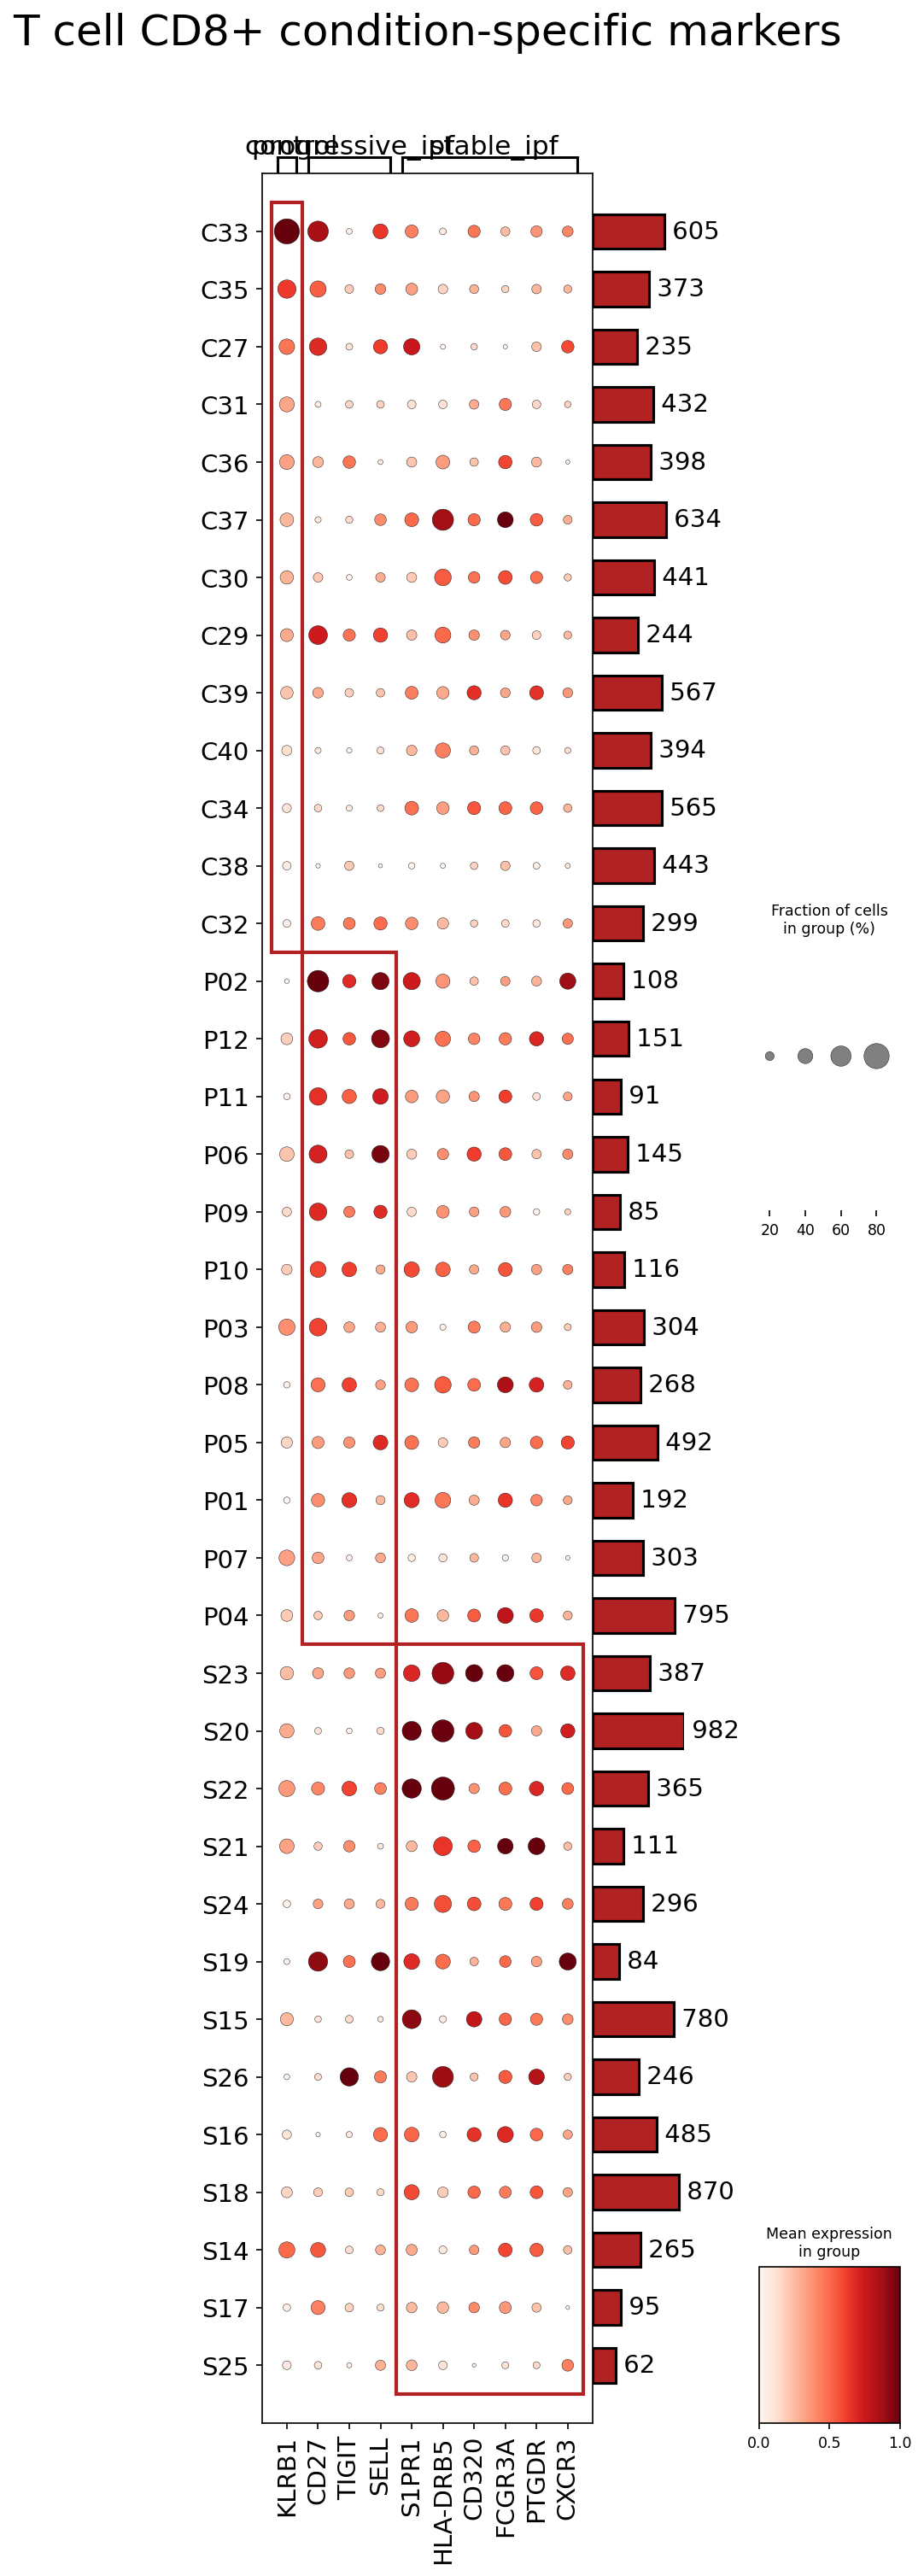
9. T cell CD8+ Condition-Specific Surfaceome Marker Expression in Idiopathic Pulmonary Fibrosis
[Analysis Visualization Results]...
Analysis Overview
This analysis identifies and visualizes condition-specific surfaceome markers for CD8+ T cells from single-cell RNA sequencing data of human blood. The study investigates three conditions: control, progressive Idiopathic Pulmonary Fibrosis (IPF), and stable IPF. The goal is to highlight differential surface marker expression patterns that could provide insights into disease mechanisms and potential therapeutic targets, specifically focusing on the T cell CD8+ population. The dot plot displays the fraction of cells expressing a marker (dot size) and the mean expression level within those cells (dot color intensity) for selected surface markers across individual samples grouped by condition.
Visual Summary
The dot plot visualizes the expression of ten key surface markers across various individual samples, categorized into three conditions: control (C samples), progressive IPF (P samples), and stable IPF (S samples).
- Control (C) Samples: This group, highlighted by the first red rectangle, shows a notable and consistent upregulation of KLRB1 (CD161). While some other markers like CD27, TIGIT, and SELL show scattered expression, KLRB1 stands out as highly expressed and prevalent across many control samples, particularly C33 and C27. The average cell count per sample in the control group is high, as indicated by the bar plot on the right.
- Progressive IPF (P) Samples: The second red rectangle highlights CD27 and TIGIT. These two markers are consistently highly expressed and prevalent across most progressive IPF samples, indicating a distinct immune profile in this disease stage. S1PR1 also shows elevated expression in several progressive IPF samples, although with more variability in prevalence. The cell counts for T cell CD8+ in this group are generally lower compared to control and stable IPF, especially in samples like P02, P12, P11, P06, P09, P10.
- Stable IPF (S) Samples: The third red rectangle draws attention to a cluster of markers including HLA-DRB5, CD320, FCGR3A, PTGDR, and CXCR3. These markers demonstrate strong expression and high prevalence across the majority of stable IPF samples. SELL shows some expression but generally appears less prominent or consistent than the other highlighted markers in this group, and potentially reduced in comparison to some control samples. The cell counts in stable IPF samples are robust, similar to control samples.
Overall, the plot clearly delineates distinct surfaceome profiles for CD8+ T cells across the three conditions, suggesting condition-specific immunological states.
Biological Interpretation
The observed surface marker expression patterns in CD8+ T cells offer crucial insights into their functional states and roles in IPF pathogenesis.
KLRB1 (CD161) in Control Samples:
- Signaling Pathways/Biological Mechanisms: KLRB1 (CD161) is a C-type lectin-like receptor typically expressed on NK cells, NKT cells, and a subset of T cells, including CD8+ T cells. It can function as an inhibitory or activating receptor depending on the context and ligand binding. Its expression is often associated with a cytotoxic or innate-like T cell phenotype. In healthy individuals, KLRB1+ CD8+ T cells are often found in tissues and can exhibit rapid effector functions, suggesting a role in immune surveillance.
- Context in Blood: The high expression of KLRB1 in CD8+ T cells from control blood suggests a healthy, balanced state of immune surveillance and potentially reflects a population capable of prompt response to pathogens, without excessive inflammatory activation.
- GeneCards: KLRB1
CD27 and TIGIT in Progressive IPF Samples:
Signaling Pathways/Biological Mechanisms:
- CD27: A co-stimulatory receptor belonging to the TNFR superfamily, critical for T cell activation, survival, and memory formation. Its presence typically signifies activated or memory T cells.
- TIGIT: An inhibitory immune checkpoint receptor expressed on activated T cells, NK cells, and Tregs. TIGIT binding to its ligands (PVR, PVRL2, PVRL3) suppresses T cell proliferation and cytokine production, leading to T cell exhaustion or dysfunction.
- Context in Blood: The co-expression of CD27 and TIGIT in CD8+ T cells in progressive IPF is particularly intriguing. While CD27 suggests T cell activation or a memory phenotype, TIGIT's high expression points towards an exhausted or dysregulated state of these activated T cells. In chronic inflammatory diseases like IPF, persistent antigen exposure and inflammation can lead to T cell exhaustion, where T cells lose effector function despite continuous stimulation. This state is often characterized by the co-expression of multiple inhibitory receptors, including TIGIT.
- GeneCards: CD27
- GeneCards: TIGIT
S1PR1 in Progressive IPF Samples:
- Signaling Pathways/Biological Mechanisms: S1PR1 (Sphingosine-1-phosphate receptor 1) is a G protein-coupled receptor crucial for lymphocyte egress from lymphoid organs into the circulation. Its downregulation on tissue-resident T cells helps retain them in inflamed tissues, while its upregulation facilitates their movement out of tissues.
- Context in Blood: Elevated S1PR1 on circulating CD8+ T cells in progressive IPF might suggest altered lymphocyte trafficking or an attempt by these cells to egress from a primary site of inflammation (likely the lung, though the samples are blood) or lymph nodes. This could also reflect a specific circulating subpopulation.
- GeneCards: S1PR1
HLA-DRB5, CD320, FCGR3A, PTGDR, and CXCR3 in Stable IPF Samples:
Signaling Pathways/Biological Mechanisms:
- HLA-DRB5: A major histocompatibility complex (MHC) class II molecule. While primarily expressed on professional antigen-presenting cells (APCs), its expression on T cells, particularly CD8+ T cells, can be indicative of strong activation or atypical antigen presentation capabilities, or a state of chronic immune activation.
- CD320 (Transcobalamin Receptor): Involved in vitamin B12 uptake. While its immune function is less directly characterized, metabolic reprogramming is a hallmark of activated immune cells. Its upregulation might point to altered metabolic demands in these T cells.
- FCGR3A (CD16A): An Fc receptor primarily found on NK cells, macrophages, and some cytotoxic T cells. It mediates antibody-dependent cell-mediated cytotoxicity (ADCC) and can activate cellular responses upon binding to IgG-coated cells. Its expression on CD8+ T cells suggests a more direct cytotoxic effector function or an NK-like phenotype.
- PTGDR (DP1): The prostaglandin D2 receptor 1. Prostaglandin D2 (PGD2) is a lipid mediator involved in allergic inflammation and immune modulation. PTGDR activation can lead to various effects, including immunosuppression or amplification of inflammatory responses depending on the cell type and context.
- CXCR3: A chemokine receptor that binds to chemokines like CXCL9, CXCL10, and CXCL11. It plays a critical role in the recruitment of Th1 cells, cytotoxic T lymphocytes (CTLs), and NK cells to sites of inflammation and infection.
- Context in Blood: The collective upregulation of these markers in stable IPF suggests a highly activated, perhaps tissue-homing, and metabolically altered CD8+ T cell population. The presence of HLA-DRB5 indicates a strong activation state and potential for antigen presentation or interaction with APCs. FCGR3A suggests enhanced cytotoxic potential. CXCR3 expression strongly indicates that these CD8+ T cells are primed to traffic to inflammatory sites where its ligands are present, which is consistent with the inflammatory nature of IPF. PTGDR's role suggests modulation by lipid mediators, possibly reflecting attempts at immune regulation or a specific inflammatory signature.
- GeneCards: HLA-DRB5
- GeneCards: FCGR3A
- GeneCards: CXCR3
Clinical or Translational Implications
The distinct CD8+ T cell surface marker profiles across control, progressive, and stable IPF conditions offer potential avenues for diagnostic, prognostic, and therapeutic development in IPF.
Biomarkers for Disease Progression:
- The high expression of CD27 and TIGIT in progressive IPF samples suggests that these markers, particularly TIGIT, could serve as biomarkers for identifying patients with a more aggressive disease phenotype. Monitoring TIGIT expression on circulating CD8+ T cells could potentially aid in distinguishing progressive from stable disease.
- The unique signature of HLA-DRB5, CD320, FCGR3A, PTGDR, and CXCR3 in stable IPF might indicate a different, perhaps more contained or chronic, inflammatory response. These markers could potentially distinguish stable IPF or highlight specific immune mechanisms associated with disease stabilization.
Therapeutic Targets:
- TIGIT in Progressive IPF: Given its role as an inhibitory immune checkpoint, TIGIT represents a promising therapeutic target. TIGIT blockade, similar to PD-1 blockade in cancer, aims to reinvigorate exhausted T cells and enhance anti-fibrotic or immune-regulatory responses. Clinical trials investigating TIGIT antibodies are ongoing in various contexts, and exploring their potential in progressive IPF to modulate pathogenic T cell responses could be warranted.
- *Therapeutic Agents:* Anti-TIGIT antibodies (e.g., Tiragolumab, Vibostolimab) are under investigation. PubMed search: TIGIT IPF therapy
- CXCR3 in Stable IPF: The elevated expression of CXCR3 suggests that CD8+ T cells in stable IPF are highly migratory towards inflammatory cues. Blocking the CXCR3-CXCL10 axis could potentially limit the recruitment of pathogenic T cells to fibrotic foci in the lung, thereby mitigating inflammation and fibrosis. This might be more relevant in preventing exacerbations or progression from a stable state.
- *Therapeutic Agents:* CXCR3 antagonists have been explored in other inflammatory diseases. PubMed search: CXCR3 antagonist fibrosis
- FCGR3A in Stable IPF: FCGR3A on CD8+ T cells suggests a potential role for these cells in ADCC-mediated tissue damage or clearance. If these cells are targeting lung cells, modulating FCGR3A activity could be explored, though this is less conventional for T cells.
Further studies are needed to confirm the functional implications of these surface markers in IPF pathogenesis and to validate their utility as biomarkers or therapeutic targets within the specific context of lung tissue, given that this analysis is based on blood samples.
10. Monocyte Condition-Specific Surfaceome Marker Expression Analysis in Idiopathic Pulmonary Fibrosis

[Analysis Visualization Results]...
Analysis Overview
This analysis identifies condition-specific surfaceome markers in Monocytes across 'control' and 'stable_ipf' conditions using single-cell RNA sequencing data from blood tissue. The goal is to highlight surface markers that differentiate monocyte subsets in stable IPF from healthy controls, providing insights into potential underlying biological mechanisms and therapeutic targets. The plot_markers_and_expression_dot tool was used to visualize marker expression, focusing on highly expressed surfaceome genes in at most 40 markers per condition, utilizing nz_pct_score and fc_cutoff for marker selection.
Visual Summary
The dot plot displays the expression of five surfaceome markers (CD83, PTGER4, HLA-DQA2, C3AR1, AQP9) across various monocyte clusters, comparing 'control' and 'stable_ipf' conditions.
Differential Expression Patterns:
- CD83 and PTGER4: These markers show markedly higher mean expression (darker red color) and a greater fraction of expressing cells (larger dot size) in numerous monocyte clusters (e.g., C33, C31, C27, etc.) specifically under the 'control' condition. In contrast, their expression is significantly reduced or absent in the corresponding monocyte clusters when derived from the 'stable_ipf' condition. This pattern is highlighted by the upper red box.
- HLA-DQA2, C3AR1, and AQP9: Conversely, these markers exhibit increased mean expression and cell fraction in many monocyte clusters (e.g., S20, S26, S25, etc.) predominantly within the 'stable_ipf' condition. Their expression is generally low or negligible in the 'control' condition within these clusters. This pattern is highlighted by the lower red box.
- Cluster-Specific Differences: The analysis reveals that these differential expression patterns are not uniform across all monocytes but are specific to distinct monocyte clusters, suggesting functional heterogeneity within the monocyte population that is altered in IPF.
- Cell Counts: The bar plot on the right indicates the number of cells per monocyte cluster, showing substantial cell numbers for each cluster, supporting the robustness of the expression data.
Biological Interpretation
The observed differential expression of surfaceome markers on monocytes in the blood provides critical insights into immune dysregulation in Idiopathic Pulmonary Fibrosis (IPF).
- Reduced CD83 and PTGER4 in Stable IPF Monocytes (Control-associated clusters):
- CD83: CD83 is a glycoprotein primarily expressed on activated antigen-presenting cells (APCs), including monocytes/macrophages, and plays roles in immune regulation, T cell activation, and dendritic cell maturation. Its downregulation on monocyte clusters in stable IPF might indicate an altered state of monocyte activation, potentially affecting their capacity for immune modulation or antigen presentation. A decrease in CD83 could imply a shift away from a regulatory or immune-stimulatory phenotype that is more prevalent in healthy individuals.
- PTGER4 (Prostaglandin E Receptor 4 / EP4): PTGER4 is a receptor for Prostaglandin E2 (PGE2), a lipid mediator with diverse roles in inflammation and immunity. PGE2-EP4 signaling is complex, often associated with anti-inflammatory and immunosuppressive effects, but can also contribute to pro-fibrotic processes depending on the context. Reduced PTGER4 expression in IPF monocytes could lead to diminished responsiveness to PGE2, potentially impairing anti-inflammatory or resolution pathways normally mediated by PGE2 in healthy monocytes. Given that PGE2 deficiency is implicated in IPF pathogenesis, altered EP4 expression on monocytes could exacerbate disease progression by failing to sense or respond to existing PGE2 [1].
- Upregulated HLA-DQA2, C3AR1, and AQP9 in Stable IPF Monocytes (IPF-associated clusters):
- HLA-DQA2 (Major Histocompatibility Complex, Class II, DQ Alpha 2): As part of the MHC Class II complex, HLA-DQA2 is crucial for presenting exogenous antigens to CD4+ T cells, initiating adaptive immune responses. Its upregulation in IPF-associated monocyte clusters suggests enhanced antigen-presenting capacity or a more activated, immunogenic monocyte phenotype. This could contribute to sustained T cell activation and chronic inflammation, key features of IPF pathology, by presenting autoantigens or persistent foreign antigens [2].
- C3AR1 (Complement C3a Receptor 1): C3AR1 is a receptor for the complement anaphylatoxin C3a, a potent mediator of inflammation. Activation of C3AR1 on monocytes leads to cell activation, cytokine release, and recruitment to inflammatory sites. Elevated C3AR1 expression indicates an increased responsiveness of monocytes to C3a, suggesting heightened pro-inflammatory potential. The complement system is known to be activated in IPF, and this finding suggests a direct link to monocyte-driven inflammation and fibrotic responses [3].
- AQP9 (Aquaporin 9): AQP9 is an aquaglyceroporin that facilitates the transport of water and small solutes. In immune cells, AQP9 is implicated in cell migration, phagocytosis, and metabolic reprogramming. Its increased expression in IPF monocytes might reflect altered metabolic states, enhanced migratory capacity to fibrotic lesions, or participation in inflammatory processes by modulating cell volume and function. While less directly linked to IPF pathogenesis than other markers, AQP9 could indicate a stress response or a metabolic adaptation of monocytes in the disease state.
Clinical or Translational Implications
The identified surfaceome markers in monocytes offer potential avenues for understanding IPF pathogenesis and developing targeted therapies.
- Diagnostic/Prognostic Biomarkers: The differential expression of CD83, PTGER4, HLA-DQA2, C3AR1, and AQP9 on circulating monocytes could serve as blood-based biomarkers to distinguish stable IPF from healthy controls, and potentially monitor disease activity or response to therapy. Further studies would be needed to assess their specificity and sensitivity.
Therapeutic Targets
- HLA-DQA2: Upregulation of HLA-DQA2 suggests increased antigen presentation by monocytes in IPF. Strategies to modulate MHC class II presentation or downstream T cell activation could be considered, although broad immune suppression would require careful consideration of side effects.
- C3AR1: Given the pro-inflammatory role of C3a-C3AR1 signaling and the upregulation of C3AR1 on IPF monocytes, C3AR1 antagonists could be explored as a therapeutic strategy to dampen monocyte-driven inflammation and fibrosis in IPF. Inhibiting this axis could reduce the recruitment and activation of pathogenic monocytes/macrophages.
- PTGER4: The reduced expression of PTGER4 on monocytes in IPF suggests a potential failure of PGE2-mediated anti-inflammatory pathways. Investigating EP4 agonists might be a strategy to restore beneficial PGE2 signaling and re-establish immune homeostasis in IPF monocytes.
- CD83 and AQP9: While their direct therapeutic targeting in IPF monocytes is less established, understanding the functional consequences of their altered expression could reveal novel mechanisms. For instance, restoring CD83 expression could potentially enhance regulatory immune functions. AQP9's role in monocyte migration or metabolism might be targeted to alter their trafficking or activation state in the fibrotic lung.
Further research focusing on the functional consequences of these marker changes in IPF monocytes, particularly within the lung microenvironment, is warranted to validate their roles as diagnostic tools or therapeutic targets.
---
References:
- PTGER4 (EP4) and IPF: Search PubMed for "EP4 IPF therapy" to explore research on EP4 as a therapeutic target in pulmonary fibrosis. PubMed Search: EP4 IPF therapy
- HLA-DQA2 in Immune Responses: Learn more about MHC Class II molecules and their role in antigen presentation from resources like GeneCards. GeneCards: HLA-DQA2
- C3AR1 and Complement in Disease: For information on C3AR1 and its involvement in inflammatory processes, consult GeneCards or UniProt. GeneCards: C3AR1
11. Surfaceome Marker Expression in CD4+ T Cells from Progressive Idiopathic Pulmonary Fibrosis

[Analysis Visualization Results]...
Analysis Overview
This analysis identifies and visualizes surfaceome marker expression specifically within CD4+ T cells from individuals with progressive Idiopathic Pulmonary Fibrosis (IPF). The objective is to highlight key surface proteins that are robustly expressed in this cell type under the specified disease condition, providing insights into their potential biological roles and therapeutic relevance. The visualization is a dot plot, where dot size indicates the fraction of cells expressing a marker, and dot color represents the mean expression level within the group.
Visual Summary
The dot plot displays the expression profiles of identified surfaceome markers for CD4+ T cells in the progressive_ipf condition. While the plot lists numerous markers, the discernible gene symbols at the bottom of the provided visualization are PTGER2 and SIT1.
For both PTGER2 and SIT1, the visualization shows:
- High Mean Expression: Indicated by the dark red color of the dots, suggesting that these markers are expressed at relatively high levels in the expressing CD4+ T cells.
- High Fraction of Expressing Cells: Indicated by the large size of the dots, signifying that a substantial proportion of CD4+ T cells within the progressive_ipf group express these markers.
These observations indicate that PTGER2 and SIT1 are prominent and widely expressed surfaceome proteins on CD4+ T cells in the context of progressive IPF.
Biological Interpretation
The robust expression of PTGER2 and SIT1 on CD4+ T cells in progressive IPF patients suggests their significant involvement in the immune landscape of this disease.
PTGER2 (Prostaglandin E Receptor 2)
- Gene Function and Mechanism: PTGER2 encodes the E-type prostaglandin (PGE) receptor 2, also known as EP2. This is a G-protein coupled receptor (GPCR) that binds to prostaglandin E2 (PGE2). Upon binding, EP2 typically couples to Gs proteins, leading to an increase in intracellular cyclic AMP (cAMP) levels. cAMP is a crucial second messenger that modulates numerous cellular processes, including immune cell activation, differentiation, and cytokine production.
- Immune Modulation in T Cells: In CD4+ T cells, PGE2 acting via EP2 is known to modulate immune responses. It can suppress T cell proliferation, inhibit the production of pro-inflammatory cytokines (e.g., IFN-γ, IL-2), and influence T cell differentiation, often promoting regulatory T cell (Treg) function or Th2 responses, while dampening Th1 responses. This generally results in an immunosuppressive or immunomodulatory effect GeneCards: PTGER2.
- Relevance to Fibrosis: PGE2 itself often exhibits anti-fibrotic properties in various tissues by inhibiting fibroblast proliferation and collagen synthesis. However, the precise role of its individual receptors on different cell types, especially immune cells, in fibrotic diseases like IPF is complex and context-dependent. The prominent expression of PTGER2 on CD4+ T cells in the blood of progressive IPF patients suggests these T cells are actively sensing and responding to systemic PGE2, potentially influencing the immune environment that either drives or attempts to resolve fibrosis.
SIT1 (SHP2 Interacting Transmembrane Adaptor Protein 1)
- Gene Function and Mechanism: SIT1 is a transmembrane adaptor protein primarily expressed in T lymphocytes. It contains an immunoreceptor tyrosine-based inhibitory motif (ITIM), which, upon phosphorylation, allows SIT1 to recruit and interact with Src homology 2 (SH2) domain-containing phosphatases, such as SHP1.
- TCR Signaling Regulation: SIT1 acts as a negative regulator of T cell receptor (TCR) signaling. By recruiting phosphatases like SHP1, SIT1 promotes the dephosphorylation of key signaling molecules downstream of the TCR, thereby inhibiting T cell activation, proliferation, and cytokine production. This mechanism is critical for maintaining T cell homeostasis, setting the activation threshold, and preventing excessive or autoimmune responses GeneCards: SIT1.
- Relevance to Fibrosis: Dysregulation of T cell activation and function is a hallmark of many chronic inflammatory and fibrotic diseases, including IPF. The robust expression of SIT1 on CD4+ T cells in progressive IPF suggests that these cells might be subject to strong inhibitory signals, potentially leading to a state of anergy, exhaustion, or a skewed immune response that fails to effectively counteract the fibrotic process or contributes to immune dysregulation.
Clinical or Translational Implications
The identification of PTGER2 and SIT1 as highly expressed surfaceome markers on CD4+ T cells in progressive IPF patients offers potential avenues for therapeutic intervention, though further functional validation is required.
PTGER2 as a Therapeutic Target
- Targeting Strategy: Given that PGE2 and its receptors play complex roles in inflammation and fibrosis, modulating PTGER2 activity on CD4+ T cells could influence the course of IPF.
- If enhanced PTGER2 signaling in these T cells contributes to immune suppression or a dysfunctional phenotype that allows fibrosis to progress, EP2 antagonists might be considered to re-activate a more protective immune response.
- Conversely, if the anti-inflammatory and anti-fibrotic properties often associated with PGE2-EP2 signaling are beneficial, and these T cells are part of a failing protective mechanism, EP2 agonists could be explored to bolster these pathways. For instance, specific EP2 agonists are under investigation for their immunomodulatory potential in other chronic inflammatory conditions PubMed Search: EP2 agonist immunomodulation.
- Related Therapeutic Agents: Development of selective EP2 agonists or antagonists would be necessary to specifically target this pathway. Non-steroidal anti-inflammatory drugs (NSAIDs) broadly inhibit PGE2 production but are not selective for specific PGE receptor subtypes and generally not considered suitable for chronic IPF treatment.
SIT1 as a Therapeutic Target
- Targeting Strategy: As a negative regulator of T cell activation, SIT1's robust expression in progressive IPF CD4+ T cells suggests these cells may be in an inhibited or exhausted state.
- If excessive SIT1 activity dampens beneficial T cell responses (e.g., anti-fibrotic immunity or appropriate immune surveillance) in IPF, inhibiting SIT1 might "re-awaken" these cells, restoring their ability to combat disease progression. This could involve strategies to downregulate SIT1 expression or block its interactions with phosphatases. Such an approach would need careful consideration to avoid inducing autoimmunity due to unchecked T cell activation.
- Related Therapeutic Agents: Direct pharmacological targeting of adaptor proteins like SIT1 is challenging. However, immunomodulatory drugs that broadly influence T cell activation pathways could indirectly affect SIT1-mediated regulation. Future research might focus on small molecule inhibitors or biologicals that specifically interfere with SIT1 function or its downstream signaling partners to enhance T cell responsiveness in the context of IPF.
12. Gene Ontology (GSA) Analysis of Monocytes across Idiopathic Pulmonary Fibrosis Conditions
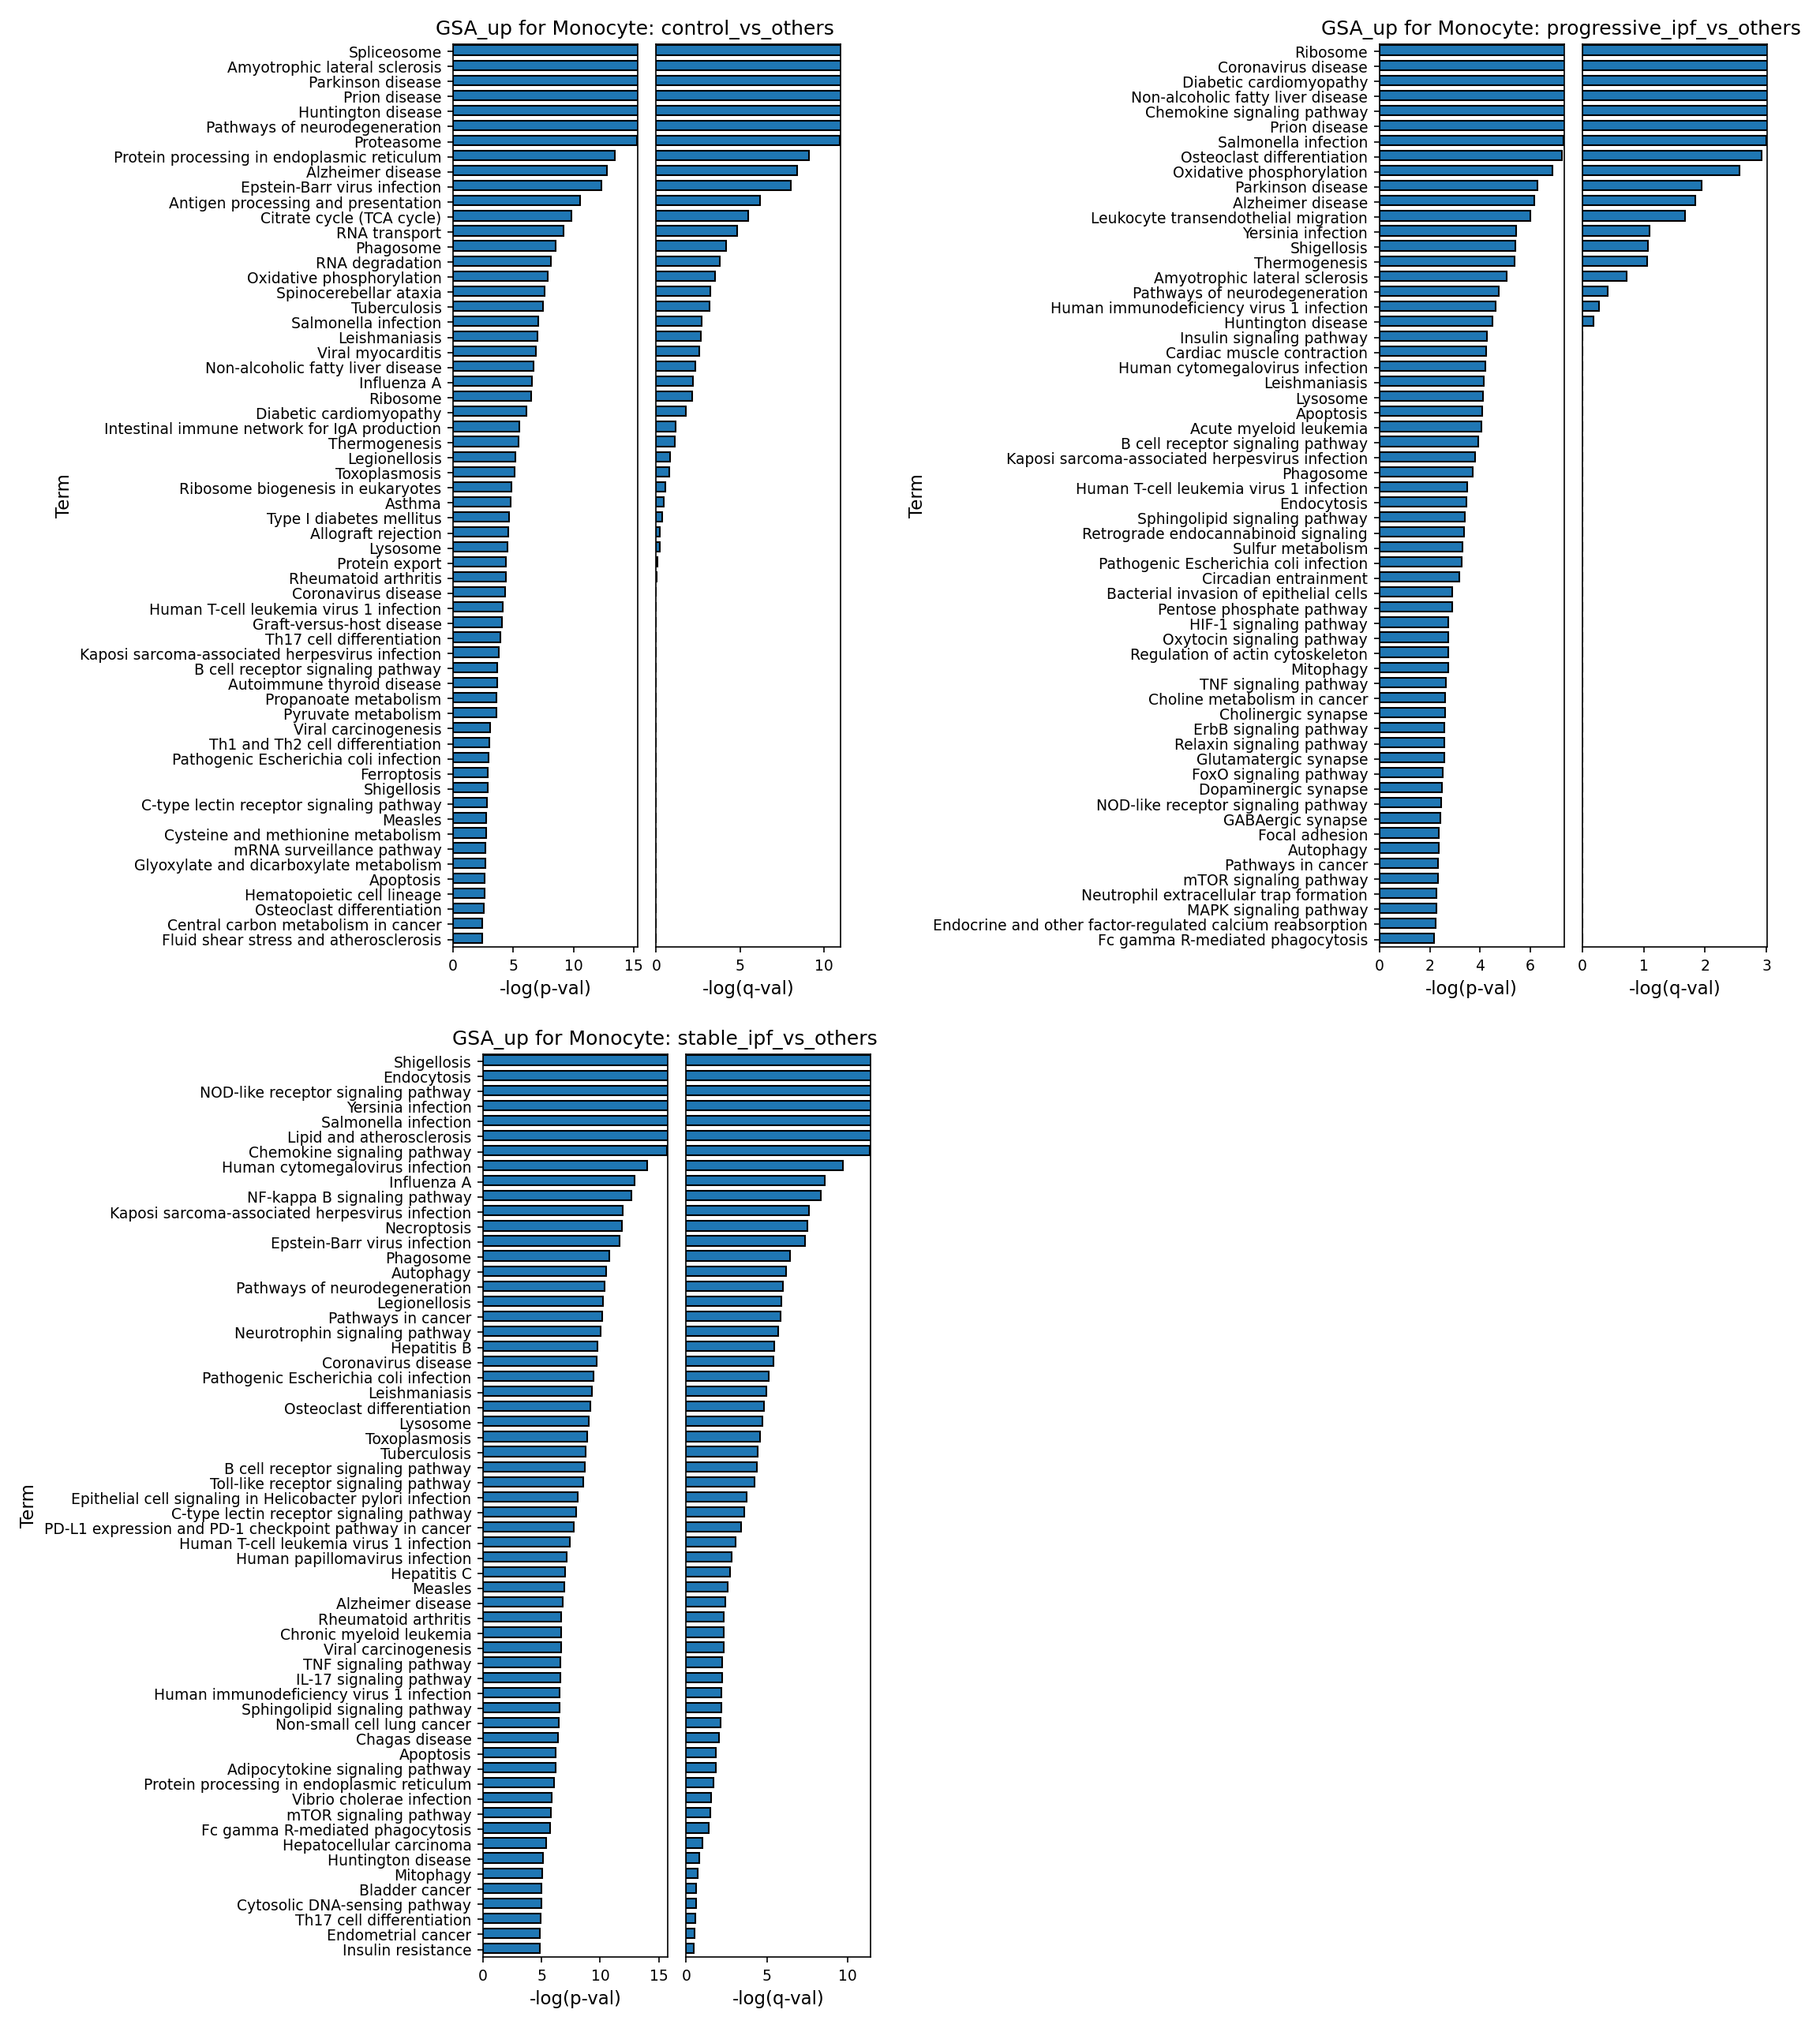
[Analysis Visualization Results]...
Analysis Overview
This report presents the results of Gene Ontology (GO) enrichment analysis (GSA) for Monocytes, comparing each of the three conditions ('control', 'progressive_ipf', 'stable_ipf') against the other two combined (referred to as 'others'). The analysis identifies GO terms (pathways/biological processes) that are significantly enriched for upregulated genes within Monocytes in the specified condition. The results are visualized as bar plots, showing the top enriched terms ranked by their -log(p-val) and -log(q-val). A higher -log(p-val) and -log(q-val) indicates greater statistical significance of enrichment.
Visual Summary
The analysis provides three distinct bar plots, each focusing on Monocytes from a specific condition:
- GSA_up for Monocyte: control_vs_others: This plot displays GO terms significantly enriched in control monocytes compared to the combined progressive and stable IPF monocytes. The most significant terms include "Spliceosome", "Huntington disease", "Pathways of neurodegeneration", "Proteasome", and "Protein processing in endoplasmic reticulum", alongside several fundamental cellular processes and pathogen-related terms.
- GSA_up for Monocyte: progressive_ipf_vs_others: This plot highlights GO terms significantly enriched in progressive IPF monocytes compared to control and stable IPF monocytes. Top enriched terms include "Ribosome", "Coronavirus disease", "Diabetic cardiomyopathy", "Non-alcoholic fatty liver disease", "Chemokine signaling pathway", and "Leukocyte transendothelial migration". These indicate a shift towards inflammatory and migratory activities.
- GSA_up for Monocyte: stable_ipf_vs_others: This plot shows GO terms significantly enriched in stable IPF monocytes compared to control and progressive IPF monocytes. Highly enriched terms include "Shigellosis", "Endocytosis", "NOD-like receptor signaling pathway", "Yersinia infection", "Salmonella infection", "Lipid and atherosclerosis", and "Chemokine signaling pathway". These suggest active innate immune responses and cellular uptake.
Across all plots, a range of infectious disease pathways (e.g., Salmonella, Epstein-Barr virus, Influenza A, Coronavirus disease) and neurodegenerative pathways (e.g., Alzheimer disease, Parkinson disease, Huntington disease) appear frequently, albeit with varying degrees of significance across conditions.
Biological Interpretation
Monocytes are crucial innate immune cells that circulate in the blood and can differentiate into macrophages and dendritic cells, playing vital roles in immune surveillance, inflammation, and tissue repair. The observed differential enrichment of GO terms suggests distinct functional states of circulating monocytes across different IPF conditions.
Monocyte Profiles by Condition:
Control Monocytes (enriched in control vs. combined IPF states):
Monocytes from control individuals show significant enrichment in fundamental cellular processes such such as the Spliceosome, Proteasome, Ribosome, Protein processing in endoplasmic reticulum, RNA transport, Oxidative phosphorylation, and Citrate cycle (TCA cycle). This suggests that in a healthy, homeostatic state, circulating monocytes maintain robust basic cellular machinery, indicating efficient metabolic activity, protein synthesis, and degradation pathways. Enrichment in Antigen processing and presentation and Phagosome terms further reflects their baseline immune surveillance and antigen-presenting functions, which are critical for initiating adaptive immune responses. The prominence of neurodegenerative disease-related pathways might reflect fundamental cellular maintenance or stress response pathways that are less perturbed in healthy cells compared to disease states.
- Progressive IPF Monocytes (enriched in progressive IPF vs. control/stable IPF states):
Monocytes in progressive IPF exhibit a profile strongly indicative of activation and increased migratory potential. Highly enriched terms like Chemokine signaling pathway and Leukocyte transendothelial migration are particularly notable. These pathways are central to immune cell recruitment and extravasation from the bloodstream into tissues, suggesting that monocytes in progressive IPF are primed to migrate to sites of inflammation and fibrosis in the lung. This is consistent with the known role of monocytes differentiating into pro-fibrotic macrophages that drive disease progression in IPF. The enrichment of Ribosome and Oxidative phosphorylation also points to increased metabolic activity and protein synthesis, characteristic of activated immune cells undergoing functional changes. The term "Osteoclast differentiation" might suggest a shift towards distinct myeloid differentiation programs, potentially contributing to tissue remodeling.
- Stable IPF Monocytes (enriched in stable IPF vs. control/progressive IPF states):
Monocytes in stable IPF show enrichment in innate immune response pathways, including NOD-like receptor signaling pathway, NF-kappa B signaling pathway, Phagosome, and Autophagy. This suggests a heightened state of innate immune sensing, pathogen recognition, and cellular clearance mechanisms, potentially involved in sustaining a chronic inflammatory response. Endocytosis and Lysosome enrichment further supports active cellular uptake and degradation, which are critical functions for monocytes/macrophages in clearing debris and pathogens. The presence of Chemokine signaling pathway also indicates ongoing inflammatory communication and potential recruitment, though the specific types or magnitude might differ from the progressive phase. The high prevalence of various infectious disease terms across all conditions, including in stable IPF, could reflect a general inflammatory milieu or a heightened immune response to potential infections in the context of chronic lung disease.
Overall Interpretation:
The findings suggest a dynamic shift in monocyte biology during IPF. In progressive IPF, monocytes appear to be highly activated for migration and inflammatory signaling, potentially contributing to the worsening fibrotic process. In stable IPF, monocytes demonstrate a robust innate immune response and cellular clearance phenotype, which might play a role in maintaining disease stability or responding to chronic stimuli. Control monocytes, in contrast, emphasize homeostatic cellular functions and baseline immune surveillance. The common enrichment of certain infectious disease and neurodegenerative pathways across conditions might reflect general systemic inflammatory responses or shared cellular stress pathways that are dysregulated in the context of IPF.
Clinical or Translational Implications
The distinct functional profiles of monocytes observed across control, stable IPF, and progressive IPF conditions hold significant clinical and translational implications:
- Biomarkers of Disease Progression: The strong enrichment of pathways related to immune cell migration (Chemokine signaling pathway, Leukocyte transendothelial migration) in progressive IPF monocytes suggests that these pathways, or the genes involved, could serve as potential blood-based biomarkers to identify patients at risk of disease progression or to monitor treatment efficacy.
- Therapeutic Targets: Understanding the specific inflammatory and migratory programs active in progressive IPF monocytes could open avenues for targeted therapies. Modulating chemokine signaling or monocyte recruitment pathways might attenuate the influx of pro-fibrotic cells into the lung, thereby slowing disease progression.
- Stratification of Patients: The different monocyte activation states in stable versus progressive IPF could help in stratifying patients for personalized treatment strategies. Patients with a progressive monocyte phenotype might benefit from more aggressive anti-fibrotic or immunomodulatory therapies, while those with a stable profile might require different management approaches.
- Understanding Pathogenesis: The results provide insights into the systemic immune contributions to IPF pathogenesis, highlighting the role of circulating monocytes in driving or modifying the disease course. Further investigation into the specific chemokines and their receptors involved could clarify the mechanisms of monocyte recruitment to the fibrotic lung.
References:
- For general information on Idiopathic Pulmonary Fibrosis: PubMed search for Idiopathic Pulmonary Fibrosis
- For general information on Monocytes in lung disease: PubMed search for Monocytes lung fibrosis
13. Gene Set Enrichment Analysis Across Blood Cell Types in Idiopathic Pulmonary Fibrosis
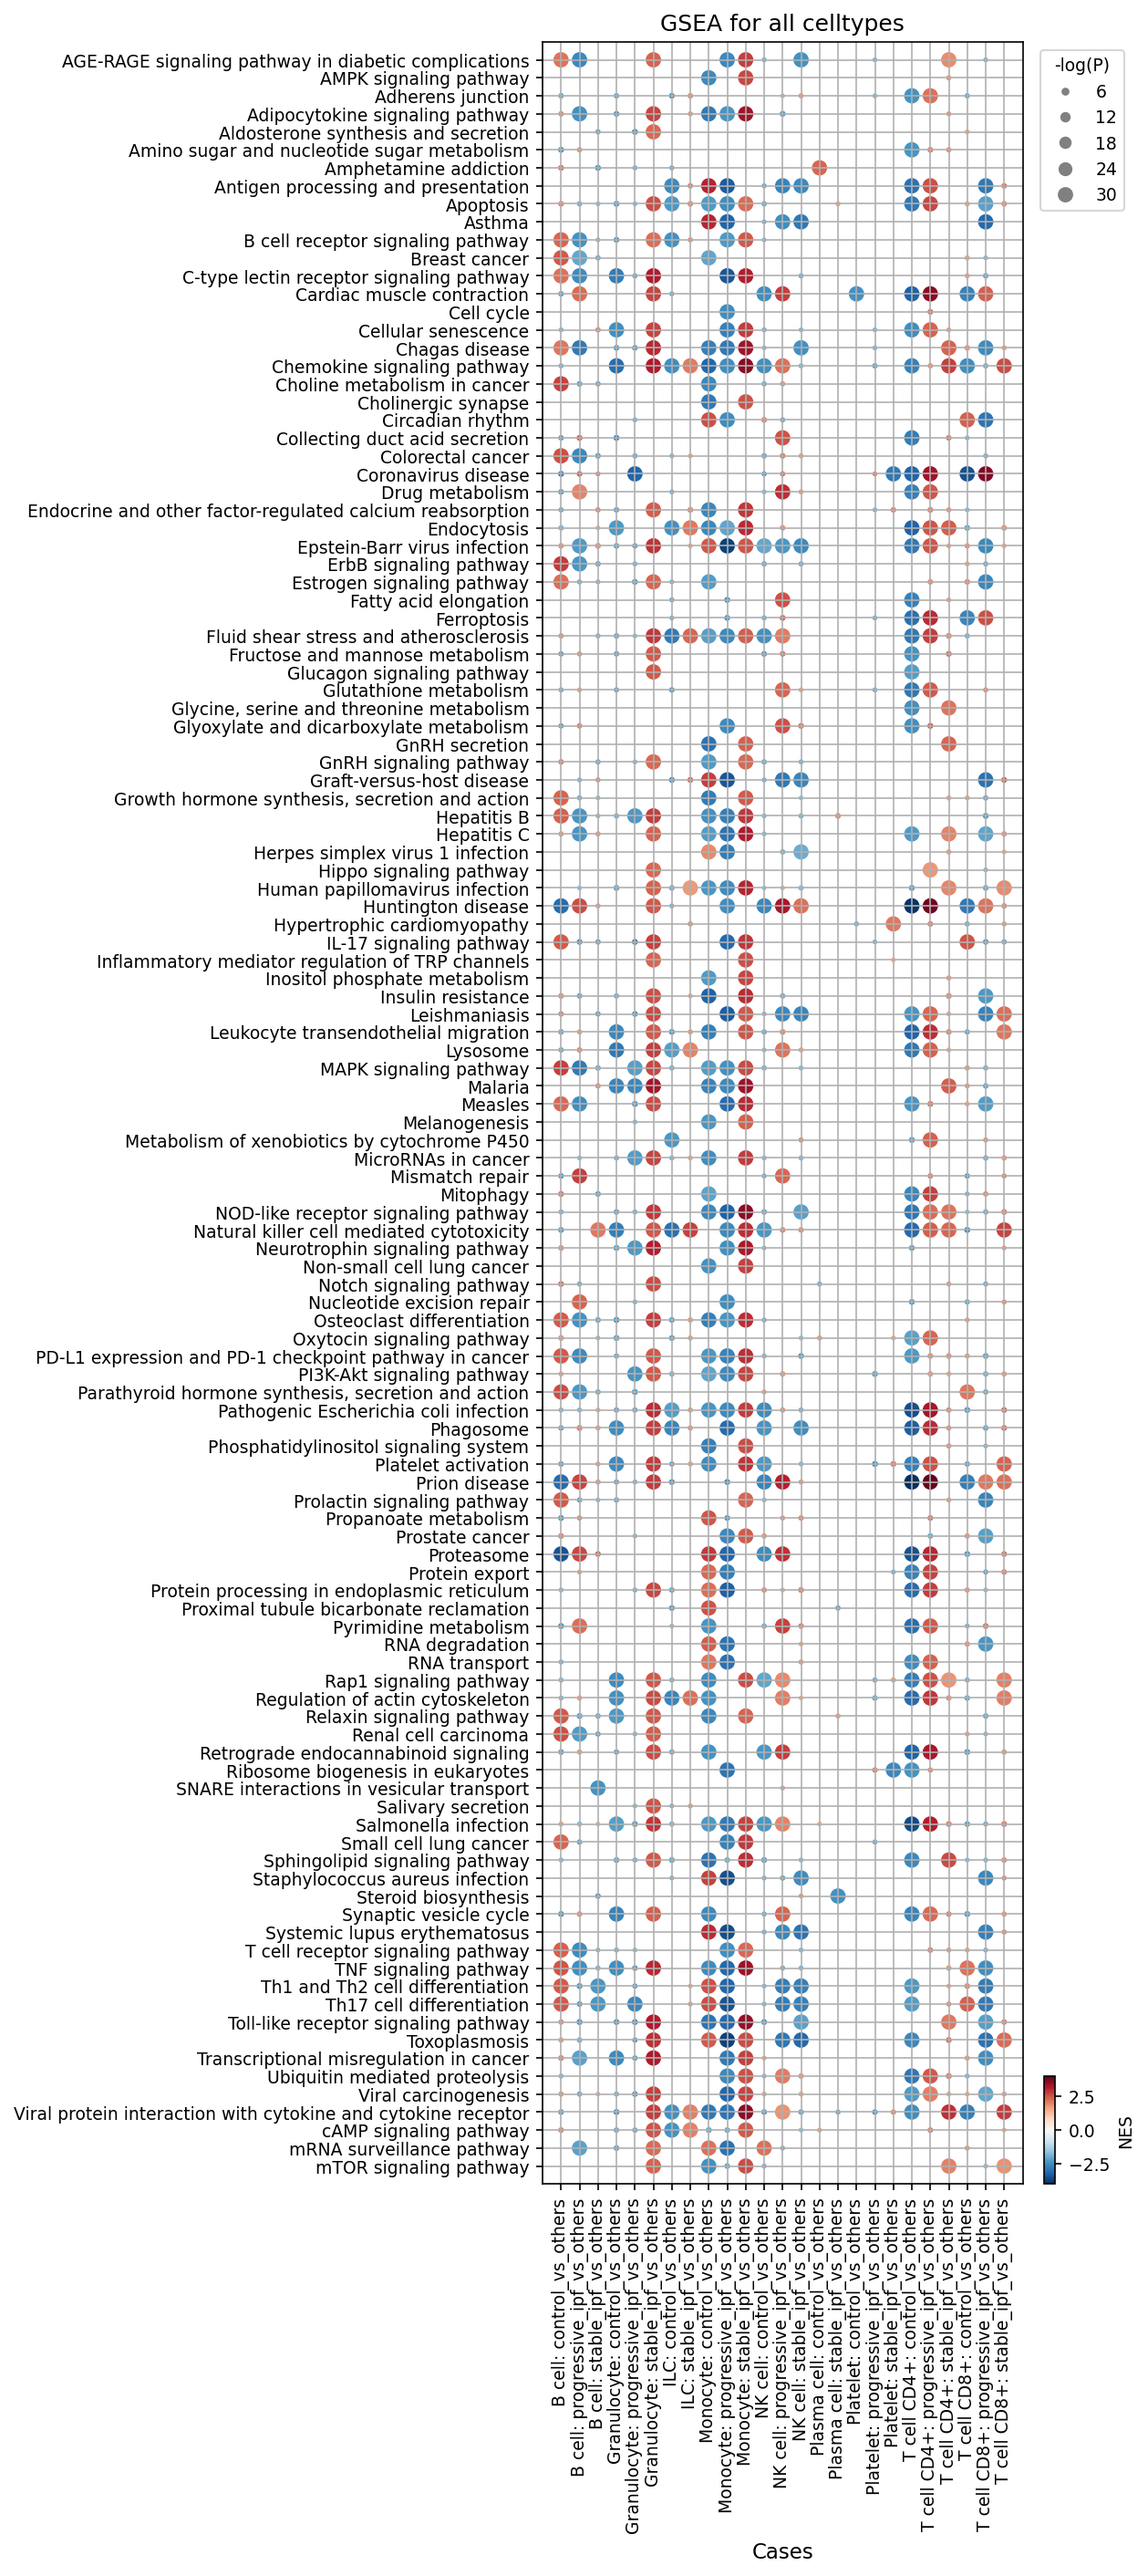
[Analysis Visualization Results]...
Analysis Overview
This analysis presents Gene Set Enrichment Analysis (GSEA) results for various celltype_minor populations in blood, comparing different disease conditions (control, progressive_ipf, stable_ipf) against the combined "other" conditions. The dot plot visualizes the Normalized Enrichment Score (NES) using color (red for positive enrichment, blue for negative enrichment) and the significance (-log(p-value)) using dot size. The objective is to identify key pathways and biological processes that are differentially regulated in specific immune cell subsets during stable and progressive Idiopathic Pulmonary Fibrosis (IPF).
Visual Summary
The GSEA dot plot reveals distinct patterns of pathway enrichment and depletion across various blood cell types (B cell, Granulocyte, ILC, Monocyte, NK cell, Plasma cell, Platelet, T cell CD4+, T cell CD8+) and conditions related to IPF.
- Widespread Immune Activation in Progressive IPF: A prominent pattern is the strong and significant positive enrichment (large red dots) of several immune and inflammatory pathways, particularly in the progressive_ipf_vs_others comparison, across multiple cell types including Monocytes, NK cells, T cell CD4+, and T cell CD8+.
Key Enriched Pathways:
- Chemokine signaling pathway: Shows consistent and strong positive enrichment across B cells, Granulocytes, Monocytes, NK cells, T cell CD4+, and T cell CD8+ in progressive_ipf_vs_others and, to a lesser extent, in stable_ipf_vs_others.
- Toll-like receptor signaling pathway: Highly enriched in Monocytes, NK cells, and T cell CD8+ in progressive_ipf_vs_others.
- Th17 cell differentiation: Markedly upregulated in T cell CD4+ and T cell CD8+ from progressive_ipf_vs_others.
- mTOR signaling pathway: Consistently upregulated in Monocytes, NK cells, T cell CD4+, and T cell CD8+ in progressive_ipf_vs_others.
- Apoptosis: Shows positive enrichment in Monocytes, T cell CD4+, and T cell CD8+ in progressive_ipf_vs_others.
- Leukocyte transendothelial migration: Upregulated in Monocytes, NK cells, T cell CD4+, and T cell CD8+ from progressive_ipf_vs_others.
- Antigen processing and presentation: Enriched in Monocytes and T cell CD4+ from progressive_ipf_vs_others.
- Metabolic pathways: Pathways such as Fatty acid elongation and Lysosome show notable positive enrichment, particularly in Monocytes and NK cells, in progressive_ipf_vs_others.
- Cell-Type Specificity: Monocytes, NK cells, and T cells (both CD4+ and CD8+) exhibit the most extensive and significant pathway changes, suggesting their central role in the systemic immune response in IPF. Other cell types like B cells, Granulocytes, and Platelets also show specific, albeit often less widespread, enrichments.
- Differences between Conditions: The progressive_ipf_vs_others columns generally display more numerous and stronger positive enrichments compared to stable_ipf_vs_others and control_vs_others, highlighting a heightened state of immune activation and dysregulation during disease progression. Conversely, control_vs_others often shows negative enrichment (blue dots) for pathways that are upregulated in IPF conditions, indicating relative quiescence in healthy controls.
Biological Interpretation
The observed GSEA patterns provide insights into the systemic immune dysregulation in IPF, particularly in its progressive form. The study being conducted on blood samples allows for the detection of circulating immune cell alterations that may reflect or contribute to lung pathology.
- Exaggerated Inflammation and Immune Cell Recruitment: The strong enrichment of the Chemokine signaling pathway across multiple immune cell types, especially in progressive IPF, indicates enhanced chemokine production and responsiveness. Chemokines are crucial for immune cell recruitment to sites of inflammation and fibrosis, suggesting increased trafficking of these cells towards the affected lung tissue in IPF [PubMed Search: chemokines IPF fibrosis]. Similarly, the upregulation of Leukocyte transendothelial migration supports this notion of increased migratory potential of immune cells.
- Innate and Adaptive Immune Activation:
- Toll-like receptor signaling pathway enrichment points to activated innate immune responses, potentially triggered by endogenous danger signals or pathogens in IPF [PubMed Search: TLR signaling IPF].
- The significant upregulation of Th17 cell differentiation in T cells is a critical finding. Th17 cells are known to produce pro-inflammatory cytokines and contribute to fibrotic processes, linking them to IPF pathogenesis [PubMed Search: Th17 cells IPF]. The general shift in Th1 and Th2 cell differentiation also points to altered T-cell polarization.
- Enrichment in Antigen processing and presentation pathways suggests enhanced antigen-presenting capabilities in monocytes and T cells, which could fuel chronic adaptive immune responses.
- Metabolic Reprogramming and Cellular Stress: The activation of metabolic pathways like Fatty acid elongation and Lysosome in Monocytes and NK cells suggests metabolic reprogramming, which is a common feature of activated immune cells and plays a role in their effector functions [PubMed Search: immune cell metabolism fibrosis]. Upregulation of Apoptosis pathways might reflect increased cellular turnover, chronic stress-induced cell death, or an attempt to resolve inflammation.
- Dysregulated Growth and Survival Signaling: The consistent enrichment of the mTOR signaling pathway is highly relevant. mTOR is a central regulator of cell growth, proliferation, metabolism, and survival, and its hyperactivation is implicated in various fibrotic diseases, including IPF, by promoting fibroblast activation and survival of immune cells [PubMed Search: mTOR signaling IPF fibrosis].
Clinical or Translational Implications
The findings from this GSEA analysis have several potential clinical and translational implications for IPF:
- Biomarkers for Disease Progression: The distinct pathway enrichments observed in progressive IPF, particularly in circulating monocytes, NK cells, and T cells, could serve as a valuable source of systemic biomarkers for monitoring disease progression and severity. Longitudinal studies evaluating these pathways could help predict which patients are at higher risk of progression.
- Therapeutic Targets: Pathways like Chemokine signaling, Toll-like receptor signaling, Th17 cell differentiation, and mTOR signaling represent potential therapeutic targets. Modulating these pathways in peripheral immune cells could mitigate their pro-fibrotic and pro-inflammatory contributions to lung disease. For example, inhibitors of specific chemokine receptors or mTOR could be explored.
- Understanding Pathogenesis: This analysis highlights the systemic nature of IPF, emphasizing that blood immune cells undergo significant functional changes. Understanding these peripheral changes can complement studies on lung tissue to provide a more complete picture of IPF pathogenesis.
- Personalized Medicine: Identifying specific cell-type and condition-dependent pathway alterations could pave the way for more personalized therapeutic strategies, targeting the most active pathogenic pathways in individual patients.
14. Discussion
This comprehensive single-cell analysis of peripheral blood in Idiopathic Pulmonary Fibrosis (IPF) provides compelling evidence of systemic immune dysregulation that correlates with disease progression. While UMAP visualizations confirm robust cell type annotation and data integration, the subsequent in-depth analyses highlight significant shifts in cell population proportions, surface marker expression, cell-cell interactions, and pathway enrichment, offering critical insights into IPF pathogenesis.
A central finding is the consistent monocytosis observed in both stable and progressive IPF, accompanied by a relative reduction in circulating T cells. Monocytes in progressive IPF exhibit a strong transcriptional signature of activation, with Gene Ontology analysis revealing enrichment in 'Chemokine signaling pathway' and 'Leukocyte transendothelial migration', indicating their priming for migration to inflammatory sites. This is further supported by Gene Set Enrichment Analysis, which shows broad immune activation and upregulation of the mTOR pathway across monocytes, NK cells, and T cells in progressive IPF. In contrast, stable IPF monocytes show enrichment in innate immune sensing ('NOD-like receptor signaling pathway', 'NF-kappa B signaling pathway') and cellular clearance ('Phagosome', 'Autophagy') pathways, suggesting a different, potentially more contained, inflammatory or adaptive response state. The differential expression of surface markers on monocytes further delineates these states: stable IPF monocytes upregulate HLA-DQA2 (suggesting enhanced antigen presentation) and C3AR1 (complement activation), while control monocytes show higher CD83 and PTGER4 (immune regulation/PGE2 responsiveness).
T cell populations also undergo significant alterations. Progressive IPF is marked by an increase in T regulatory cells (Tregs) and Th22 cells, while stable IPF shows increased NK cells but decreased Th17 and Th2 cells compared to controls. The reduction in naive T cells across IPF conditions suggests chronic immune activation and differentiation. At the surfaceome level, CD8+ T cells in progressive IPF conspicuously co-express CD27 (activation/memory) and TIGIT (exhaustion marker), alongside S1PR1 (lymphocyte egress), pointing to a state of activated but potentially exhausted T cell responses that may fail to effectively resolve inflammation or contribute to tissue damage. Conversely, CD8+ T cells in stable IPF upregulate HLA-DRB5, FCGR3A, and CXCR3, indicating a highly activated, tissue-homing, and potentially cytotoxic phenotype. CD4+ T cells in progressive IPF show high expression of PTGER2 (PGE2 receptor) and SIT1 (TCR inhibitor), suggesting they are subject to immunomodulatory and inhibitory signals.
Cell-cell interaction (CCI) analyses reveal a progressively heightened communication network from control to stable to progressive IPF, notably centered around monocytes. Key interactions in progressive IPF include SPP1-integrin αVβ1 (a potent pro-fibrotic axis), CXCL12-CXCR4 (critical for immune cell trafficking), SIRPG-CD47 ('don't eat me' signal, potentially hindering clearance of senescent cells), and sustained PGE2 receptor signaling. These interactions underscore enhanced systemic inflammation, cellular trafficking, and altered immune regulation, which likely contribute to the fibrotic milieu. The prevalence of CD86-CD28 interactions in progressive IPF further highlights ongoing T cell co-stimulation.
In summary, the peripheral blood in progressive IPF presents a highly activated, migratory, and potentially exhausted immune landscape, characterized by dysregulated monocyte and T cell functions and exacerbated cell-cell communication. These systemic changes are likely reflective of, and potentially contribute to, the chronic inflammation and aberrant repair mechanisms occurring in the fibrotic lung. The distinct profiles observed between stable and progressive IPF, and healthy controls, offer valuable targets for therapeutic intervention and biomarkers for disease monitoring.
Hypotheses:
- Expanded and activated monocytes in progressive IPF drive fibrotic processes through increased trafficking, antigen presentation (HLA-DQA2), and complement-mediated inflammation (C3AR1).
- CD8+ T cells in progressive IPF are in a state of exhaustion (TIGIT+) that impairs effective anti-fibrotic immunity and contributes to disease persistence.
- Dysregulated PGE2 signaling, particularly via PTGER2/PTGER4 on CD4+ T cells and monocytes, contributes to immune suppression or aberrant immune responses in progressive IPF, failing to resolve inflammation.
- Enhanced cell-cell interactions, specifically involving SPP1-integrin and CXCL12-CXCR4 axes, promote the recruitment and activation of pro-fibrotic immune cells to the lung in progressive IPF.
- The 'don't eat me' signal via SIRPG-CD47 is amplified in progressive IPF, potentially impairing the clearance of senescent cells or apoptotic debris that perpetuate inflammation and fibrosis.
Potential therapeutic targets:
- TIGIT (on CD8+ T cells): High expression of TIGIT on CD8+ T cells in progressive IPF suggests a state of T cell exhaustion, which prevents effective anti-fibrotic or immune-regulatory responses. Blocking TIGIT could reinvigorate these T cells. Evidence: Section 9: TIGIT is consistently highly expressed on CD8+ T cells in progressive IPF samples. TIGIT acts as an inhibitory immune checkpoint receptor, leading to T cell exhaustion. Validation: Evaluate the effect of anti-TIGIT antibodies on the proliferation, cytokine production, and cytotoxic function of isolated CD8+ T cells from progressive IPF patients *in vitro*. Assess the impact of TIGIT blockade in relevant *in vivo* fibrosis models.
- C3AR1 (on Monocytes): Upregulation of C3AR1 on monocytes in stable IPF indicates increased responsiveness to complement component C3a, a potent pro-inflammatory mediator. Inhibiting this receptor could dampen monocyte-driven inflammation. Evidence: Section 10: HLA-DQA2, C3AR1, and AQP9 are upregulated in stable IPF monocytes. C3AR1 is a receptor for complement anaphylatoxin C3a, leading to cell activation and cytokine release. Validation: Test C3AR1 antagonists on isolated stable IPF monocytes *in vitro* for their ability to reduce pro-inflammatory cytokine secretion and migratory capacity. Evaluate the therapeutic potential of C3AR1 inhibitors in pre-clinical models of pulmonary fibrosis.
- SPP1-Integrin αVβ1 Axis (Monocyte-centric CCIs): The SPP1 (Osteopontin)-integrin αVβ1 interaction is highly significant and strongly expressed in progressive IPF, particularly among monocytes and T cells. SPP1 is a known pro-fibrotic cytokine that promotes fibroblast activation and immune cell recruitment. Blocking this axis could directly target fibrosis-driving mechanisms. Evidence: Section 7: SPP1-integrin αVβ1 complex is highly significant and strongly expressed in progressive IPF for various cell pairs, notably Monocyte-Monocyte and Monocyte-T cell CD8+/CD4+. Section 8 reiterates its significance. Validation: Use neutralizing antibodies against SPP1 or integrin αV/β1 to disrupt these interactions in *in vitro* co-culture systems of IPF-derived monocytes and fibroblasts, assessing effects on fibroblast activation and collagen production. Test efficacy in relevant animal models of pulmonary fibrosis.
- CXCR3/CXCL10 Axis (T cell/Monocyte trafficking): CXCR3 is elevated on CD8+ T cells in stable IPF, and chemokine signaling pathways, including CXCL10, are broadly enriched in progressive IPF across multiple cell types. This axis is critical for recruiting immune cells to inflammatory sites. Blocking CXCR3 could limit the infiltration of pathogenic immune cells into the fibrotic lung. Evidence: Section 9: CXCR3 shows strong expression on CD8+ T cells in stable IPF. Section 13: Chemokine signaling pathway shows consistent and strong positive enrichment across B cells, Granulocytes, Monocytes, NK cells, T cell CD4+, and T cell CD8+ in progressive IPF. Validation: Employ CXCR3 antagonists *in vitro* to assess their impact on the migratory capacity of IPF-derived T cells and monocytes. Evaluate the effect of CXCR3/CXCL10 blockade on immune cell infiltration and fibrosis progression in experimental models of IPF.
- mTOR signaling pathway: The mTOR signaling pathway is consistently upregulated across multiple immune cell types (monocytes, NK cells, T cells) in progressive IPF. mTOR is a key regulator of cell growth, metabolism, and survival, and its hyperactivation promotes fibrosis. Inhibiting mTOR could broadly attenuate pro-fibrotic and pro-inflammatory responses. Evidence: Section 13: mTOR signaling pathway is consistently upregulated in Monocytes, NK cells, T cell CD4+, and T cell CD8+ in progressive IPF. Validation: Test existing mTOR inhibitors (e.g., rapamycin analogs) on isolated IPF immune cells for effects on proliferation, cytokine production, and metabolic reprogramming. Evaluate the efficacy of mTOR inhibitors in pre-clinical models of IPF, assessing their impact on immune cell phenotype and fibrotic markers.
Follow-up validation ideas:
- Perform multi-parameter flow cytometry on peripheral blood and bronchoalveolar lavage fluid (BALF) from IPF patients to validate the altered proportions of T cell subsets (Tregs, Th22, T_Naive), NK cells, and the expression of surface markers like TIGIT, CD27, HLA-DQA2, C3AR1, and CXCR3 on specific cell populations.
- Conduct functional *in vitro* assays using isolated monocytes and T cells from IPF patients to assess migratory capacity (chemotaxis assays), cytokine production profiles, antigen-presenting function, and T cell activation/exhaustion status in response to specific stimuli or therapeutic agents.
- Utilize spatial transcriptomics or multiplexed immunostaining on IPF lung biopsy samples to validate the presence, localization, and co-localization of cell types with observed peripheral blood changes (e.g., TIGIT+ CD8+ T cells, C3AR1+ monocytes) and to confirm the activity of key cell-cell interactions (e.g., SPP1-integrin) within the fibrotic microenvironment.
- Develop *in vitro* perturbation models using primary human IPF-derived cells or relevant cell lines to test the impact of targeting identified therapeutic pathways (e.g., TIGIT blockade, C3AR1 antagonism, PGE2 pathway modulation, mTOR inhibition) on pro-fibrotic gene expression, cell survival, and inflammatory responses.
- Validate the identified biomarkers and therapeutic targets in an independent, larger cohort of IPF patients, including longitudinal sampling, to correlate peripheral blood findings with clinical progression, lung function decline, and treatment response.
Limitations:
This report is based on single-cell RNA sequencing data from peripheral blood, meaning the observed systemic immune changes may not fully recapitulate the complex cellular dynamics and microenvironment within the primary affected organ, the lung. The interpretations of cell population shifts and gene expression patterns are correlative and do not establish direct causality in IPF pathogenesis. Furthermore, while most cell type annotations are robust, the marker gene expression for some T helper cell subsets displayed inconsistencies, suggesting potential refinement opportunities for these specific annotations. The heterogeneity within patient groups, particularly 'stable_ipf', also highlights the diverse nature of IPF, implying that findings may not apply uniformly to all patients. The surfaceome marker analysis was limited to a subset of markers and may not capture all relevant surface proteins. Finally, the analysis infers disease context from metadata, which is not a clinical diagnosis or observation from this particular dataset.
15. Query List
- Show and save UMAPs for condition, sample, major cell type, minor cell type, and celltype_subset in two columns.
- Show major cell type scores on UMAP and save the result.
- Show and save a marker expression dot plot for celltype_subset. SET target_cell = None and var_group_rotation = 45. Leave all other arguments at their default values.
- Show and save a population bar plot of minor cell types.
- Show and save a population bar plot of T cell subsets.
- Show and save box plots of T cell subset populations with statistically significant differences between conditions, if any. Choose ncols based on the total number of panels.
- Show and save cell-cell interaction patterns. Select at most 80 cell-cell interactions per group.
- Find cell-cell interactions involving major immune and stromal cells that differ significantly between conditions, show them as a dot plot, and save the result. Set max_n_items_per_group to 60. For each interaction identified under each condition, using the provided dataset context, describe the associated signaling pathways and mechanisms and, where relevant, its potential as a therapeutic target and related therapeutic agents.
- Show marker expressions for T cell CD8+ in a dot plot, and save the result. Use only surfaceome markers, with at most 50 markers per condition. For each marker identified under each condition, using the provided dataset context, describe the associated signaling pathways and biological mechanisms within the tissue and, where relevant, its potential as a therapeutic target for Idiopathic Pulmonary Fibrosis and related therapeutic agents.
- Show marker expressions for Monocyte in a dot plot, and save the result. Use only surfaceome markers, with at most 40 markers per condition. For each marker identified under each condition, using the provided dataset context, describe the associated signaling pathways and biological mechanisms within the tissue and, where relevant, its potential as a therapeutic target for Idiopathic Pulmonary Fibrosis and related therapeutic agents.
- Show marker expressions for T cell CD4+ in a dot plot, and save the result. Use only surfaceome markers, with at most 40 markers per condition. For each marker identified under each condition, using the provided dataset context, describe the associated signaling pathways and biological mechanisms within the tissue and, where relevant, its potential as a therapeutic target for Idiopathic Pulmonary Fibrosis and related therapeutic agents.
- Show Gene Ontology (GSA) analysis results for Monocyte as a bar plot, and save the result.
- Show Gene Set Enrichment Analysis results as a dot plot, and save it. Set the color map to RdBu_r, n_pws_to_show to 120, and target_cells to None.