Single-Cell Transcriptomic Insights into Cellular Heterogeneity and Pathological Mechanisms in Familial (E280A) and Sporadic Alzheimer's Disease
This single-cell RNA sequencing analysis of human brain tissue reveals distinct and shared cellular and molecular alterations in familial (E280A) and sporadic Alzheimer's disease (AD) compared to control. Population analysis shows increased reactive glial cells in sporadic AD. Cell-cell interaction studies highlight dysregulated glutamatergic signaling, reduced synaptic adhesion in both AD forms, with sporadic AD exhibiting prominent neuroinflammation and cerebrovascular pathology, while E280A shows signs of oligodendrocyte dysfunction. Neuronal surfaceome analysis identifies markers of healthy function in controls, altered cAMP signaling and serotonergic transmission in E280A neurons, and widespread inflammatory, synaptic, and stress-related markers in sporadic AD neurons. Pathway enrichment analyses (GSA, GSEA) consistently point to neurodegenerative processes, profound synaptic and mitochondrial dysfunction, inflammation, ferroptosis, and cerebrovascular pathology in AD, with notable cell-type-specific responses and a degree of overlap between E280A and sporadic AD at the pathway level.
Contents
- Dataset overview
- UMAP Visualization of Cell Populations by Condition, Sample, and Cell Type Hierarchies in Alzheimer's Disease Brain
- Major Cell Type Scoring and Distribution on UMAP
- Marker Expression Dot Plot for Cell Subtype Annotation Assessment
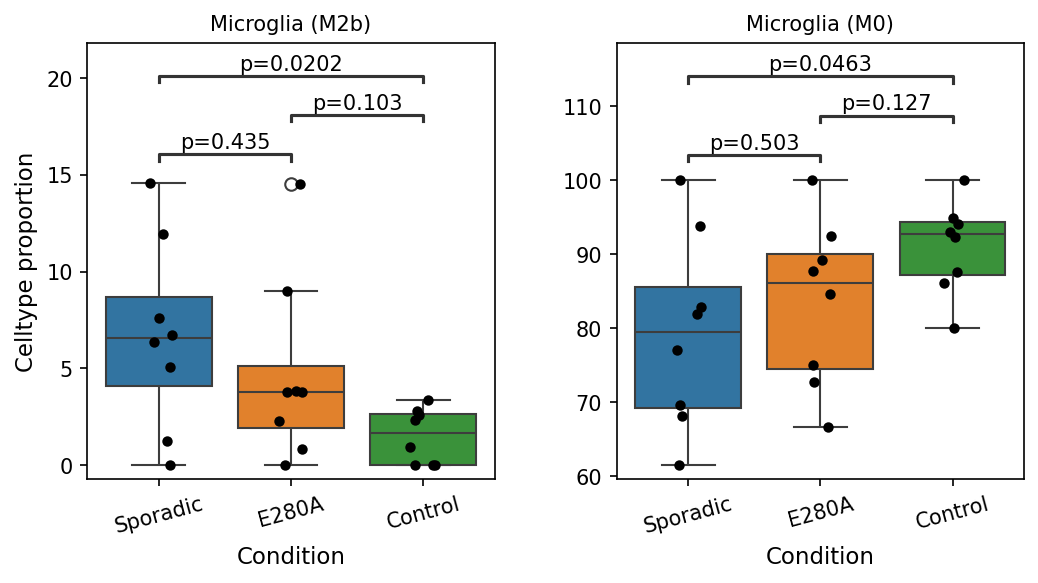
- Minor Cell Type Population Analysis Across Alzheimer's Disease Conditions
- Cell-Cell Interaction Analysis Across Alzheimer's Disease Conditions
- Condition-Specific Cell-Cell Interaction Patterns in Alzheimer's Disease
- Neuron Surfaceome Marker Expression Across Alzheimer's Disease Conditions
- Gene Ontology (GSA) Analysis of Neurons Across Alzheimer's Disease Conditions
- Gene Set Enrichment Analysis Across Brain Cell Types in Alzheimer's Disease
- Discussion
- Query List
0. Dataset overview
데이터셋 요약
데이터 형식: AnnData 객체 (단일 세포 RNA-seq 데이터에서 파생)
세포 수: 43,743개
유전자 수: 26,318개
종: 인간
조직: 뇌
조건: E280A, Control, Sporadic
- 주요 세포 유형 (celltype_major): Neuron, Oligodendrocyte, Astrocyte, Microglia, Endothelial cell, Stromal cell
- 세부 세포 유형 (celltype_minor): Neuron, Oligodendrocyte progenitor cell, Astrocyte, Oligodendrocyte, Microglia, Endothelial cell, Smooth muscle cell, Fibroblast 등 8개 유형
- 더 세부적인 세포 유형 (celltype_subset): Neuron (Glutamatergic), Oligodendrocyte (Mature, Myelinating), Microglia (M0) 등 25개 유형
임상 및 병리학적 정보
- obs 컬럼에 NIA.A.A.SCORE, BRAAK, CERAD 등 알츠하이머병 관련 임상 및 병리학적 점수 정보가 포함되어 있습니다.
- E280A 조건은 가족성 알츠하이머병과 관련된 PSEN1 돌연변이를 나타냅니다.
사전 계산된 분석 결과
- 세포-세포 상호작용 (CCI): uns['CCI'] (조건별), uns['CCI_sample'] (샘플별) 결과가 저장되어 있습니다.
- 차등 발현 유전자 (DEG): uns['DEG'] (각 세포 유형별 다른 조건 대비) 및 uns['DEG_vs_ref'] (기준 조건 'Control' 대비) 결과가 저장되어 있습니다.
- 유전자 세트 농축 분석 (GSEA): uns['GSEA'] 및 uns['GSEA_vs_ref'] 결과가 저장되어 있습니다.
- 유전자 온톨로지 (GO/GSA): uns['GSA_up'] 및 uns['GSA_vs_ref_up'] 결과가 저장되어 있습니다.
분석 주의사항
- CNV(Copy Number Variation) 추정치는 현재 데이터셋에 포함되어 있지 않습니다.
- DEG, GSEA, GSA/GO 분석을 위한 target_celltype은 Astrocyte, Endothelial cell, Microglia, Neuron, Oligodendrocyte, Oligodendrocyte progenitor cell, Smooth muscle cell 중에서 선택해야 합니다.
추론된 질병/생물학적 맥락
- 데이터셋은 알츠하이머병과 관련이 있을 것으로 추론됩니다. 이는 obs 컬럼의 NIA, BRAAK, CERAD 점수 및 E280A, Sporadic과 같은 조건명에서 확인됩니다.
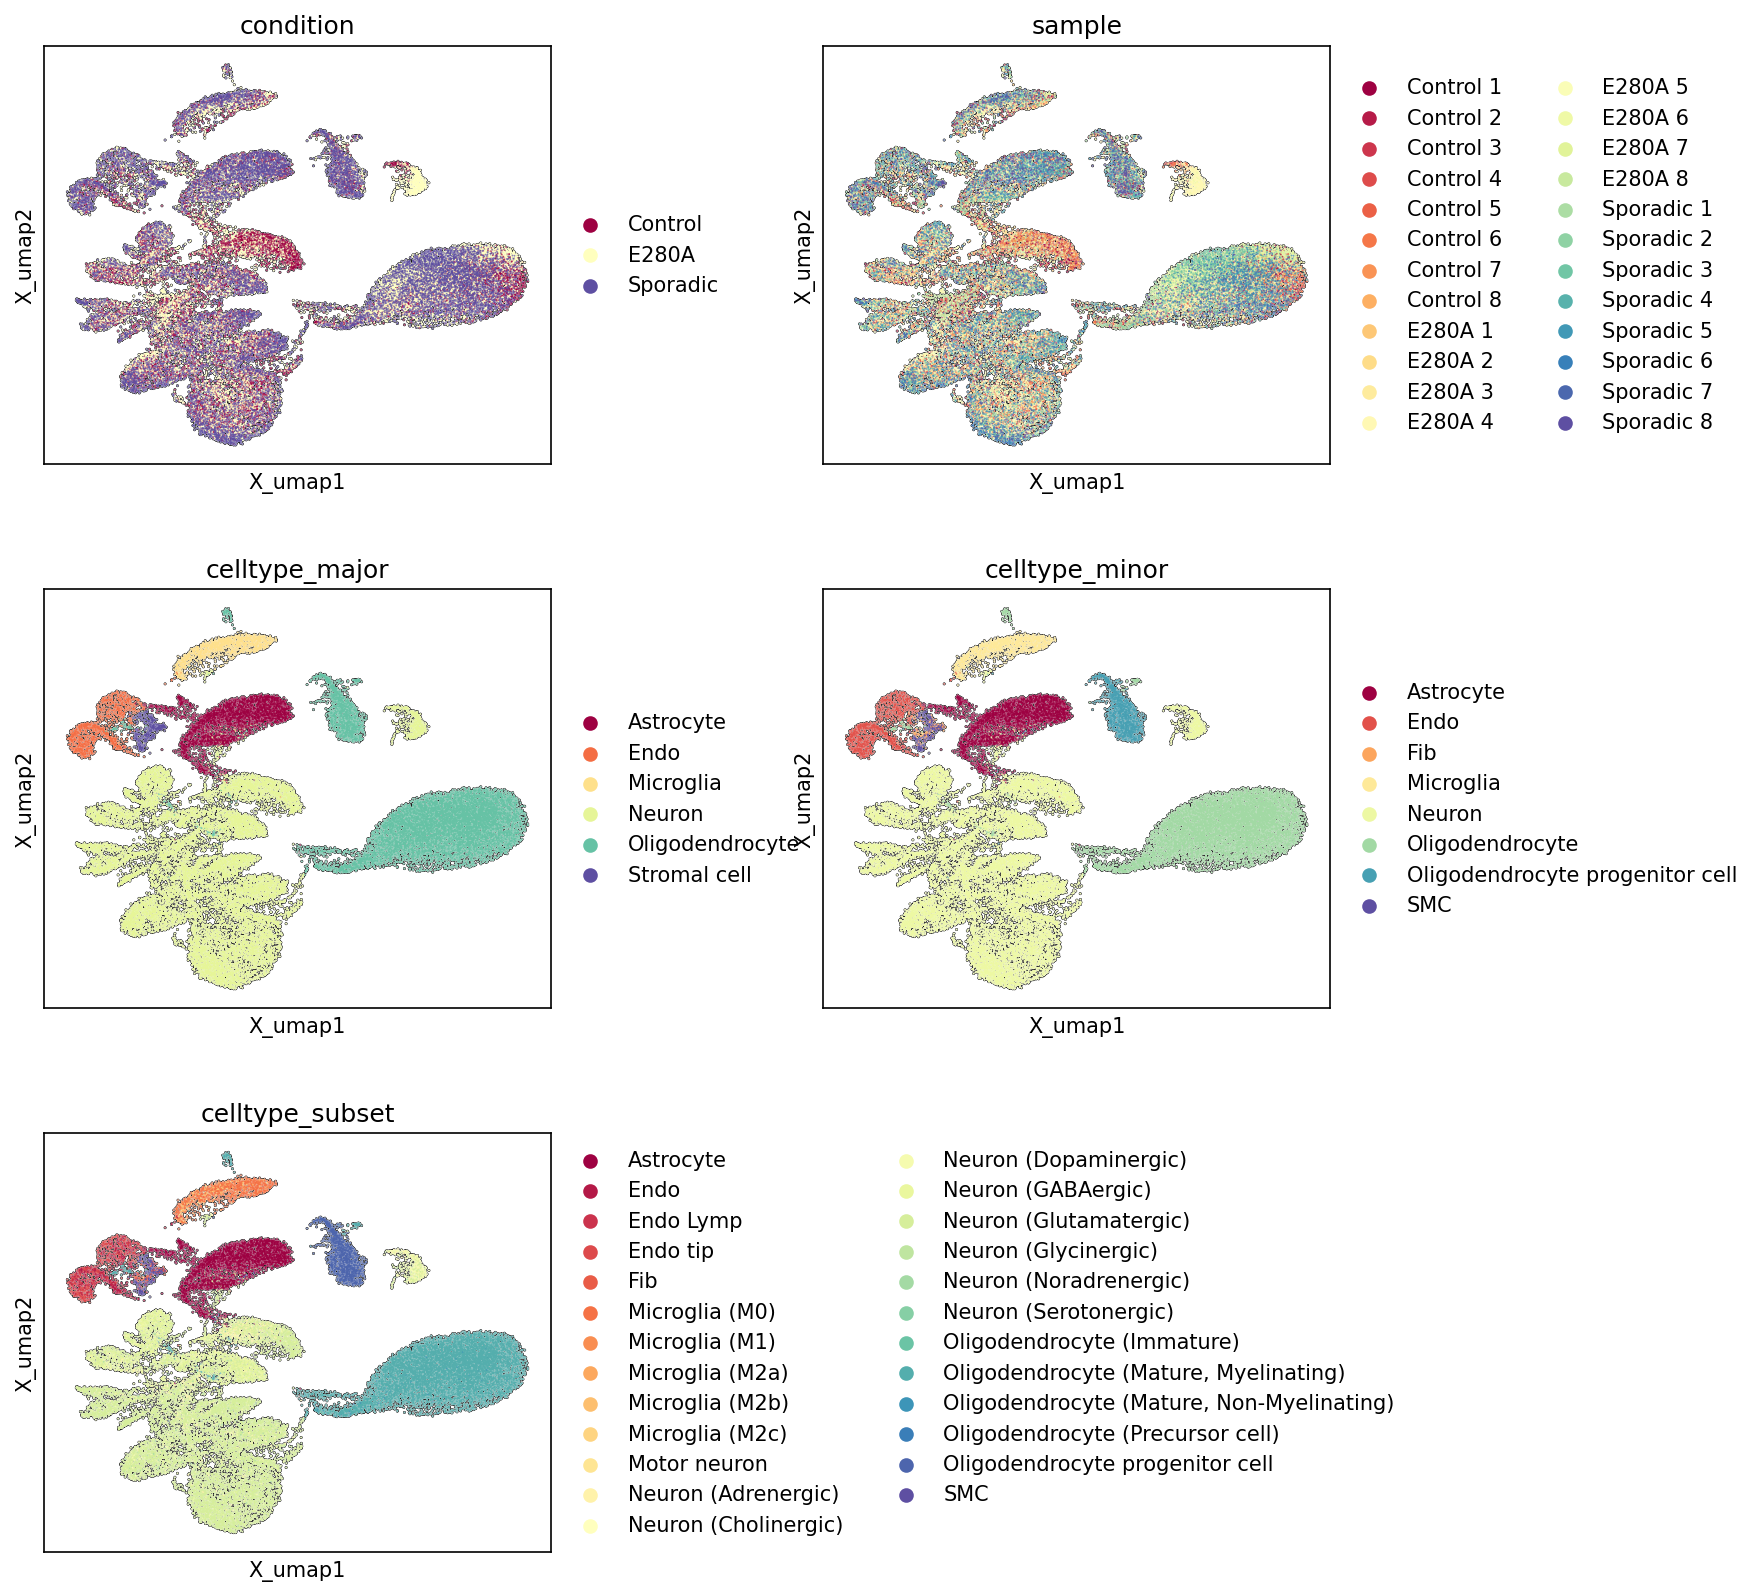
1. UMAP Visualization of Cell Populations by Condition, Sample, and Cell Type Hierarchies in Alzheimer's Disease Brain
[Analysis Visualization Results]...
Analysis Overview
This analysis presents five UMAP (Uniform Manifold Approximation and Projection) plots, visualizing the global transcriptional landscape of 43,743 cells from human brain tissue. These plots are colored by different metadata attributes: condition (Control, E280A, Sporadic Alzheimer's Disease), sample (individual patients), celltype_major, celltype_minor, and celltype_subset. The primary goal is to assess the quality of the data embedding, the distinctness of cell type annotations, and the distribution of cells across conditions and samples. This allows for an initial understanding of the dataset's structure and potential batch effects or disease-specific shifts in cell composition or state.
Visual Summary
Condition
The UMAP colored by condition shows a significant degree of overlap between cells from Control, E280A, and Sporadic conditions across most of the major cell clusters. This mixing suggests that the major cell type composition is broadly preserved across conditions, and that any major batch effects related to condition have been mitigated. However, some areas show differential enrichment:
- The 'Sporadic' condition (dark blue) appears slightly enriched in some distinct clusters, particularly in the lower-right region of the UMAP, which may correspond to specific cell types or states that are more prevalent in Sporadic Alzheimer's disease.
- The 'E280A' condition (yellow) also shows some regions of enrichment, particularly in smaller, more peripheral clusters, indicating potential unique cellular profiles or responses in this familial form of Alzheimer's disease.
- The 'Control' condition (dark red) is widely distributed, largely overlapping with the disease conditions, which is expected as many cell types and their core functions should be conserved.
Sample
The sample UMAP displays an excellent mixing of cells from different individual patients across the entire embedding. Cells from each unique sample (represented by distinct colors) are largely intermingled within the larger clusters, rather than forming segregated patient-specific clusters. This indicates successful batch correction and suggests that variability due to individual patient differences or technical artifacts is not dominating the observed biological separation of cell types.
Celltype_major
This UMAP shows clear and robust separation of the major cell types: Astrocyte, Endothelial cell, Microglia, Neuron, Oligodendrocyte, and Stromal cell. Each major cell type forms distinct clusters, demonstrating high confidence in these high-level annotations.
- Neurons (light yellow) constitute the largest and most transcriptionally diverse population, forming a complex, branched structure, consistent with the expected heterogeneity of neuronal subtypes in the brain.
- Oligodendrocytes (green) form another large, well-defined cluster distinct from neurons.
- Astrocytes (dark red) and Microglia (orange) also form clearly separated clusters, often adjacent to neuronal or oligodendroglial populations.
- Endothelial cells (red-orange) and Stromal cells (dark blue) occupy smaller, distinct regions, typically more peripheral to the main neuronal/glial clusters.
Celltype_minor
The celltype_minor UMAP refines the major cell type annotations, revealing further substructure.
- Within the Oligodendrocyte lineage, 'Oligodendrocyte' and 'Oligodendrocyte progenitor cell' show distinct separation.
- Endothelial cell and Smooth muscle cell (SMC) are distinguishable, as are Fibroblasts.
- The Neuronal cluster remains broad, as expected given its high diversity, but this level of annotation does not yet delineate specific neuronal subtypes. The overall separation and distinctness of these minor populations remain high.
Celltype_subset
The celltype_subset UMAP provides the most granular view of cellular identities, revealing fine-grained subpopulations.
- Microglia are resolved into distinct functional states (M0, M1, M2a, M2b, M2c), which occupy separate, albeit often adjacent, small clusters within the broader microglial region. This indicates successful capture of different activation states.
- Oligodendrocytes are further segmented into 'Oligodendrocyte (Immature)', 'Oligodendrocyte (Mature, Myelinating)', 'Oligodendrocyte (Mature, Non-Myelinating)', and 'Oligodendrocyte (Precursor cell)', which are clearly resolved.
- Neurons are detailed into multiple subtypes such as 'Neuron (Glutamatergic)', 'Neuron (GABAergic)', 'Neuron (Dopaminergic)', 'Motor neuron', etc. While some neuronal subsets show clear boundaries, many remain somewhat intermingled within the large neuronal manifold, reflecting their continuous transcriptional spectrum.
- Endothelial cells are further differentiated into Endothelial tip cell and Lymphatic Endothelial cell, indicating specific vascular components.
Biological Interpretation
The UMAP visualizations demonstrate a high-quality single-cell RNA-seq dataset from human brain, successfully processed to reveal intricate cellular heterogeneity. The excellent mixing of cells by sample indicates that technical variability and patient-specific batch effects have been largely controlled, allowing for robust biological comparisons.
The clear separation of celltype_major, celltype_minor, and celltype_subset confirms the success of cell type annotation and the ability to resolve diverse cell populations present in the brain. The resolution of glial cell states, particularly Microglia (M0, M1, M2a, M2b, M2c) and Oligodendrocyte lineage cells (Immature, Mature Myelinating, Mature Non-Myelinating, Precursor cell), is particularly valuable in the context of Alzheimer's disease. Microglial activation and oligodendrocyte dysfunction are well-known pathological features of AD, and the ability to distinguish these precise states at a single-cell level will be critical for understanding disease mechanisms. The extensive heterogeneity observed within the neuronal populations is also consistent with the complex functional organization of the brain and provides a basis for investigating subtype-specific vulnerability or responses to AD pathology.
While the condition UMAP shows substantial overlap, indicating shared basic cellular architecture, the subtle enrichments of E280A and Sporadic AD cells in certain regions suggest that disease-specific shifts in cell proportions or the activation of unique cell states are detectable. These subtle differences, rather than gross changes in major cell type presence, are often characteristic of complex neurodegenerative diseases like Alzheimer's. Further differential gene expression and pathway analyses within these specific cell types and subsets will be necessary to pinpoint the precise molecular changes associated with the E280A mutation and sporadic AD.
Annotation Notes
The UMAPs provide strong visual evidence for the high quality and distinctness of the cell type annotations at all hierarchical levels (celltype_major, celltype_minor, celltype_subset). The clustering of cells aligns well with expected biological identities and relationships, supporting the reliability of downstream cell-type-specific analyses. The effective removal of batch effects (as seen in the sample UMAP) further strengthens confidence in the biological signals observed. The resolution of microglial activation states and oligodendrocyte maturation stages is particularly strong, which is highly relevant for brain pathology studies. While neuronal subsets show some intermingling, this is often expected due to their continuous transcriptional states, and the overall distinction of major neuronal clusters is clear.
2. Major Cell Type Scoring and Distribution on UMAP
[Analysis Visualization Results]...
Analysis Overview
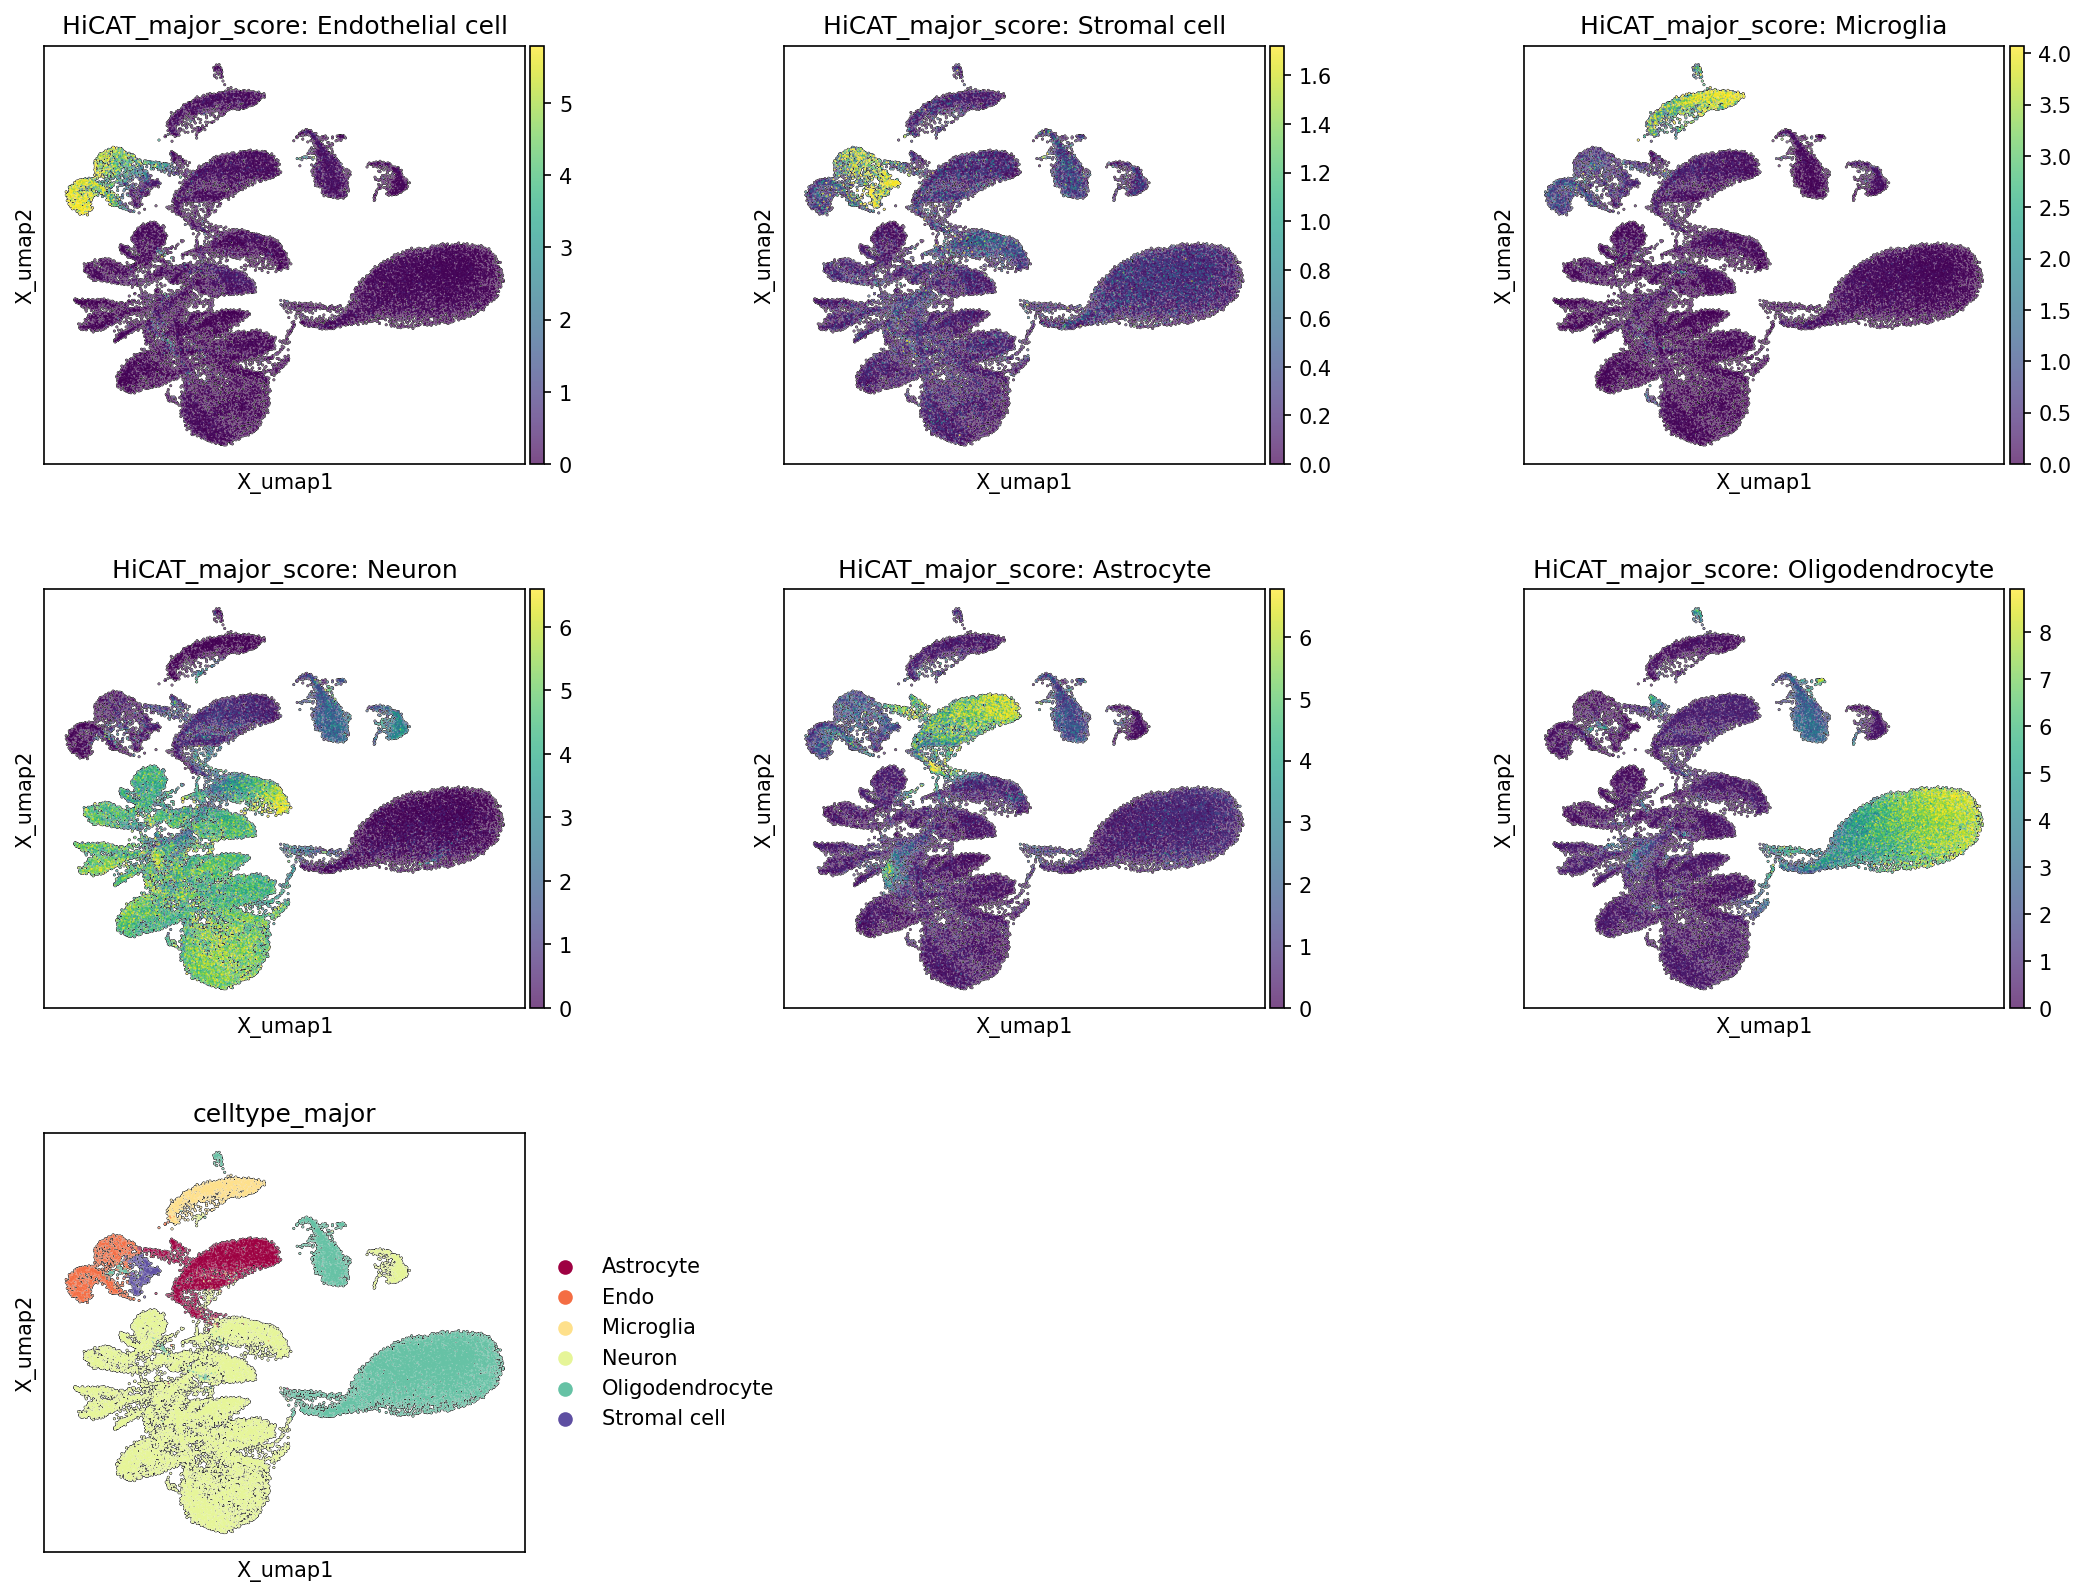
This analysis visualizes the distribution of major cell types within the single-cell RNA-seq dataset using a Uniform Manifold Approximation and Projection (UMAP) dimensionality reduction. Specifically, it displays the calculated "HiCAT_major_score" for each major cell type (Endothelial cell, Stromal cell, Microglia, Neuron, Astrocyte, Oligodendrocyte) across the UMAP embedding. These score maps are presented alongside a UMAP plot colored by the definitive celltype_major annotations, allowing for a direct comparison of score-based cell type identification with the pre-assigned cell type labels. This visualization serves to validate the cell type annotation quality and the overall structure of the cellular landscape.
Visual Summary
The UMAP embedding reveals several distinct cell clusters, indicative of diverse cell populations within the brain tissue.
- Concordance of Scores and Annotations: For each major cell type, the HiCAT_major_score plots show strong concordance with the celltype_major plot. Regions with high scores for a particular cell type (e.g., bright yellow/green areas) consistently align with the corresponding color-coded clusters in the celltype_major plot.
- Neuron: A large, prominent cluster on the left-central side of the UMAP shows the highest HiCAT_major_score: Neuron, perfectly matching the "Neuron" cluster.
- Oligodendrocyte: The large, elongated cluster on the right side of the UMAP exhibits a high HiCAT_major_score: Oligodendrocyte, corresponding to the "Oligodendrocyte" cluster.
- Astrocyte: A distinct cluster in the upper-left area of the UMAP displays a high HiCAT_major_score: Astrocyte, aligning with the "Astrocyte" cluster.
- Microglia: A separate cluster towards the top-middle shows elevated HiCAT_major_score: Microglia, consistent with the "Microglia" cluster.
- Endothelial cell & Stromal cell: Smaller, distinct clusters, primarily on the far left and upper-left, show high HiCAT_major_score for "Endothelial cell" and "Stromal cell" respectively, matching their assigned labels.
- Clear Cell Type Separation: The visualization clearly demonstrates that different major cell types form well-separated clusters on the UMAP, with minimal overlap in high-scoring regions for different cell types. This indicates robust clustering and effective separation of these broad cell populations.
Biological Interpretation
The strong agreement between the HiCAT_major_score heatmaps and the celltype_major categorical assignments confirms the high quality and specificity of the major cell type annotations in this single-cell RNA-seq dataset from human brain tissue.
- Robust Cell Type Identification: The distinct clustering and non-overlapping high-score regions for each major cell type indicate that these populations are transcriptionally well-defined and confidently assigned. This foundational step is critical for any downstream differential expression, pathway analysis, or cell-cell interaction studies, especially in complex tissues like the brain.
- Brain Cell Composition: The identified major cell types—Neurons, Oligodendrocytes, Astrocytes, Microglia, Endothelial cells, and Stromal cells—represent the primary cellular constituents of the brain. Their clear resolution in the UMAP provides a reliable basis for investigating their specific roles and alterations in the context of Alzheimer's disease, as inferred from the dataset.
- Relevance to Alzheimer's Disease: Neurons are the primary cells affected in Alzheimer's disease, while astrocytes and microglia play crucial roles in neuroinflammation and synaptic dysfunction. Oligodendrocytes are involved in myelin maintenance, which can be disrupted. Endothelial and stromal cells contribute to the neurovascular unit and overall brain environment. The confident identification and spatial mapping of these cell types on the UMAP is an essential prerequisite for exploring their condition-specific changes in E280A (familial AD), Sporadic AD, and Control conditions, as suggested by the dataset context.
Annotation Notes
The high congruence between the HiCAT_major_score heatmaps and the celltype_major annotations indicates a robust and reliable cell type assignment for the major populations. This suggests that the initial clustering and subsequent annotation steps were successful in capturing the distinct transcriptional profiles of these diverse cell types in the brain. The clear separation of clusters further supports the quality of the UMAP embedding and the biological distinctiveness of the identified cell populations. No significant ambiguities or mixed populations were evident at the major cell type level, providing a strong basis for further granular analysis.
3. Marker Expression Dot Plot for Cell Subtype Annotation Assessment
[Analysis Visualization Results]...
Analysis Overview
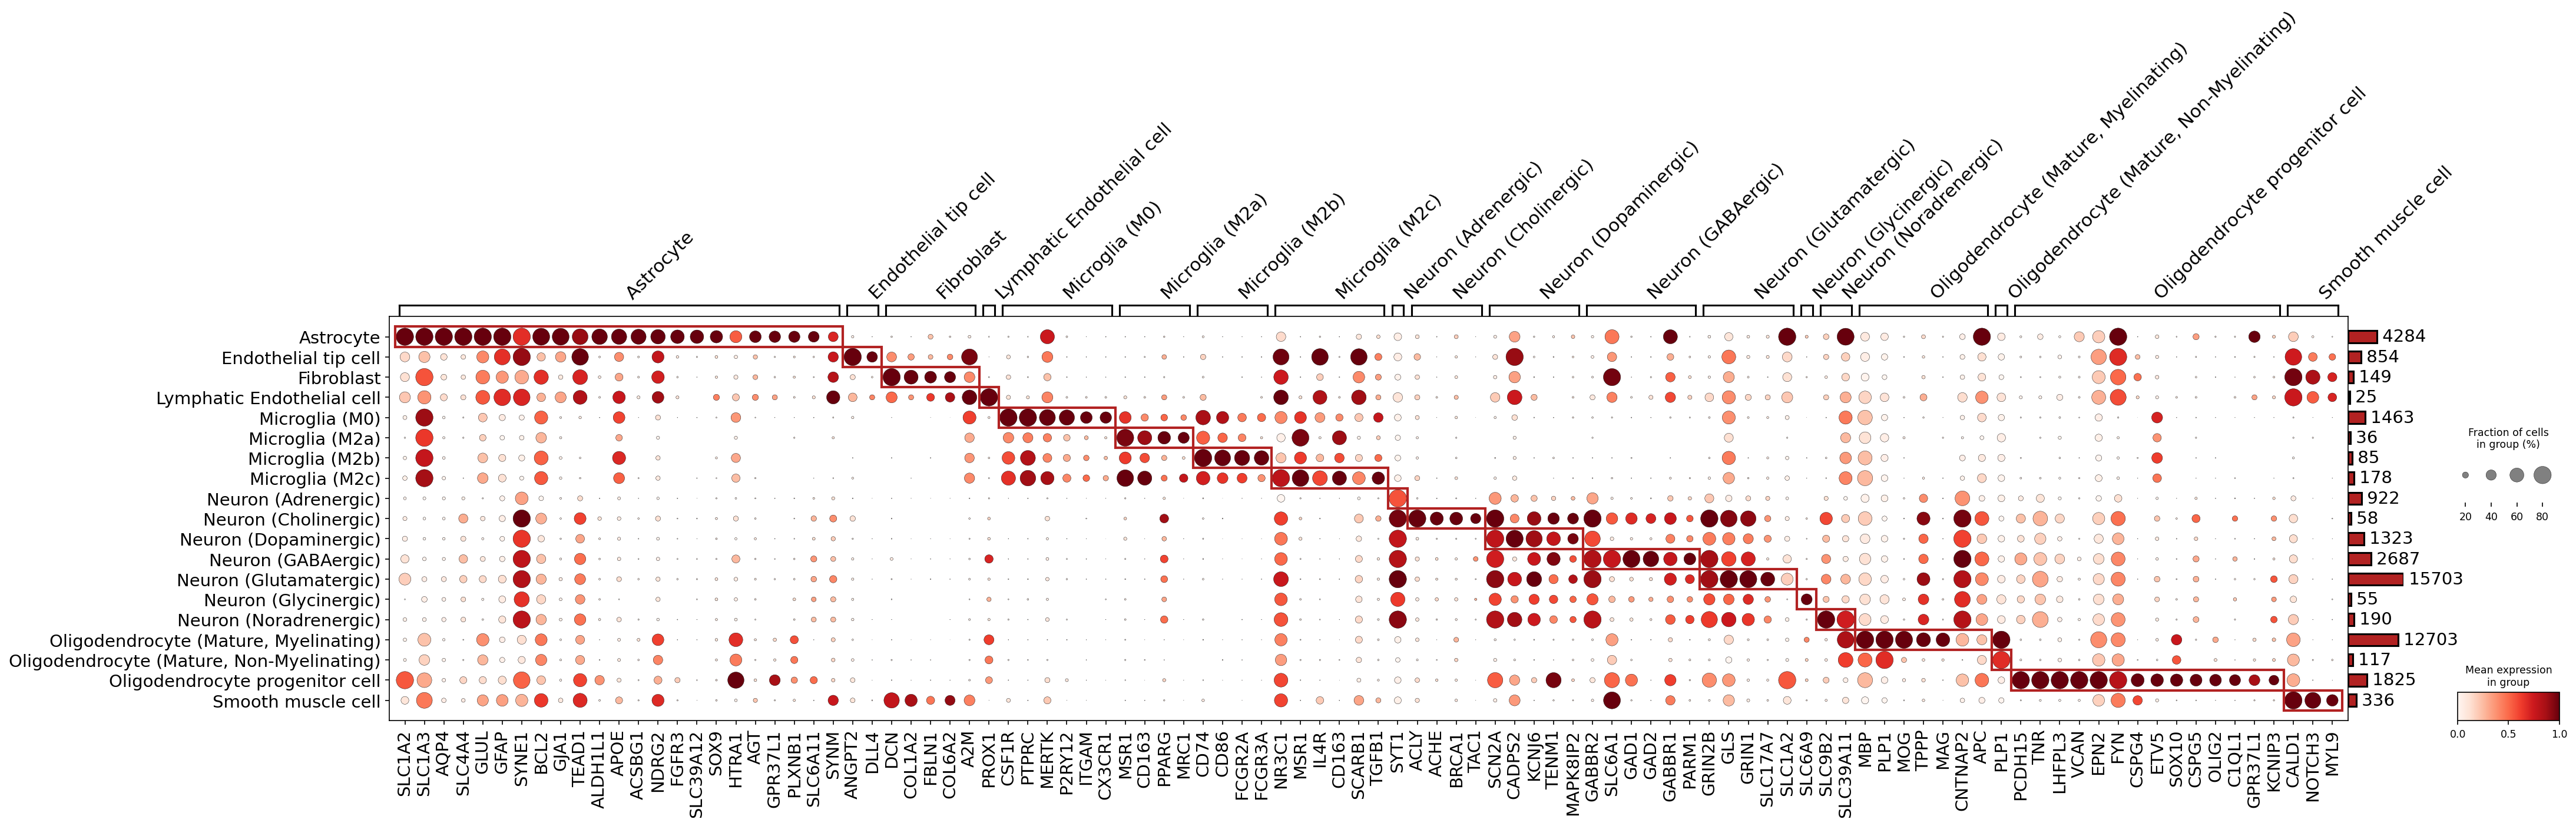
This dot plot visualizes the expression of automatically identified marker genes across different celltype_subset populations derived from the single-cell RNA-seq data. The primary objective of this analysis is to evaluate the distinctiveness and biological accuracy of these cell type annotations based on their gene expression profiles. In the plot, the size of each dot correlates with the fraction of cells within a given group that express a particular gene, while the color intensity (red scale) indicates the mean expression level of that gene within the group, normalized between 0 and 1. The markers were identified with a focus on surfaceome genes and specific statistical cutoffs as defined in the find_cfg parameters.
Visual Summary
The dot plot presents a matrix structure where rows represent various celltype_subset populations (e.g., Astrocyte, Microglia (M0), Neuron (Glutamatergic)), and columns correspond to individual marker genes. Overall, many cell type subsets exhibit distinct blocks of highly expressed and specific markers (characterized by large, dark red dots), generally reinforcing their assigned annotations. For example, Astrocytes, Microglia, and the Oligodendrocyte lineage show clear enrichment of expected marker genes. Similarly, GABAergic and Glutamatergic neuronal subtypes display characteristic expression patterns. However, several celltype_subset populations demonstrate unexpected or contradictory marker profiles. Notably, genes shown as markers for "Neuron (Dopaminergic)" are canonical GABAergic markers, and markers for "Neuron (Noradrenergic)" are clearly indicative of oligodendrocytes.
Biological Interpretation
The marker expression dot plot provides important insights into the quality and specificity of celltype_subset annotations across the human brain single-cell RNA-seq dataset.
Well-Supported Cell Type Annotations:
- Astrocytes are distinctly identified by canonical markers such as *GFAP*, *AQP4*, *ALDH1L1*, and several *SLC* family members (*SLC1A2*, *SLC1A3*). The strong and specific expression of these genes provides robust support for the Astrocyte annotation GeneCards: GFAP.
- Microglia subtypes (M0, M2a, M2b, M2c) consistently express established pan-microglial markers including *CSF1R*, *PTPRC* (CD45), *MERTK*, *P2RY12*, *ITGAM* (CD11b), and *CX3CR1*. Additionally, M2-associated markers such as *MSR1*, *CD163*, and *MRC1* (CD206) are highly expressed, supporting their identification. While these markers confirm microglial identity, they provide less sharp distinction between the specific M0 and M2 subtypes.
- GABAergic Neurons are clearly distinguished by the strong and specific expression of *GAD1* and *GAD2* (key enzymes in GABA synthesis) and *SLC6A1* (GAT1, a GABA transporter) GeneCards: GAD1.
- Glutamatergic Neurons are well-characterized by *SLC17A7* (VGLUT1, a vesicular glutamate transporter) and *GLS* (glutaminase), consistent with their excitatory function GeneCards: SLC17A7.
- Oligodendrocyte Progenitor Cells (OPCs) show specific expression of classic markers like *CSPG4* (NG2 proteoglycan), *SOX10*, and *OLIG2*, confirming their identity within the oligodendrocyte lineage.
- Mature Oligodendrocytes (both Myelinating and Non-Myelinating) are robustly marked by myelin-related genes including *MBP*, *MOG*, *PLP1*, *TPPP*, and *MAG*. While these genes confirm the presence of mature oligodendrocytes, the current marker set does not provide highly distinct separation between the "Myelinating" and "Non-Myelinating" sub-states.
- Smooth Muscle Cells exhibit specific expression of *CALD1*, *NOTCH3*, and *MYL9*, which aligns with their expected markers in brain tissue, likely representing vascular smooth muscle cells GeneCards: CALD1.
Cell Type Annotation Discrepancies and Areas for Review:
- Endothelial and Fibroblast Cell Overlap: The marker genes identified for "Endothelial tip cell" (e.g., *DCN*, *COL1A2*, *FBLN1*, *COL6A2*, *A2M*) show substantial expression in "Fibroblast" and "Smooth muscle cell" populations as well. While *PROX1* is specific to "Lymphatic Endothelial cell", the broader expression pattern of other markers suggests shared stromal/mesenchymal characteristics or potential challenges in definitively distinguishing these related cell types based solely on the selected markers.
- Missing Subtype: The "Microglia (M1)" celltype_subset is listed in the metadata but is not represented in the dot plot. This absence could be attributed to a cell count below the minimum threshold (N_cells_per_group_min=20) or the inability to identify sufficiently unique markers for this specific state under the applied filtering criteria.
Critical Misassigned Neuronal Markers
- Neuron (Dopaminergic): This cell subset displays high expression of *GAD1*, *GAD2*, and *SLC6A1*. These are canonical markers for GABAergic neurons, not dopaminergic neurons. This represents a significant misidentification or misannotation of the "Neuron (Dopaminergic)" population, as expected dopaminergic markers (e.g., *TH*, *SLC6A3/DAT*) are not observed as specific to this group.
- Neuron (Noradrenergic): This subset shows strong expression of *MBP*, *MOG*, *PLP1*, *TPPP*, *MAG*, *APC*, and *CNTNAP2*. These genes are definitive oligodendrocyte markers. This indicates a severe misannotation, as these cells are highly unlikely to be noradrenergic neurons. Canonical noradrenergic markers (e.g., *DBH*, *SLC6A2/NET*) are entirely absent in this population.
Annotation Notes
The marker expression analysis confirms the identity of many cell types and their subsets, validating a substantial portion of the cell type annotations. However, the presence of major discrepancies in marker assignment for "Neuron (Dopaminergic)" and "Neuron (Noradrenergic)" populations raises significant concerns regarding their accuracy. These specific neuronal subsets appear to be misannotated, exhibiting expression profiles characteristic of GABAergic neurons and oligodendrocytes, respectively. The observed overlap in markers among endothelial, fibroblast, and smooth muscle cells also warrants further scrutiny. These findings strongly recommend a comprehensive re-evaluation and potential correction of the annotations for these problematic cell type subsets to ensure the reliability and biological integrity of downstream analyses.
4. Minor Cell Type Population Analysis Across Alzheimer's Disease Conditions
[Analysis Visualization Results]...
Analysis Overview
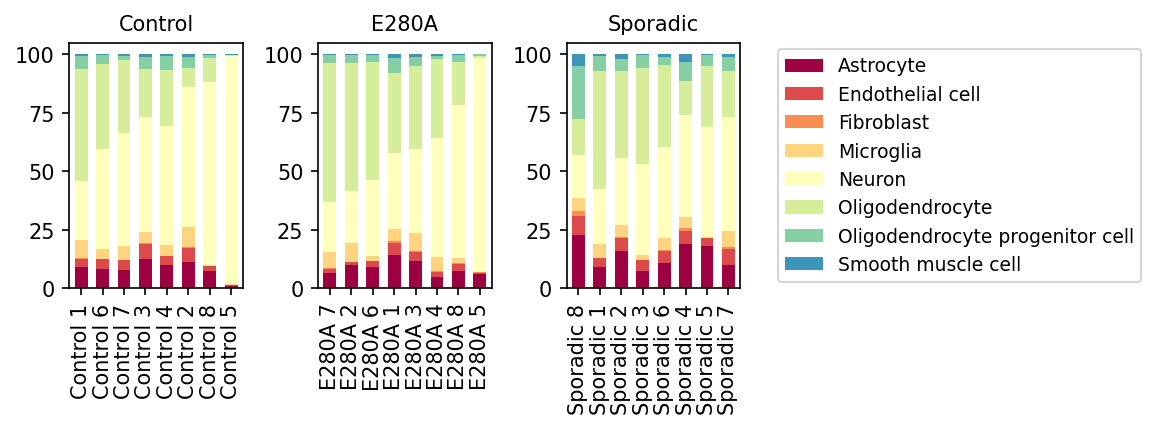
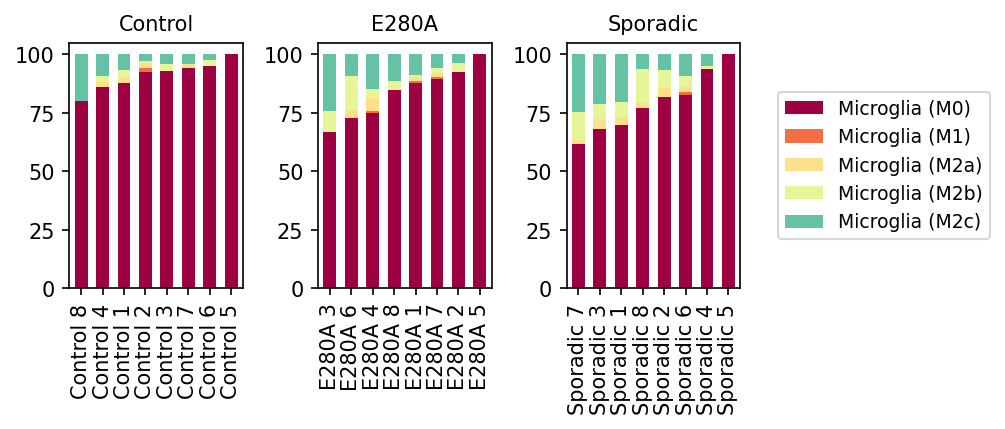
This visualization presents the relative proportions of minor cell types across individual samples for three distinct conditions: Control, E280A (a familial Alzheimer's disease mutation), and Sporadic (sporadic Alzheimer's disease). Each bar represents a single sample, and the colored segments within each bar denote the percentage contribution of different minor cell types to the total cell population within that sample. This analysis allows for a direct comparison of cellular composition changes associated with different forms of Alzheimer's disease.
Visual Summary
The bar plots reveal distinct patterns in cellular composition across the conditions:
- Dominant Cell Types: Across all conditions and samples, Neurons (light yellow) and Oligodendrocytes (light green) consistently represent the largest proportion of cells.
- Control Condition: Control samples generally show a high proportion of Neurons and Oligodendrocytes, with relatively small and stable contributions from Astrocytes (dark red), Microglia (light orange), Endothelial cells (red), and Oligodendrocyte progenitor cells (light green-blue). Fibroblasts (orange) and Smooth muscle cells (blue) are minor components.
- E280A Condition: Samples from the E280A condition maintain a similar overall profile to controls, with Neurons and Oligodendrocytes remaining dominant. However, there appears to be a *slight, albeit variable, increase* in the relative proportions of Astrocytes and Microglia in some E280A samples compared to controls, suggesting a subtle shift in glial cell populations.
- Sporadic Condition: The Sporadic Alzheimer's disease samples exhibit the most pronounced alterations in cell type proportions.
- Increased Glial Cells: A notable *increase* in the relative abundance of Astrocytes (dark red) and Microglia (light orange) is evident across multiple Sporadic samples. These cell types often constitute a larger fraction of the total cell population compared to both Control and E280A conditions.
- Relative Decrease in Neurons/Oligodendrocytes: Correspondingly, the relative proportion of Neurons and Oligodendrocytes appears to be *reduced* in some Sporadic samples, particularly those with higher glial cell representation.
- Sample Heterogeneity: There is considerable variability in cell type proportions among individual Sporadic samples, which might reflect different stages of disease progression or sub-phenotypes within sporadic Alzheimer's.
Biological Interpretation
The observed shifts in cell type populations are highly relevant to the inferred biological context of Alzheimer's disease:
- Neuroinflammation and Reactive Gliosis: The most striking finding is the relative enrichment of Astrocytes and Microglia, particularly in Sporadic Alzheimer's samples.
- Microglia: Microglia are the brain's resident immune cells, and their activation (often leading to a reactive state) is a hallmark of neuroinflammation in AD. An increased relative proportion could indicate proliferation or infiltration of these cells in response to amyloid plaques and neurofibrillary tangles PubMed search: microglia Alzheimer's disease neuroinflammation.
- Astrocytes: Astrocytes become reactive (gliosis) in AD, contributing to inflammation, synaptic dysfunction, and neuronal support changes. Their increased relative representation aligns with their known role in the pathological response to AD PubMed search: astrocyte Alzheimer's disease reactive gliosis.
- Neuronal Loss/Damage: The observed relative decrease in Neurons in Sporadic AD samples is consistent with neurodegeneration, a core feature of Alzheimer's disease characterized by significant neuronal loss and synaptic dysfunction. While this plot shows relative proportions, an increase in glial cells coupled with neuronal decline is a well-established pathological signature of AD.
- Oligodendrocyte Involvement: The relative decrease in Oligodendrocytes in Sporadic AD might suggest white matter pathology or demyelination, which can occur in AD and contribute to cognitive decline PubMed search: oligodendrocyte Alzheimer's disease demyelination.
- E280A vs. Sporadic Differences: The E280A condition, representing early-onset familial AD, shows more subtle changes compared to the Sporadic condition. This could suggest differences in disease progression, severity, or the specific pathogenic mechanisms dominant in these sample cohorts. Familial AD mutations like E280A (in PSEN1) often lead to early and aggressive amyloid pathology, while sporadic AD has broader pathological heterogeneity. The data might reflect a stage where neuroinflammation is more advanced or pronounced in the sporadic cases represented.
Clinical or Translational Implications
- Biomarker Potential: Changes in the relative proportions of glial cells (Astrocytes, Microglia) could serve as potential cellular biomarkers reflecting the neuroinflammatory status and neurodegenerative processes in Alzheimer's disease. Quantifying these shifts, particularly in Sporadic AD, might aid in disease staging or monitoring progression.
- Therapeutic Targets: The increased presence of reactive astrocytes and activated microglia highlights these cell types as crucial therapeutic targets for modulating neuroinflammation in AD. Interventions aimed at reducing detrimental glial activation or promoting beneficial glial functions could be impactful.
- Disease Heterogeneity: The observed sample-to-sample variability, especially within the Sporadic condition, underscores the heterogeneity of Alzheimer's disease. Understanding these cellular compositional differences across patients could inform personalized treatment strategies and refined diagnostic approaches.
5. Cell-Cell Interaction Analysis Across Alzheimer's Disease Conditions
[Analysis Visualization Results]...
Analysis Overview
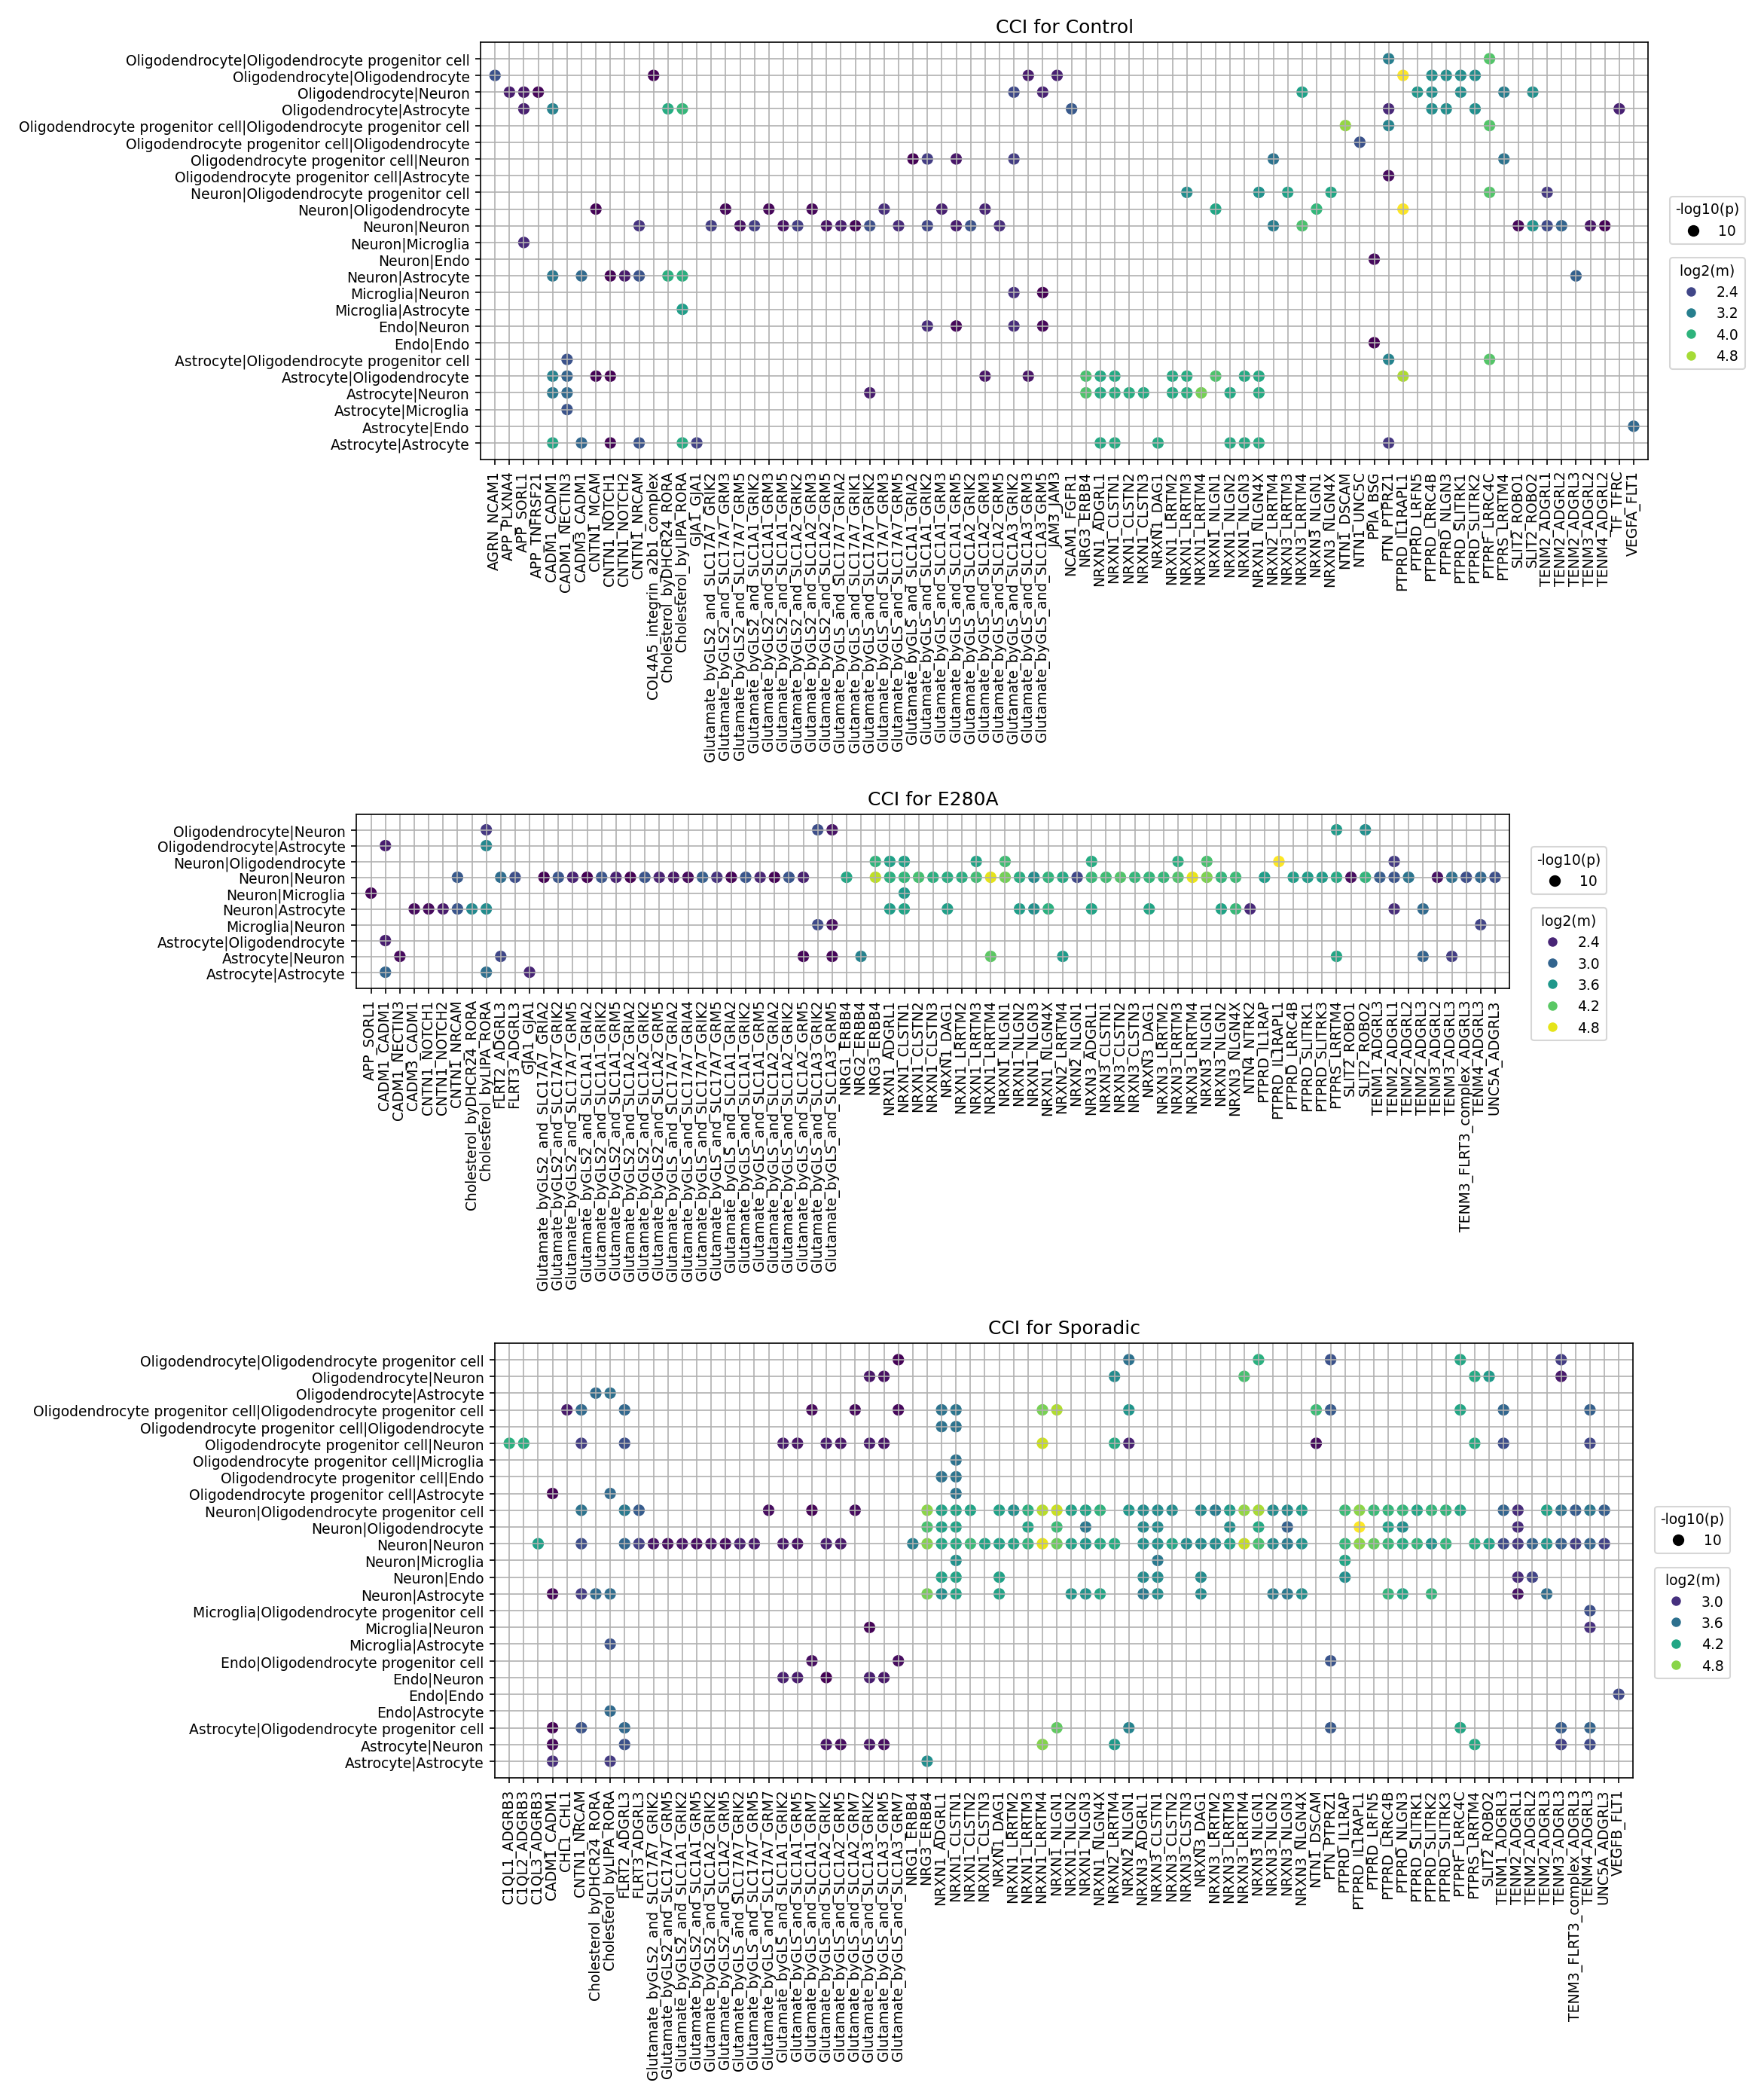
This analysis investigates cell-cell interaction (CCI) patterns using CellPhoneDB results derived from single-cell RNA sequencing data of human brain tissue across three conditions: Control, E280A (a familial Alzheimer's disease mutation), and Sporadic (sporadic Alzheimer's disease). The goal is to identify differences in ligand-receptor interactions between various brain cell types under healthy and diseased states, focusing on potential mechanisms underlying Alzheimer's pathology. The results are visualized as dot plots, where the size of the dot represents the negative log10 of the p-value, and the color intensity represents the log2 of the mean expression of the interacting ligand-receptor pair. A maximum of 80 significant interactions are shown per condition group.
Visual Summary
The three dot plots display the most significant cell-cell interaction patterns for Control, E280A, and Sporadic conditions. Each plot's Y-axis lists cell-cell pairs (e.g., "Neuron|Neuron", "Astrocyte|Neuron"), and the X-axis lists specific ligand-receptor gene pairs.
- Control Condition: Shows a rich and diverse interactome, particularly strong in synaptic adhesion molecules (e.g., NRXN-NLGN families, PTPRD-SLTRK/LARRP) and glutamatergic signaling (Glutamate_byGLS_and_SLC1A*-GRM*), predominantly involving neurons, oligodendrocytes, and astrocytes. Many strong interactions are observed within "Neuron|Neuron" and "Neuron|Oligodendrocyte" pairs. "Astrocyte|Astrocyte" shows interactions related to cholesterol metabolism (Cholesterol_byLAL_APOA1).
- E280A Condition: This familial AD condition exhibits notable alterations. While many NRXN-NLGN interactions remain prominent, some Glutamate_byGLS_and_SLC1A*_GRM* interactions, especially within "Neuron|Neuron" and "Astrocyte|Neuron," appear to have increased mean expression (brighter yellow/green dots) compared to Control, suggesting dysregulated glutamatergic activity. Interactions involving PTPRD and its ligands (SLTRK, LARRP) seem less pronounced or fewer in number compared to Control, hinting at synaptic remodeling. New or intensified interactions like CNTN1_NOTCH1 in "Oligodendrocyte|Neuron" are observed.
- Sporadic Condition: The sporadic AD condition largely shares patterns with E280A. Robust NRXN*-NLGN* and Glutamate_byGLS_and_SLC1A*_GRM* interactions are evident, often with high mean expression, particularly for "Neuron|Neuron" and "Astrocyte|Neuron". Similar to E280A, PTPRD_SLTRK/LARRP interactions appear to be attenuated compared to Control. The "Astrocyte|Astrocyte" cholesterol-related interaction (Cholesterol_byLAL_APOA1) seems less prominent than in Control or E280A, suggesting potential alterations in astrocytic lipid metabolism in sporadic AD.
Biological Interpretation
The observed changes in cell-cell interactions provide insights into the molecular mechanisms underlying Alzheimer's disease pathology in the brain.
- Dysregulated Glutamatergic Signaling: The consistently strong, and in some cases intensified (higher mean expression), Glutamate_byGLS_and_SLC1A*_GRM* interactions in both E280A and Sporadic conditions point towards a significant perturbation of glutamate homeostasis. Glutamate is the primary excitatory neurotransmitter, and its dysregulation, leading to excitotoxicity, is a well-established mechanism in AD pathogenesis (e.g., excessive activation of metabotropic glutamate receptors, GRMs, or altered transporter function, SLC1A/EAATs). The involvement of GLS (glutaminase), a key enzyme in glutamate synthesis, further underscores altered glutamate metabolism. These interactions primarily occur between neurons, and importantly, between astrocytes and neurons, highlighting the crucial role of astrocytes in modulating neuronal excitability and glutamate clearance PubMed search: "glutamate excitotoxicity Alzheimer's astrocytes".
- Synaptic Remodeling and Dysfunction:
- Neurexin-Neuroligin (NRXN-NLGN) Interactions: These cell adhesion molecules are critical for synapse formation, stabilization, and function GeneCards: NLGN1. Their continued strong presence in diseased conditions, sometimes with altered expression levels, suggests a complex synaptic remodeling rather than a simple loss. This could indicate a compensatory mechanism or a shift in synaptic composition and function in response to AD pathology.
- PTPRD and Ligands: The reduced prominence of interactions involving Receptor-type tyrosine-protein phosphatase delta (PTPRD) and its ligands (SLTRK/LARRP families) in AD conditions is noteworthy. PTPRD is involved in synapse organization and neuronal differentiation GeneCards: PTPRD. Its downregulation or altered interaction profile might contribute to the synaptic pathology and cognitive decline observed in AD.
- Astrocytic Dysfunction and Lipid Metabolism: The "Astrocyte|Astrocyte" interaction involving Cholesterol_byLAL_APOA1 shows decreased intensity in Sporadic AD compared to Control and E280A. Apolipoprotein A1 (APOA1) is involved in cholesterol transport, and dysregulation of cholesterol metabolism is a risk factor for AD. This finding suggests a potential impairment in astrocytic lipid handling or intercellular communication within the astrocyte network in sporadic AD, which could impact amyloid-beta clearance or neuroinflammation PubMed search: "astrocytes cholesterol metabolism Alzheimer's".
- Oligodendrocyte and Myelin Involvement: Interactions involving oligodendrocytes and oligodendrocyte progenitor cells (OPCs) with neurons, particularly NRXN-NLGN and CNTN1_NOTCH1, suggest altered neuron-glia communication that could affect myelin integrity or OPC differentiation, both increasingly recognized in AD PubMed search: "oligodendrocyte dysfunction Alzheimer's". The emergence of CNTN1_NOTCH1 (Contactin-1 and Notch1, involved in cell-cell adhesion and differentiation) in "Oligodendrocyte|Neuron" in E280A could signify altered developmental pathways or stress responses.
Clinical or Translational Implications
These findings highlight several potential avenues for therapeutic intervention and biomarker development in Alzheimer's disease:
- Targeting Glutamatergic Dysregulation: The consistently strong glutamatergic interactions in AD conditions suggest that modulating specific components of the Glutamate_byGLS_and_SLC1A*_GRM* axis, particularly between neurons and astrocytes, could be a therapeutic strategy. For example, specific GRM subtypes (e.g., GRM3, GRM5) could be targeted to reduce excitotoxicity, or enhancing the function of astrocytic glutamate transporters (SLC1A family) to improve glutamate clearance. This aligns with existing AD treatments like memantine, which targets NMDA receptors (another glutamate receptor type). Further investigation into the specific GRM subtypes and SLC1A transporters involved in these critical interactions is warranted.
- Restoring Synaptic Integrity: The changes in PTPRD-SLTRK/LARRP interactions suggest that compounds designed to restore or enhance these specific synaptic adhesion and signaling pathways could potentially mitigate synaptic dysfunction and cognitive deficits in AD. Similarly, understanding the precise remodeling of NRXN-NLGN interactions could reveal targets to stabilize or regenerate synapses.
- Astrocytic-Targeted Therapies: The observed alterations in astrocytic cholesterol metabolism via Cholesterol_byLAL_APOA1 interactions in sporadic AD point to astrocytes as potential therapeutic targets for lipid-modulating strategies. Enhancing astrocytic cholesterol efflux or targeting specific lipid transport proteins could be explored to impact AD progression, especially in sporadic forms of the disease.
- Biomarker Development: Specific patterns of dysregulated CCI, especially highly significant and condition-specific changes in ligand-receptor pairs, could serve as novel biomarkers for AD diagnosis, prognosis, or monitoring treatment response. For instance, the relative intensity of Glutamate_byGLS_and_SLC1A*_GRM* interactions or the reduction in PTPRD-mediated interactions could be investigated in biofluids or imaging studies.
Experimental Validation:
Further experimental validation could involve:
- In vitro co-culture models: Recreating specific cell-cell pairs (e.g., neuron-astrocyte, neuron-oligodendrocyte) and perturbing the identified ligand-receptor interactions (e.g., using neutralizing antibodies, receptor agonists/antagonists, or genetic knockdown/overexpression) to assess functional consequences such as neuronal excitability, synaptic plasticity, or glial activation.
- In vivo animal models of AD: Confirming these CCI changes in relevant AD mouse models using spatial transcriptomics or proteomic approaches, and then testing the therapeutic potential of targeting the identified ligand-receptor pairs on AD pathology and cognitive outcomes.
- Human post-mortem tissue analysis: Validating altered expression and localization of key ligand-receptor pairs in AD patient brains using immunohistochemistry or spatial proteomics.
6. Condition-Specific Cell-Cell Interaction Patterns in Alzheimer's Disease
[Analysis Visualization Results]...
Analysis Overview
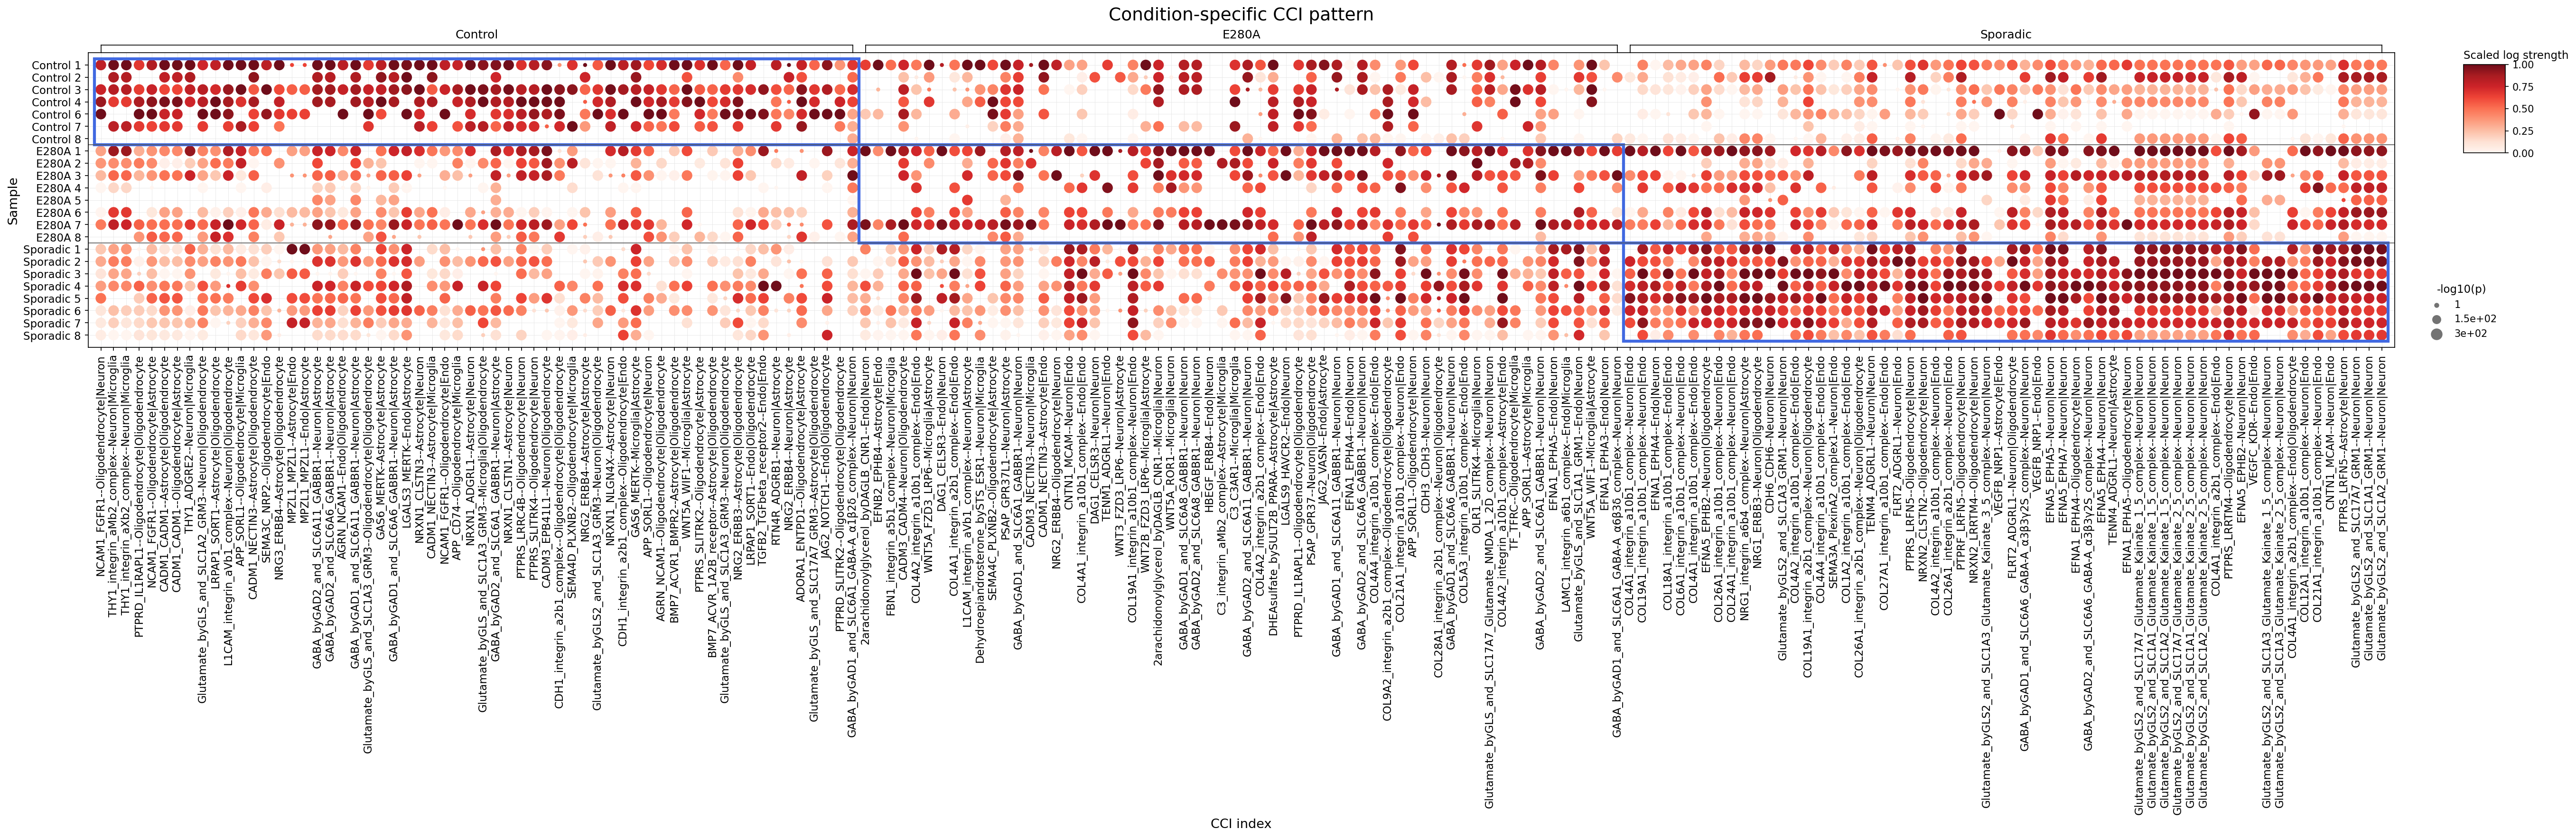
This analysis investigates condition-specific cell-cell interaction (CCI) patterns using single-cell RNA sequencing data from human brain tissue. The focus is on interactions among Microglia, Astrocytes, Endothelial cells, Fibroblasts, Oligodendrocytes, and Oligodendrocyte progenitor cells. The aim is to identify CCIs that differ significantly between Control, E280A (familial Alzheimer's disease), and Sporadic (sporadic Alzheimer's disease) conditions, shedding light on potential disease mechanisms and therapeutic targets. The dot plot visualizes the strength (color intensity) and significance (dot size) of these interactions across individual samples for each condition.
Visual Summary
The dot plot reveals distinct and condition-specific patterns of cell-cell interactions:
- Control Condition: Samples show a robust baseline of interactions, particularly strong among Oligodendrocyte progenitor cells and Oligodendrocytes (e.g., NRXN3_NLGN1, NCAM1_FGFR1, CADM1-Oligodendrocyte interactions). There is also notable activity in interactions involving Endothelial cells and various Integrin-mediated interactions (e.g., COL4A2_integrin_a2b1_complex), suggesting normal homeostatic and myelination processes.
- E280A Condition (Familial Alzheimer's Disease): In contrast to Control, many of the interactions, especially those involving Oligodendrocyte progenitor cells and Oligodendrocytes, appear generally attenuated (lighter red, smaller dots). This suggests a widespread reduction in the strength and significance of many CCIs, potentially indicating a general cellular dysfunction or impaired maintenance and repair mechanisms in this familial form of AD.
- Sporadic Condition (Sporadic Alzheimer's Disease): This condition displays a markedly different and often heightened pattern of CCIs compared to both Control and E280A. A large cluster of interactions, particularly those involving Endothelial cells (Endo--Endo, Endo--Astrocyte, Endo--Microglia), and various Collagen-Integrin complexes, show significantly increased strength and significance (darker red, larger dots). Interactions related to microglial activation (e.g., Microglia--Microglia, Microglia--Astrocyte) are also visibly enhanced. This pattern is indicative of pronounced neuroinflammation, vascular pathology, and extracellular matrix remodeling.
Biological Interpretation
The differential CCI patterns highlight key pathological processes in Alzheimer's disease:
- Impaired Oligodendrocyte Function and Myelination in Familial AD (E280A):
- The consistent reduction in interactions like PDGFA-PDGFRA, BMP7-BMPR1A, and NCAM1-FGFR1 in E280A samples suggests impaired oligodendrocyte progenitor cell (OPC) proliferation, differentiation, and overall oligodendrocyte maturation or repair. PDGF-A/PDGFRA signaling is crucial for OPC development and myelination 1. BMP7 also plays a role in oligodendrocyte differentiation. This finding points towards potential demyelination or insufficient myelin repair as an early feature in familial AD, contributing to white matter pathology.
- Pronounced Neuroinflammation and Microglial Dysregulation in Sporadic AD:
- Elevated interactions involving Microglia, such as SPP1-CD44 (Microglia-Microglia/Astrocyte) and TREM2-TYROBP/APOE (Microglia-Microglia/Astrocyte), are prominent in Sporadic AD. SPP1 (Osteopontin) is an inflammatory cytokine involved in various neurodegenerative diseases, and its interaction with CD44 can promote microglial activation and reactive gliosis 2. TREM2 and its adaptor TYROBP are central to microglial function in AD, influencing amyloid plaque clearance, inflammation, and survival 3. APOE is a major genetic risk factor for AD and interacts with TREM2, further regulating microglial responses 4. These findings suggest a strong inflammatory and dysregulated microglial response in sporadic AD.
- Extensive Cerebrovascular Pathology and ECM Remodeling in Sporadic AD:
- A striking feature in Sporadic AD is the widespread increase in Endothelial cell-mediated interactions. This includes numerous Endothelial-Endothelial interactions (e.g., NRP1, VEGFA-KDR, NOTCH family members, EFNB2-EPHB1), as well as interactions between Endothelial cells and Astrocytes/Microglia.
- VEGFA-KDR (VEGFR2) signaling is a key pathway for angiogenesis, and its dysregulation is implicated in AD-related cerebrovascular changes and blood-brain barrier (BBB) breakdown 5.
- NOTCH signaling is critical for vascular development and integrity, and its alterations are linked to vascular pathology in AD 6.
- NRP1 (Neuropilin-1) is involved in angiogenesis, neuronal guidance, and immune regulation.
- The significant increase in various Collagen-Integrin interactions (e.g., COL4A1_integrin_a10b1, COL4A2_integrin_a2b1) indicates extensive extracellular matrix (ECM) remodeling. Collagens are major components of the vascular basement membrane, and altered integrin signaling can contribute to BBB dysfunction, neuroinflammation, and glial scar formation 7.
Clinical or Translational Implications
The identified differential cell-cell interactions offer promising avenues for therapeutic intervention in Alzheimer's disease:
- Targeting Neuroinflammation in Sporadic AD:
- The upregulation of TREM2-TYROBP/APOE and SPP1-CD44 pathways in Microglia highlights them as potential therapeutic targets. Modulators of TREM2 activity (e.g., agonists to enhance beneficial microglial functions like phagocytosis, or antagonists to curb detrimental inflammation) are actively being investigated for AD 8. Inhibitors targeting SPP1 or CD44 could mitigate harmful inflammatory responses and ECM remodeling driven by activated microglia and astrocytes.
- Restoring Cerebrovascular Integrity and Function in Sporadic AD:
- The pervasive increase in Endothelial cell interactions, including VEGFA-KDR, NOTCH, and various Collagen-Integrin pathways, suggests that targeting cerebrovascular dysfunction is critical. Strategies to stabilize the blood-brain barrier (BBB), modulate pathological angiogenesis, or reduce ECM stiffening could be beneficial. For example, specific inhibitors of aberrant VEGF signaling or modulators of Notch signaling in the vasculature could be explored. Agents that modulate integrin-ECM interactions might help reduce vascular permeability and glial scarring.
- Promoting Myelination and Oligodendrocyte Health in Familial AD (E280A):
- The observed reduction in OPC-Oligodendrocyte interactions points to a need for therapies that support myelination and oligodendrocyte function. Growth factors like PDGF-A or small molecules that promote OPC proliferation and differentiation could be explored to counteract myelin loss or support remyelination efforts in early-onset familial AD 9.
These findings underscore the diverse molecular mechanisms underlying familial versus sporadic forms of Alzheimer's disease, suggesting the need for tailored therapeutic approaches.
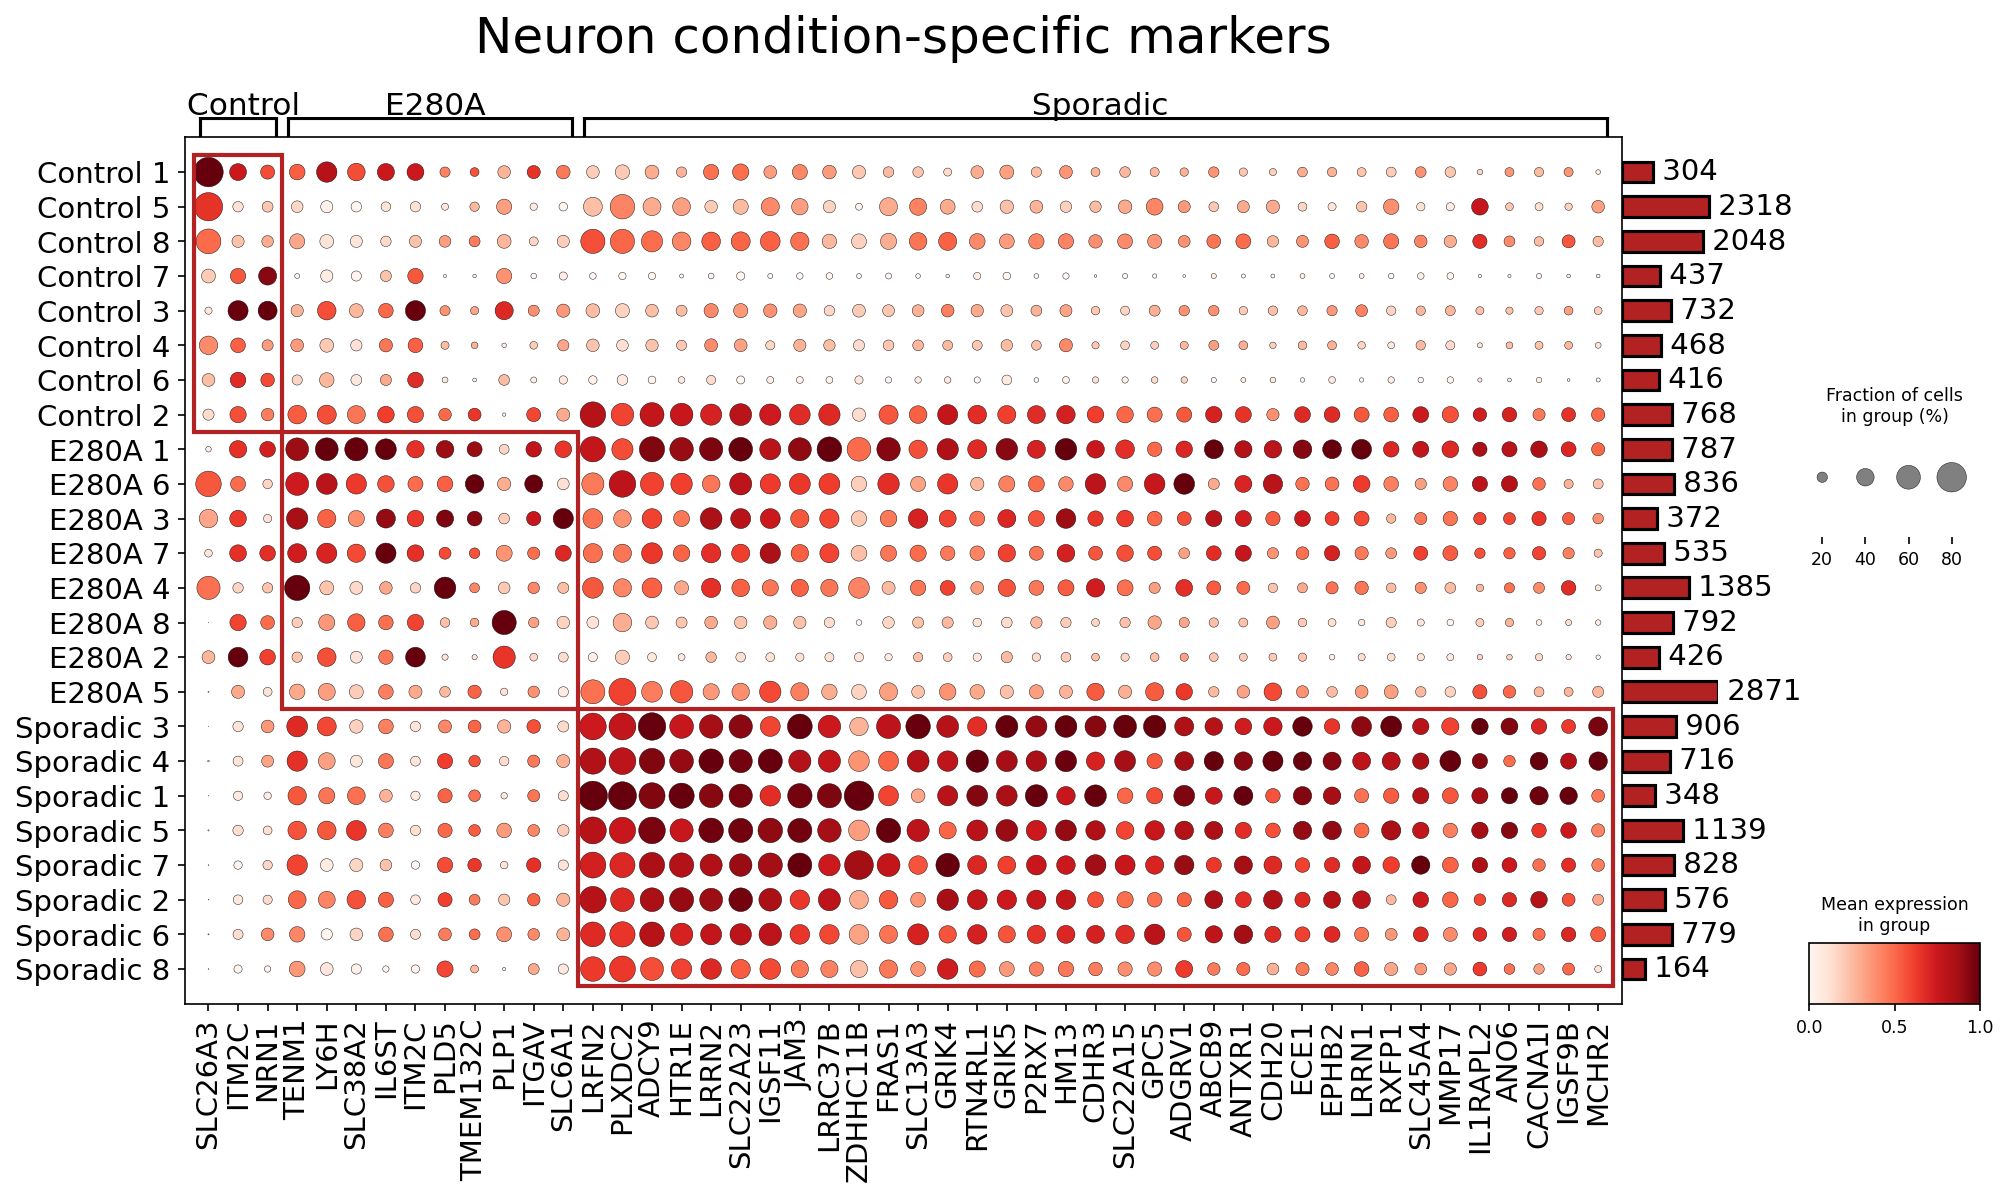
7. Neuron Surfaceome Marker Expression Across Alzheimer's Disease Conditions
[Analysis Visualization Results]...
Analysis Overview
This analysis presents a dot plot illustrating the expression of surfaceome-specific genes in neurons across different conditions related to Alzheimer's disease (Control, E280A, and Sporadic) and individual patient samples. Each dot represents a gene-sample combination, with the size of the dot indicating the fraction of cells within that sample group expressing the gene (non-zero expression), and the color intensity reflecting the mean expression level of the gene in that group. The plot focuses on surfaceome markers, which are particularly relevant for cell-cell communication, interaction with the extracellular matrix, and therapeutic targeting due to their accessibility. The data is derived from single-cell RNA-seq of human brain tissue.
Visual Summary
The dot plot reveals distinct patterns of surfaceome marker expression in neurons, broadly categorized by the Control, E280A (familial AD), and Sporadic (sporadic AD) conditions.
- Control-Specific Expression (Left Red Box): A cluster of markers, including SLC26A3, ITM2C, NRN1, SLC38A2, and LY6H, shows higher expression in Control samples compared to both E280A and Sporadic conditions. These genes are generally expressed in a high fraction of cells and with moderate to high intensity in controls, suggesting their role in healthy neuronal function.
- E280A-Specific Expression (Middle Red Box): Neurons from E280A patients exhibit elevated expression of markers such as PLXDC2, ADCY9, HTR1E, and LRRN2. While some of these (e.g., ADCY9, HTR1E, LRRN2) also show some expression in Sporadic and occasionally in Control, their consistent and often higher expression across E280A samples is notable. ITM2C also appears upregulated in E280A compared to Control.
- Sporadic-Specific Expression (Right Red Box): A prominent cluster of genes, including SPP1, ITGAV, LRRN2, SLC22A23, IGSF11, JAM3, LRRC37B, ZDHHC11B, FRAS1, SLC13A3, GRIK4, RTN4RL1, GRIK5, P2RX7, HM13, CDHR3, SLC22A15, GPC5, ADGRV1, ANTXR1, CDH20, ECE1, EPHB2, LRRN1, RXFP1, MMP17, IL1RAPL2, CACNA1I, IGSF9B, and MCHR2, demonstrates strong and widespread upregulation across Sporadic AD samples. Many of these markers show very low or absent expression in Control samples, indicating their association with the sporadic disease state. Some markers, such as LRRN2, are also elevated in E280A samples, suggesting potential shared pathogenic mechanisms between familial and sporadic forms of AD.
- Shared Markers: A few markers, like ITM2C, are highly expressed in Control and E280A conditions, potentially indicating a role in general neuronal processes or specific neuronal subsets that are preserved or altered differently in E280A compared to Sporadic AD. ADCY9 and HTR1E show some elevation in both E280A and Sporadic.
- Heterogeneity within Conditions: Even within the same condition, there is some sample-to-sample variability in the expression levels and fractions of expressing cells, which likely reflects individual patient differences, disease stage, or specific regional neuronal populations.
Biological Interpretation
The differential expression of these surfaceome markers in neurons provides insights into the cellular changes occurring in Alzheimer's disease.
Markers Associated with Healthy Neuronal Function (High in Control):
- ITM2C (Integral Membrane Protein 2C): While higher in Controls, its altered expression can be critical. ITM2C has been implicated in the regulation of amyloid precursor protein (APP) processing and amyloid-beta (Aβ) production, playing a role in AD pathogenesis GeneCards: ITM2C. Its relative maintenance in Controls and E280A, but lower expression or altered regulation in Sporadic, could suggest differential mechanisms of Aβ pathology or neuronal resilience.
- NRN1 (Neuronatin): NRN1 is involved in neuronal differentiation, migration, and survival, playing a role in synaptic plasticity and memory formation GeneCards: NRN1. Its higher expression in healthy neurons suggests its importance for maintaining neuronal integrity. Its downregulation in AD could contribute to synaptic dysfunction and neurodegeneration.
Markers Associated with E280A (Familial AD) Pathophysiology:
- ADCY9 (Adenylyl Cyclase 9): ADCY9 is an enzyme involved in cyclic AMP (cAMP) signaling, a crucial pathway for neuronal plasticity, learning, and memory. Dysregulation of cAMP signaling is implicated in AD, affecting synaptic function and neuronal survival GeneCards: ADCY9. Its upregulation may represent an attempt to compensate for neuronal dysfunction or contribute to altered signaling.
- HTR1E (5-hydroxytryptamine receptor 1E): This serotonin receptor modulates neurotransmission. Serotonergic system dysfunction, including changes in receptor expression, is a known feature of AD, impacting mood, cognition, and sleep PubMed: Serotonin and AD. Elevated expression could indicate altered serotonergic tone or compensatory mechanisms in E280A neurons.
Markers Associated with Sporadic AD Pathophysiology (High in Sporadic):
- SPP1 (Secreted Phosphoprotein 1, Osteopontin): SPP1 is an extracellular matrix protein involved in cell adhesion, migration, and inflammation. While often associated with reactive astrocytes and microglia in AD, its neuronal upregulation here suggests direct neuronal involvement in inflammatory or stress responses, or altered neuron-glia interactions GeneCards: SPP1.
- ITGAV (Integrin Subunit Alpha V): ITGAV forms heterodimeric integrin receptors that mediate cell-extracellular matrix adhesion and signaling. Integrins are involved in synaptic plasticity, neuronal survival, and also in neuroinflammation and amyloid-beta clearance mechanisms PubMed: Integrins in AD. Its increased expression could point to altered neuronal connectivity or an attempt to repair damaged synapses.
- EPHB2 (Ephrin Receptor B2): EPHB2 is a receptor tyrosine kinase crucial for synaptic plasticity, dendritic spine morphology, and NMDA receptor function. Its downregulation or dysfunction is linked to Aβ toxicity and impaired cognition in AD, so its upregulation in sporadic AD could be a complex response, possibly contributing to or compensating for synaptic disruption GeneCards: EPHB2.
- CACNA1I (Calcium Voltage-Gated Channel Subunit Alpha1 I): This gene encodes a T-type calcium channel. Calcium dysregulation is a central mechanism in AD pathogenesis, affecting neuronal excitability, synaptic transmission, and leading to excitotoxicity PubMed: Calcium dysregulation AD. Elevated CACNA1I expression could contribute to altered calcium homeostasis and neuronal hyperexcitability or dysfunction in sporadic AD.
- RTN4RL1 (Nogo Receptor 1-related protein 1): RTN4RL1 is part of a complex that inhibits axonal regeneration and neurite outgrowth. Modulation of this pathway is being explored for neuroregenerative strategies. Its upregulation could contribute to reduced neuronal plasticity and repair in sporadic AD.
Clinical or Translational Implications
The identified surfaceome markers offer promising avenues for therapeutic intervention and biomarker development in Alzheimer's disease.
Therapeutic Targets:
- ITM2C: Given its role in APP processing, modulating ITM2C activity could potentially influence Aβ production. Further investigation into its specific function in different AD contexts could reveal strategies to reduce pathogenic Aβ or enhance non-amyloidogenic processing.
- ADCY9/HTR1E: Targeting the cAMP signaling pathway via ADCY9 or modulating serotonergic transmission through HTR1E could represent strategies to improve synaptic function, cognitive symptoms, and mood disturbances associated with AD. Agents that selectively activate or inhibit these receptors could be explored.
- SPP1/ITGAV: As SPP1 and ITGAV are involved in inflammation and cell adhesion, interventions aimed at blocking excessive inflammatory signaling or optimizing integrin-mediated repair mechanisms could be beneficial. This might involve small molecule inhibitors or blocking antibodies targeting specific integrin heterodimers.
- EPHB2: Restoring or enhancing EPHB2 function could be a strategy to improve synaptic integrity and combat Aβ-induced synaptic dysfunction. Small molecules or antibodies that stabilize or activate EPHB2 are under investigation for AD PubMed: EPHB2 therapeutics AD.
- CACNA1I: Given the pervasive calcium dysregulation in AD, targeting specific calcium channels like CACNA1I could help restore neuronal calcium homeostasis and reduce excitotoxicity, potentially slowing neurodegeneration.
- RTN4RL1: Modulating the Nogo receptor pathway, perhaps by blocking RTN4RL1, could promote neuronal plasticity and repair processes, offering a regenerative approach to AD therapy.
- Biomarkers: The distinct expression profiles of these surfaceome markers across Control, E280A, and Sporadic conditions suggest their potential as diagnostic or prognostic biomarkers, particularly if they can be detected in biofluids or through advanced imaging techniques. Markers showing high specificity for Sporadic AD, such as SPP1, ITGAV, and CACNA1I, could help differentiate disease subtypes or stages.
Further research involving functional validation of these surfaceome markers in neuronal models of AD, as well as their expression patterns in post-mortem human brain tissue and biofluids, would be crucial to confirm their utility as therapeutic targets or biomarkers.
8. Gene Ontology (GSA) Analysis of Neurons Across Alzheimer's Disease Conditions
[Analysis Visualization Results]...
Analysis Overview
This analysis presents Gene Ontology (GSA) results for Neuron cell types from human brain single-cell RNA-seq data. The goal is to identify biological pathways and processes that are significantly enriched (indicating upregulation or increased prominence) in neurons from specific conditions compared to the rest of the dataset. Separate analyses were performed for 'Control', 'E280A' (familial Alzheimer's disease mutation), and 'Sporadic' (sporadic Alzheimer's disease) conditions, each compared against the aggregate of the other conditions present in the dataset. The results are visualized as bar plots, displaying the top enriched terms ranked by their statistical significance (-log(p-val) and -log(q-val)).
Visual Summary
The bar plots display the most significantly enriched Gene Ontology (GO) terms in Neurons for each condition. The length of the bars represents the -log(p-val), and the right panel shows the -log(q-val) (adjusted p-value), both indicating statistical significance.
- Control_vs_others: This plot shows a strong enrichment for terms predominantly associated with neurodegenerative diseases, including "Parkinson disease," "Pathways of neurodegeneration," "Alzheimer disease," and "Huntington disease," with very high -log(p-val) scores (exceeding 30). Alongside these, fundamental cellular processes like "Ribosome," "Oxidative phosphorylation," "Endocytosis," and "Synaptic vesicle cycle" are also highly enriched.
- E280A_vs_others: Similar to the Control group, neurons from the E280A condition also exhibit pronounced enrichment for "Parkinson disease," "Pathways of neurodegeneration," "Alzheimer disease," and "Huntington disease," again with very high -log(p-val) scores (approaching 20). Other highly enriched terms include "Ribosome," "Spliceosome," "Oxidative phosphorylation," "Protein processing in endoplasmic reticulum," and "Ubiquitin mediated proteolysis," indicating active protein synthesis, modification, and degradation pathways. "Thermogenesis" is also notably enriched.
- Sporadic_vs_others: In contrast to the other two conditions, the Sporadic condition shows a distinctly different set of enriched pathways and generally lower -log(p-val) scores (maximum around 6). Top terms include "Axon guidance," "Ubiquitin mediated proteolysis," "Glutamatergic synapse," "Adherens junction," "ErbB signaling pathway," and "Inositol phosphate metabolism." Terms related to synaptic structure and function, cell adhesion, and specific signaling cascades are more prominent here.
Overall, the magnitude of enrichment (as indicated by -log(p-val) and -log(q-val)) is considerably higher for Control and E280A conditions compared to Sporadic AD, suggesting more distinct or pervasive pathway changes in the former two groups relative to the aggregated "others" group.
Biological Interpretation
The GSA results for Neurons reveal both shared and distinct biological processes characterizing different Alzheimer's disease (AD) conditions when compared to other groups. The term GSA_up generally implies that the genes associated with these pathways are upregulated or more prominently active in the target condition.
Shared Neurodegenerative Signatures in Control and E280A Neurons:
- The prominent enrichment of pathways such as "Parkinson disease," "Pathways of neurodegeneration," "Alzheimer disease," and "Huntington disease" in both 'Control_vs_others' and 'E280A_vs_others' is a notable finding. While the enrichment in E280A (a genetic form of AD) is expected, its high significance in 'Control' neurons warrants careful interpretation.
- One possibility is that the gene sets defining these broad neurodegenerative pathways encompass not only detrimental processes but also compensatory mechanisms or baseline activities that become more pronounced or are maintained at a higher level in 'Control' neurons compared to the potentially deeply dysregulated or failing states in the aggregated 'others' group (which includes severe AD).
- Alternatively, some 'Control' individuals might exhibit early, subclinical AD pathology or age-related neuronal vulnerabilities, as indicated by the presence of pathological scores (NIA.A.A.SCORE, BRAAK, CERAD, etc.) in the dataset metadata. The enrichment could reflect these initial changes distinguishing them from other stages.
- The consistent enrichment of core cellular functions like "Ribosome," "Oxidative phosphorylation," and "Protein processing" in both Control and E280A neurons (compared to others) suggests sustained, or even heightened, protein synthesis, energy metabolism, and protein quality control processes in these groups, which might distinguish them from the 'others' group where these functions might be impaired or altered in a different manner. The E280A mutation is known to impact protein processing, and its enrichment here could reflect the cells' response to protein misfolding stress. GeneCards: PSEN1
Distinct Neuronal Pathology in Sporadic AD:
- Neurons in 'Sporadic_vs_others' display a unique set of enriched pathways, focusing more on "Axon guidance," "Glutamatergic synapse," "Adherens junction," and various signaling pathways (e.g., "ErbB signaling pathway," "MAPK signaling pathway"). This suggests that Sporadic AD might involve more pronounced alterations in synaptic structure, function, and intercellular communication within neurons, distinguishing it from the combined Control and E280A groups.
- The lower overall significance (-log(p-val) values) for Sporadic AD compared to Control and E280A might indicate a more heterogeneous or less globally pervasive set of pathway changes, or perhaps different stages of pathology were captured.
- The enrichment of "Ubiquitin mediated proteolysis" across all conditions, though with varying emphasis, underscores the critical role of protein degradation in neuronal homeostasis and neurodegeneration.
Clinical or Translational Implications
The distinct and shared pathway enrichments in neurons across different AD conditions offer valuable insights for clinical and translational research:
- Understanding Early AD and Familial Forms: The strong and overlapping neurodegenerative signatures in 'Control' and 'E280A' neurons could highlight common early events or shared vulnerability pathways. Identifying specific genes within these enriched pathways that are driving the "Control" signature could lead to discovery of early biomarkers or targets for prevention. For E280A, these pathways reaffirm the known molecular underpinnings of familial AD, pointing to protein processing and energy metabolism as key areas for therapeutic intervention PubMed: Familial Alzheimer's Disease.
- Targeting Sporadic AD Mechanisms: The distinct enrichment of synaptic and structural pathways like "Axon guidance," "Glutamatergic synapse," and "Adherens junction" in Sporadic AD neurons suggests that interventions aimed at preserving synaptic integrity, supporting neuronal architecture, or modulating specific signaling pathways (e.g., ErbB, MAPK) might be particularly relevant for this patient population. PubMed: Synaptic dysfunction Alzheimer's disease.
- Investigating Disease Heterogeneity: The marked differences in enrichment patterns and significance levels between Sporadic AD and the other conditions emphasize the molecular heterogeneity of AD. This suggests that a one-size-fits-all approach to AD therapy might be insufficient, and personalized strategies targeting condition-specific neuronal dysfunctions could be more effective.
- Protein Homeostasis and Mitochondrial Function: The consistent appearance of "Ubiquitin mediated proteolysis," "Ribosome," "Spliceosome," and "Oxidative phosphorylation" pathways across conditions highlights the central role of protein homeostasis and mitochondrial function in neuronal health and AD pathology, making them universal therapeutic targets.
9. Gene Set Enrichment Analysis Across Brain Cell Types in Alzheimer's Disease
[Analysis Visualization Results]...
Analysis Overview
This analysis presents Gene Set Enrichment Analysis (GSEA) results visualized as a dot plot. The GSEA compares gene expression profiles for each celltype_minor within three conditions (Control, E280A, and Sporadic Alzheimer's Disease) against the remaining conditions in the dataset ('others'). The plot highlights enriched or depleted biological pathways across different cell types and disease states, providing insights into condition-specific and cell-type-specific molecular alterations. The dot size corresponds to the statistical significance (-log(p-value)), and the color indicates the Normalized Enrichment Score (NES), where red signifies positive enrichment (upregulation) and blue signifies negative enrichment (downregulation).
Visual Summary
The GSEA dot plot reveals distinct patterns of pathway dysregulation across various brain cell types in Alzheimer's disease (AD) conditions (E280A and Sporadic) compared to other conditions, including control.
- Disease-Specific Pathway Enrichment: Pathways directly related to Alzheimer's disease and neurodegeneration ("Alzheimer disease", "Pathways of neurodegeneration") show consistent and strong positive enrichment (large red dots) in neurons, microglia, oligodendrocytes, and oligodendrocyte progenitor cells in both E280A and Sporadic conditions. Conversely, these pathways are negatively enriched (blue dots) in Control neurons and oligodendrocytes when compared to the other conditions.
- Inflammation and Immune Response: Inflammatory pathways such as "NF-kappa B signaling pathway" and "Chemokine signaling pathway" are notably positively enriched in microglia across both E280A and Sporadic AD. Endothelial cells also show enrichment in "Chemokine signaling pathway" in AD conditions. "Antigen processing and presentation" is also upregulated in microglia in disease states.
Metabolic Dysregulation:
- "Oxidative phosphorylation" shows a complex pattern, with negative enrichment (blue) in Neurons (E280A, Sporadic), suggesting mitochondrial dysfunction. However, it shows positive enrichment in Astrocytes (Sporadic).
- "AMPK signaling pathway" generally shows negative enrichment (blue) in several cell types (Astrocytes, Neurons, Oligodendrocytes) in disease conditions, indicating potential impairment in energy sensing and regulation.
- "Cholesterol metabolism" is positively enriched in microglia and astrocytes in both E280A and Sporadic conditions.
- Synaptic and Neuronal Function: Pathways related to synaptic activity, such as "Glutamatergic synapse" and "Cholinergic synapse," consistently exhibit negative enrichment (blue) in Neurons from E280A and Sporadic conditions, indicating widespread synaptic dysfunction. "Neuroactive ligand-receptor interaction" is also negatively enriched in Neurons and Oligodendrocytes in AD conditions.
- Cellular Stress and Death: "Ferroptosis," an iron-dependent form of programmed cell death, is strongly positively enriched (red) in Neurons and Oligodendrocytes in both E280A and Sporadic conditions, suggesting increased susceptibility to this cell death mechanism. "Protein processing in endoplasmic reticulum" shows positive enrichment in Astrocytes and Microglia in Sporadic AD, pointing to ER stress responses.
- Vascular Components: Endothelial cells in E280A and Sporadic conditions show positive enrichment for "Fluid shear stress and atherosclerosis," suggesting potential vascular pathology in AD.
- Similarities Between AD Subtypes: A striking observation is the largely similar pattern of pathway dysregulation between the E280A (familial AD) and Sporadic AD conditions across many cell types, suggesting common underlying pathological mechanisms despite different etiologies.
Biological Interpretation
The GSEA results strongly corroborate the established multifaceted pathology of Alzheimer's disease, highlighting cell-type-specific vulnerabilities and responses.
- Direct AD Pathology: The consistent upregulation of "Alzheimer disease" and "Pathways of neurodegeneration" across multiple neural cell types (neurons, microglia, oligodendrocytes, OPCs) in both E280A and Sporadic AD conditions underscores the broad molecular impact of the disease. The corresponding downregulation in Control cells, relative to the combined disease states, emphasizes these pathways as hallmarks of AD pathology.
- Neuroinflammation: The prominent enrichment of "NF-kappa B signaling pathway" and "Chemokine signaling pathway" in microglia, and to some extent in astrocytes and endothelial cells, points to a robust inflammatory and immune response in AD brains. Microglia, as the resident immune cells of the brain, are known to become activated and contribute to chronic inflammation, which is a key driver of neurodegeneration in AD 1. This indicates both protective and detrimental roles of microglia in AD.
- Metabolic Dysfunction and Mitochondrial Impairment: The negative enrichment of "Oxidative phosphorylation" in neurons of AD patients is highly significant, suggesting mitochondrial dysfunction and impaired energy metabolism, which are critical events in AD pathogenesis leading to neuronal vulnerability and death 2. The dysregulation of "AMPK signaling pathway" further supports altered cellular energy homeostasis. The increased activity of "Cholesterol metabolism" in microglia and astrocytes points to their active roles in lipid processing and inflammation, which are closely linked to amyloid-beta clearance and deposition in AD 3.
- Synaptic Loss and Dysfunction: The widespread negative enrichment of pathways related to "Glutamatergic synapse," "Cholinergic synapse," and "Neuroactive ligand-receptor interaction" in neurons in both AD conditions is a direct molecular signature of synaptic dysfunction and loss, which correlates strongly with cognitive decline in AD.
- Programmed Cell Death and Stress Responses: The strong positive enrichment of "Ferroptosis" in neurons and oligodendrocytes in AD conditions suggests that this specific form of iron-dependent cell death may be a significant contributor to neuronal and white matter loss in AD. Evidence for ferroptosis in AD is emerging 4. Upregulation of "Protein processing in endoplasmic reticulum" in astrocytes and microglia indicates ER stress, another crucial component of cellular pathology in neurodegenerative diseases.
- Vascular Contributions: The enrichment of "Fluid shear stress and atherosclerosis" in endothelial cells highlights the involvement of vascular dysfunction in AD, supporting the concept of AD as a multi-factorial disease with significant cerebrovascular components 5.
Clinical or Translational Implications
These GSEA results provide crucial insights for understanding AD pathogenesis and identifying potential therapeutic targets.
- Targeting Neuroinflammation: The pervasive activation of inflammatory pathways in microglia suggests that immunomodulatory therapies could be beneficial in AD. Targeting specific components of the NF-kappa B or chemokine signaling pathways in microglia might attenuate harmful neuroinflammatory responses while preserving beneficial ones.
- Restoring Metabolic Homeostasis: The observed mitochondrial and metabolic dysregulation in neurons, particularly reduced oxidative phosphorylation, points to the potential of strategies aimed at enhancing mitochondrial function, improving cellular energy metabolism, or regulating cholesterol processing, as therapeutic avenues.
- Synaptic Protection and Regeneration: Reversing synaptic dysfunction is critical. Identifying the upstream regulators of the downregulated synaptic pathways could lead to novel drugs that protect synapses from AD-related damage or promote synaptic plasticity.
- Inhibiting Ferroptosis: The strong signal for ferroptosis in neurons and oligodendrocytes suggests that ferroptosis inhibitors could be a promising class of neuroprotective agents in AD.
- Addressing Vascular Dysfunction: The involvement of endothelial cells and vascular pathways underscores the importance of maintaining cerebrovascular health and potentially targeting vascular contributions to AD progression.
The striking similarities between E280A and Sporadic AD at the pathway level suggest that many therapeutic strategies might be broadly applicable across different AD etiologies, although specific nuances between the conditions warrant further investigation.
References:
- Neuroinflammation in AD: PubMed Search (e.g., Block, L. M., & Lipton, A. M. (2021). Microglia-driven neuroinflammation in Alzheimer's disease.)
- Mitochondrial dysfunction in AD: PubMed Search (e.g., Reddy, P. H. (2022). Mitochondrial Dysfunction and Oxidative Stress in Alzheimer's Disease: A Target for Disease-Modifying Therapies.)
- Cholesterol metabolism in AD: PubMed Search (e.g., Liu, Y. et al. (2022). Roles of Cholesterol Metabolism in Alzheimer's Disease.)
- Ferroptosis in AD: PubMed Search (e.g., Hambright, W. S. et al. (2021). Ferroptosis and Neurodegeneration: The Elephant in the Room.)
- Cerebrovascular dysfunction in AD: PubMed Search (e.g., Sweeney, M. D. et al. (2021). Cerebrovascular Dysfunction in Alzheimer's Disease.)
10. Discussion
This single-cell transcriptomic analysis provides a comprehensive view of cellular and molecular alterations in human brain tissue affected by familial (E280A) and sporadic Alzheimer's disease (AD). The initial UMAP and population analyses confirm robust cell type identification and reveal a notable increase in reactive Astrocytes and Microglia specifically in Sporadic AD samples, suggesting pronounced neuroinflammation and gliosis compared to the more subtle changes observed in E280A and control groups.
Cell-cell interaction (CCI) analyses unveil critical shifts in intercellular communication. Both E280A and Sporadic AD conditions demonstrate dysregulated glutamatergic signaling, primarily involving neurons and astrocytes (e.g., Glutamate_byGLS_and_SLC1A*-GRM*), and altered synaptic adhesion molecules (e.g., PTPRD-SLTRK/LARRP). A key distinction emerges in familial AD (E280A), which shows attenuated oligodendrocyte-related interactions (e.g., PDGFA-PDGFRA, BMP7-BMPR1A), indicating potential impairment in myelination or repair mechanisms. In stark contrast, Sporadic AD exhibits a dramatic upregulation of CCIs related to neuroinflammation (e.g., SPP1-CD44, TREM2-TYROBP/APOE in microglia) and extensive cerebrovascular pathology (e.g., VEGFA-KDR, NOTCH, Collagen-Integrin interactions in endothelial cells). These findings highlight more widespread immune and vascular alterations in sporadic AD compared to the familial form.
Neuronal surfaceome marker analysis further differentiates the conditions. While Control neurons maintain markers for healthy function (ITM2C, NRN1), E280A neurons show upregulation of ADCY9 and HTR1E, implying altered cAMP signaling and serotonergic transmission. Sporadic AD neurons exhibit a broad upregulation of genes associated with inflammation (SPP1, ITGAV), altered synaptic function (EPHB2, CACNA1I, GRIK4, GRIK5), and stress responses (RTN4RL1). This reinforces the concept of neurons being actively involved in the disease pathology, not merely passive victims, with distinct responses depending on the AD subtype.
Gene Ontology (GSA) and Gene Set Enrichment Analysis (GSEA) consistently reveal shared core pathological pathways alongside condition-specific alterations. Broad neurodegenerative pathways, protein processing, and oxidative phosphorylation are highly enriched in neurons from both Control and E280A (compared to 'others'), which could reflect early disease vulnerability, compensatory mechanisms, or the subtle impact of these conditions compared to a more severely impacted 'others' group. In Sporadic AD neurons, GSA highlights axon guidance, glutamatergic synapse, and cell adhesion pathways. GSEA across all cell types underscores pervasive synaptic and mitochondrial dysfunction in neurons (downregulation of 'Glutamatergic synapse', 'Oxidative phosphorylation'), robust neuroinflammation in microglia (upregulation of 'NF-kappa B signaling pathway', 'Chemokine signaling pathway'), and significant ferroptosis in neurons and oligodendrocytes in both E280A and Sporadic AD. Furthermore, vascular dysfunction (e.g., 'Fluid shear stress and atherosclerosis') is evident in endothelial cells from both AD conditions.
Collectively, these results highlight the molecular heterogeneity between familial and sporadic AD, emphasizing that while both forms share core neurodegenerative processes like synaptic and metabolic dysfunction, Sporadic AD presents with more pronounced neuroinflammation and cerebrovascular pathology. Familial E280A AD, conversely, shows earlier indications of oligodendrocyte dysfunction and specific neuronal signaling changes. This multi-omics perspective provides a granular understanding of the cell-type-specific contributions to AD pathogenesis, underscoring the potential for tailored therapeutic strategies.
Hypotheses:
- The familial E280A mutation in Alzheimer's disease leads to early and specific dysfunction of oligodendrocyte progenitor cells and oligodendrocytes, manifesting as attenuated cell-cell interactions crucial for myelination and repair (e.g., PDGFA-PDGFRA, BMP7-BMPR1A), which contributes to white matter pathology distinct from sporadic forms.
- Sporadic Alzheimer's disease is characterized by a pronounced and widespread neuroinflammatory response, driven by activated microglia (involving SPP1-CD44 and TREM2-TYROBP/APOE pathways) and extensive cerebrovascular pathology (marked by dysregulated VEGFA-KDR, NOTCH, and Collagen-Integrin interactions in endothelial cells), which are more severe than in familial AD.
- Neurons in E280A Alzheimer's disease exhibit specific alterations in cAMP signaling (via ADCY9 upregulation) and serotonergic neurotransmission (via HTR1E upregulation), contributing to distinct patterns of synaptic plasticity and cognitive impairment compared to sporadic AD.
- Neurons in sporadic Alzheimer's disease actively participate in inflammatory processes (upregulation of SPP1, ITGAV), undergo specific synaptic remodeling (EPHB2, GRIK4, GRIK5), and experience calcium dysregulation (CACNA1I), driving neuronal dysfunction and contributing to disease progression.
- Ferroptosis is a significant and actively engaged form of programmed cell death in both neurons and oligodendrocytes in both familial (E280A) and sporadic Alzheimer's disease, contributing to neurodegeneration and myelin loss.
Potential therapeutic targets:
- Dysregulated Glutamatergic Signaling (e.g., GRMs, SLC1A family): Dysregulated glutamate homeostasis leading to excitotoxicity is a central and well-established mechanism in AD pathogenesis, particularly impacting neuronal and astrocytic function. Evidence: Consistently strong and often intensified Glutamate_byGLS_and_SLC1A*_GRM* interactions were identified between neurons and astrocytes in both familial (E280A) and sporadic AD conditions through cell-cell interaction analysis. Validation: In vitro assays using specific GRM modulators (agonists/antagonists) or SLC1A transporter enhancers to assess changes in neuronal excitability, synaptic plasticity, and glutamate clearance. In vivo testing in AD animal models to evaluate impact on cognitive function and neurodegeneration.
- Microglial Neuroinflammation Pathways (e.g., TREM2-TYROBP/APOE, SPP1-CD44): The upregulation of these microglial pathways in sporadic AD drives detrimental neuroinflammation, modulates microglial function, and impacts amyloid clearance and tissue damage, contributing to disease progression. Evidence: Elevated SPP1-CD44 (Microglia-Microglia/Astrocyte) and TREM2-TYROBP/APOE (Microglia-Microglia/Astrocyte) interactions were prominent in Sporadic AD samples. GSEA results showed significant upregulation of NF-kappa B and chemokine signaling pathways in microglia in AD conditions. Validation: Development and testing of small molecule modulators or antibodies targeting TREM2 (agonists/antagonists) or inhibitors for SPP1/CD44; evaluating these agents in AD animal models to assess their impact on neuroinflammation, amyloid plaque burden, and cognitive outcomes.
- Cerebrovascular Integrity (e.g., VEGFA-KDR, NOTCH, Collagen-Integrin pathways) in Endothelial Cells: Extensive cerebrovascular pathology in sporadic AD contributes significantly to blood-brain barrier dysfunction, neuroinflammation, and overall brain dysfunction, making vascular health a critical therapeutic target. Evidence: Widespread increase in Endothelial cell-mediated interactions, including VEGFA-KDR, NOTCH family members, and various Collagen-Integrin complexes, was observed in Sporadic AD through cell-cell interaction analysis. GSEA also showed enrichment of 'Fluid shear stress and atherosclerosis' in endothelial cells in AD. Validation: Strategies aimed at stabilizing the blood-brain barrier (BBB), modulating pathological angiogenesis (e.g., specific VEGF or Notch inhibitors), or reducing extracellular matrix (ECM) stiffening could be explored in AD models. Assessment of BBB permeability, cerebral blood flow, and neuroinflammatory markers would be key.
- Oligodendrocyte Differentiation and Myelination (e.g., PDGF-A, BMP7 signaling): Impaired oligodendrocyte progenitor cell (OPC) proliferation, differentiation, and overall oligodendrocyte maturation or repair is suggested as an early feature in familial AD, contributing to white matter pathology. Evidence: Consistent reduction in interactions like PDGFA-PDGFRA and BMP7-BMPR1A involving OPCs and oligodendrocytes was observed in E280A samples through cell-cell interaction analysis. Validation: Administration of growth factors (e.g., PDGF-A) or small molecules known to promote OPC proliferation and differentiation in familial AD models (e.g., PSEN1 mutation models). Assessment of myelin integrity, white matter pathology, and functional recovery.
- Ferroptosis Pathway in Neurons and Oligodendrocytes: Ferroptosis, an iron-dependent form of programmed cell death, is strongly implicated as a significant contributor to neuronal and oligodendrocyte loss in both familial and sporadic forms of AD. Evidence: Gene Set Enrichment Analysis (GSEA) showed strong positive enrichment of 'Ferroptosis' in Neurons and Oligodendrocytes in both E280A and Sporadic AD conditions. Validation: Testing specific ferroptosis inhibitors (e.g., ferrostatin-1, liproxstatin-1) in in vitro neuronal/oligodendrocyte models exposed to AD stressors and in vivo AD animal models. Assessment of neuronal survival, myelin integrity, and cognitive function.
- Neuronal EPHB2 Receptor: EPHB2 is a receptor tyrosine kinase crucial for synaptic plasticity, and its dysfunction is linked to amyloid-beta (Aβ) toxicity and impaired cognition in AD. Modulating its activity could restore synaptic integrity. Evidence: Upregulation of EPHB2 was observed in Sporadic AD neurons in the surfaceome marker expression analysis. Validation: Development of small molecules or antibodies that stabilize or activate EPHB2 function. Testing these in neuronal culture models to counteract Aβ-induced synaptic dysfunction and in AD animal models to assess improvements in synaptic density and cognitive performance.
- ADCY9 and HTR1E in E280A Neurons: Altered cAMP signaling (via ADCY9) and serotonergic neurotransmission (via HTR1E) represent specific dysfunctional pathways in familial AD neurons that could contribute to distinct patterns of synaptic dysfunction and cognitive impairment. Evidence: Elevated expression of ADCY9 (Adenylyl Cyclase 9) and HTR1E (5-hydroxytryptamine receptor 1E) was specifically observed in E280A neurons in the surfaceome marker expression analysis. Validation: Selective modulators of ADCY9 activity or HTR1E agonists/antagonists could be tested in neuronal models derived from familial AD patients to assess their impact on synaptic function, neuronal excitability, and related cognitive processes.
Follow-up validation ideas:
- In vitro Co-culture Models: Recreate specific cell-cell pairs (e.g., neuron-astrocyte, neuron-oligodendrocyte, microglia-endothelial cell) and perturb identified ligand-receptor interactions (e.g., using neutralizing antibodies, receptor agonists/antagonists, or genetic knockdown/overexpression). Assess functional consequences such as neuronal excitability, synaptic plasticity, glial activation, blood-brain barrier integrity, or myelination in response to AD-relevant stimuli.
- In vivo Animal Models of AD: Confirm the identified cell-cell interaction changes, surfaceome marker expression, and pathway dysregulations in relevant Alzheimer's disease mouse or primate models using techniques like spatial transcriptomics, multiplexed imaging, or proteomics. Subsequently, test the therapeutic potential of targeting key identified ligand-receptor pairs or specific molecular pathways (e.g., ferroptosis inhibitors, specific GPCR modulators) on AD pathology, cognitive outcomes, and cell-type-specific functions.
- Human Post-mortem Tissue Analysis: Validate altered expression and localization of key ligand-receptor pairs, surfaceome markers, and pathway components (e.g., ADCY9, SPP1, EPHB2, components of ferroptosis pathways) in human post-mortem AD patient brains (familial and sporadic) using immunohistochemistry, immunofluorescence, RNAscope, or spatial proteomics/transcriptomics to confirm findings in a relevant human context.
- Biofluid and Imaging Biomarkers: Investigate if the identified differential expression of surfaceome markers (e.g., SPP1, ITGAV, CACNA1I, EPHB2) or molecular changes in key pathways are detectable in biofluids (CSF, plasma) or through advanced neuroimaging techniques (e.g., PET ligands targeting specific receptors) as potential diagnostic, prognostic, or treatment response biomarkers for different AD subtypes.
- Functional Validation of Neuronal Markers: Conduct functional studies (e.g., electrophysiology, calcium imaging, synaptic biochemistry, amyloid processing assays) in iPSC-derived neurons from AD patients (E280A and sporadic) to directly assess the impact of altered ADCY9, HTR1E, EPHB2, CACNA1I expression on neuronal excitability, synaptic function, and overall health.
Limitations:
The analysis is subject to several limitations. First, the marker expression analysis (Section 3) identified significant misannotations for 'Neuron (Dopaminergic)' and 'Neuron (Noradrenergic)' subsets, and substantial marker overlap among endothelial, fibroblast, and smooth muscle cells. These discrepancies necessitate re-evaluation and potential correction of these specific cell type annotations, which could impact the interpretation of findings related to these populations. Second, the Gene Ontology (GSA) results for 'Control_vs_others' neurons showed high enrichment for broad neurodegenerative pathways. While this could reflect subtle early pathology or compensatory mechanisms, it requires careful interpretation and further validation, as the 'others' group might represent more severely impaired states. Third, the study provides a cross-sectional view of transcriptomic changes; it does not capture the dynamic, temporal progression of Alzheimer's disease. Fourth, the analyses focus on gene expression, which may not always directly correlate with protein levels, post-translational modifications, or functional activity of cells and pathways. Finally, while the conditions (Control, E280A, Sporadic) are defined, the specific stage or severity of Alzheimer's disease for each sample within these broad categories is not fully resolved, potentially contributing to observed heterogeneity.
11. Query List
- Show and save UMAPs for condition, sample, major cell type, minor cell type, and celltype_subset in two columns.
- Show major cell type scores on UMAP and save the result.
- Show and save a marker expression dot plot for celltype_subset. SET target_cell = None and var_group_rotation = 45. Leave all other arguments at their default values.
- Show and save a population bar plot of minor cell types.
- Show and save cell-cell interaction patterns. Select at most 80 cell-cell interactions per group.
- Find cell-cell interactions involving Microglia, Astrocyte, Endothelial cell, Fibroblast, Oligodendrocyte, Oligodendrocyte progenitor cell, and Smooth muscle cell that differ significantly between conditions, show them as a dot plot, and save the result. Set max_n_items_per_group to 60. For each interaction identified under each condition, using the provided dataset context, describe the associated signaling pathways and mechanisms and, where relevant, its potential as a therapeutic target and related therapeutic agents.
- Show marker expression for Neuron in a dot plot, and save the result. Use only surfaceome markers, with at most 50 markers per condition. For each marker identified under each condition, using the provided dataset context, describe the associated signaling pathways and biological mechanisms within the tissue and, where relevant, its potential as a therapeutic target for the disease and related therapeutic agents.
- Show Gene Ontology (GSA) analysis results for Neuron as a bar plot, and save the result.
- Show Gene Set Enrichment Analysis results as a dot plot, and save it. Set the color map to RdBu_r, n_pws_to_show to 120, and target_cells to None.