Single-Cell Deconstruction of Breast Cancer Heterogeneity: Genomic Alterations, Tumor Microenvironment, and Therapeutic Opportunities
This report presents a single-cell RNA-sequencing analysis of human breast tissue, encompassing normal, ER+, HER2+, and TNBC conditions. UMAP visualizations clearly delineate normal from tumor cells, with aneuploid epithelial cells validating their malignant origin and exhibiting widespread genomic instability. Significant cellular and genomic heterogeneity is observed across breast cancer subtypes, particularly in T cell and macrophage populations, and in copy number variations. Cell-cell interaction analysis highlights distinct immune-suppressive and pro-tumorigenic communication networks within the tumor microenvironment, offering insights into subtype-specific disease mechanisms and potential therapeutic vulnerabilities.
Contents
- Dataset overview
- scRNA-seq Data Overview: UMAP Visualization of Cell Identity, Condition, Sample, and Ploidy in Breast Tissue
- UMAP Visualization of Major Cell Type Scores, Cell Type Annotations, and Ploidy Status
- Celltype_subset Marker Gene Expression Analysis
- Genomic Copy Number Variation Analysis in Breast Cancer Epithelial and Unassigned Cells
- CNV-driven UMAP Embedding Reveals Distinct Genomic Landscapes Across Breast Cancer Subtypes and Cell Populations
- Cell Type Population Analysis in Breast Tissue and Cancer Subtypes
- Breast Cancer Subtype-Specific T Cell and Innate Lymphoid Cell Subset Proportions
- T Cell Subset Population Differences Across Breast Cancer Conditions
- Macrophage Subset Population Analysis Across Breast Cancer Subtypes
- Macrophage Subset Population Shifts Across Breast Cancer Subtypes
- Ploidy Population Analysis of Epithelial and Unassigned Cells Across Breast Cancer Subtypes and Normal Tissue
- Breast Cancer Cell-Cell Interaction Patterns Across Subtypes and Normal Tissue
- Condition-Specific Cell-Cell Interaction Analysis in Breast Cancer Subtypes
- Cell-Cell Interaction Analysis of Immune Checkpoint and Cell Cycle Pathways in Breast Cancer Subtypes
- Condition-Specific Cell-Cell Interaction Patterns in Breast Cancer Subtypes
- Epithelial Cell Condition-Specific Surfaceome Markers in Breast Cancer Subtypes
- Macrophage Condition-Specific Surfaceome Markers in Breast Tissue
- Condition-Specific Surfaceome Markers in Breast Cancer Fibroblasts
- T cell CD4+ Condition-Specific Surfaceome Markers in Breast Cancer
- Dysregulation of Cell Cycle Genes in Breast Cancer Epithelial Cells Across Subtypes
- Gene Ontology (GSA) Analysis for Epithelial Cells Across Breast Cancer Conditions
- Gene Set Enrichment Analysis (GSEA) for Breast Cancer Cell Types
- Discussion
- Query List
0. Dataset overview
Dataset Summary
- AnnData Dimensions: The dataset contains 94021 cells and 26440 genes.
- Species and Tissue: The data is from human Breast tissue.
- Conditions: The study includes samples from 'Normal', 'TNBC', 'HER2+', and 'ER+' conditions.
- Cell Type Annotations: Cells are categorized into three hierarchical levels:
- celltype_major: Epithelial cell, Stromal cell, T cell, Endothelial cell, Myeloid cell, B cell.
- celltype_minor: Includes more granular types like Fibroblast, Macrophage, ILC, T cell CD8+, etc.
- celltype_subset: Provides the most detailed classification, such as Luminal epithelial cell, T cell (Cytotoxic), Macrophage (M2B), etc.
- Ploidy Information: ploidy_dec column indicates 'Aneuploid' or 'Diploid' status for cells.
- Precomputed Results: The dataset includes several precomputed analysis results:
- Cell-Cell Interaction (CCI): Stored as uns['CCI'] and uns['CCI_sample'] for condition and sample-specific results.
- Differential Expression Genes (DEG): Available as uns['DEG'] (condition vs. rest) and uns['DEG_vs_ref'] (condition vs. Normal reference) for celltype_minor groups.
- Gene Set Enrichment Analysis (GSEA): Available as uns['GSEA'] (condition vs. rest) and uns['GSEA_vs_ref'] (condition vs. Normal reference) for celltype_minor groups.
- Gene Ontology (GO/GSA): Available as uns['GSA_up'] (condition vs. rest) and uns['GSA_vs_ref_up'] (condition vs. Normal reference) for celltype_minor groups.
- Copy Number Variation (CNV): Estimates are stored in obsm['X_cnv'].
- Reference Condition: 'Normal' is used as the reference condition for DEG_vs_ref, GSEA_vs_ref, and GSA_vs_ref_up analyses.
1. scRNA-seq Data Overview: UMAP Visualization of Cell Identity, Condition, Sample, and Ploidy in Breast Tissue
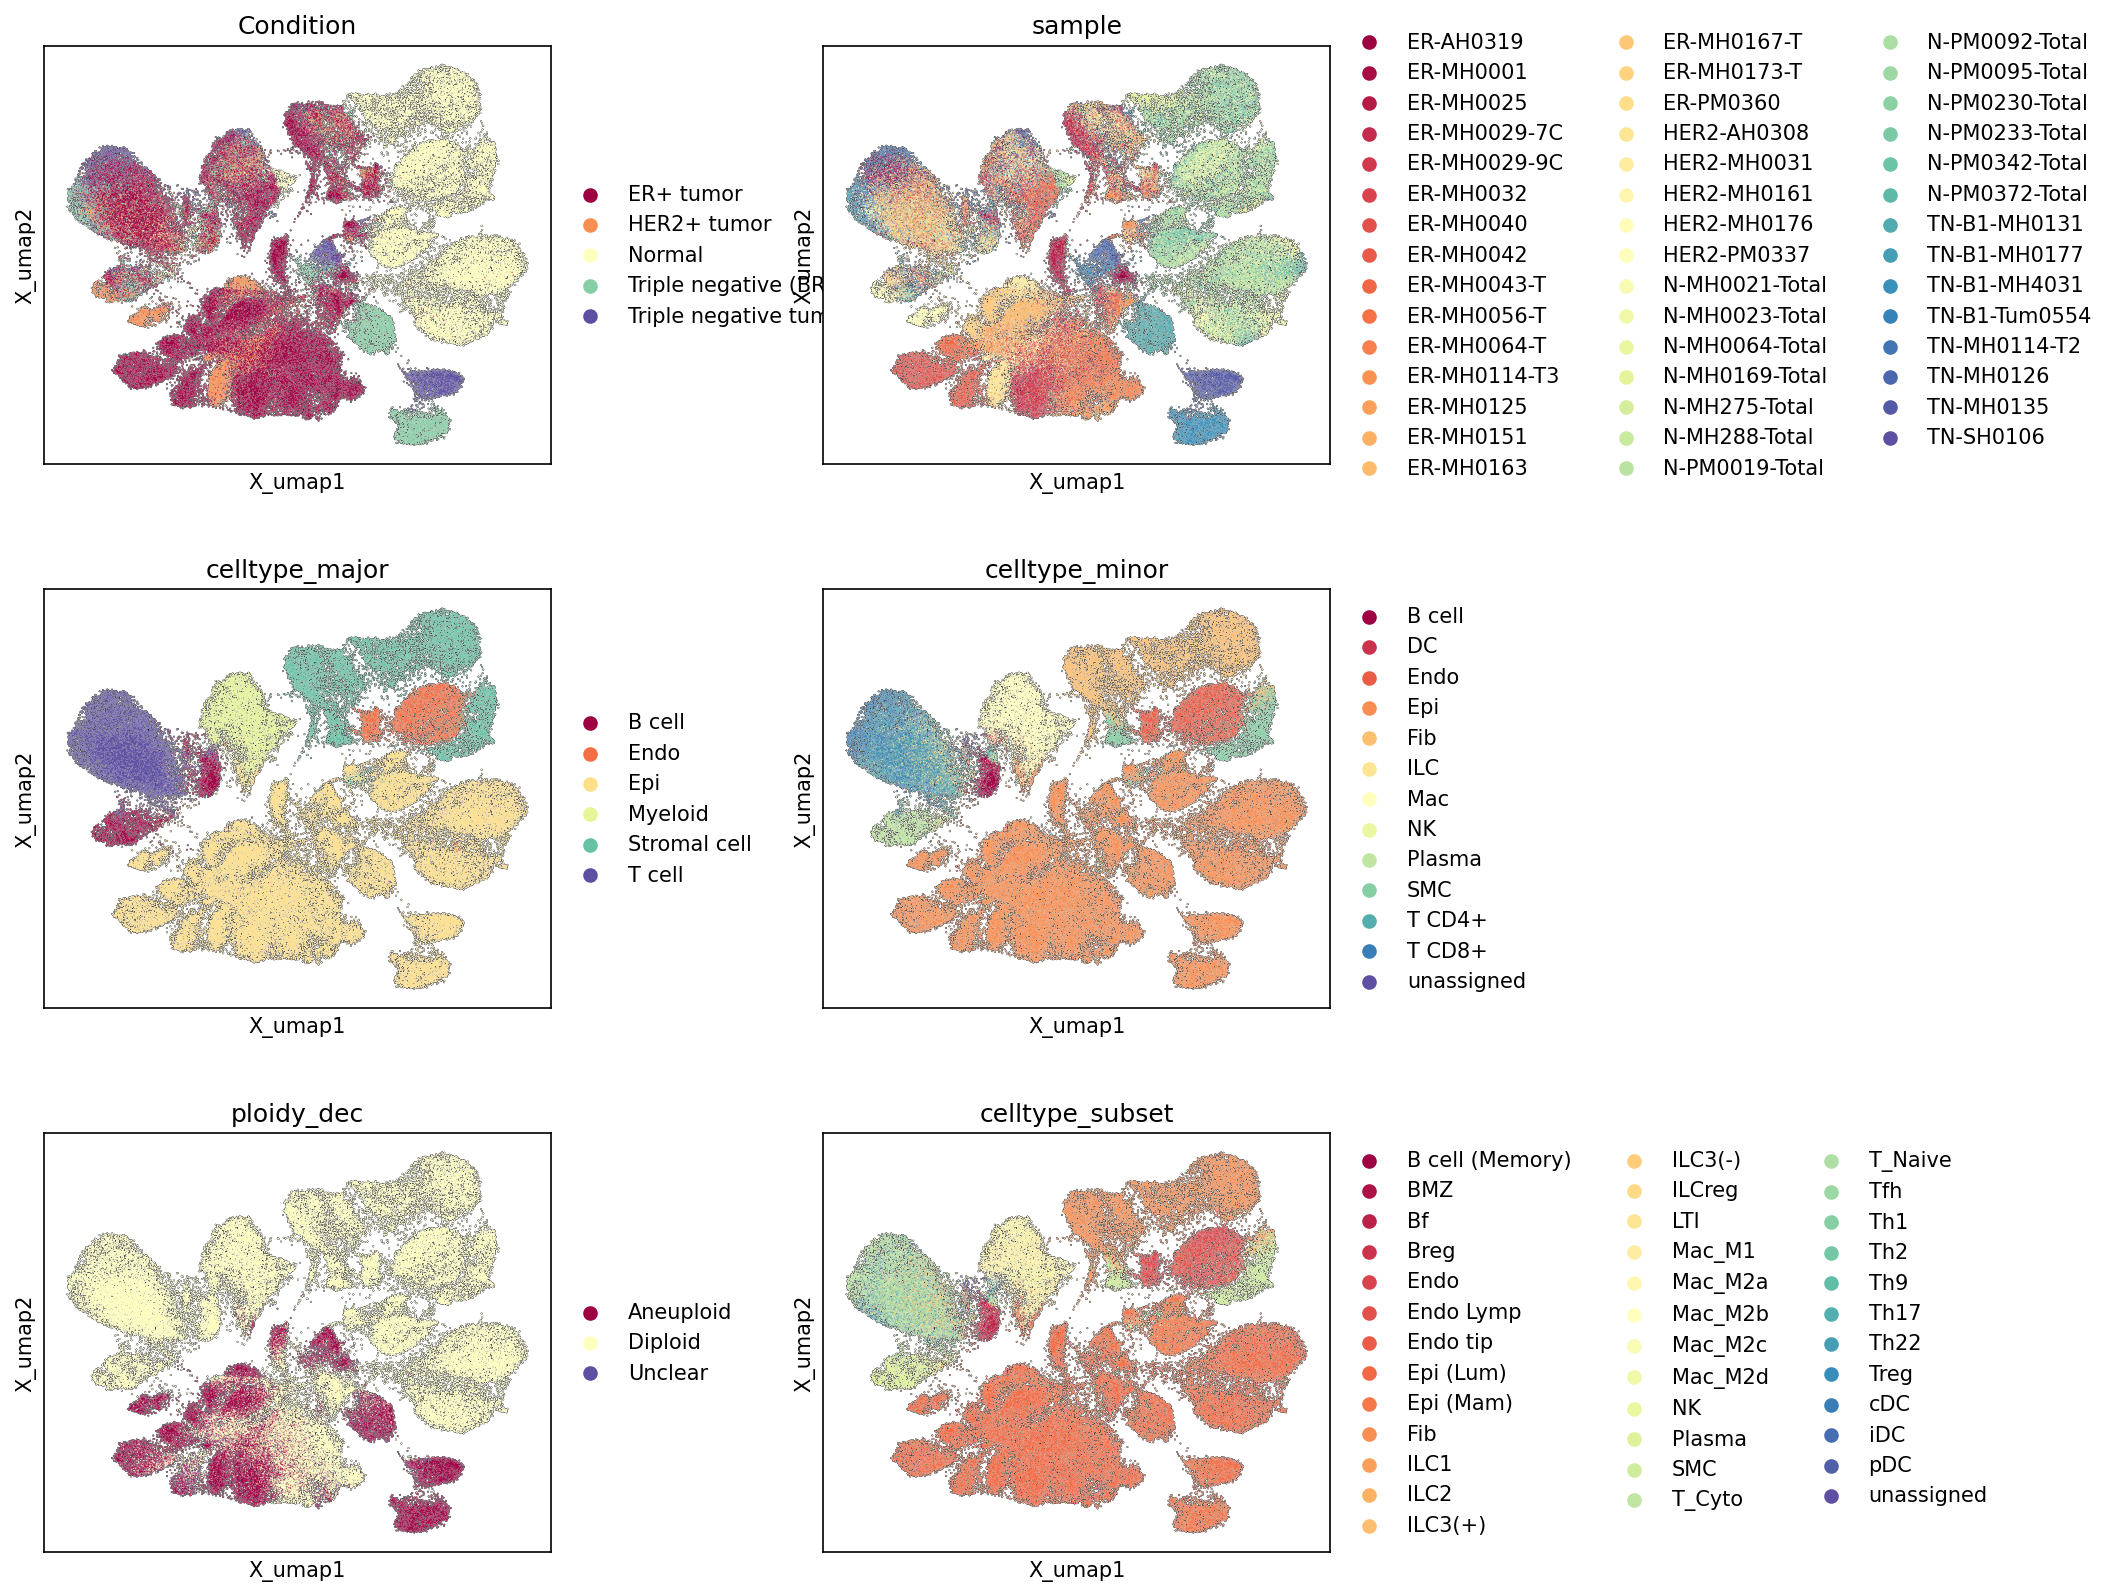
[Analysis Visualization Results]...
Analysis Overview
This analysis presents UMAP (Uniform Manifold Approximation and Projection) plots generated from single-cell RNA-sequencing data, visualizing the distribution of 94,021 cells across 26,440 genes. These plots are colored by various metadata categories: Condition (Normal, ER+, HER2+, TNBC), Sample, major cell type, minor cell type, ploidy status (Diploid, Aneuploid), and cell type subsets. The primary goal is to assess the overall structure of the dataset, evaluate the quality of cell type annotations, and observe the distribution of different conditions and ploidy states within the single-cell landscape.
Visual Summary
Condition
The UMAP plot colored by 'Condition' reveals a clear separation between 'Normal' tissue cells (light green) and tumor cells (ER+, HER2+, TNBC). 'Normal' cells predominantly cluster on the right side of the UMAP, forming distinct groups. Conversely, tumor conditions (ER+ tumor, HER2+ tumor, Triple negative tumor) are largely intermingled, occupying the central and left regions of the UMAP space. While there is significant overlap among the tumor subtypes, Triple Negative Breast Cancer (TNBC, purple) appears to form some slightly more distinct sub-clusters compared to the extensive mixing of ER+ (dark red) and HER2+ (orange) cells.
Sample
The 'sample' UMAP plot shows that while conditions (especially tumor conditions) are mixed, individual samples often retain a degree of clustering or specific spatial enrichment. This indicates that while shared biological features drive the broad condition and cell type separation, there are also sample-specific transcriptional variations or potentially minor batch effects contributing to the UMAP structure. Normal samples (various shades of light green) generally group together, reinforcing the distinction between normal and tumor cells.
Celltype_major
The UMAP colored by 'celltype_major' demonstrates excellent separation of the major cell populations. 'Epithelial cells' (light yellow/beige), identified as the tumor origin cell type, form the largest and most heterogeneous cluster, consistent with their role in cancer and potential for extensive transcriptional variability. 'Stromal cells' (light green), 'T cells' (purple), 'Myeloid cells' (light blue), 'Endothelial cells' (orange), and 'B cells' (dark red) all form distinct and well-separated clusters, indicating robust cell type identification.
Celltype_minor
Further resolution is observed in the 'celltype_minor' plot, where sub-populations within major cell types are clearly delineated. For instance, 'Fibroblasts' (light yellow), 'Macrophage' (light green), 'T cell CD8+' (dark blue), and 'T cell CD4+' (light blue) are distinct. The 'Epithelial cell' population (orange) remains a dominant cluster, reflecting its diversity. The presence of a minimal 'unassigned' population (dark blue, scattered) suggests high confidence in most cell annotations.
Ploidy_dec
The 'ploidy_dec' UMAP highlights a strong association between aneuploidy and the tumor cell population. 'Aneuploid' cells (dark red) are heavily concentrated within the large, central clusters that correspond to the 'Epithelial cell' major type and the tumor conditions. In contrast, 'Diploid' cells (light yellow) are widely distributed across the UMAP, enriching regions associated with normal tissue and non-malignant cell types (e.g., immune and stromal cells). This pattern aligns with the expectation that malignant epithelial cells in cancer are often aneuploid.
Celltype_subset
The 'celltype_subset' plot provides the highest level of granularity, showcasing distinct clusters for various epithelial, immune, and stromal cell subsets. Within the epithelial population, 'Luminal epithelial cells' and 'Mammary epithelial cells' (various orange tones) are visible. Specific T cell subsets such as 'T cell (Cytotoxic)', 'T cell (Th17)', 'T cell (Treg)', and 'T cell (Naive)' are discernible, as are different macrophage polarization states (Macrophage (M1), M2A, M2B, M2C, M2D). This detailed resolution supports a comprehensive characterization of the cellular landscape.
Biological Interpretation
The UMAP visualizations collectively provide a robust overview of the single-cell RNA-seq dataset from human breast tissue, encompassing various breast cancer subtypes and normal controls.
- Distinct Disease States: The clear separation between 'Normal' and tumor conditions in the UMAP reflects significant transcriptomic shifts associated with oncogenesis in breast cancer. This underscores the profound cellular and molecular reprogramming that occurs in the disease state.
- Tumor Microenvironment Complexity: The intermingling of different tumor conditions (ER+, HER2+, TNBC) suggests shared biological features or common cellular components within their tumor microenvironments, even if their specific driver mutations and signaling pathways differ. The presence of various immune (T cells, B cells, Myeloid cells) and stromal cells (Fibroblasts, Endothelial cells) within the tumor-associated regions further emphasizes the complex cellular ecosystem of the tumor microenvironment.
- Epithelial Cell Heterogeneity and Malignancy: 'Epithelial cells,' the presumed cell of origin for breast cancer, show the highest degree of transcriptional heterogeneity and occupy the most diffuse regions of the UMAP, overlapping extensively with tumor conditions. This is biologically consistent with the clonal evolution and diverse phenotypes observed in cancer cells. The strong co-localization of 'Aneuploid' cells specifically with this epithelial-tumor cluster provides compelling evidence for their malignant nature, as aneuploidy (abnormal chromosome number) is a common hallmark of cancer cells.
- Robust Cell Type Annotation: The excellent separation of major, minor, and subset cell types across the UMAPs confirms the high quality of the cell type annotations. This robust cell type identification is crucial for downstream analyses, ensuring that differential gene expression or pathway enrichment studies are performed on accurately defined cell populations.
- Sample-Specific Variability: While major biological distinctions are captured, some clustering by 'sample' within conditions indicates individual patient-specific biological variation or potential technical batch effects. This should be considered in further analyses, for example, by incorporating sample as a covariate in statistical models if needed. However, the consistent clustering by 'Condition' and 'Celltype' suggests that core biological signals are not entirely obscured by sample variation.
Annotation Notes
The UMAP plots demonstrate high-quality cell type annotation, with distinct clustering for major cell types, minor cell types, and even specific cell subsets. The minimal presence of 'unassigned' cells across the various cell type annotations further supports the confidence in the current cell identity assignments. The clear distinction between normal and tumor populations, and the strong association of aneuploidy with the epithelial tumor compartment, validate key biological features within the dataset structure.
2. UMAP Visualization of Major Cell Type Scores, Cell Type Annotations, and Ploidy Status
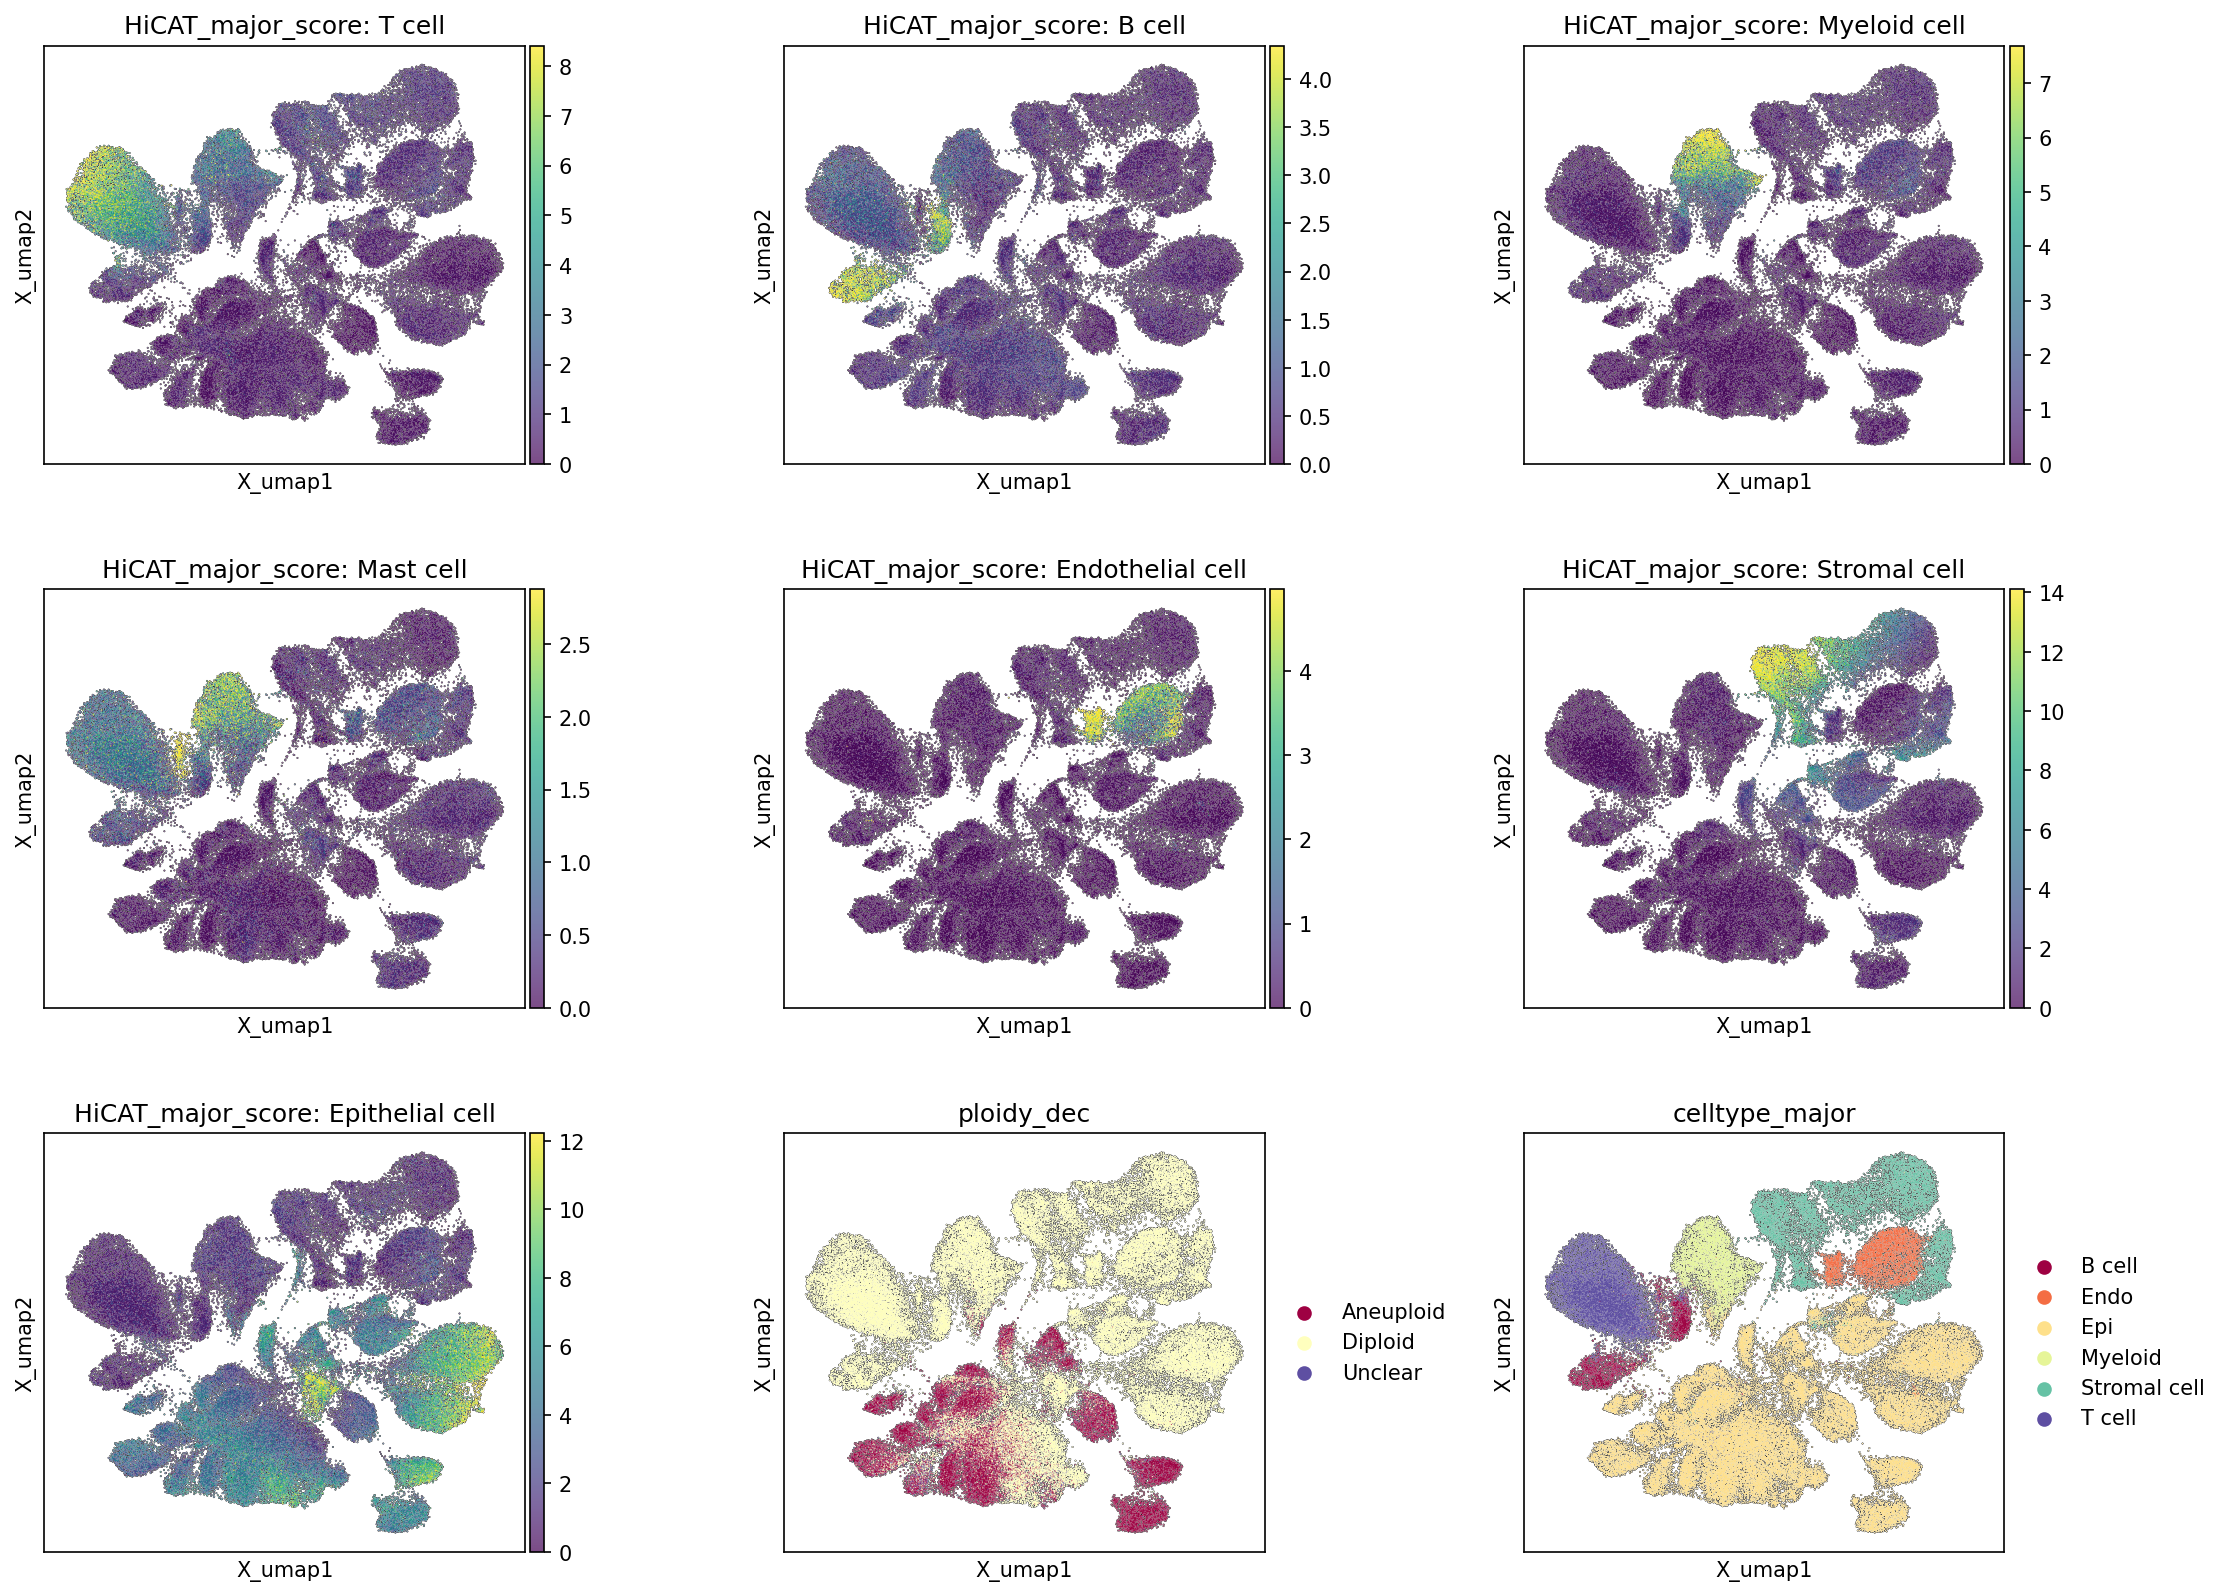
[Analysis Visualization Results]...
Analysis Overview
This analysis visualizes the cellular landscape of the single-cell RNA-seq dataset from breast tissue on a Uniform Manifold Approximation and Projection (UMAP) embedding. The UMAP plots display the distribution of major cell type scores (HiCAT_major_score) for key cell populations, the assigned major cell type labels (celltype_major), and the inferred ploidy status (ploidy_dec) across the entire cell collection. This provides an essential overview of the dataset's structure, the quality of cell type annotations, and the distribution of potentially malignant (aneuploid) cells.
Visual Summary
The UMAP embedding reveals a well-structured cellular landscape with distinct clusters, indicating successful dimensionality reduction and clustering.
- Major Cell Type Scores (HiCAT_major_score): For each major cell type (T cell, B cell, Myeloid cell, Mast cell, Endothelial cell, Stromal cell, Epithelial cell), dedicated UMAP plots show the corresponding HiCAT_major_score. Regions with high scores (yellow) for a particular cell type are largely confined to distinct, well-separated areas of the UMAP. This indicates that cells are clustering appropriately based on their characteristic gene expression profiles. Notably, Mast cells, a subset of Myeloid cells, also show a concentrated score in a specific region, suggesting good resolution within the broader myeloid compartment.
- Ploidy Status (ploidy_dec): The UMAP colored by ploidy_dec (Aneuploid, Diploid, Unclear) clearly highlights a significant population of "Aneuploid" cells (maroon color) that are largely localized to a specific set of clusters. The majority of other cell types appear "Diploid" (light yellow).
- Major Cell Type Annotation (celltype_major): The UMAP colored by celltype_major shows distinct and well-demarcated clusters corresponding to Epithelial cells, Stromal cells, T cells, B cells, Myeloid cells, and Endothelial cells. The distribution of these annotated clusters strongly aligns with the high-score regions observed in the individual HiCAT_major_score plots. For instance, the region with high Epithelial cell score perfectly overlaps with the cluster labeled "Epi" in the celltype_major plot.
Biological Interpretation
- Robust Cell Type Annotation: The strong congruence between the HiCAT_major_score for each cell type and the final celltype_major assignments demonstrates a high quality and robustness of the cell type annotations. Cells expressing markers characteristic of a specific major cell type are accurately grouped into their respective clusters. This foundational annotation is critical for downstream analyses such as differential gene expression or cell-cell interaction studies.
- For general information on single-cell RNA sequencing cell type annotation: PubMed search: single cell RNA-seq cell type annotation
- Identification of Tumor Cell Compartment: A crucial finding is the distinct clustering of "Aneuploid" cells, which predominantly overlap with the "Epithelial cell" clusters. Given that "Epithelial cell" is specified as the "Tumor origin celltype" and aneuploidy is a hallmark of cancer, this strongly suggests that these aneuploid epithelial cells represent the malignant tumor cell population within the breast tissue samples. This provides a clear demarcation of the tumor cells from the surrounding stromal and immune microenvironment.
- For information on aneuploidy in cancer: GeneCards: Aneuploidy
- Composition of the Tumor Microenvironment (TME): The visualization also effectively maps the non-malignant cell populations that constitute the TME. Distinct clusters of immune cells (T cells, B cells, Myeloid cells, including Mast cells) and stromal components (Stromal cells, Endothelial cells) are evident and well-separated from each other and from the presumed tumor epithelial compartment. This separation indicates that the analysis can proceed with confidence in dissecting the specific roles and interactions of these diverse cell types within the TME.
Annotation Notes
The consistency between the unsupervised clustering (as reflected in the UMAP structure), the major cell type scores, and the final major cell type annotations indicates that the cell populations are well-resolved and accurately labeled. The ploidy_dec information further strengthens the confidence in distinguishing tumor cells from normal epithelial and other stromal/immune cells. This robust annotation serves as a solid basis for further in-depth analyses of condition-specific changes and interactions.
3. Celltype_subset Marker Gene Expression Analysis
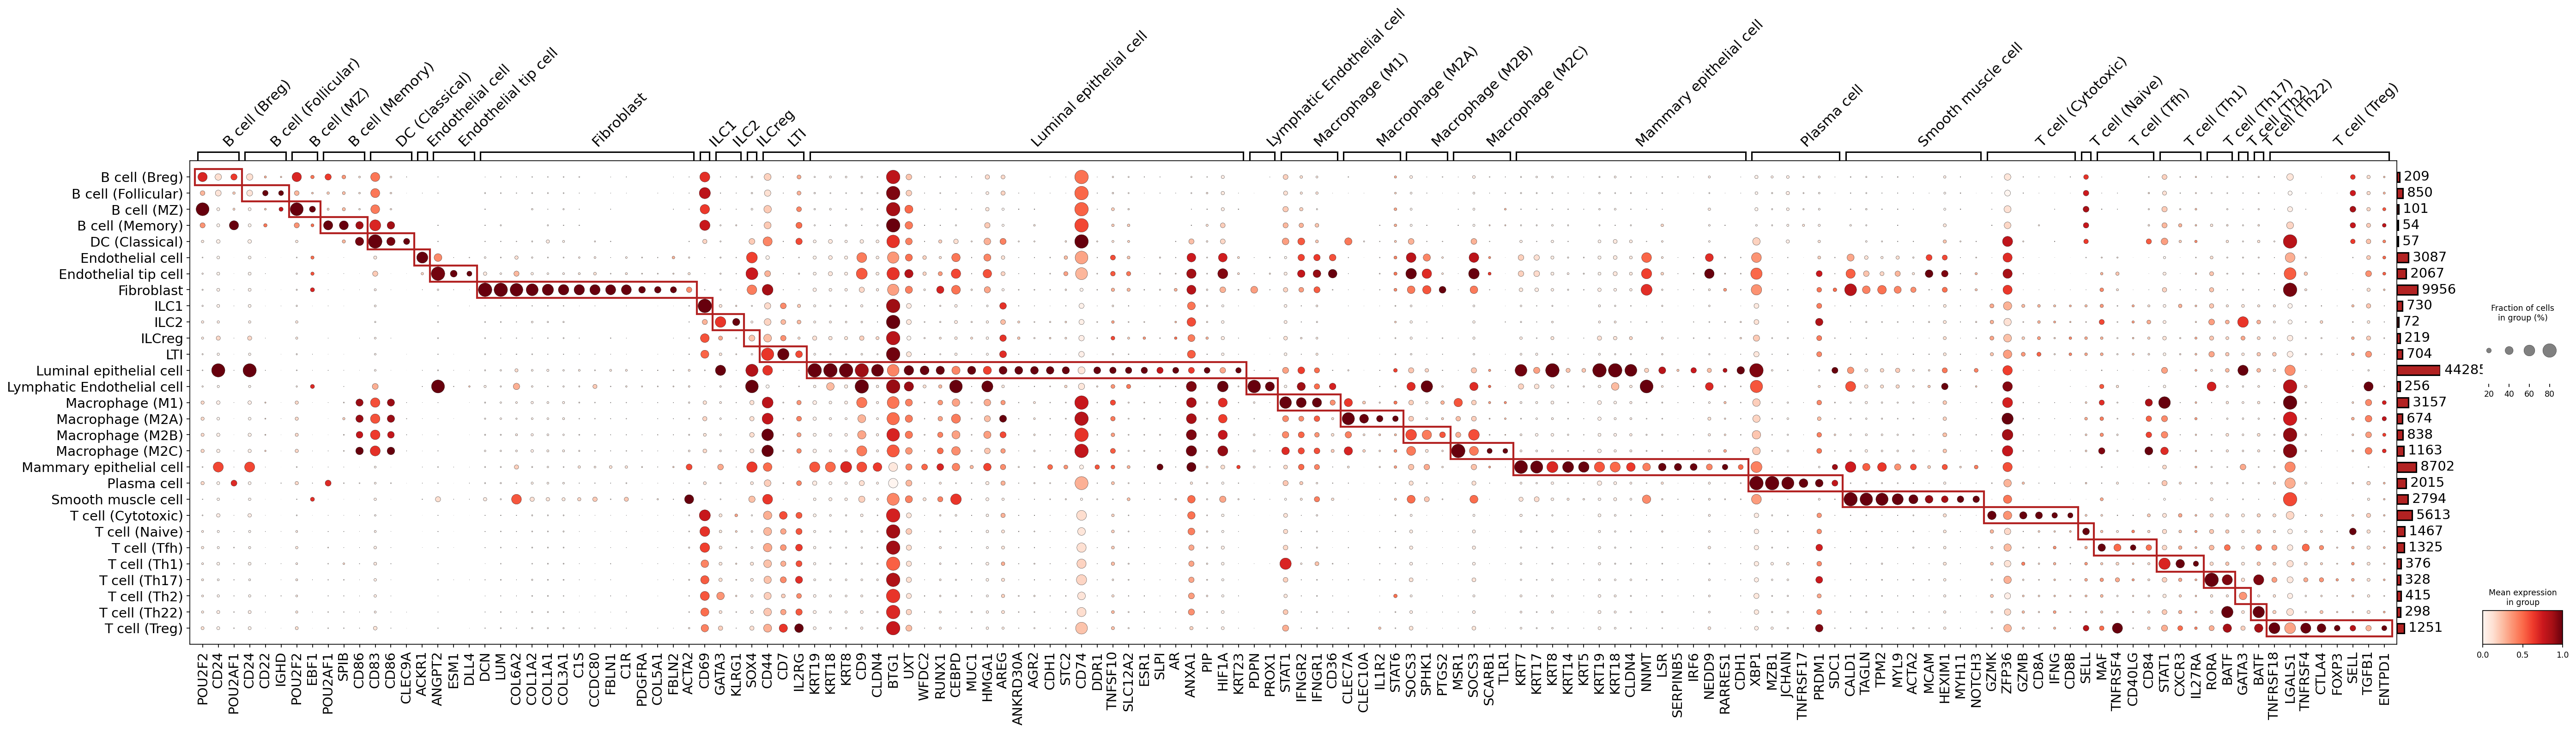
[Analysis Visualization Results]...
Analysis Overview
This dot plot visualizes the expression of key marker genes across different celltype_subset populations identified in the single-cell RNA-seq data. Each row represents a specific cell subset, and each column represents a marker gene. The size of a dot indicates the fraction of cells within that subset expressing the gene, while the color intensity (red scale) indicates the mean expression level of the gene in that cell subset. This analysis is crucial for validating the accuracy and specificity of the celltype_subset annotations by demonstrating distinct molecular signatures.
Visual Summary
The plot displays a clear diagonal pattern, where distinct clusters of genes show high and specific expression within their corresponding celltype_subset groups. This "block-diagonal" structure is a strong indicator of well-defined and separable cell populations, each characterized by a unique set of marker genes. For instance, B cell subsets exhibit specific B cell markers, T cell subsets show distinct T cell and sub-lineage markers, and various epithelial, endothelial, stromal, and myeloid cells are also defined by characteristic gene expression profiles. The overall pattern suggests robust annotation quality, with minimal widespread expression of a given marker across many unrelated cell types.
Biological Interpretation
The marker gene expression patterns strongly support the assigned celltype_subset annotations, indicating that the clustering and labeling effectively capture distinct biological identities.
- B Cell Subsets: Genes like POU2F2, POU2AF1, CD24, CD22, IGHD, MZB1, JCHAIN, SDC1 (CD138), XBP1, and TNFRSF17 (BCMA) are prominently expressed in various B cell and plasma cell subsets (B cell (Breg), B cell (Follicular), B cell (MZ), B cell (Memory), Plasma cell). This is consistent with their roles in B cell development, activation, and antibody production. For example, SDC1 and XBP1 are well-known markers for plasma cells [GeneCards; GeneCards].
- Myeloid Subsets (DCs and Macrophages): DC (Classical) is marked by CLEC9A and CD1C, which are characteristic of conventional dendritic cells [GeneCards]. Macrophage subsets (M1, M2A, M2B, M2C, M2D) show differential expression of markers such as CD68, CD86, CD83, MSR1, CD163, and SOCS3, reflecting their diverse polarization states and functions in the tumor microenvironment. For instance, CD163 is often associated with M2-like macrophages [GeneCards].
- Endothelial Subsets: Endothelial cell, Endothelial tip cell, and Lymphatic Endothelial cell are clearly delineated by markers like ANGPT2, ESM1, DLL4, LYVE1, and CDH5 (VE-cadherin). LYVE1 is a specific marker for lymphatic endothelial cells [GeneCards].
- Stromal Cells (Fibroblasts and Smooth Muscle Cells): Fibroblast populations are characterized by extracellular matrix components and growth factor receptors such as DCN, LUM, COL1A1, COL3A1, and PDGFRA [GeneCards]. Smooth muscle cell populations show strong expression of contractile proteins like ACTA2 (alpha-SMA), MYH11, TPM2, TAGLN, and CALD1, confirming their identity.
- Innate Lymphoid Cells (ILCs): ILC subsets (ILC1, ILC2, ILCreg, LTI) display markers such as GATA3 (key for ILC2s), KLRG1 (ILC1s), RORA, and IL2RG. FOXP3 and ENTPD1 (CD39) are noted for ILCreg cells, indicating a regulatory phenotype [GeneCards].
- Epithelial Cells: Luminal epithelial cell and Mammary epithelial cell express a range of cytokeratins (KRT7, KRT8, KRT18, KRT19, KRT5, KRT14), E-cadherin (CDH1), MUC1, ESR1 (estrogen receptor), and AR (androgen receptor), reflecting their epithelial origin and potential hormonal responsiveness, particularly relevant in breast tissue [GeneCards; GeneCards].
- T Cell Subsets: Various T cell subsets, including T cell (Cytotoxic), T cell (Naive), T cell (Tfh), T cell (Th1), T cell (Th17), T cell (Th2), T cell (Th22), and T cell (Treg), are distinguished by characteristic markers. For instance, GZMK/GZMB are expressed in cytotoxic T cells, FOXP3 and CTLA4 in regulatory T cells, and lineage-specific transcription factors like GATA3 (Th2) and RORA (Tfh/Th17) further define their identities [GeneCards; GeneCards]. The presence of CD8A/B for cytotoxic cells and CD40LG, STAT1, and CXCR3 for other T helper subsets aligns with established immunology.
The analysis of surfaceome-only markers provides valuable information for potential downstream applications such as flow cytometry or cell sorting, as these markers are readily accessible on the cell surface.
Annotation Notes
The dot plot of celltype_subset marker gene expression provides strong evidence for the high quality and specificity of the cell type annotations. The distinct expression patterns observed for most cell subsets, with specific marker genes predominantly expressed in their expected populations, validate the computational clustering and labeling. Minor overlaps in expression for certain markers between closely related cell types (e.g., between different B cell subsets or different T cell helper subsets) are biologically expected and do not detract from the overall annotation quality. This visualization confirms that the celltype_subset annotations are robust and reliable for further biological interpretation.
4. Genomic Copy Number Variation Analysis in Breast Cancer Epithelial and Unassigned Cells
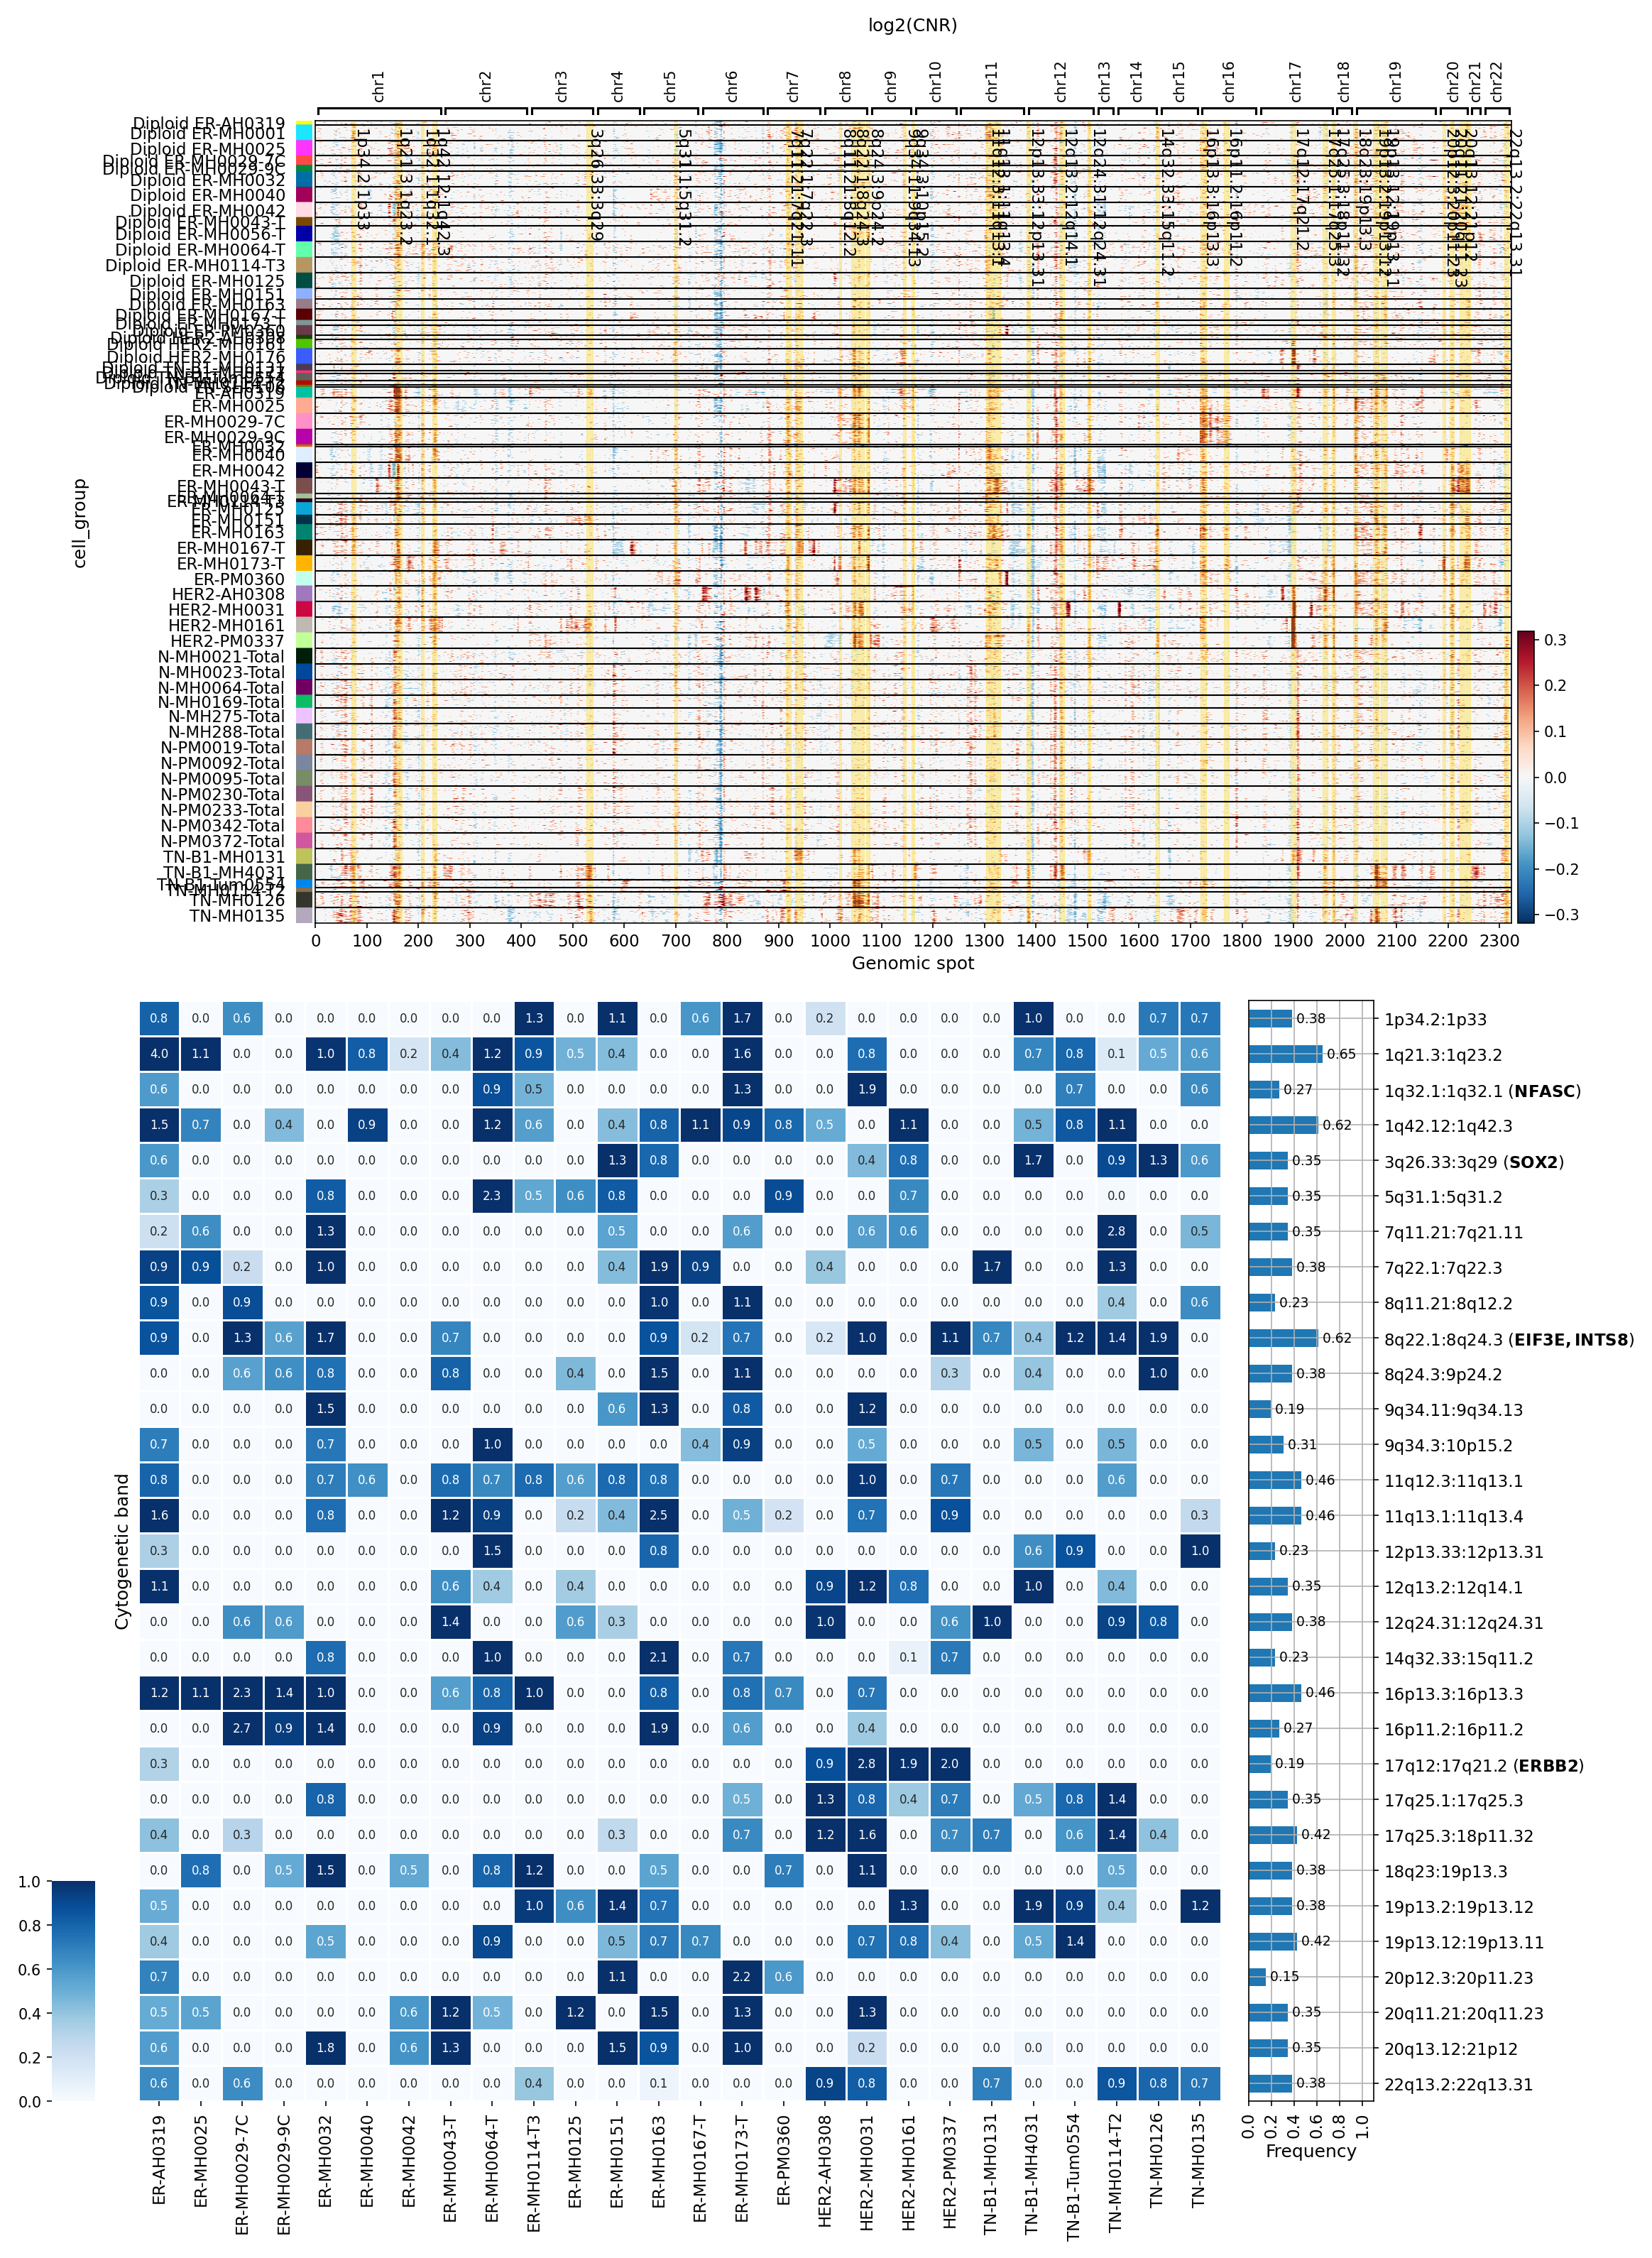
[Analysis Visualization Results]...
Analysis Overview
This analysis investigates copy number variations (CNVs) in single-cell RNA-seq data focusing on 'Epithelial cell' (the tumor-origin celltype) and 'unassigned' cells. CNVs are analyzed at the sample level, grouped by patient condition (Normal, ER+, HER2+, TNBC) and inferred ploidy status (Diploid/Aneuploid). The output includes a heatmap visualizing log2(CNR) values across genomic spots for each sample, and a summary heatmap detailing significantly amplified cytogenetic bands and their frequencies across samples. This provides insights into the genomic instability and specific amplifications characteristic of different breast cancer subtypes.
Visual Summary
CNV Heatmap (log2(CNR))
The heatmap illustrates the log2 ratio of copy number (log2(CNR)) across chromosomes for individual samples. Red indicates genomic amplification (log2(CNR) > 0), blue indicates deletion (log2(CNR) < 0), and yellow/white indicates a near-diploid state.
- Ploidy and Condition-Specific Patterns: Samples are grouped by their inferred ploidy (Diploid/Aneuploid) and condition (ER+, HER2+, TNBC, Normal).
- Diploid Samples: Most samples labeled 'Diploid' (predominantly ER+ samples and some Normal samples) generally show fewer large-scale CNVs, though some localized amplifications or deletions can still be observed.
- Aneuploid Samples: Samples labeled 'Aneuploid' (across all tumor conditions) exhibit widespread and more pronounced CNVs, characterized by larger and more numerous red (amplification) and blue (deletion) blocks across multiple chromosomes. This aligns with aneuploidy being a hallmark of genomic instability in cancer.
- Normal Samples: Samples prefixed with 'N-' (e.g., N-MH0064-Total) are largely devoid of significant large-scale CNVs, appearing predominantly yellow/white, consistent with a healthy genomic profile. This serves as a strong control for the observed tumor-associated CNVs.
Tumor Subtype Patterns
- ER+ Samples: Show a mixed pattern. Some are largely diploid, while others, particularly those marked 'Aneuploid ER-...' display significant CNVs, including amplifications on chromosomes like 1q, 8q, and deletions on 16q, 17p, which are common in ER+ breast cancer.
- HER2+ Samples: Characterized by distinct amplifications, most notably a strong amplification on chromosome 17q, consistent with the expected *ERBB2* locus amplification. https://www.genecards.org/cgi-bin/carddisp.pl?gene=ERBB2
- TNBC Samples: Appear highly aneuploid with complex CNV patterns, including both amplifications and deletions across many chromosomes.
Summary of Significantly Amplified Copy Number Regions
The second heatmap provides a detailed summary of significantly amplified cytogenetic bands across samples, with darker blue indicating higher frequency or presence of amplification. The bar plot on the right shows the overall frequency of amplification for each cytogenetic band across all samples.
- Recurrent Amplifications: Several cytogenetic bands show recurrent amplification across multiple tumor samples, particularly:
- 1q32.1:1q21.1 (NFASC): This region on chromosome 1q shows frequent amplification in several ER+ and HER2+ samples. *NFASC* (Neurofascin) is an adhesion molecule whose altered expression has been implicated in various cancers. https://www.genecards.org/cgi-bin/carddisp.pl?gene=NFASC
- 3q26.33q29 (SOX2): Amplification of this region, which contains the *SOX2* gene, is noted in several ER+ and HER2+ samples. *SOX2* is a transcription factor and stem cell marker often amplified and overexpressed in breast cancer, contributing to tumor initiation and progression. https://www.genecards.org/cgi-bin/carddisp.pl?gene=SOX2
- 8q24.3 (EIF3E, INTS8): This region is frequently amplified across ER+, HER2+, and TNBC samples. *EIF3E* (Eukaryotic translation initiation factor 3 subunit E) and *INTS8* (Integrator complex subunit 8) are genes involved in protein synthesis and RNA processing, respectively, and their amplification can contribute to oncogenesis. https://www.genecards.org/cgi-bin/carddisp.pl?gene=EIF3E ; https://www.genecards.org/cgi-bin/carddisp.pl?gene=INTS8
- 17q12 (ERBB2): A highly prominent and specific amplification is observed in HER2+ samples (e.g., HER2-MH0161, HER2-PM0311), corresponding to the *ERBB2* (HER2) oncogene locus. This is a classic hallmark of HER2-positive breast cancer and confirms the classification of these samples. https://www.genecards.org/cgi-bin/carddisp.pl?gene=ERBB2
- Sample-Specific Amplifications: While some amplifications are recurrent, others are more restricted to specific samples, indicating inter-patient tumor heterogeneity.
Biological Interpretation
The analysis of CNVs in 'Epithelial cell' and 'unassigned' populations provides critical insights into the genomic landscape of breast cancer across different subtypes.
- Tumor Cell Identification and Ploidy: The clear distinction in CNV burden between 'Normal' samples (minimal CNVs) and 'Tumor' samples (ER+, HER2+, TNBC) strongly supports the accuracy of both the condition labeling and the ploidy inference ('Diploid' vs. 'Aneuploid'). The 'Epithelial cell' population, being the tumor-origin celltype, exhibits these characteristic cancer-associated CNVs, validating their tumor identity. The 'unassigned' cells, if they show similar CNV patterns, could represent misclassified tumor cells or cells with significant genomic alterations due to the tumor microenvironment.
- Subtype-Specific Genomic Signatures:
- The consistent *ERBB2* amplification on 17q12 in HER2+ samples is a powerful validation of the HER2+ subtype and demonstrates the biological precision of the CNV calling.
- ER+ samples show characteristic amplifications and deletions often seen in luminal breast cancers, although with varying degrees of genomic instability.
- TNBC samples exhibit a high degree of aneuploidy and a complex mix of amplifications and deletions, reflecting the genomic instability often associated with this aggressive subtype.
- Recurrent Oncogenic Drivers: Identification of recurrent amplifications involving genes like *NFASC*, *SOX2*, *EIF3E*, and *INTS8* highlights potential oncogenic drivers beyond the well-known *ERBB2*. These genes warrant further investigation as they could contribute to tumor progression, resistance, or represent novel therapeutic targets across breast cancer subtypes.
- Genomic Heterogeneity: The variability in CNV patterns even within the same breast cancer subtype (e.g., among ER+ samples) underscores the genomic heterogeneity inherent in breast cancer, which can impact treatment response and disease evolution.
Clinical or Translational Implications
- Diagnostic and Prognostic Biomarkers: Recurrent CNV regions and specific gene amplifications (e.g., *ERBB2*) are established diagnostic markers and often have prognostic significance. Novel recurrent amplifications identified (e.g., involving *NFASC*, *SOX2*, *EIF3E*, *INTS8*) could be explored as new biomarkers.
- Therapeutic Targeting: The detection of *ERBB2* amplification is clinically actionable for HER2+ breast cancer, guiding targeted therapies. Similarly, other identified amplified genes with oncogenic roles could represent novel therapeutic vulnerabilities that can be targeted with existing or new drugs.
- Understanding Treatment Resistance: Genomic alterations can drive resistance to therapy. Detailed CNV mapping can help understand the evolution of drug resistance, particularly in highly aneuploid and heterogeneous tumors.
- Precision Medicine: Comprehensive CNV profiling at single-cell resolution can aid in more precise patient stratification and personalized treatment strategies by identifying specific genomic vulnerabilities in individual tumors.
5. CNV-driven UMAP Embedding Reveals Distinct Genomic Landscapes Across Breast Cancer Subtypes and Cell Populations
[Analysis Visualization Results]...
Analysis Overview
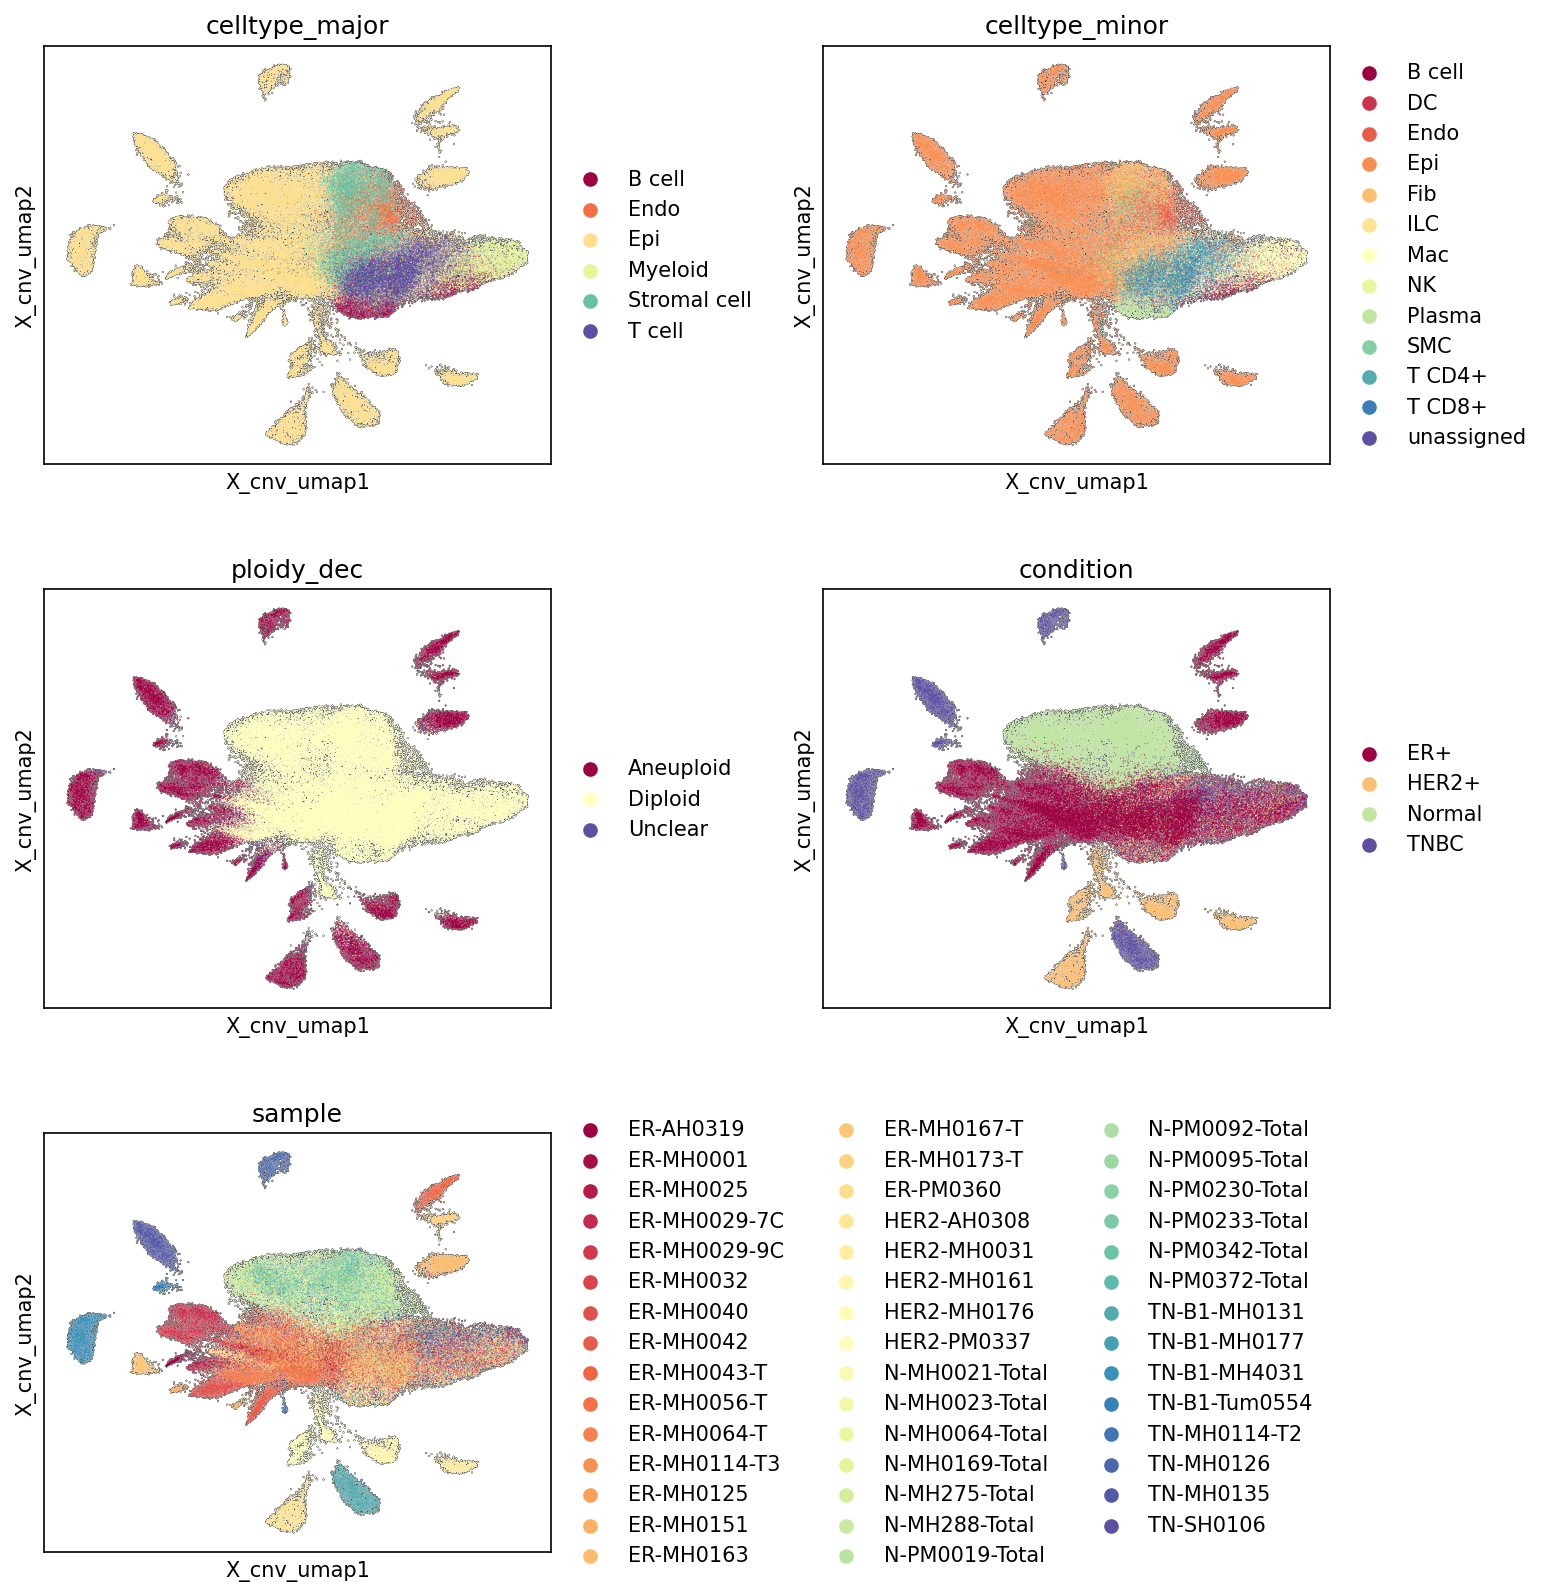
This analysis utilizes a UMAP (Uniform Manifold Approximation and Projection) embedding, specifically constructed using Copy Number Variation (CNV) estimates (X_cnv), to visualize the genomic landscape of single cells from breast tissue. The plots illustrate how cells cluster based on their CNV profiles, further colored by major and minor cell types, ploidy status, clinical condition (Normal, ER+, HER2+, TNBC), and individual patient samples. The primary goal is to understand the distribution of different cell populations and conditions in a CNV-defined space, with an emphasis on distinguishing aneuploid (typically malignant) from diploid (typically non-malignant) cells.
Visual Summary
The UMAP plots display 94,021 single cells embedded in a 2-dimensional space (X_cnv_umap1, X_cnv_umap2) where distances reflect similarities in CNV profiles.
celltype_major and celltype_minor:
- A large central region is dominated by Epithelial cells (yellow in celltype_major, orange/red in celltype_minor).
- Distinct peripheral clusters are formed by various immune cells (T cells, B cells, Myeloid cells/Macrophages, ILCs, NK cells) and stromal cells (Fibroblasts, Smooth muscle cells, Endothelial cells).
- The major epithelial mass shows internal heterogeneity in minor cell type distribution.
ploidy_dec:
- A striking separation is observed between "Diploid" (light yellow) and "Aneuploid" (maroon) cells.
- A large, relatively compact central cluster is predominantly "Diploid."
- Several distinct clusters, particularly in the periphery and interspersed within the central mass, are labeled "Aneuploid."
- Cells labeled "Unclear" (dark purple) are sparse and scattered.
condition:
- "Normal" samples (light green) almost exclusively co-localize with the large "Diploid" cluster in the UMAP center.
- "ER+" (maroon), "HER2+" (orange), and "TNBC" (dark blue) conditions predominantly occupy the "Aneuploid" regions of the UMAP, forming several distinct clusters largely separated from the "Normal" cells.
- While there is some overlap among the tumor conditions, each tends to form unique sub-clusters.
sample:
- Cells originating from the same patient sample often cluster together, highlighting patient-specific genomic profiles.
- Normal samples show very tight clustering, indicating high genomic similarity among them.
- Tumor samples, while generally occupying aneuploid regions, show substantial inter-sample variability, with cells from different tumor patients forming distinct groups.
Biological Interpretation
The UMAP embedding, explicitly leveraging CNV data, provides a powerful visualization of genomic alterations in breast tissue.
- CNV as a Primary Driver of Cell Identity: The clear segregation of cells based on their ploidy status (diploid vs. aneuploid) confirms that CNV profiles are a major determinant of cellular clustering in this embedding. This indicates that cells with similar CNV patterns are positioned closer together.
- Distinction Between Malignant and Non-Malignant Cells: Normal tissue cells are overwhelmingly diploid and form a cohesive cluster, representing the stable genomic state of healthy cells. In stark contrast, cells from tumor conditions (ER+, HER2+, TNBC) are largely aneuploid and disperse into multiple distinct clusters. This confirms the expected genomic instability and widespread copy number alterations in breast cancer cells, which originate from epithelial cells as noted in the data context.
- Epithelial Cell Malignancy: Since Epithelial cells are identified as the "Tumor origin celltype," the observation that a substantial fraction of Epithelial cells in the tumor conditions are aneuploid is consistent with their malignant transformation. The diploid epithelial cells likely represent normal epithelial components or cells with minimal CNVs.
- Heterogeneity of Tumor Genomes: The various aneuploid clusters observed across different tumor conditions (ER+, HER2+, TNBC) suggest diverse genomic landscapes. This heterogeneity can reflect different cancer drivers, varying degrees of genomic instability, or distinct subclones evolving within or across tumors. For instance, TNBC cells appear to form unique, often peripheral, aneuploid clusters, hinting at a distinct CNV signature for this aggressive subtype.
- Stability of the Tumor Microenvironment: Non-epithelial cells such as T cells, B cells, macrophages, fibroblasts, and endothelial cells predominantly reside in the diploid regions of the UMAP. This indicates that these host immune and stromal cells, even within the tumor microenvironment, generally maintain a stable, non-transformed (diploid) genome, serving as critical components of the host response rather than being directly oncogenically transformed.
- Inter-patient Variability: The clustering by sample underscores the significant patient-to-patient variability in tumor genomic profiles. Each patient's tumor appears to have a unique CNV signature that drives the distinct positioning of their cells on the UMAP, highlighting the personalized nature of cancer genomics.
Clinical or Translational Implications
- Precise Tumor Cell Identification and Purity Assessment: The clear separation of aneuploid (malignant) cells from diploid (non-malignant) cells based on CNV profiles can be a powerful tool for accurately identifying tumor cells within a complex single-cell dataset and for estimating tumor purity. This is critical for downstream analyses focused on cancer-specific biology.
- Subtype-Specific Genomic Signatures: The distinct aneuploid clusters associated with ER+, HER2+, and TNBC conditions suggest that specific CNV patterns could serve as genomic biomarkers for these breast cancer subtypes. Further investigation of these condition-specific CNV patterns could reveal subtype-specific vulnerabilities or therapeutic targets.
- Understanding Tumor Evolution and Clonal Dynamics: The presence of multiple aneuploid clusters within a single tumor condition, or even within a single patient, may represent different tumor subclones. Analyzing these CNV-defined subclones could provide insights into tumor evolution, metastatic potential, and mechanisms of therapy resistance. This information could guide targeted therapy strategies.
- Biomarker Discovery for Prognosis and Treatment Response: Identifying specific CNVs that characterize particular tumor clusters could lead to the discovery of novel prognostic biomarkers or predictors of response to specific treatments. For example, unique CNV profiles in TNBC could point to distinct therapeutic avenues for this challenging subtype.
- Assessing Tumor Microenvironment Interaction: By clearly distinguishing between diploid stromal/immune cells and aneuploid tumor cells, this analysis framework allows for a more precise investigation of cell-cell interactions within the tumor microenvironment, ensuring that interactions are attributed to the correct cellular components (e.g., tumor cells interacting with non-malignant immune cells).
6. Cell Type Population Analysis in Breast Tissue and Cancer Subtypes
[Analysis Visualization Results]...
Analysis Overview
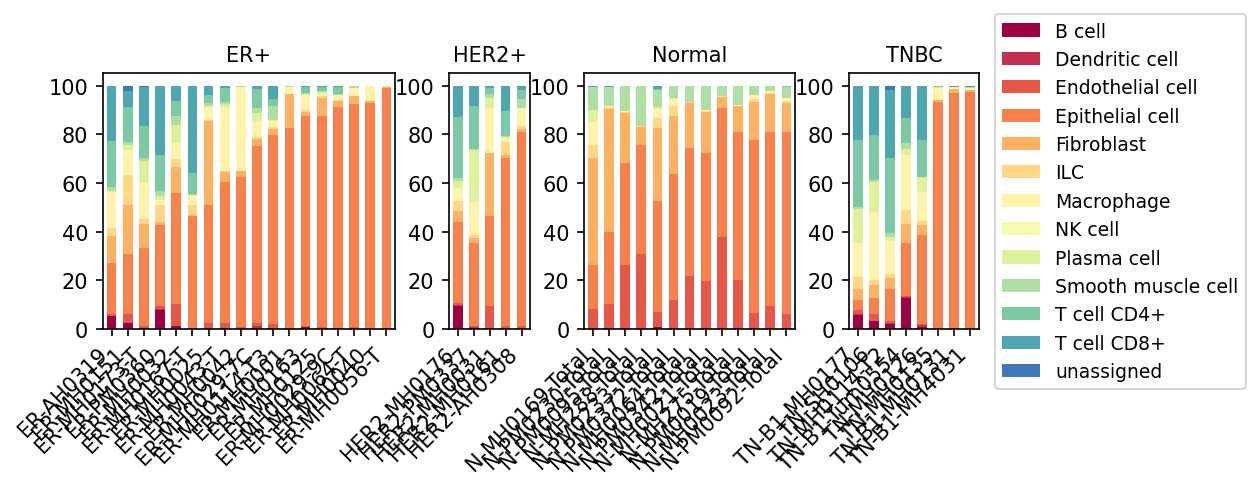
This analysis visualizes the proportional distribution of minor cell types across individual samples, grouped by clinical condition (ER+, HER2+, Normal, and TNBC). Derived from single-cell RNA sequencing of human breast tissue, this plot provides a quantitative overview of the cellular composition within healthy breast tissue and different breast cancer molecular subtypes. Understanding these cellular proportions helps in characterizing the tumor microenvironment (TME) and identifying condition-specific cellular shifts.
Visual Summary
The stacked bar plots illustrate the relative abundance of each minor cell type within each sample, with samples categorized by their clinical condition.
- Dominance of Epithelial Cells: A striking feature across all conditions, particularly within cancer samples, is the substantial proportion of Epithelial cells (represented by the orange/red-orange segments). In many tumor samples, epithelial cells comprise the vast majority of the cellular content.
- Normal Tissue Cellular Diversity: Normal breast tissue samples generally exhibit a more balanced and diverse cellular composition. While Epithelial cells are present, there are also notable contributions from Fibroblasts, Endothelial cells, Macrophages, and various T cell subsets (CD4+ and CD8+), indicating a healthy stromal and immune microenvironment.
Cancer Subtype Differences
- ER+ and HER2+ Subtypes: Many samples within the ER+ and HER2+ groups show an extremely high proportion of Epithelial cells, often exceeding 80-90%. Consequently, the representation of other cell types, including immune and stromal populations, appears relatively lower in these samples compared to normal tissue or TNBC.
- TNBC Subtype: In contrast, Triple-Negative Breast Cancer (TNBC) samples frequently display a higher proportional presence of immune cells, notably T cells (both CD4+ and CD8+), Macrophages, B cells, and Plasma cells. While Epithelial cells remain significant, the immune compartment in many TNBC samples is more prominent.
- Inter-Sample Heterogeneity: Significant variability in cell type proportions is observed between individual samples within each condition. For instance, some TNBC samples exhibit robust immune infiltration, while others are predominantly epithelial. This highlights the inherent heterogeneity across individual tumors.
- Low Abundance Cell Types: Dendritic cells, ILCs, and NK cells, as well as 'unassigned' cells, are generally present in very low proportions across all conditions and samples, suggesting they are either rare populations or were less efficiently captured/identified in the dataset.
Biological Interpretation
The distinct cell type distributions observed across conditions offer crucial biological insights into breast cancer pathogenesis and the tumor microenvironment.
- Tumor Purity and Epithelial Hyperplasia: The overwhelming presence of Epithelial cells in cancer samples reflects the epithelial origin of breast cancer and the proliferative nature of tumor cells. This can also indicate the relative purity of tumor cell enrichment in the samples, which is a common characteristic of tumor biopsies.
Immune Landscape and Immunogenicity
- The increased immune cell populations (T cells, B cells, Plasma cells, Macrophages) in TNBC samples are consistent with its known immunogenic nature and higher prevalence of tumor-infiltrating lymphocytes (TILs) [1]. This immune infiltration is often associated with a more inflamed tumor microenvironment.
- Conversely, the reduced immune cell presence in many ER+ and HER2+ samples may indicate a less inflamed or immune-excluded microenvironment, potentially contributing to different therapeutic responses.
- Stromal Contribution: The presence of Fibroblasts and Endothelial cells in varying proportions across conditions underscores their critical roles in the tumor microenvironment. Fibroblasts contribute to extracellular matrix remodeling and tumor support, while endothelial cells are fundamental for angiogenesis, both crucial processes for tumor growth and metastasis [2].
- Normal Tissue Reference: The more balanced cellular composition of Normal samples provides an essential healthy baseline. Deviations from this baseline in cancer conditions highlight disease-associated shifts in tissue architecture and cellular ecosystems.
- Tumor Heterogeneity: The considerable sample-to-sample variability within each breast cancer subtype emphasizes the inherent biological heterogeneity of breast tumors. This cellular diversity within and between tumors impacts disease progression and therapeutic responses.
Clinical or Translational Implications
The findings from this cell type population analysis carry important clinical and translational implications for breast cancer management.
- Immunotherapy Response Prediction: The observed differences in immune cell infiltration, particularly the higher proportions in TNBC, are highly relevant for predicting response to immune checkpoint inhibitors (ICIs) [3]. Patients with "hot" tumors (high immune cell infiltration) such as many TNBCs, are generally more likely to respond to ICIs. This analysis can thus inform patient stratification for immunotherapy.
- Targeting the Tumor Microenvironment: Understanding the specific cellular components of the TME can guide the development of novel targeted therapies. For instance, therapies aimed at modulating specific stromal components like cancer-associated fibroblasts (CAFs) or endothelial cells could enhance anti-tumor effects or overcome resistance mechanisms [4].
- Prognostic Value: The quantity and composition of TILs are established prognostic markers in breast cancer. Higher TILs, especially in TNBC, are often associated with better outcomes and increased pathological complete response rates to neoadjuvant chemotherapy [5].
- Personalized Medicine: The significant heterogeneity observed across individual patient samples, even within the same breast cancer subtype, reinforces the importance of personalized medicine. Single-cell analyses provide a granular view of each tumor's unique microenvironment, which can be leveraged for more tailored diagnostic and therapeutic strategies.
---
References:
[1] TNBC Immunogenicity: To learn more about the immunogenicity of Triple-Negative Breast Cancer, search "TNBC immunogenicity" on PubMed: https://pubmed.ncbi.nlm.nih.gov/?term=TNBC+immunogenicity
[2] TME Components: For a deeper understanding of the components of the tumor microenvironment and their roles in breast cancer, search "tumor microenvironment components breast cancer" on PubMed: https://pubmed.ncbi.nlm.nih.gov/?term=tumor+microenvironment+components+breast+cancer
[3] ICIs in TNBC: For information on the use of immune checkpoint inhibitors in TNBC and predictive biomarkers, search "immune checkpoint inhibitors TNBC" on PubMed: https://pubmed.ncbi.nlm.nih.gov/?term=immune+checkpoint+inhibitors+TNBC
[4] TME Targeting: To explore strategies for targeting the tumor microenvironment in cancer treatment, search "targeting tumor microenvironment cancer therapy" on PubMed: https://pubmed.ncbi.nlm.nih.gov/?term=targeting+tumor+microenvironment+cancer+therapy
[5] TILs in Breast Cancer Prognosis: For details on the prognostic role of tumor-infiltrating lymphocytes in breast cancer, search "tumor infiltrating lymphocytes breast cancer prognosis" on PubMed: https://pubmed.ncbi.nlm.nih.gov/?term=tumor+infiltrating+lymphocytes+breast+cancer+prognosis
7. Breast Cancer Subtype-Specific T Cell and Innate Lymphoid Cell Subset Proportions
[Analysis Visualization Results]...
Analysis Overview
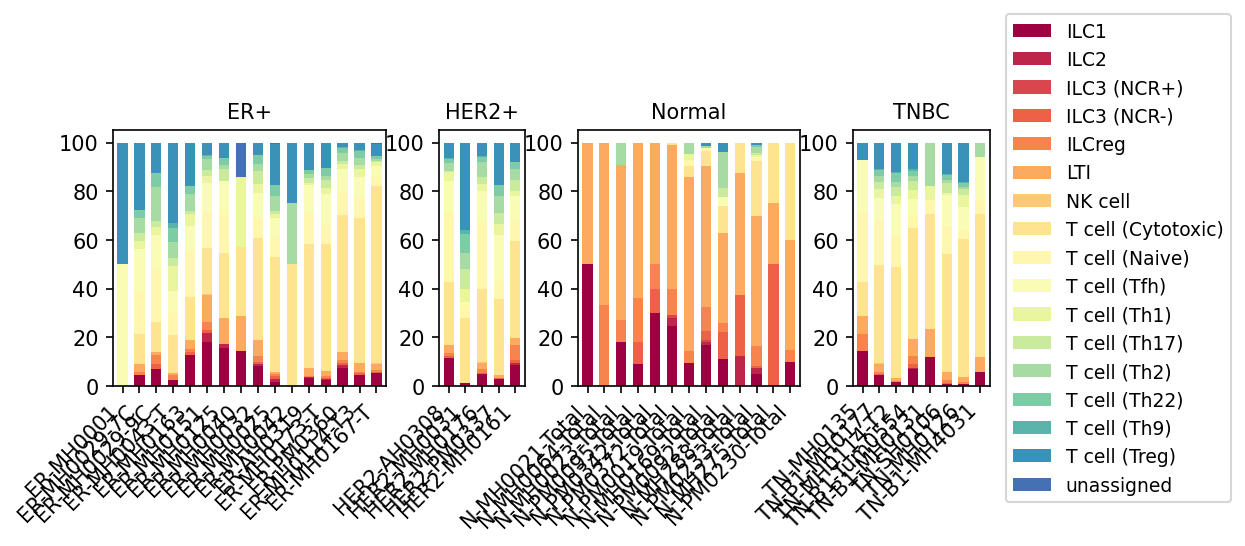
This analysis visualizes the relative proportions of T cell and innate lymphoid cell (ILC) subsets, including NK cells, within the T cell major compartment across individual samples from Normal breast tissue and different breast cancer subtypes (ER+, HER2+, TNBC). This bar plot provides insight into the immune cellular landscape of the breast tissue in healthy and diseased states.
Visual Summary
The bar plots display the proportional distribution of various T cell and ILC subsets (as detailed in celltype_subset) for each sample, grouped by condition.
- Normal Tissue (N): This group exhibits a distinct immune profile, characterized by a substantial relative presence of Innate Lymphoid Cells (ILC1, ILC3 (NCR+), LTI, and ILCreg) and Natural Killer (NK) cells. These innate immune cells collectively form a significant portion of the total T/ILC/NK cell compartment in healthy tissue. Conventional T cell subsets, while present, appear to constitute a relatively smaller fraction compared to tumor conditions.
- ER+ Breast Cancer (ER+): Samples from ER+ tumors show a clear shift towards a higher relative abundance of conventional T cell subsets. Cytotoxic T cells (T cell (Cytotoxic)), Naive T cells (T cell (Naive)), and Regulatory T cells (T cell (Treg)) are consistently observed as major components. The proportions of ILCs and NK cells are generally reduced compared to Normal tissue, although their presence varies across individual ER+ samples.
- HER2+ Breast Cancer (HER2+): The immune cell composition in HER2+ samples largely mirrors that of ER+ tumors. Prominent populations include Cytotoxic T cells, Naive T cells, and T cell (Treg) cells. Similar to ER+ tumors, ILCs and NK cells generally represent a smaller relative proportion within this compartment compared to Normal samples.
- Triple-Negative Breast Cancer (TNBC): TNBC samples often present with a highly T cell-infiltrated environment. The plots for TNBC indicate a particularly strong relative presence of Cytotoxic T cells and T cell (Treg) in many samples. Naive T cells are also notably abundant. This suggests an active yet potentially suppressed T cell response. The 'unassigned' cell population also appears to be relatively higher in some TNBC samples, which might reflect greater cellular heterogeneity or less defined states within the tumor microenvironment. As seen in other cancer subtypes, ILCs and NK cells are substantially reduced in their relative proportions compared to Normal tissue.
Biological Interpretation
The observed shifts in T cell and ILC subset proportions provide key biological insights into the immune microenvironment of breast cancer.
- Normal Tissue Immune Surveillance: The enrichment of ILCs (e.g., ILC1, ILC3) and NK cells in normal breast tissue suggests their critical role in maintaining tissue homeostasis and providing a first line of defense against cellular aberrations, as ILCs are known to regulate inflammation and tissue repair, and NK cells offer direct cytotoxicity without prior sensitization.
- Innate Lymphoid Cells in Health and Disease: PubMed Review
- Adaptive Immune Cell Infiltration in Tumors: The consistent increase in conventional T cell subsets, particularly Cytotoxic T cells, in all breast cancer subtypes (ER+, HER2+, TNBC) indicates an active recruitment and presence of adaptive immune cells within the tumor microenvironment (TME). This suggests the immune system is recognizing and attempting to respond to the tumor.
Balance of Anti-tumor and Pro-tumor T Cells
- Cytotoxic T cells: Their significant presence across tumor subtypes, especially TNBC, highlights their crucial role in anti-tumor immunity by directly killing cancer cells.
- Cytotoxic T cells in cancer immunity: PubMed Review
- Regulatory T cells (Tregs): The sustained presence of Tregs in tumor samples is a hallmark of immune evasion. Tregs actively suppress anti-tumor immune responses by inhibiting effector T cell functions, thereby promoting tumor growth and progression. The co-existence of high Cytotoxic T cells and Tregs in TNBC suggests an ongoing 'immune battle' where suppressive mechanisms are active.
- Regulatory T cells in cancer immunosuppression: PubMed Review
- Subtype-Specific Immune Profiles: The high relative proportion of Cytotoxic T cells in TNBC aligns with its characterization as an "immune-hot" tumor, often exhibiting higher tumor mutational burden and more robust immune infiltration compared to other breast cancer subtypes. However, the accompanying high Treg population underscores the complex immunosuppressive nature of the TNBC microenvironment.
- Immune microenvironment in triple-negative breast cancer: PubMed Review
Clinical or Translational Implications
The findings have several important clinical and translational implications:
- Immunotherapy Responsiveness: The presence of abundant Cytotoxic T cells in all breast cancer subtypes, particularly TNBC, suggests that these patients could potentially benefit from immune checkpoint inhibitors (ICIs) which aim to unleash these effector T cells. However, the concurrent presence of high Treg populations indicates a strong immunosuppressive TME, which may limit ICI efficacy.
- Prognostic Biomarkers: The relative proportions and ratios of immune cell subsets, such as the cytotoxic T cell to Treg ratio, could serve as important prognostic biomarkers to predict patient outcomes and response to therapy. A higher anti-tumorigenic to pro-tumorigenic immune cell ratio is generally associated with better prognosis.
- Therapeutic Strategies for Immunosuppression: Understanding the specific T cell subset composition highlights targets for combination therapies. Strategies that aim to deplete or reprogram Tregs (e.g., with specific antibodies or small molecules) or enhance Th1-type responses in conjunction with existing immunotherapies could potentially overcome immune suppression and improve therapeutic outcomes, especially in tumors with high Treg infiltration.
- Novel Therapeutic Targets: The observed depletion of ILCs and NK cells in tumor microenvironments compared to normal tissue suggests a potential loss of innate immune surveillance. Investigating methods to restore or augment the function of these innate immune cells could represent novel therapeutic avenues for cancer treatment.
8. T Cell Subset Population Differences Across Breast Cancer Conditions
[Analysis Visualization Results]...
Analysis Overview
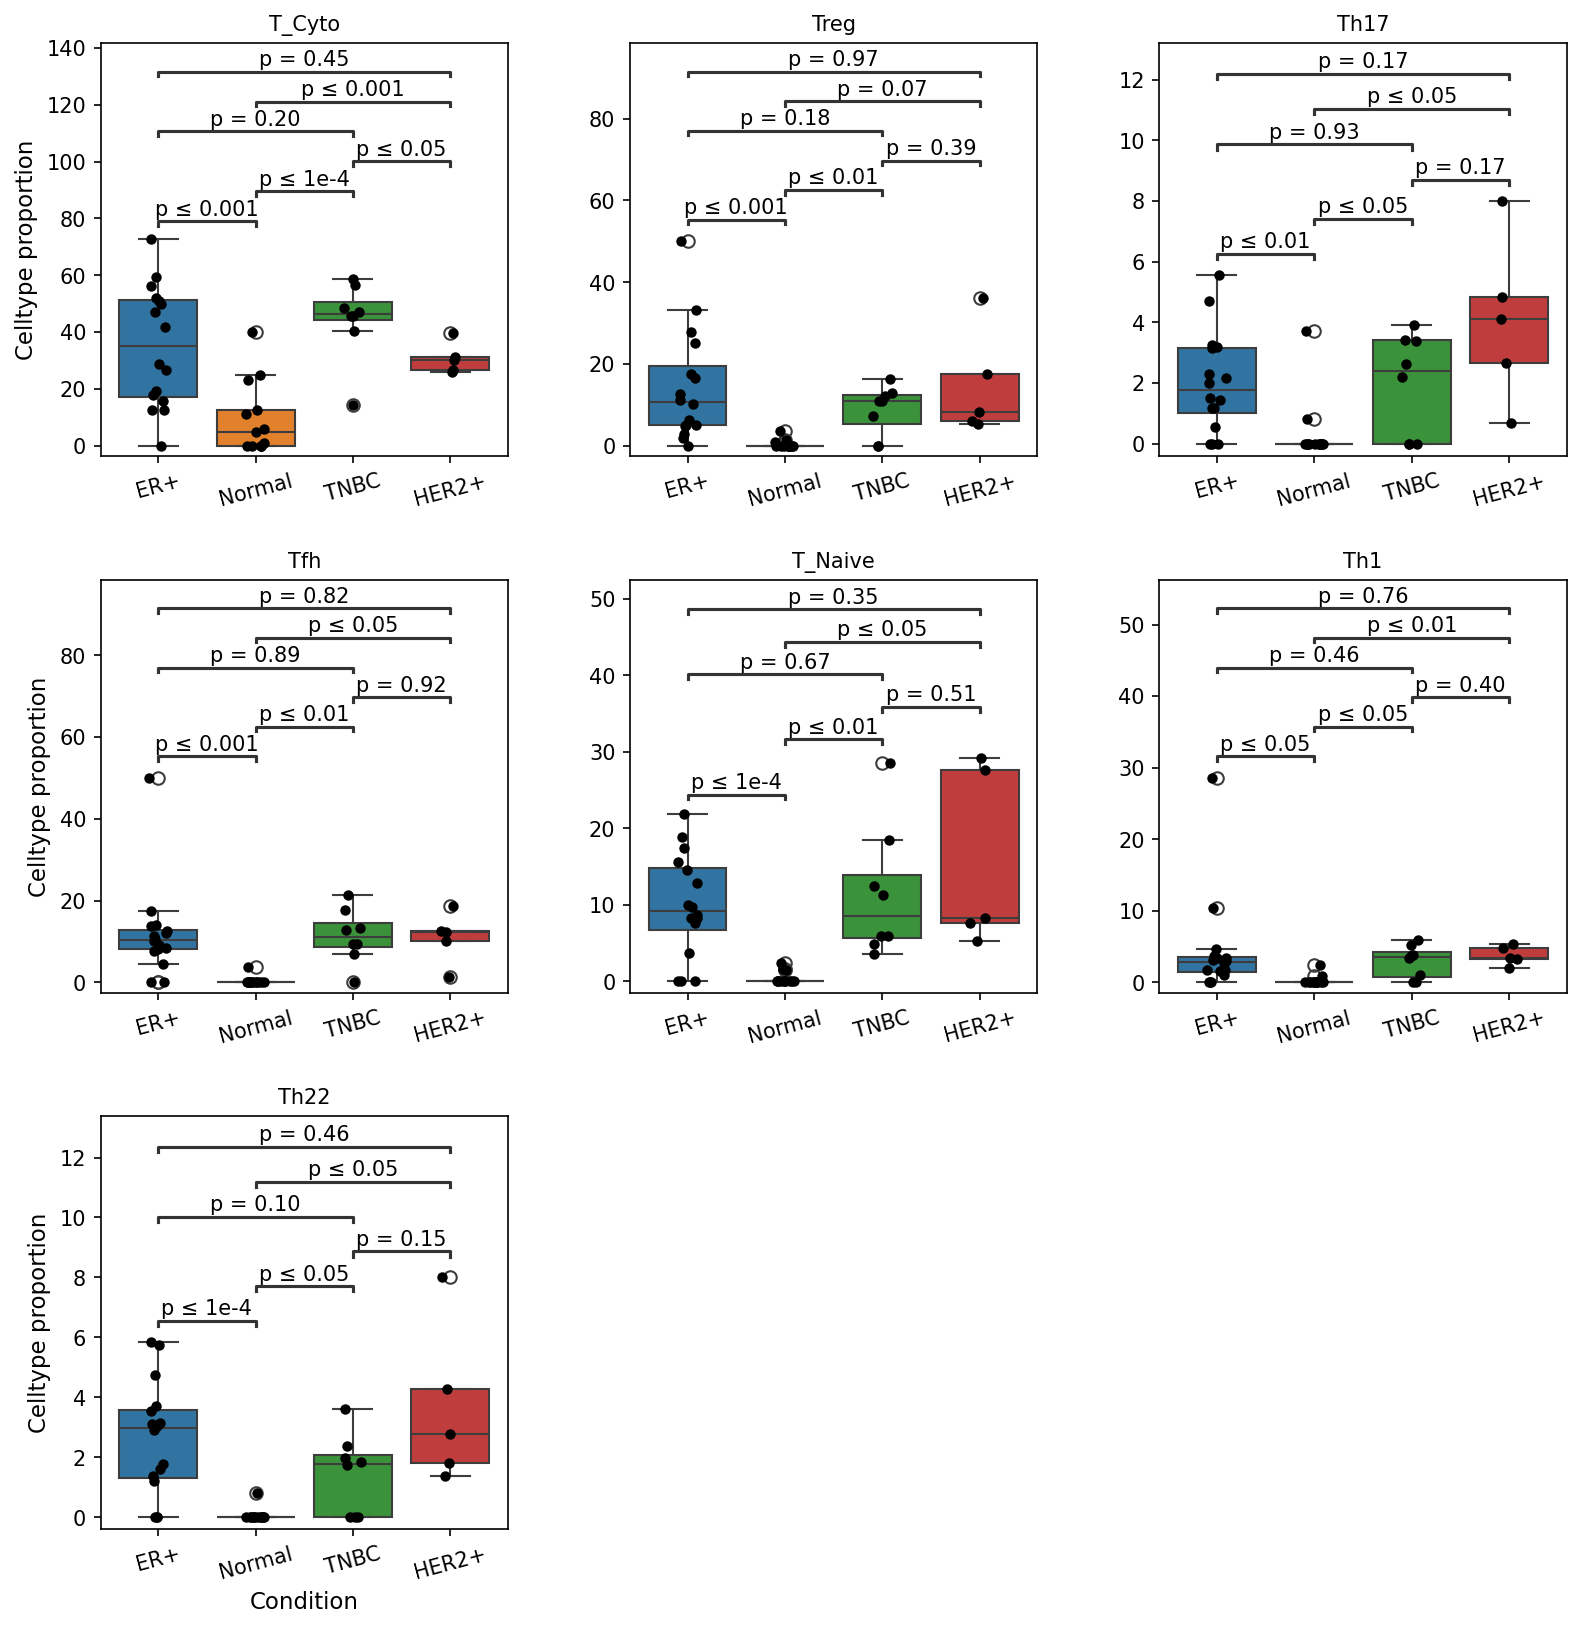
This analysis investigates the proportional representation of various T cell subsets within different breast tissue conditions: Normal, Estrogen Receptor-positive (ER+), Triple-negative breast cancer (TNBC), and Human Epidermal growth factor Receptor 2-positive (HER2+). Box plots are used to visualize the distribution of each T cell subset's proportion per condition, and statistical significance tests (p-values) highlight notable differences between groups.
Visual Summary
The box plots illustrate statistically significant differences in the proportions of several T cell subsets across different breast cancer conditions compared to normal tissue, and also among cancer subtypes.
T cell (Cytotoxic) (T_Cyto)
- Significantly higher proportions of cytotoxic T cells are observed in all breast cancer conditions (ER+, TNBC, HER2+) compared to Normal tissue (p ≤ 0.001, p ≤ 1e-4, p ≤ 0.05, respectively).
- TNBC samples exhibit a significantly higher proportion of cytotoxic T cells compared to ER+ (p ≤ 0.001), indicating a potentially more inflamed or immune-responsive microenvironment in TNBC.
T cell (Treg) (Treg)
- Regulatory T cells are significantly enriched in ER+ (p ≤ 0.001), TNBC (p ≤ 0.01), and show a trend of enrichment in HER2+ (p = 0.07) conditions compared to Normal tissue.
- ER+ breast cancer samples display a significantly higher proportion of Tregs compared to TNBC (p ≤ 0.01).
T cell (Th17)
- Th17 cells show significantly higher proportions in TNBC and HER2+ conditions compared to Normal tissue (p ≤ 0.05 for both).
T cell (Tfh) (Tfh)
- Follicular helper T cells are significantly more abundant in all cancer conditions (ER+, TNBC, HER2+) compared to Normal tissue (p ≤ 0.001, p ≤ 0.01, p ≤ 0.05, respectively).
T cell (Naive) (T_Naive)
- Naive T cells are found in significantly higher proportions in ER+ (p ≤ 1e-4) and HER2+ (p ≤ 0.01) conditions compared to Normal.
- Interestingly, HER2+ samples exhibit a significantly higher proportion of naive T cells than ER+ samples (p ≤ 0.05).
T cell (Th1) (Th1)
- Th1 cells are present in significantly higher proportions in ER+ breast cancer compared to Normal tissue (p ≤ 0.05).
T cell (Th22) (Th22)
- Th22 cells are significantly more abundant in ER+ (p ≤ 1e-4) and HER2+ (p ≤ 0.05) conditions compared to Normal tissue.
Biological Interpretation
The observed shifts in T cell subset populations provide critical insights into the distinct immune landscapes of different breast cancer subtypes.
- General Immune Infiltration in Cancer: Most T cell subsets, including cytotoxic T cells, Tregs, Tfh, Th17, Th1, Th22, and naive T cells, show increased proportions in breast cancer conditions compared to normal breast tissue. This broadly indicates immune cell recruitment and infiltration into the tumor microenvironment (TME), a common feature of solid tumors.
- Cytotoxic T Cells (T_Cyto) and Anti-Tumor Immunity: The elevated proportion of cytotoxic T cells in all cancer subtypes suggests an attempt by the immune system to combat the tumor. The significantly higher proportion in TNBC compared to ER+ is particularly notable. TNBC is often characterized by a "hot" or immune-inflamed phenotype, making it more responsive to immunotherapy targeting cytotoxic T cell activity, such as PD-1/PD-L1 inhibitors. This finding aligns with the general understanding that higher cytotoxic T cell infiltration correlates with better prognosis and response to immunotherapy in various cancers, including TNBC PubMed Search: cytotoxic T cells breast cancer immunotherapy prognosis.
- Regulatory T Cells (Treg) and Immune Evasion: The increased proportion of Tregs in all cancer conditions, and particularly their higher abundance in ER+ compared to TNBC, points to distinct immune evasion strategies. Tregs suppress anti-tumor immune responses, promoting tumor growth. Higher Treg infiltration in ER+ breast cancer may contribute to an immunosuppressive TME, potentially dampening the effectiveness of anti-tumor immunity PubMed Search: regulatory T cells breast cancer immune evasion.
- Helper T Cell Subsets (Th1, Th17, Th22, Tfh):
- Th1 cells, known for their pro-inflammatory and anti-tumor roles, are increased in ER+ compared to Normal, suggesting some level of type 1 immune response.
- Th17 cells, which have context-dependent roles in cancer (both pro- and anti-tumorigenic), are increased in TNBC and HER2+ PubMed Search: Th17 cells breast cancer prognosis. Their presence suggests inflammatory processes that may either aid or hinder tumor progression depending on the specific cytokines and context.
- Th22 cells, involved in tissue inflammation and epithelial immunity, are also elevated in ER+ and HER2+ breast cancer.
- Tfh cells, crucial for B cell maturation and antibody production, are increased across all cancer types. This might indicate the formation of tertiary lymphoid structures within the TME, which can contribute to both anti-tumor immunity and immune suppression PubMed Search: T follicular helper cells cancer.
- Naive T Cells (T_Naive): The elevated naive T cell proportion in ER+ and HER2+ conditions, especially higher in HER2+ compared to ER+, suggests differences in T cell recruitment, activation, or persistence within these tumor types. The presence of naive T cells could indicate ongoing immune cell trafficking into the TME and potential for future immune activation.
Clinical or Translational Implications
These findings highlight subtype-specific immune landscapes in breast cancer, which have significant clinical and translational implications:
- Immunotherapy Stratification: The distinct T cell profiles, particularly the high cytotoxic T cell infiltration in TNBC and higher Tregs in ER+, could serve as biomarkers for stratifying patients for immunotherapy. TNBC patients, with their more "inflamed" TME, might benefit more from checkpoint inhibitors, while strategies to deplete Tregs or overcome their suppressive function might be particularly relevant for ER+ breast cancer.
- Prognostic Markers: The proportions of specific T cell subsets could potentially serve as prognostic markers. For instance, a higher cytotoxic T cell to Treg ratio is generally associated with better outcomes in many cancers PubMed Search: CD8 Treg ratio prognosis cancer.
- Targeting Immunosuppression: Understanding the specific immune cell types enriched in each subtype (e.g., Tregs in ER+ breast cancer) can guide the development of targeted immunotherapies designed to reverse immune suppression or enhance anti-tumor immunity.
- Understanding Treatment Resistance: Differences in T cell composition could also contribute to varying responses to conventional therapies or explain mechanisms of treatment resistance, informing combination therapy strategies.
9. Macrophage Subset Population Analysis Across Breast Cancer Subtypes
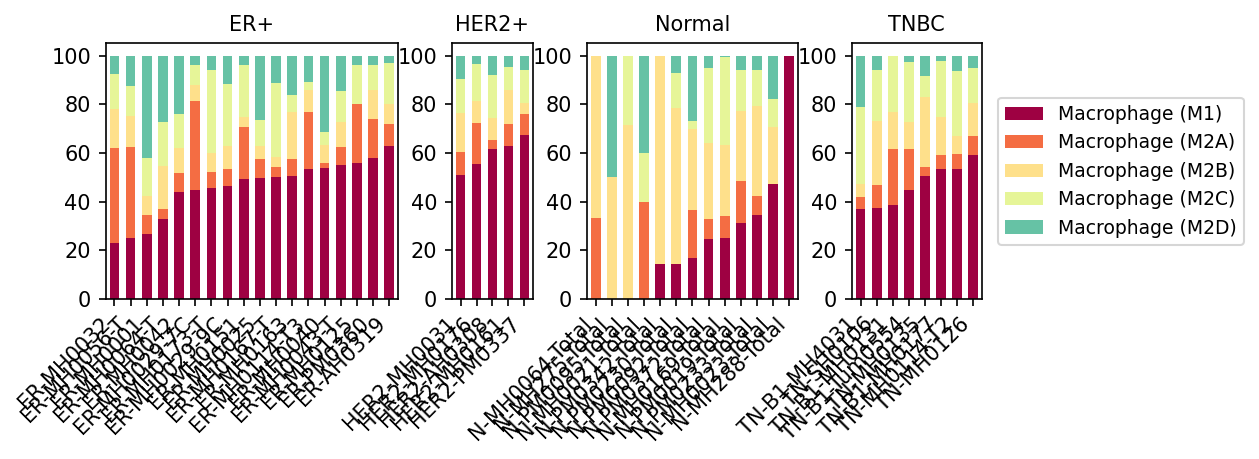
[Analysis Visualization Results]...
Analysis Overview
This analysis visualizes the relative proportions of different macrophage subsets (M1, M2A, M2B, M2C, M2D) within individual samples, grouped by distinct breast cancer conditions (ER+, HER2+, TNBC) and normal breast tissue. The data is derived from single-cell RNA-seq, providing insights into the cellular composition of the tumor microenvironment (TME) with a focus on macrophage polarization states.
Visual Summary
The stacked bar plot presents the percentage of each macrophage subset for every sample.
- M1 Macrophages (maroon): In normal breast tissue, M1 macrophages constitute a relatively small proportion. However, in all breast cancer conditions (ER+, HER2+, TNBC), M1 macrophages consistently represent a significantly larger proportion, often becoming the dominant subset within the total macrophage population across many samples.
- M2B Macrophages (beige): This subset is notably abundant in normal breast tissue, frequently appearing as a major component of the macrophage population. In contrast, while still present, its relative proportion appears generally reduced in most cancer samples compared to normal tissue.
- M2A (orange), M2C (light green), and M2D (teal) Macrophages: These M2 subsets show more variable proportions across individual samples and conditions. M2A appears to contribute more substantially in some normal and cancer samples, while M2C and M2D generally represent smaller fractions of the total macrophage pool across all conditions.
- Overall Shift: There is a clear shift in macrophage polarization from normal tissue to tumor conditions. Normal tissue macrophages tend to be dominated by M2B, while cancer tissues show a prominent increase in M1 macrophages, alongside varying contributions from other M2 subtypes.
- Inter-sample Variability: Significant heterogeneity in macrophage subset proportions is observed among individual samples within each condition, highlighting the diverse immune landscapes even within a given breast cancer subtype.
Biological Interpretation
Macrophages are highly plastic immune cells that play critical roles in both tumor suppression and promotion within the tumor microenvironment. They can polarize into various functional states, broadly categorized as M1 (classically activated) and M2 (alternatively activated), with further subdivisions within the M2 spectrum.
- M1 Macrophages and Anti-tumor Immunity: M1 macrophages are typically characterized by pro-inflammatory functions, including robust phagocytic activity, antigen presentation, and secretion of cytokines like TNF-α and IL-12, which are associated with anti-tumor immunity. The observed increase in M1 macrophage proportions in ER+, HER2+, and TNBC breast cancers compared to normal tissue suggests an active inflammatory response attempting to control tumor growth [1]. However, the efficacy of this M1-driven response can be dampened or subverted by other immune-suppressive components of the TME.
- M2 Macrophages and Tumor Promotion: M2 macrophages are generally associated with anti-inflammatory responses, tissue repair, angiogenesis, and immune suppression, which can contribute to tumor progression.
- M2B Macrophages: These macrophages are often linked to immune regulation and can be induced by immune complexes or IL-1R/TLR agonists. Their dominance in normal tissue suggests a role in maintaining tissue homeostasis or basal immune regulation. Their relative decrease in cancer might reflect a shift away from this homeostatic state towards more tumor-driven polarization.
- Other M2 Subtypes (M2A, M2C, M2D): While M2A is often associated with wound healing and Th2 responses, M2C (induced by IL-10 or TGF-β) is known for immune suppression and tissue remodeling, and M2D (induced by TLR agonists and adenosine A2A receptor activation) is linked to angiogenesis and tumor growth [2, 3]. The variable presence of these subtypes across cancer samples underscores the complexity and heterogeneity of M2 macrophage functions in the TME.
- Shift in Macrophage Polarization in Cancer: The general trend of increased M1 macrophages and decreased M2B macrophages in breast cancer relative to normal tissue indicates a significant re-polarization of the macrophage population. This shift is likely driven by tumor-secreted factors and signals from other stromal and immune cells within the TME, influencing macrophage differentiation and function to either suppress or promote tumor growth.
Clinical or Translational Implications
- Immunotherapeutic Targets: The dynamic interplay between M1 and M2 macrophage subsets presents a critical area for therapeutic intervention in breast cancer. Strategies aimed at re-educating or re-polarizing pro-tumorigenic M2 macrophages towards an anti-tumorigenic M1 phenotype, or inhibiting M2-mediated immune suppression, could enhance anti-tumor immunity [4].
- Biomarker Potential: The specific distribution and balance of macrophage subsets (e.g., M1/M2 ratio) within the TME could serve as prognostic biomarkers, predicting disease progression, or as predictive biomarkers for response to immunotherapy or other treatments. The observed sample-to-sample variability emphasizes the importance of analyzing individual patient samples to tailor treatment strategies.
- Subtype-Specific Immunotherapy: While all cancer subtypes show an M1 increase, the subtle differences in M2 subtype representation might inform subtype-specific immunotherapeutic approaches. For instance, interventions targeting specific M2 subsets (e.g., M2C or M2D) might be more effective in certain breast cancer types where these populations are more prominent or functionally critical.
---
References:
- Macrophage Polarization in Cancer:
PubMed search: macrophage M1 M2 cancer
- M2 Macrophage Subsets in Cancer:
- Macrophage Plasticity and Functional Diversity:
PubMed search: macrophage plasticity M2 subtypes
- Targeting Macrophages in Cancer Therapy:
PubMed search: targeting macrophages cancer therapy
10. Macrophage Subset Population Shifts Across Breast Cancer Subtypes
[Analysis Visualization Results]...
Analysis Overview
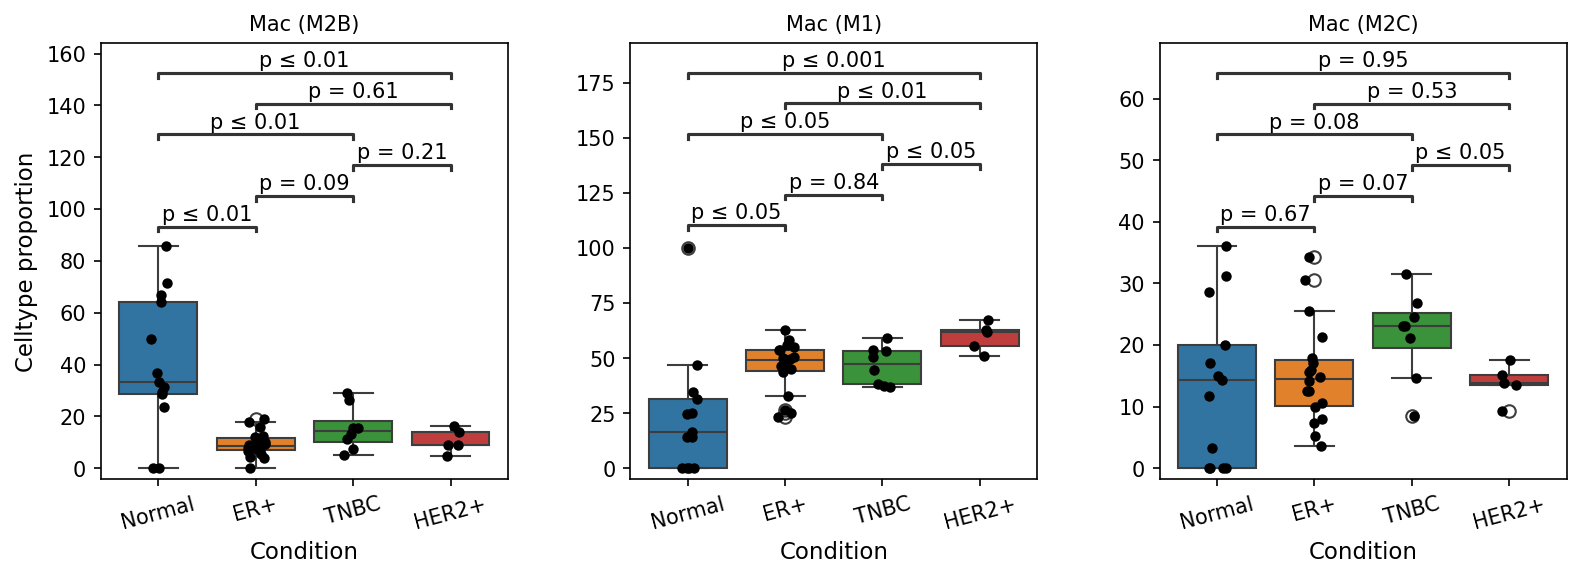
This analysis investigates statistically significant differences in the proportional representation of specific macrophage subsets (Macrophage M1, M2B, and M2C) across various breast tissue conditions: Normal, Estrogen Receptor-positive (ER+), Triple-negative breast cancer (TNBC), and Human Epidermal growth factor Receptor 2-positive (HER2+). The proportions of these macrophage subsets were compared between each cancer subtype and the 'Normal' reference condition, as well as between different cancer subtypes.
Visual Summary
The box plots illustrate the celltype proportion for three macrophage subsets across the four conditions. Each black dot represents the proportion from an individual sample. Statistical significance (p-value ≤ 0.1) is indicated by brackets above the plots.
Macrophage (M2B)
- The proportion of Macrophage (M2B) cells is significantly lower in all breast cancer subtypes (ER+, TNBC, HER2+) compared to Normal breast tissue (p ≤ 0.01 for all comparisons).
- Within cancer subtypes, ER+ shows a slightly lower proportion than TNBC, approaching statistical significance (p = 0.09).
Macrophage (M1)
- In contrast to M2B, the proportion of Macrophage (M1) cells is significantly *higher* in all breast cancer subtypes (ER+, TNBC, HER2+) compared to Normal breast tissue (p ≤ 0.05 for all comparisons).
- HER2+ breast cancer shows the highest proportion of M1 macrophages, significantly greater than both ER+ (p ≤ 0.01) and TNBC (p ≤ 0.001).
- There are no significant differences in M1 proportion between ER+ and TNBC.
Macrophage (M2C)
- The proportion of Macrophage (M2C) cells shows a varied pattern across conditions.
- TNBC exhibits a borderline significantly higher proportion of M2C macrophages compared to Normal tissue (p = 0.07) and ER+ (p = 0.08).
- Conversely, HER2+ breast cancer shows a significantly *lower* proportion of M2C macrophages compared to Normal tissue (p ≤ 0.05).
- No significant difference is observed between Normal and ER+, or between ER+, TNBC, and HER2+ otherwise.
Biological Interpretation
Macrophages are a critical component of the tumor microenvironment (TME), and their polarization into distinct functional subsets significantly influences tumor progression or regression. The observed shifts in macrophage subsets suggest specific immunological landscapes for different breast cancer subtypes:
- Decreased M2B Macrophages in Breast Cancer: M2B macrophages are generally considered regulatory and can have pro-tumorigenic roles through immune modulation. Their significant reduction in all breast cancer subtypes compared to normal tissue is intriguing. This might suggest a general shift away from this specific M2 subtype, or perhaps M2B cells are undergoing further differentiation or phenotypic change within the complex TME that renders them less identifiable as M2B. Further investigation into the specific functions of these M2B cells in the breast context is warranted.
- Elevated M1 Macrophages as a Consistent Response: The consistent and significant increase in pro-inflammatory M1 macrophages across all breast cancer subtypes (ER+, TNBC, HER2+) compared to normal tissue is a notable finding. M1 macrophages are typically associated with anti-tumor immunity, characterized by their ability to kill tumor cells directly or through the secretion of pro-inflammatory cytokines such as TNF-α and IL-1β [PubMed Search: M1 macrophage anti-tumor]. This elevation suggests an active host immune response within the tumor environment. The especially high M1 proportion in HER2+ breast cancer could contribute to or be a consequence of the distinct immune characteristics often observed in HER2+ tumors. This could be relevant for understanding the efficacy of certain immunotherapies or targeted therapies in HER2+ breast cancer.
- Differential M2C Macrophage Dynamics: M2C macrophages are generally associated with immunosuppression, tissue remodeling, and fibrosis, often promoting tumor growth [GeneCards: M2C macrophage]. The observed borderline increase in M2C in TNBC compared to normal tissue and ER+ suggests that TNBC, a highly aggressive subtype with limited targeted therapies, might foster an immunosuppressive TME through enrichment of this specific M2 subset. In stark contrast, HER2+ tumors show a significant *decrease* in M2C macrophages compared to normal tissue. This divergent pattern for M2C between TNBC and HER2+ highlights distinct immunological strategies employed by these different breast cancer subtypes and may contribute to their varied clinical behaviors and responses to treatment.
Clinical or Translational Implications
These findings suggest that the composition of macrophage subsets within the breast TME is highly specific to the cancer subtype, potentially influencing disease progression and treatment response.
- The consistently high M1 macrophage populations in breast cancer, especially in HER2+ tumors, could indicate a potential for immunotherapy or strategies that enhance M1-mediated anti-tumor functions. Understanding what drives this M1 polarization could uncover new therapeutic targets.
- The relative enrichment of immunosuppressive M2C macrophages in TNBC, coupled with the general reduction of M2B, suggests that TNBC might benefit from therapies aimed at reprogramming macrophages from an M2C-like state towards a more anti-tumoral M1 phenotype, or depleting M2C populations.
- The distinct macrophage profiles across breast cancer subtypes underscore the importance of precision medicine approaches. Therapeutic strategies targeting macrophages might need to be tailored not just to the presence of macrophages, but to the specific polarization state prevalent in each tumor type. For example, a treatment strategy effective in HER2+ tumors might not be suitable for TNBC, given their differing M2C macrophage proportions.
11. Ploidy Population Analysis of Epithelial and Unassigned Cells Across Breast Cancer Subtypes and Normal Tissue
[Analysis Visualization Results]...
Analysis Overview
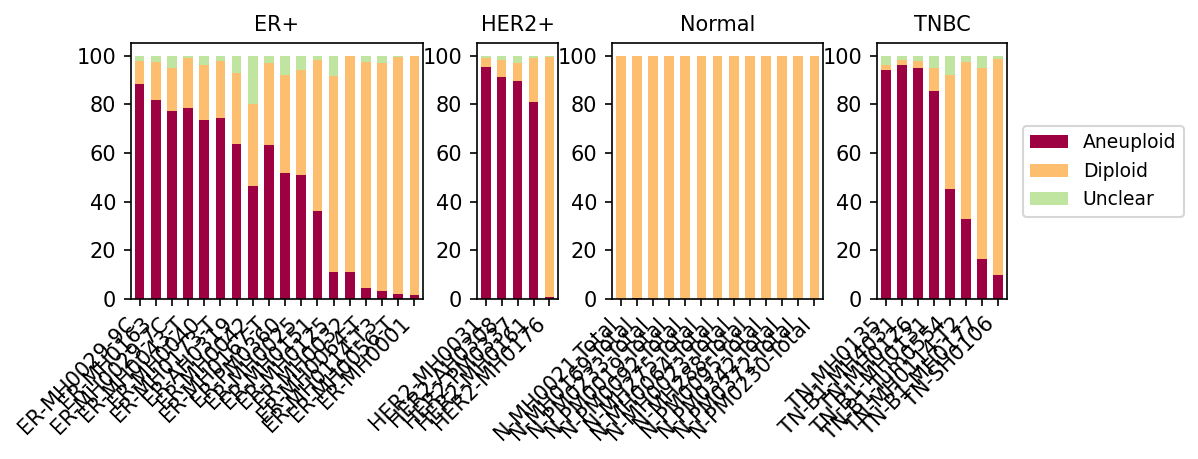
This analysis visualizes the ploidy status (Aneuploid, Diploid, Unclear) of cells identified as "Epithelial cell" (the tumor origin cell type in this dataset) and "unassigned" cells across various breast tissue conditions: ER+ breast cancer, HER2+ breast cancer, TNBC (Triple-Negative Breast Cancer), and Normal tissue. The results are presented as stacked bar plots, with each bar representing a distinct patient sample, allowing for a detailed examination of genomic stability at a single-cell level within these specific cell populations.
Visual Summary
The stacked bar plot provides a clear representation of ploidy distribution for epithelial and unassigned cells within individual samples, grouped by condition:
- Normal Condition: Across all normal samples, the epithelial and unassigned cell populations are almost exclusively Diploid (indicated by the orange bars). Aneuploidy (dark red bars) is virtually absent, and the "Unclear" category (light green bars) is minimal. This serves as a critical baseline, indicating genomic stability in healthy tissue.
- ER+ Breast Cancer: Samples from ER+ patients show a variable but notable presence of Aneuploid cells. While some samples (e.g., ER-MH029-96, ER-MH004-97) exhibit a high proportion of aneuploid cells (over 80%), others (e.g., ER-MH044-13, ER-MH001) are predominantly diploid. This heterogeneity in aneuploidy levels among ER+ samples is a key observation.
- HER2+ Breast Cancer: All HER2+ samples display a very high proportion of Aneuploid cells, often exceeding 80-90% of the population in these targeted cell types (e.g., HER2-MH0031, HER2-PM0308). This suggests a widespread genomic instability characteristic of this subtype.
- TNBC (Triple-Negative Breast Cancer): Similar to HER2+, TNBC samples also show a high prevalence of Aneuploid cells. Most TNBC samples contain a substantial fraction of aneuploid cells, with some samples showing nearly 100% aneuploidy (e.g., TN-MH0135, TN-BM0341). However, some samples (e.g., TN-SH0106) show a lower, but still present, aneuploid population, similar to the variability seen in ER+ cases.
- "Unclear" Category: The proportion of cells categorized as "Unclear" in their ploidy status is consistently very low across all conditions and samples, indicating high confidence in the Diploid or Aneuploid assignments.
Biological Interpretation
Aneuploidy, defined as an abnormal number of chromosomes, is a hallmark of cancer and reflects widespread genomic instability. The observed patterns in this analysis strongly align with known cancer biology:
- Genomic Stability in Normal Tissue: The near-exclusive diploidy in normal epithelial and unassigned cells confirms that healthy breast tissue maintains genomic integrity. This lack of aneuploidy is expected for normal somatic cells.
- Aneuploidy as a Feature of Malignancy: The significant presence of aneuploid cells in tumor samples (ER+, HER2+, TNBC) for the "Epithelial cell" population (which is identified as the tumor origin cell type) provides strong evidence for their malignant transformation. This indicates that these tumor cells have undergone substantial chromosomal alterations. The "unassigned" cell population, which also shows aneuploidy in tumor conditions, might include a mixture of highly aberrant tumor cells that are difficult to classify or other stromal cells undergoing genomic changes in the tumor microenvironment.
Differential Aneuploidy Across Subtypes
- HER2+ and TNBC subtypes consistently exhibit a high degree of aneuploidy across most samples. These subtypes are often associated with higher genomic instability, more aggressive behavior, and a greater burden of somatic mutations compared to ER+ breast cancer.
- ER+ breast cancer shows more heterogeneity in aneuploidy levels among samples. This might reflect the biological diversity within ER+ tumors, which can range from relatively indolent to more aggressive forms, and also potentially different stages of tumor progression. Some ER+ tumors might be less chromosomally unstable or have different evolutionary trajectories.
Clinical or Translational Implications
Understanding the ploidy status of tumor-origin cells has several clinical and translational implications:
- Diagnostic and Prognostic Marker: The presence and degree of aneuploidy can serve as a diagnostic marker for malignancy, distinguishing tumor cells from normal cells. High levels of aneuploidy are often associated with more aggressive tumors and can be a prognostic indicator for poorer outcomes in breast cancer, correlating with features like higher histological grade and increased proliferation [1].
- Therapeutic Sensitivity: Genomic instability and aneuploidy can influence a tumor's response to therapy. For example, tumors with high aneuploidy might be more sensitive to certain genotoxic chemotherapies that exacerbate DNA damage, or conversely, may exhibit increased resistance due to rapid adaptation and clonal evolution. High levels of genomic instability, often reflected by aneuploidy, can be linked to vulnerabilities that can be therapeutically targeted, such as through PARP inhibitors in specific contexts like BRCA1/2 deficient tumors [2].
- Tumor Heterogeneity: The observed variability in aneuploidy within ER+ samples highlights intra-subtype heterogeneity, which can impact treatment decisions and prognosis. Patients with ER+ tumors exhibiting higher aneuploidy might require more aggressive treatment strategies or closer monitoring.
- Monitoring Tumor Evolution: Analyzing ploidy over time (e.g., in liquid biopsies or serial tissue samples) could provide insights into tumor evolution and the emergence of resistant clones, which often accumulate further genomic aberrations.
---
References:
- Aneuploidy and Prognosis in Breast Cancer: A PubMed search for "breast cancer aneuploidy prognosis" can yield numerous relevant studies. PubMed Search: Breast Cancer Aneuploidy Prognosis
- Genomic Instability and Therapeutic Targeting (e.g., PARP inhibitors): A general understanding of how genomic instability is exploited for cancer therapy. PubMed Search: Genomic instability cancer therapy PARP inhibitors
12. Breast Cancer Cell-Cell Interaction Patterns Across Subtypes and Normal Tissue
[Analysis Visualization Results]...
Analysis Overview
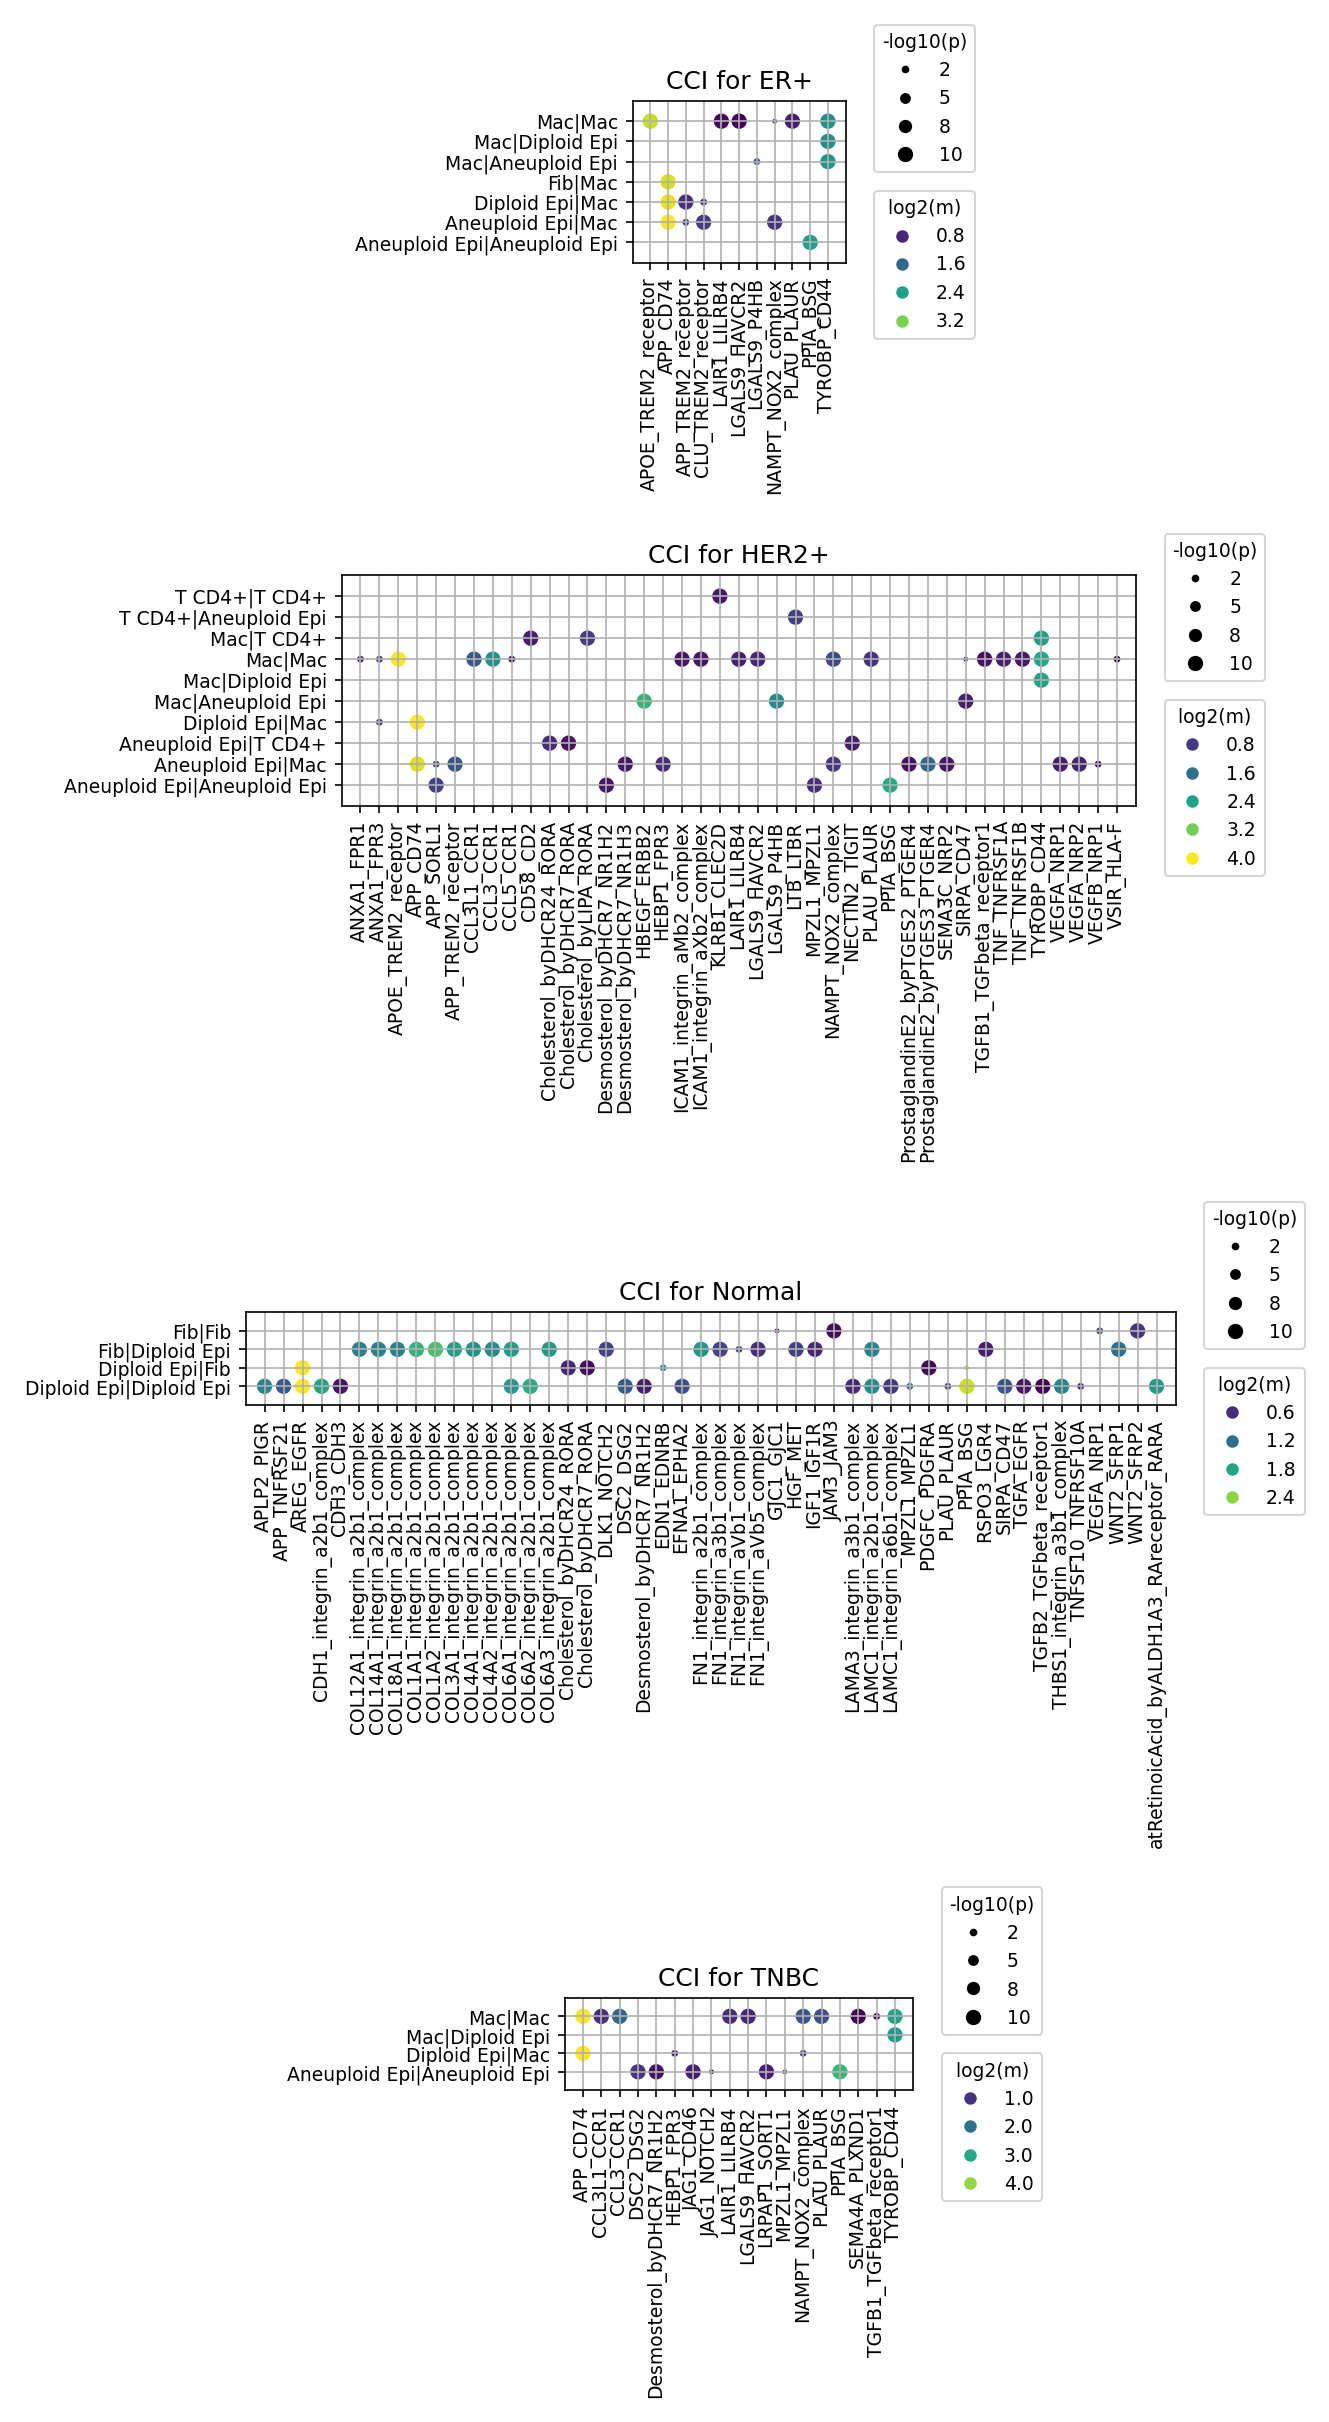
이 분석은 유방암의 다양한 조건(ER+, HER2+, TNBC)과 정상 조직에서 주요 세포 유형 간의 세포-세포 상호작용(Cell-Cell Interaction, CCI) 패턴을 시각화합니다. CellPhoneDB를 사용하여 리간드-수용체 상호작용을 예측했으며, 상위 80개의 가장 유의미하고 발현이 높은 상호작용을 조건별로 시각화했습니다. 분석에는 암의 기원 세포인 상피 세포(Epithelial cell)를 종양 세포와 비종양 세포로 구분하기 위해 이수성(Aneuploid) 상피 세포와 이배성(Diploid) 상피 세포로 확장하여 포함했으며, 섬유아세포(Fibroblast), 대식세포(Macrophage), T 세포(CD4+ T cell, CD8+ T cell) 등 종양 미세환경의 핵심 구성 요소를 포함했습니다.
Visual Summary
제공된 점도표(dot plot)들은 각 조건(Normal, ER+, HER2+, TNBC)별로 선별된 세포 유형 간의 리간드-수용체 상호작용의 유의성(점의 크기, -log10(p-value))과 평균 발현 수준(점의 색상, log2(mean))을 보여줍니다.
- Normal 조직: 주로 Fibroblast와 Diploid Epithelial cell 간의 상호작용이 지배적입니다. 이는 콜라겐-인테그린(collagen-integrin) 복합체와 같은 세포외기질(ECM) 관련 상호작용, HGF-MET, IGF1-IGF1R, PDGFB-PDGFRA/B와 같은 성장 인자 신호 전달, 그리고 WNT 신호 전달 경로가 풍부합니다. 이는 정상 조직의 구조적 무결성, 성장 및 분화에 필수적인 상호작용을 반영합니다.
- ER+ 유방암: 대식세포(Macrophage)와 이수성 상피 세포(Aneuploid Epi) 간의 상호작용이 두드러집니다. APOE-TREM2 receptor, CLU-TREM2 receptor, APP-CD74, LAIR1-LILRB4, LGALS9-HAVCR2 (Galectin-9/TIM-3), NAMPT-NOX2 complex, PPLAU-PLAUR (uPA/uPAR) 등의 상호작용이 높은 유의성과 발현 수준을 보입니다. 이는 대식세포가 종양 미세환경에서 중요한 역할을 하며, 특히 면역 억제 및 종양 진행과 관련된 경로가 활성화됨을 시사합니다.
- HER2+ 유방암: Normal 조직보다 훨씬 더 복잡하고 다양한 상호작용 패턴을 보입니다. CD4+ T cell, Macrophage, 그리고 Aneuploid Epithelial cell 간의 상호작용이 활발합니다. 주목할 만한 상호작용으로는 HBGEGF-ERBB2 (HER2), VEGF-VEGFR/NRP1, TGFB1-TGFBeta_receptor1, NECTIN2-TIGIT, LGALS9-HAVCR2 (Galectin-9/TIM-3), ProstaglandinE2-PTGER2/4 등이 있습니다. 이는 HER2+ 아형의 특징적인 성장 인자 경로 활성화와 함께 강력한 면역 조절 및 혈관 신생 상호작용을 반영합니다.
- TNBC (삼중 음성 유방암): ER+와 유사하게 Macrophage와 Aneuploid Epithelial cell 간의 상호작용이 우세합니다. 주요 상호작용에는 LGALS9-HAVCR2 (Galectin-9/TIM-3), TGFB1-TGFBeta_receptor1, LILRB4 관련 상호작용, JAG1-NOTCH2, PPLAU-PLAUR (uPA/uPAR), NAMPT-NOX2 complex 등이 포함됩니다. 이러한 상호작용은 TNBC의 면역 억제적이고 침습적인 종양 미세환경 특징을 보여줍니다.
Biological Interpretation
이 분석은 유방암 아형별로 종양 미세환경(TME) 내 세포-세포 상호작용 네트워크가 현저히 다르다는 것을 보여줍니다.
- 정상 조직의 항상성: 정상 유방 조직에서는 Fibroblast와 Diploid Epithelial cell이 ECM 구성 및 성장 인자 신호 전달을 통해 조직 구조 유지 및 세포 성장 조절에 핵심적인 역할을 합니다. 이는 정상적인 조직 발달 및 유지에 필수적인 기전을 나타냅니다.
- 종양 미세환경의 재편: 모든 암 아형에서 이수성 상피 세포(종양 세포)는 대식세포 및 기타 세포와 활발하게 상호작용하여 종양 진행을 촉진하는 환경을 조성합니다. 특히 대식세포(Tumor-Associated Macrophages, TAMs)는 모든 암 아형에서 핵심적인 상호작용 허브로 나타나며, 면역 억제, 종양 세포 생존, 침윤 및 전이를 지원하는 다양한 리간드-수용체 쌍에 관여합니다.
면역 억제 기전의 공유 및 특이성
- LGALS9-HAVCR2 (Galectin-9/TIM-3) 축과 TGFB1-TGFBeta_receptor1 축: ER+, HER2+, TNBC를 포함한 모든 암 아형에서 대식세포와 이수성 상피 세포 간에 일관되게 나타나는 중요한 상호작용입니다. TIM-3는 T 세포 및 대식세포에서 발견되는 면역 체크포인트 수용체로, Galectin-9과의 결합은 면역 세포의 기능을 억제하고 종양 관용을 유도할 수 있습니다. TGF-β 신호는 강력한 면역 억제 효과와 함께 종양 성장 및 전이를 촉진합니다.
- LILRB4: ER+ 및 TNBC에서 대식세포를 포함한 골수성 세포에서 발현되는 LILRB4 수용체와 관련된 상호작용이 나타나며, 이는 면역 억제에 기여할 수 있습니다.
- NECTIN2-TIGIT: HER2+에서 나타나는 TIGIT 면역 체크포인트 축은 또 다른 면역 회피 전략을 시사합니다.
- HER2+ 아형의 특이성: HBGEGF-ERBB2 (HER2) 상호작용은 HER2+ 유방암의 중요한 특징입니다. HB-EGF는 HER2 수용체를 활성화하여 종양 세포의 증식과 생존을 촉진할 수 있으며, 이는 HER2+ 암의 핵심 발병 기전에 직접적으로 관여합니다. 또한 VEGF 신호 전달이 HER2+에서 강력하게 나타나 혈관 신생의 중요성을 강조합니다. T 세포와의 상호작용이 다른 아형에 비해 더 뚜렷하게 나타나는 점은 HER2+ 유방암이 상대적으로 면역원성이 높을 수 있음을 시사합니다.
- 종양 침습 및 전이: PPLAU-PLAUR (uPA/uPAR) 축은 ER+ 및 TNBC에서 주목할 만하며, 이는 세포외기질 분해 및 세포 이동에 관여하여 종양 침습 및 전이에 중요한 역할을 합니다. TNBC에서는 JAG1-NOTCH2 상호작용도 나타나며, Notch 신호는 암 줄기 세포 특성과 치료 저항성에 관여할 수 있습니다.
Clinical or Translational Implications
이러한 세포-세포 상호작용 패턴은 유방암의 진단, 예후 예측 및 치료 전략 개발에 중요한 통찰력을 제공합니다.
- 면역 체크포인트 억제제 표적: LGALS9-HAVCR2 (Galectin-9/TIM-3) 및 NECTIN2-TIGIT (HER2+에서) 축은 다양한 유방암 아형에서 면역 회피의 공통적인 또는 아형 특이적인 메커니즘을 나타냅니다. TIM-3 또는 TIGIT를 표적으로 하는 치료법은 기존 면역 체크포인트 억제제에 대한 반응을 개선하거나 새로운 환자군에서 효과를 나타낼 수 있는 잠재적인 치료 전략이 될 수 있습니다.
- [참고: PubMed 검색 "TIM-3 cancer immunotherapy" 또는 "TIGIT cancer immunotherapy"]
- 대식세포 재프로그래밍: 종양 관련 대식세포(TAMs)는 모든 암 아형에서 강력한 면역 억제 및 종양 촉진 상호작용에 참여합니다. TAMs를 고갈시키거나, M2 유사 표현형에서 항종양 M1 유사 표현형으로 재프로그래밍하는 전략은 유방암 치료를 위한 유망한 접근법입니다. NAMPT-NOX2 complex 및 ProstaglandinE2-PTGER2/4와 같은 대식세포 관련 염증 및 ROS 생성 경로는 이러한 재프로그래밍을 위한 잠재적인 표적이 될 수 있습니다.
- [참고: PubMed 검색 "tumor associated macrophages therapy breast cancer"]
- HER2+ 특이적 치료 전략: HER2+ 유방암에서 HBGEGF-ERBB2 상호작용의 확인은 HER2 신호 전달을 직접적으로 활성화하는 리간드-수용체 축을 보여줍니다. 이는 기존 HER2 표적 치료제(예: Trastuzumab, Pertuzumab)의 효과를 보강하거나, 리간드-수용체 결합을 차단하는 새로운 접근법을 개발하는 데 활용될 수 있습니다.
[참고: GeneCards for "HB-EGF"]
- 혈관 신생 억제: HER2+에서 나타나는 강력한 VEGF 신호 전달은 이 아형에서 혈관 신생 억제제(anti-angiogenic agents)의 잠재적인 역할을 재확인합니다. 비록 단독 요법으로는 제한적인 성공을 보였지만, 병용 요법으로서의 가능성을 탐색할 수 있습니다.
- 침습 및 전이 억제: PPLAU-PLAUR (uPA/uPAR) 축은 종양 침습 및 전이의 중요한 동인으로, 특히 ER+ 및 TNBC에서 유의미하게 나타납니다. uPA/uPAR 신호 전달을 표적으로 하는 약물은 종양의 전이 가능성을 줄이는 데 도움이 될 수 있습니다.
- Notch 신호 조절: TNBC에서 JAG1-NOTCH2 상호작용은 Notch 신호가 종양 미세환경 및 암 줄기 세포 특성에 관여할 수 있음을 시사합니다. Notch 신호 억제제는 특정 TNBC 환자군에서 치료 민감도를 높일 수 있습니다.
[참고: UniProt for "NOTCH2"]
이러한 결과는 특정 리간드-수용체 상호작용 쌍을 기반으로 한 실험적 검증 및 전임상/임상 연구의 우선순위를 정하는 데 활용될 수 있습니다.
13. Condition-Specific Cell-Cell Interaction Analysis in Breast Cancer Subtypes
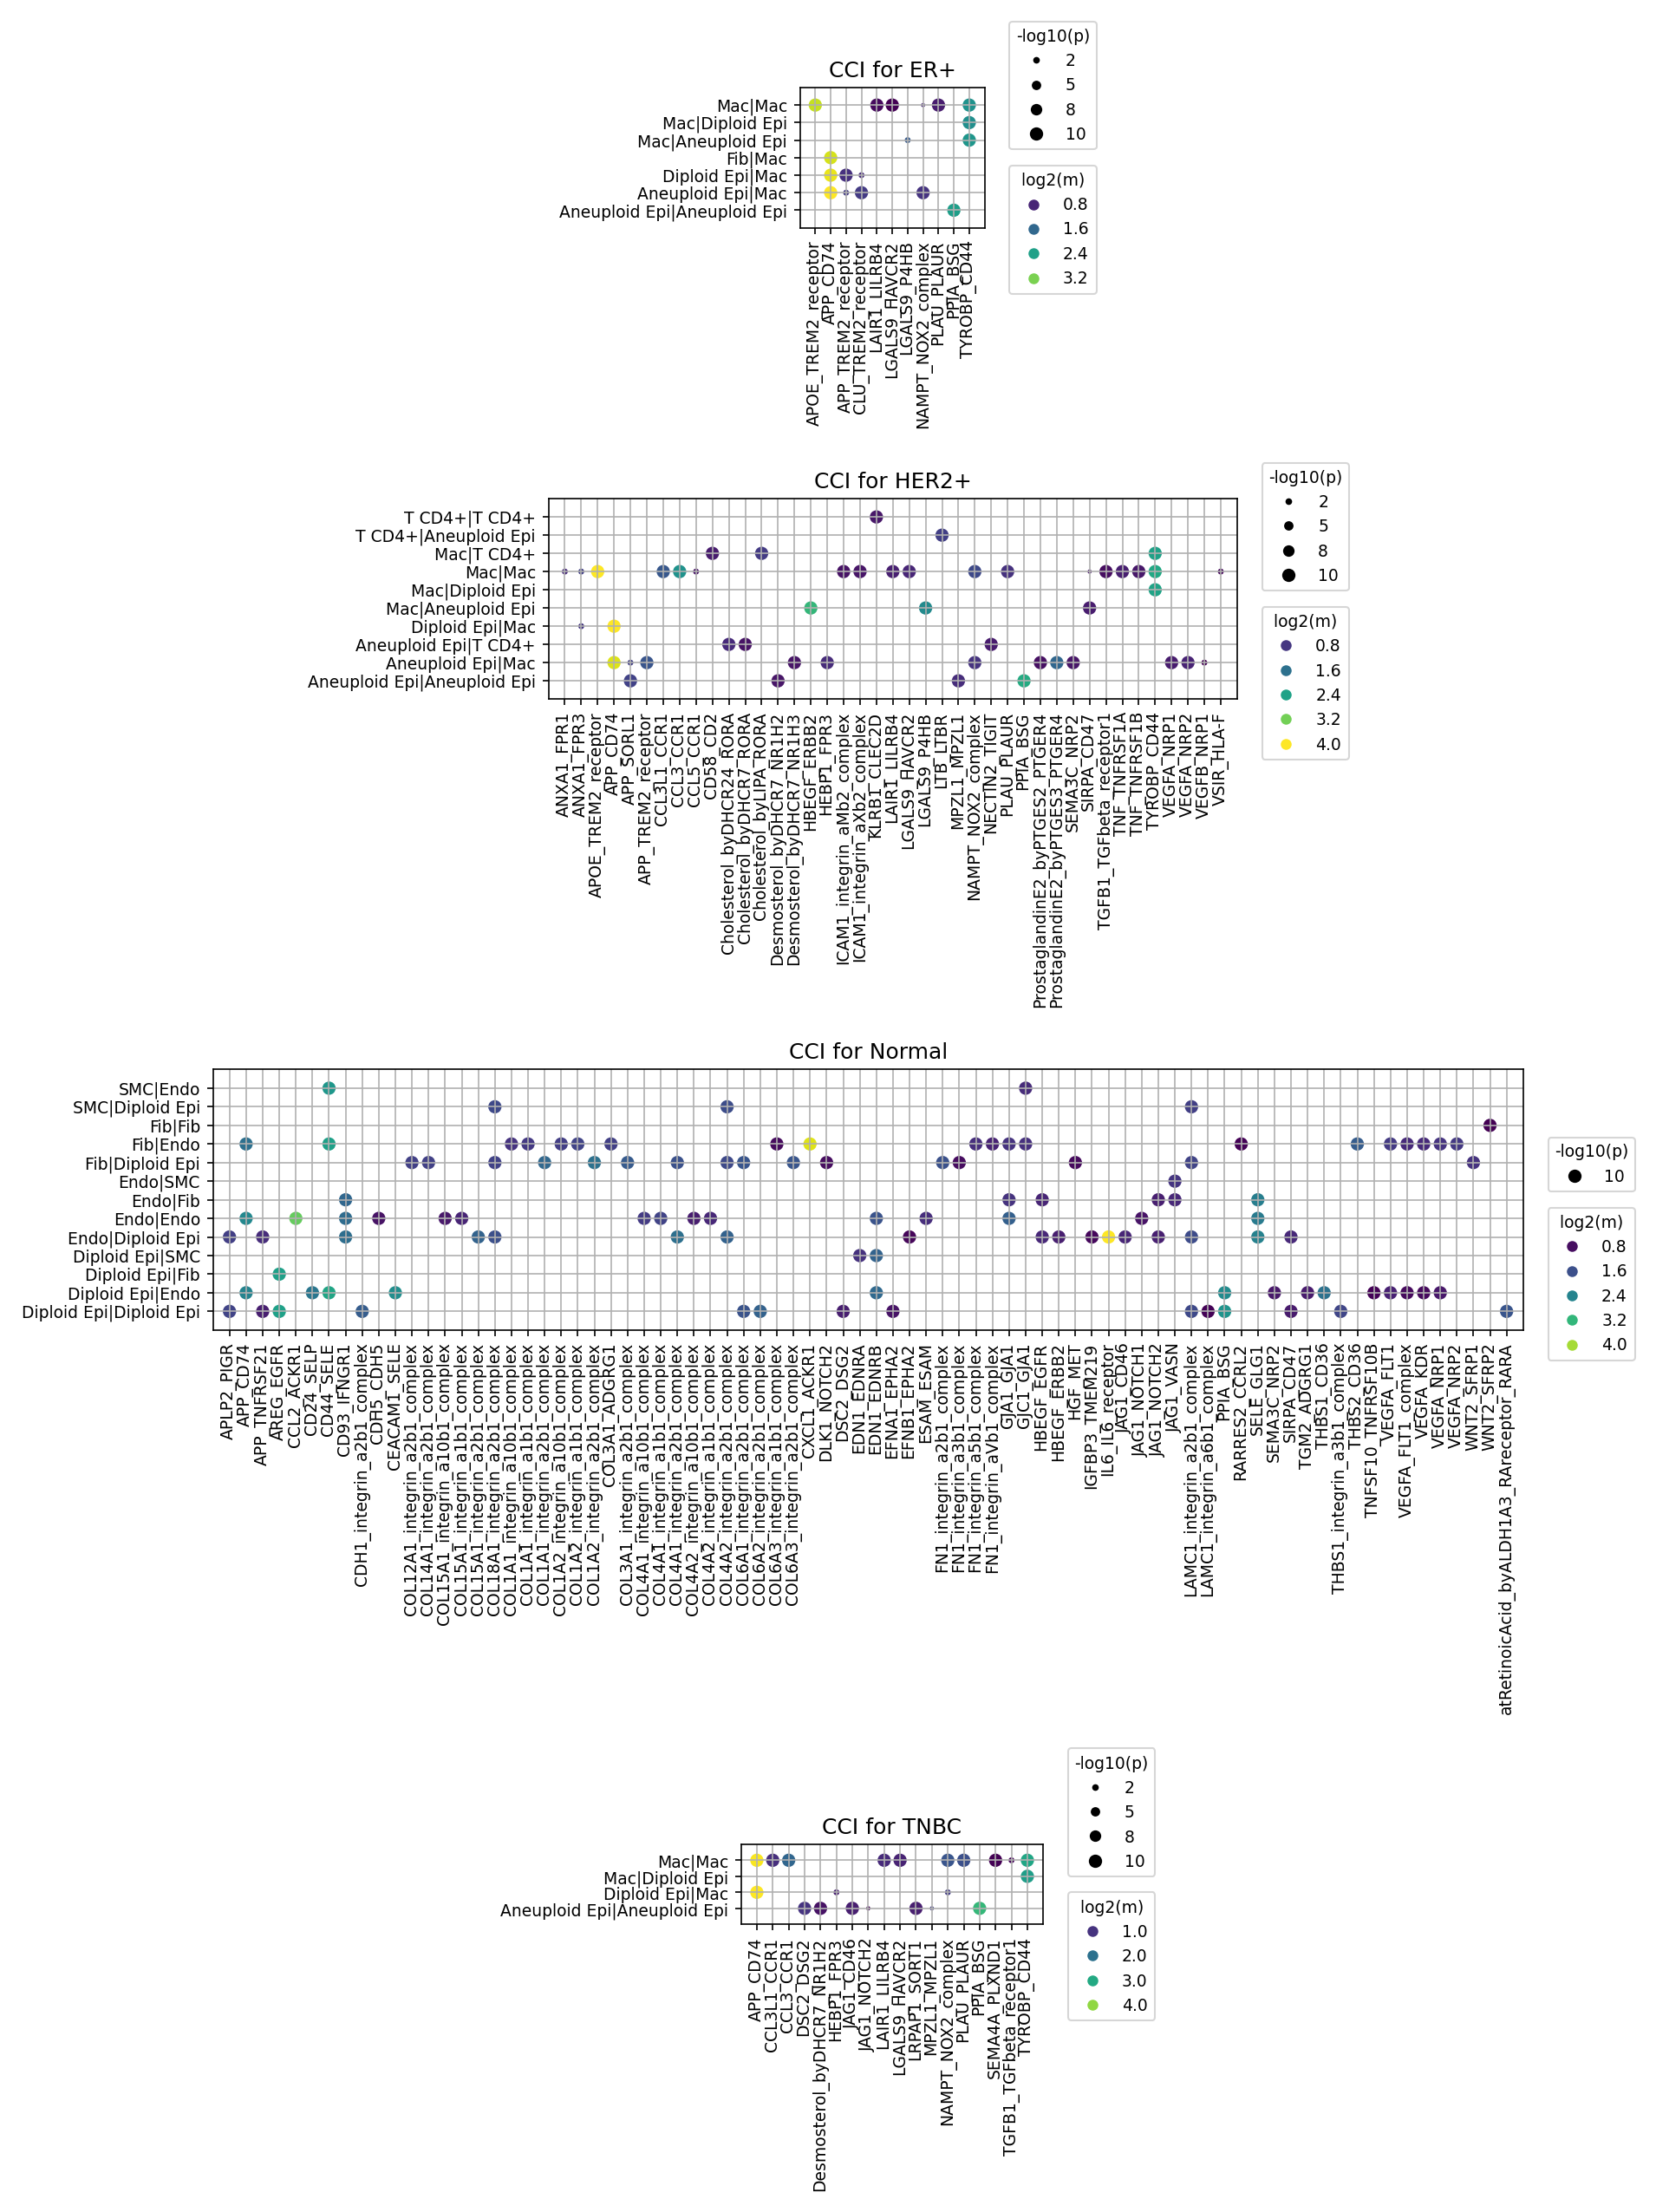
[Analysis Visualization Results]...
Analysis Overview
This analysis investigates cell-cell interactions (CCIs) across different breast tissue conditions: Normal, Estrogen Receptor-positive (ER+), Human Epidermal growth factor Receptor 2-positive (HER2+), and Triple-Negative Breast Cancer (TNBC). The plot_cci_dots tool was used to visualize significant ligand-receptor interactions between various cell types, with a focus on interactions involving Epithelial cells (categorized by ploidy status, i.e., Diploid Epi and Aneuploid Epi), Macrophages, Fibroblasts, T cells, Endothelial cells, and Smooth muscle cells. The goal is to identify common and distinct CCI patterns that may provide insights into disease progression and potential therapeutic targets.
Visual Summary
The dot plots illustrate cell-cell interactions for each condition, with dot size representing the statistical significance (-log10(p-value)) and color intensity indicating the interaction strength (log2(mean expression)).
- Normal Tissue: Shows a broad spectrum of interactions primarily among stromal cells (Fibroblasts, Endothelial cells, Smooth muscle cells) and between stromal cells and Diploid Epithelial cells. Many interactions involve extracellular matrix components (e.g., integrin-collagen, integrin-fibronectin), reflecting tissue homeostasis and structural integrity.
- ER+ Breast Cancer: Fewer, but distinct, interactions are highlighted, predominantly involving Macrophages and both Diploid and Aneuploid Epithelial cells. Key interactions include those related to TREM2 receptors, immune checkpoint molecules (LGALS9-HAVCR2), and pathways involved in tissue remodeling (PLAU-PLAUR).
- HER2+ Breast Cancer: Presents the most extensive and diverse set of significant interactions. A wide array of cell pairs are involved, including T cells (CD4+), Macrophages, and Epithelial cells (Diploid and Aneuploid). Prominent interactions include numerous immune checkpoints (e.g., NECTIN2-TIGIT, SIRPA-CD47, LGALS9-HAVCR2), angiogenesis pathways (VEGFA-VEGFRs), and lipid metabolism-related signaling.
- TNBC Breast Cancer: Displays a pattern of interactions similar to ER+, with a strong emphasis on Macrophage-Epithelial cell interactions. Common pathways include immune suppression (LGALS9-HAVCR2, LAIR1-LILRB4), invasion (PLAU-PLAUR), and Notch signaling (JAG1-NOTCH2).
Across the cancer subtypes, interactions involving 'Aneuploid Epi' (likely tumor cells) with Macrophages and other Aneuploid Epi cells are consistently observed, indicating crucial tumor-immune and tumor-tumor communication.
Biological Interpretation
- Homeostatic Interactions in Normal Breast Tissue:
The Normal condition is characterized by extensive interactions involving the extracellular matrix (ECM) and cell adhesion molecules, such as various Integrin-Collagen, Integrin-Fibronectin, and Integrin-Laminin complexes. These are crucial for maintaining tissue architecture, cell polarity, and mechanotransensing in healthy mammary tissue. Interactions involving growth factors like HBEGF-EGFR and developmental pathways like Notch (JAG1-NOTCH2) and WNT (WNT5A-FZD4/5/8/ROR2) suggest active cell turnover, repair, and tissue maintenance. Basal levels of VEGFA-VEGFR signaling also indicate normal vascular maintenance.
- Shared Pro-Tumorigenic and Immunosuppressive Features in Breast Cancer Subtypes:
Across ER+, HER2+, and TNBC, several key themes emerge, underscoring common mechanisms of cancer progression and immune evasion:
- Tumor-Associated Macrophages (TAMs): Interactions between Macrophages and Epithelial cells (both Diploid and Aneuploid) are highly prominent in all cancer subtypes. Ligand-receptor pairs such as APOE/APP/CLU-TREM2 receptor are frequently observed. TREM2 signaling on macrophages is increasingly recognized for its role in promoting a pro-tumoral, immunosuppressive phenotype, driving tumor growth, metastasis, and therapy resistance. [PubMed search: TREM2 tumor associated macrophages breast cancer]
- Immune Checkpoint Pathways: Several immune inhibitory interactions are shared. LGALS9-HAVCR2 (Galectin-9-TIM-3 axis) and LAIR1-LILRB4 are consistently found in ER+, HER2+, and TNBC. These pathways contribute to T cell exhaustion and immune suppression within the tumor microenvironment (TME). [GeneCards: HAVCR2], [UniProt: LAIR1]
- Invasion and ECM Remodeling: The PLAU-PLAUR (uPA-uPAR) axis is notable in ER+ and TNBC. This interaction facilitates extracellular matrix degradation, promoting cancer cell invasion and metastasis. [UniProt: PLAU]
- Metabolic Reprogramming: Interactions involving NAMPT-NOX2 complex (ER+, TNBC) suggest a link between cellular metabolism (NAD+ biosynthesis) and oxidative stress. Lipid metabolism-related interactions like Cholesterol/Desmosterol-DHCR7-RORa/NR1H2/NR1H3 are particularly highlighted in HER2+ and TNBC, indicating altered lipid signaling that can impact tumor growth and immune responses.
- Distinctive Features by Breast Cancer Subtype:
- HER2+ Specific Interactions: This subtype shows a broader and more aggressive interaction profile, consistent with its typically more aggressive clinical behavior:
- Angiogenesis: Strong VEGFA-NRP1/VEGFR1/VEGFR2 interactions highlight active angiogenesis, crucial for tumor growth and metastasis. [GeneCards: VEGFA]
- Immune Evasion: In addition to shared checkpoints, HER2+ exhibits NECTIN2-TIGIT and SIRPA-CD47. The CD47-SIRPA axis is a critical "don't eat me" signal that allows cancer cells to evade phagocytosis by macrophages. [GeneCards: CD47] VSIR-HLA-F (VISTA) further suggests a complex immune suppressive landscape.
- Inflammation and Growth: ProstaglandinE2-PTGER4 signaling is a significant pro-tumorigenic pathway in HER2+, promoting cell proliferation, survival, angiogenesis, and immune suppression. [GeneCards: PTGER4] TGFB1-TGFB_receptor1 is also prominent, known for driving immune suppression, fibrosis, and epithelial-mesenchymal transition (EMT). [GeneCards: TGFB1]
- Immune Cell Adhesion/Migration: Interactions like ICAM1-integrin_aM_b2_complex suggest active infiltration and adhesion of immune cells.
- TNBC Specific Interactions: While sharing many macrophage-related and immune suppressive interactions, TNBC also shows significant JAG1-NOTCH2/NOTCH_receptor signaling. Notch pathway dysregulation is linked to cancer stemness, proliferation, and resistance to therapy in TNBC. [GeneCards: JAG1] The SEMA4A-PLXND1 interaction hints at roles in immune regulation and angiogenesis.
Clinical or Translational Implications
The identified cell-cell interactions offer a rich landscape for therapeutic intervention and biomarker discovery, particularly focusing on the tumor microenvironment.
- Therapeutic Target Prioritization:
- Immune Checkpoint Blockade: The consistent presence of LGALS9-HAVCR2 (TIM-3), LAIR1-LILRB4 across subtypes, and NECTIN2-TIGIT, SIRPA-CD47, VSIR-HLA-F (VISTA) specifically in HER2+, highlights these pathways as promising targets for novel immunotherapies. Blocking these interactions could reactivate anti-tumor immunity. [PubMed search: TIGIT cancer therapy], [PubMed search: CD47 cancer therapy]
- Macrophage Reprogramming: Given the central role of Macrophage-Epithelial interactions involving TREM2, targeting TREM2 or its ligands (APOE, APP, CLU) could be a strategy to re-educate pro-tumoral macrophages into an anti-tumorigenic phenotype, or inhibit their recruitment/survival.
- Anti-angiogenic and Anti-Invasive Therapies: The robust VEGFA-VEGFR signaling in HER2+ reinforces the utility of anti-angiogenic agents. The pervasive PLAU-PLAUR interactions in ER+ and TNBC suggest uPAR inhibitors could limit tumor invasion and metastasis.
- Targeting Inflammatory/Pro-tumorigenic Pathways: The strong ProstaglandinE2-PTGER4 interactions in HER2+ suggest that EP4 receptor antagonists could be beneficial, potentially in combination with other therapies. Likewise, targeting the TGFB1-TGFB_receptor1 pathway in HER2+ and TNBC could mitigate immunosuppression and metastatic progression.
- Biomarker Discovery and Patient Stratification:
- The specific ligand-receptor pairs identified for each subtype could serve as biomarkers for patient stratification, predicting response to targeted therapies, or identifying patients with a highly immunosuppressive TME. For instance, high expression of TIGIT or CD47 in HER2+ tumors might indicate candidates for TIGIT or CD47-blocking antibodies, respectively.
- Monitoring the activity of pathways like PLAU-PLAUR or Notch (JAG1-NOTCH2) in ER+ and TNBC could provide prognostic information or indicate disease progression.
- Experimental Validation Strategies:
- In vitro co-culture models: Recreating specific cell-cell interactions (e.g., Aneuploid Epi with Macrophages or T cells) to test the functional impact of identified ligand-receptor pairs (e.g., cell proliferation, migration, immune cell activation/exhaustion) and validate the effects of blocking agents.
- _In vivo_ preclinical models: Utilizing patient-derived xenografts (PDX) or syngeneic mouse models of breast cancer subtypes to evaluate the efficacy of novel therapeutic agents targeting the identified pathways, either as single agents or in combination.
- Spatial Transcriptomics/Proteomics: Investigating the spatial localization and expression patterns of these ligand-receptor pairs in human breast cancer tissue sections could confirm their relevance in the tissue context and their association with specific cellular neighborhoods.
14. Cell-Cell Interaction Analysis of Immune Checkpoint and Cell Cycle Pathways in Breast Cancer Subtypes
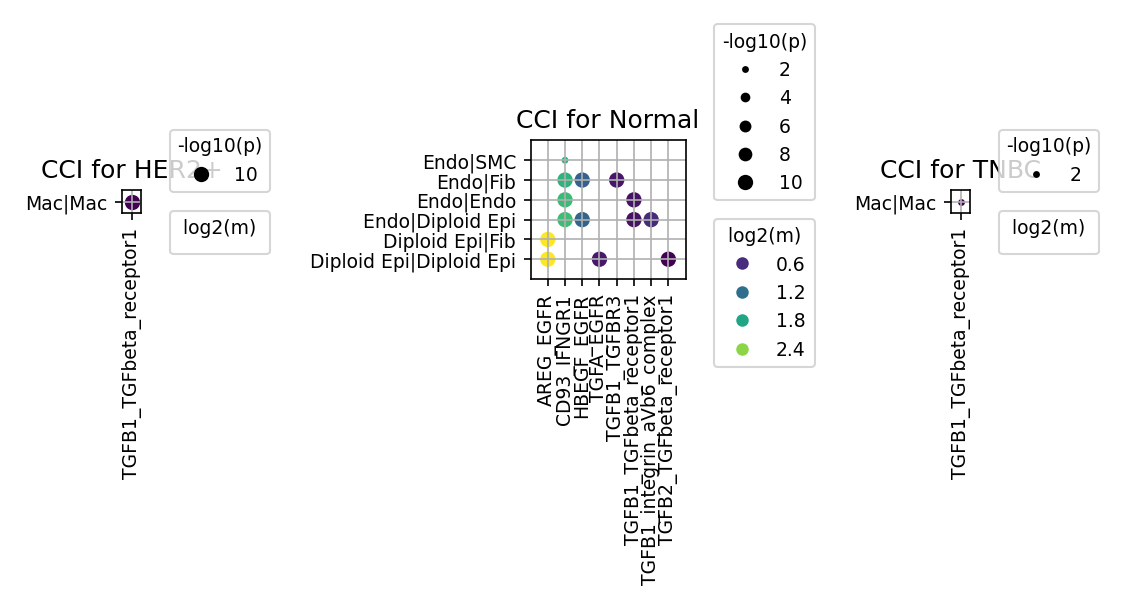
[Analysis Visualization Results]...
Analysis Overview
This analysis investigates cell-cell interactions (CCI) using CellPhoneDB, focusing specifically on a predefined set of genes associated with immune checkpoint and cell cycle pathways. The single-cell RNA-seq data is derived from human breast tissue, encompassing various conditions including Normal, HER2+, and TNBC. The plot_cci_dots tool was used to visualize significant ligand-receptor interactions between different cell types, aggregated by condition. The analysis highlights specific interactions that meet a p-value cutoff of 0.05 and a mean interaction strength cutoff of 0.01, helping to identify key communication axes within the breast tissue microenvironment in health and disease.
Visual Summary
The provided dot plots illustrate condition-specific cell-cell interactions for the selected gene set, with dot size representing the statistical significance (-log10(p-value)) and dot color indicating the interaction strength (log2(mean)).
CCI for Normal Tissue:
- This plot reveals a diverse array of interactions primarily involving Endothelial cells (Endo), Smooth muscle cells (SMC), Fibroblasts (Fib), and Epithelial cells (Epi), including diploid epithelial and fibroblast populations.
Key ligand-receptor pairs identified include
- EGFR signaling: AREG-EGFR, HBEGF-EGFR, TGFA-EGFR, with varying cell pair specificities (e.g., Endo|SMC, Endo|Fib, Epi|Fib). These interactions show moderate significance and strength.
- TGF-beta signaling: TGFB1-TGFBR1, TGFB1-TGFBR3, TGFB1-integrin_aVb6_complex, and TGFB2-TGFBR1. These interactions are prominent, especially between Endothelial, Epithelial, and Fibroblast cells, often showing high significance and strength.
- Other interactions: CD93-IFNGR1 is also observed, predominantly involving Endothelial cells and stromal/epithelial cells.
CCI for HER2+ and TNBC Tissues:
- In stark contrast to the Normal condition, both the HER2+ and TNBC plots show a highly restricted pattern of cell-cell interactions for the queried gene set.
- A singular, dominant interaction is observed: Macrophage-Macrophage (Mac|Mac) communication via the TGFB1-TGFbeta_receptor1 (TGFB1-TGFBR1) axis.
- This Mac|Mac interaction is present in both HER2+ and TNBC conditions, exhibiting high statistical significance and substantial interaction strength, especially in HER2+.
- The rich diversity of interactions seen in Normal tissue involving epithelial, stromal, and endothelial cells largely disappears or falls below the detection thresholds in these specific cancer subtypes for the selected gene set.
Biological Interpretation
The analysis highlights a profound shift in cell-cell communication patterns, particularly regarding immune checkpoint and cell cycle-related pathways, when comparing normal breast tissue to HER2+ and TNBC subtypes.
- Normal Tissue Homeostasis and Diverse Communication:
- In normal breast tissue, the presence of various epithelial-stromal and endothelial interactions involving EGFR and TGF-beta signaling is consistent with their roles in maintaining tissue architecture, proliferation, differentiation, and repair.
- EGFR signaling (mediated by AREG, HBEGF, TGFA) is crucial for mammary gland development and epithelial cell proliferation [1]. Its interactions with stromal and endothelial cells suggest coordinated growth and tissue remodeling.
- TGF-beta signaling is a pleiotropic pathway involved in normal tissue development, immune regulation, and cell growth control [2]. Its diverse interactions in normal tissue underscore its broad regulatory functions.
- The observation of specific Diploid Epi and Diploid Fib interactions further emphasizes the healthy, non-aneuploid cell populations communicating to maintain tissue integrity.
- Remodeling of the Tumor Microenvironment (TME) in Breast Cancer:
- The striking dominance of Macrophage-Macrophage (Mac|Mac) interactions via TGFB1-TGFbeta_receptor1 (TGFB1-TGFBR1) in both HER2+ and TNBC breast cancers signifies a critical biological alteration in the TME.
- TGF-beta is a key cytokine produced by various cells, including tumor cells and tumor-associated macrophages (TAMs), in the TME. While it can act as a tumor suppressor in early stages, it often promotes tumor progression in established cancers by fostering immunosuppression, angiogenesis, epithelial-mesenchymal transition (EMT), and metastasis [2].
- Macrophage-macrophage autocrine/paracrine loops via TGFB1-TGFBR1 suggest a mechanism by which TAMs can reinforce their pro-tumorigenic and immunosuppressive phenotypes. This self-sustaining signaling could drive the polarization of macrophages towards M2-like phenotypes, which are associated with poor prognosis in breast cancer [3].
- The selected genes include various components of immune checkpoint (e.g., CD274, PDCD1) and cell cycle pathways (e.g., CDK1, CCND1). While many of these genes are in the target list, their specific interactions are not highlighted in these dot plots, suggesting that for the selected cutoffs and conditions, the TGFB1-TGFBR1 axis within macrophages is a more prominent communication hub compared to direct ligand-receptor interactions of other immune checkpoints. This does not preclude their importance but rather points to a dominant interaction within the predefined gene set.
Clinical or Translational Implications
The findings carry significant clinical and translational implications for breast cancer, particularly HER2+ and TNBC subtypes.
- TGF-beta as a Therapeutic Target: The strong and prevalent Mac|Mac TGFB1-TGFBR1 interaction in HER2+ and TNBC identifies the TGF-beta pathway as a high-priority therapeutic target. Inhibiting TGF-beta signaling could:
- Reprogram TAMs: Block the autocrine/paracrine signaling that drives immunosuppressive and pro-tumorigenic macrophage functions. This could shift TAMs towards an anti-tumorigenic phenotype, thereby enhancing anti-cancer immunity [4].
- Improve Immunotherapy Response: Given that TGF-beta is a major mediator of immune evasion, targeting this pathway could overcome resistance to existing immunotherapies, such as PD-1/PD-L1 blockade, in breast cancer [5].
- Reduce Metastasis: TGF-beta promotes EMT and metastasis, so its inhibition could also mitigate these processes [2].
- Biomarker Potential: The distinct shift from diverse cell communication in normal tissue to a dominant macrophage-centric TGF-beta signaling in cancer could serve as a potential diagnostic or prognostic biomarker. Monitoring the intensity of Mac|Mac TGFB1-TGFBR1 interactions might indicate disease progression or predict response to TGF-beta-targeting agents.
- Combination Therapy Strategy: The results suggest that therapies targeting the TGF-beta pathway, particularly in the context of macrophage activity, could be highly beneficial when combined with other treatment modalities, including chemotherapy, targeted therapies (for HER2+), or other immunotherapies, to optimize patient outcomes in HER2+ and TNBC.
In summary, this analysis provides compelling evidence for the central role of macrophage-mediated TGF-beta signaling as a key immune checkpoint-related communication axis in the TME of HER2+ and TNBC breast cancers, offering a strong rationale for its therapeutic exploitation.
---
References:
[1] GeneCards - EGFR. https://www.genecards.org/cgi-bin/carddisp.pl?gene=EGFR
[2] PubMed Search: TGF-beta cancer review. https://pubmed.ncbi.nlm.nih.gov/?term=TGF-beta+cancer+review
[3] PubMed Search: Tumor associated macrophages breast cancer prognosis. https://pubmed.ncbi.nlm.nih.gov/?term=Tumor+associated+macrophages+breast+cancer+prognosis
[4] PubMed Search: TGF-beta immunotherapy macrophage cancer. https://pubmed.ncbi.nlm.nih.gov/?term=TGF-beta+immunotherapy+macrophage+cancer
[5] PubMed Search: TGF-beta PD-1 resistance cancer. https://pubmed.ncbi.nlm.nih.gov/?term=TGF-beta+PD-1+resistance+cancer
15. Condition-Specific Cell-Cell Interaction Patterns in Breast Cancer Subtypes
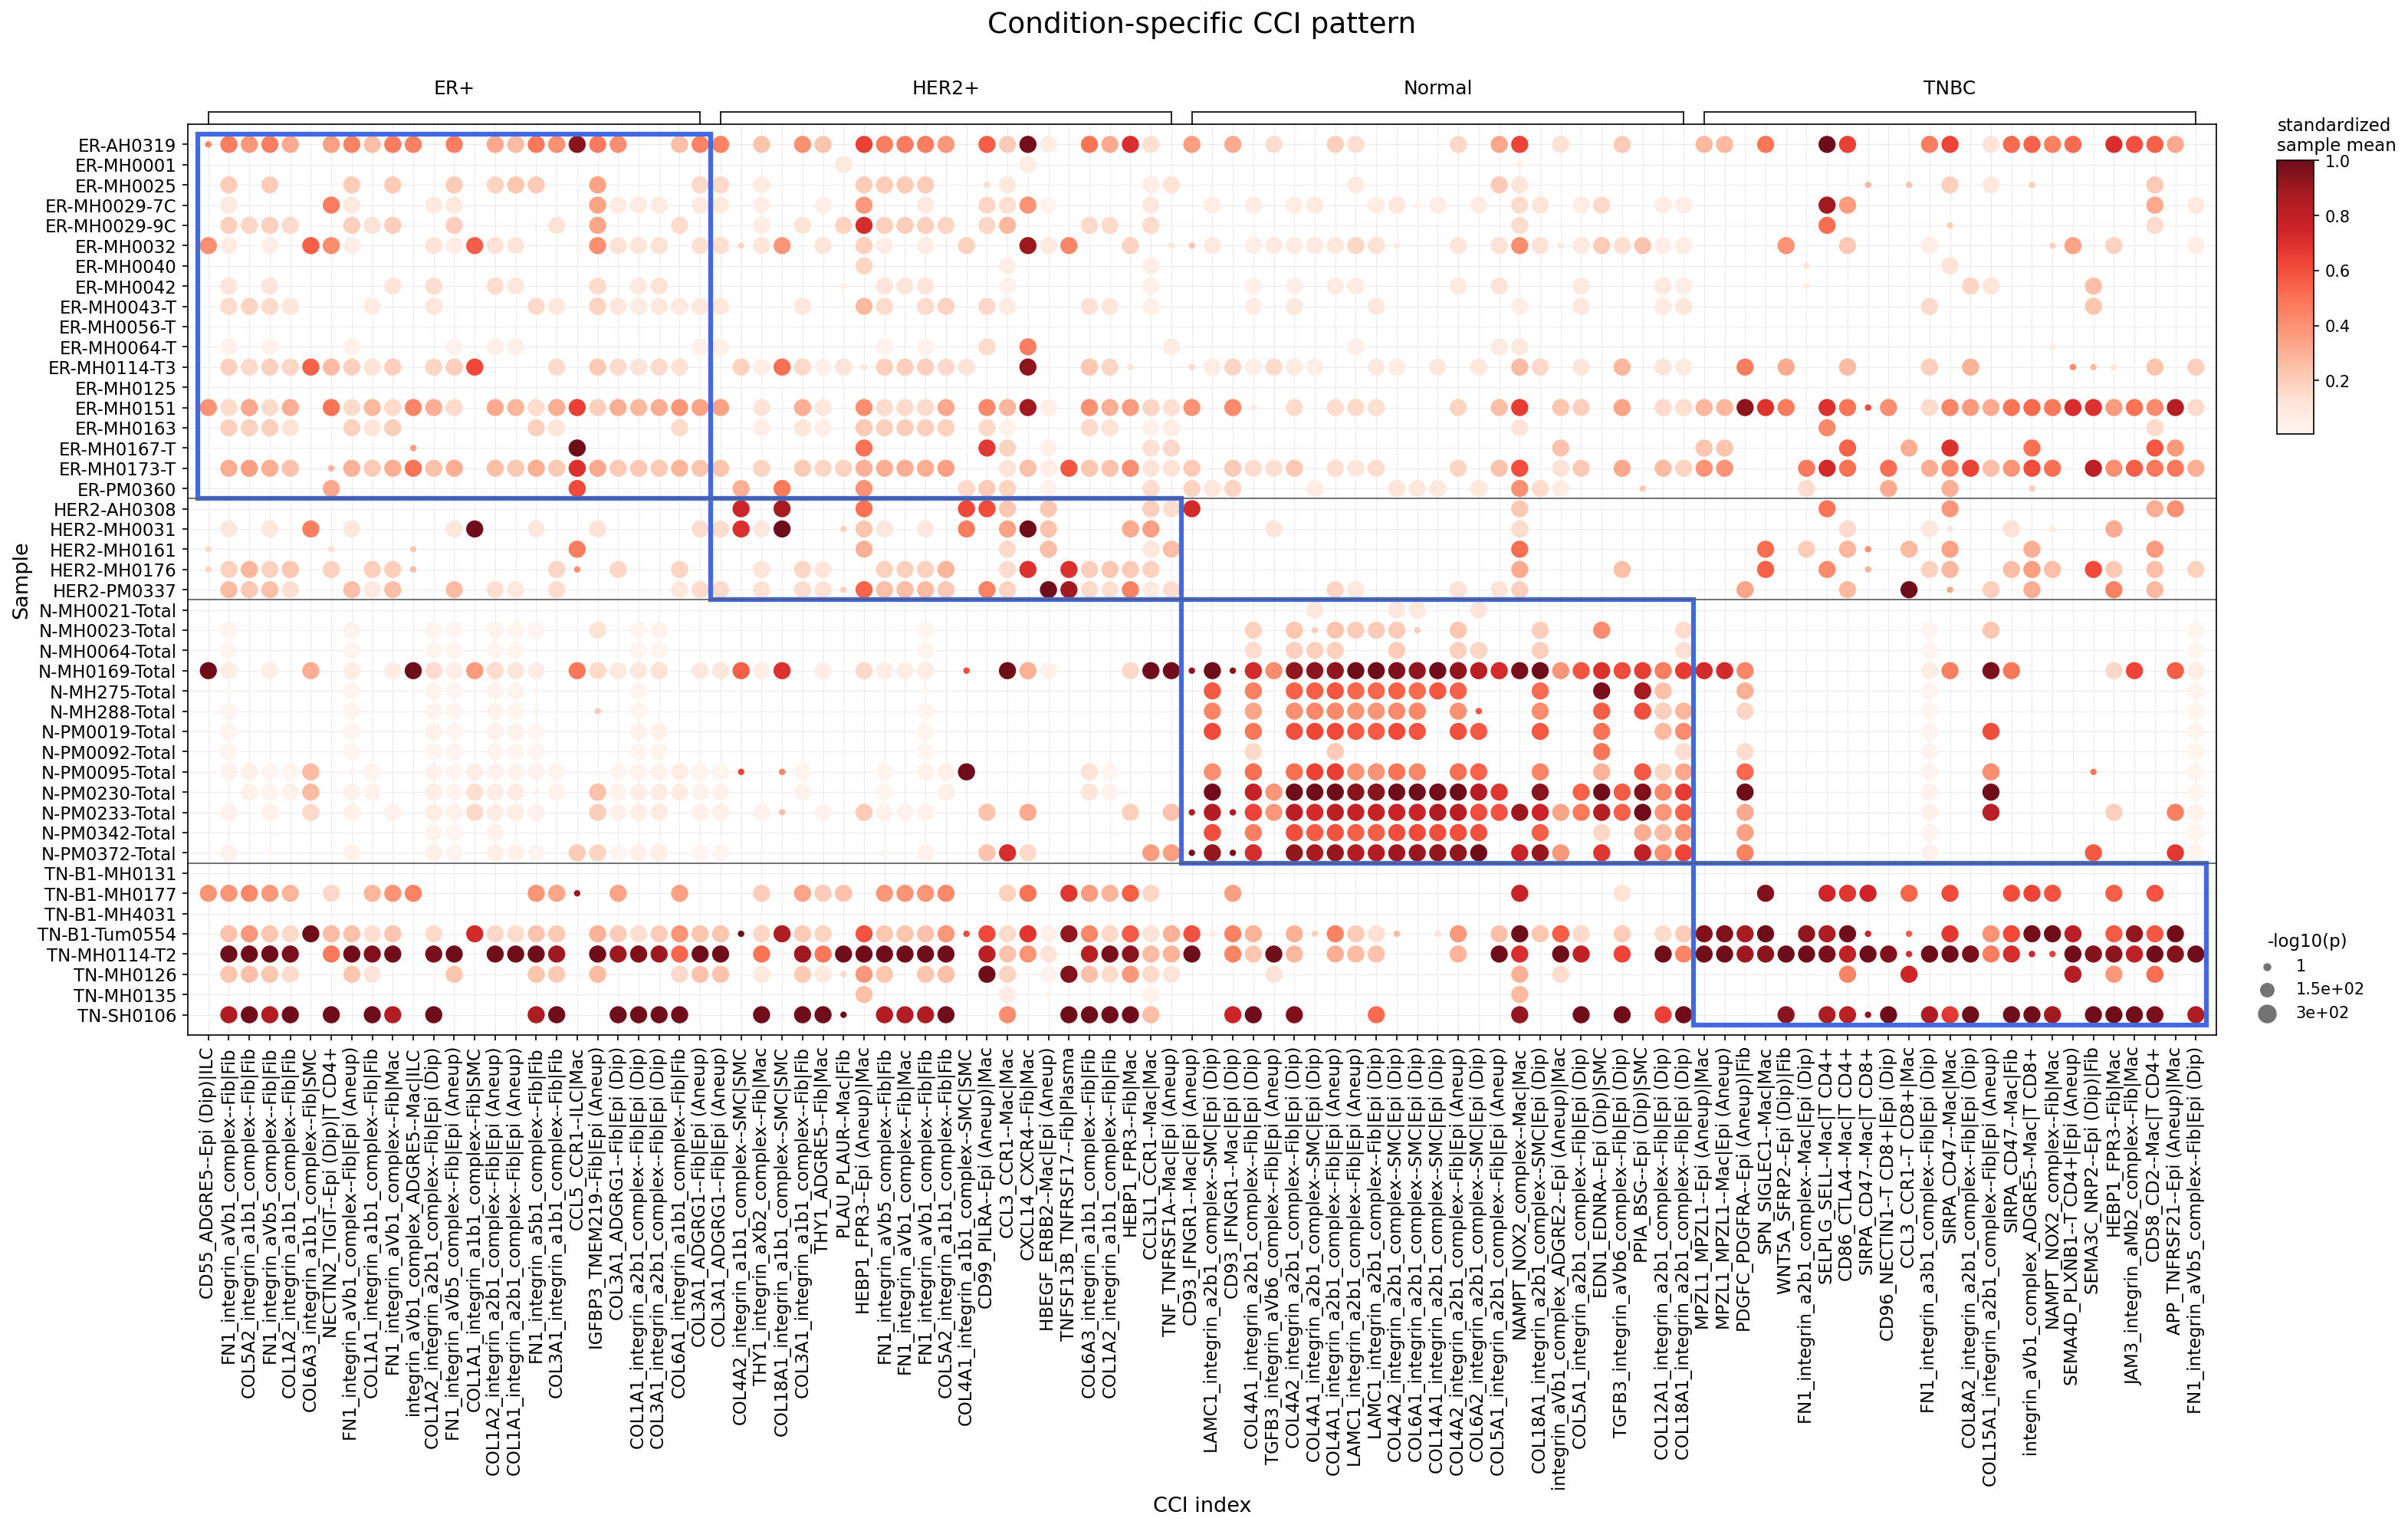
[Analysis Visualization Results]...
Analysis Overview
This analysis investigates statistically significant differences in cell-cell interactions (CCIs) among various breast cancer conditions (ER+, HER2+, TNBC) and normal breast tissue. The focus is on interactions involving major immune cells (T cells, Myeloid cells, B cells) and stromal cells (Fibroblasts, Smooth Muscle Cells), with epithelial cells being the tumor origin cell type. The visualization, a dot plot, displays the standardized mean interaction strength (dot color) and statistical significance (-log10(p) value, dot size) for selected CCI indices across individual samples grouped by their condition.
Visual Summary
The dot plot reveals distinct and condition-specific patterns of cell-cell interactions.
- Normal Tissue: Samples from normal breast tissue exhibit a prominent cluster of highly significant and strong interactions, predominantly involving fibroblasts and diploid epithelial cells (Fib|Epi (Dip)) through various integrin-mediated connections with extracellular matrix (ECM) components like Collagen (COL) and Laminin (LAMC1).
- TNBC (Triple-Negative Breast Cancer): TNBC samples show a uniquely enriched set of interactions, markedly different from normal tissue. These include numerous ECM-integrin interactions between fibroblasts and *aneuploid* epithelial cells (Fib|Epi (Aneu)), as well as several immune cell-immune cell and immune cell-tumor cell interactions involving macrophages, T cells, and aneuploid epithelial cells. Key examples include SPP1-integrin and WNT5A-SFRP2 interactions involving aneuploid epithelial cells, and chemokine/immune checkpoint signaling like CCL3-CCR1 (Mac|Mac) and CD86-CTLA4 (Mac|T CD4+).
- ER+ (Estrogen Receptor-Positive Breast Cancer): ER+ samples display a mixed pattern. Many interactions overlap with those observed in normal tissue, especially those involving diploid epithelial cells and fibroblasts. However, some interactions also involve aneuploid epithelial cells, indicating a tumor context.
- HER2+ (Human Epidermal Growth Factor Receptor 2-Positive Breast Cancer): HER2+ samples present a more heterogeneous and less uniformly clustered pattern compared to Normal or TNBC. A notable interaction is HBEGF_ERBB2--Mac|Epi (Dip), suggesting specific growth factor signaling in the HER2+ microenvironment.
Overall, the plot clearly demonstrates a dramatic remodeling of the cell-cell communication landscape from normal tissue to distinct breast cancer subtypes, with TNBC exhibiting the most profoundly altered and immunologically active interaction profile. The distinction between diploid (Dip) and aneuploid (Aneu) epithelial cells within the CCI indices is critical, separating interactions characteristic of normal tissue from those specifically involving tumor cells.
Biological Interpretation
The observed condition-specific CCI patterns provide significant biological insights into the breast cancer microenvironment:
- Normal Tissue Homeostasis: The high activity of COL-integrin and LAMC1-integrin interactions between fibroblasts and diploid epithelial cells in normal tissue underscores the essential role of ECM and stromal-epithelial crosstalk in maintaining tissue structure, differentiation, and overall homeostasis. These interactions ensure proper cell adhesion, migration, and signaling in a healthy state.
- Tumor Microenvironment (TME) Remodeling in TNBC: The shift towards distinct ECM-integrin interactions involving aneuploid epithelial cells (e.g., FN1_integrin, COL1A2_integrin, SPP1_integrin) in TNBC highlights how tumor cells actively manipulate the ECM to support their growth and invasion. Notably, SPP1 (Osteopontin), interacting with integrins on aneuploid epithelial cells, is known to promote tumor progression and metastasis PubMed Search: SPP1 cancer progression. The prominent WNT5A-SFRP2--Fib|Epi (Aneu) interaction suggests active Wnt signaling dysregulation in the TNBC TME, contributing to tumor cell proliferation and stemness GeneCards: WNT5A.
- Immune Dysregulation and Recruitment in TNBC: The increased prevalence of immune-immune cell and immune-tumor cell interactions in TNBC is particularly striking:
- Macrophage-Macrophage Crosstalk: CCL3-CCR1 and SPN-SIGLEC1 interactions among macrophages indicate active recruitment and communication of myeloid cells within the TNBC microenvironment. CCL3 (MIP-1A) is a chemokine known to attract monocytes and macrophages, contributing to the inflammatory and immunosuppressive milieu often found in TNBC UniProt: CCL3.
- Immune Checkpoint Interactions: The CD86-CTLA4--Mac|T CD4+ interaction signifies immune checkpoint activity within the TNBC TME. CD86 is a co-stimulatory molecule on antigen-presenting cells like macrophages, and CTLA4 is an inhibitory receptor on T cells. This interaction can lead to T cell anergy or exhaustion, facilitating tumor immune evasion GeneCards: CTLA4.
- T Cell-Tumor Cell Interactions: CD99/CD96-NECTIN1--T CD8+|Epi (Aneu) interactions point to direct contact between cytotoxic T cells and aneuploid tumor cells, which could be exploited or suppressed by the tumor.
- HER2+ Specific Signaling: The HBEGF_ERBB2--Mac|Epi (Dip) interaction in HER2+ samples suggests that macrophages might be involved in activating ERBB2 signaling, potentially contributing to tumor growth or resistance mechanisms even in interactions with surrounding diploid epithelial cells. HBEGF (Heparin-binding EGF-like growth factor) is a ligand for HER family receptors GeneCards: HBEGF.
- ER+ and HER2+ Heterogeneity: The less distinct clustering in ER+ and HER2+ may reflect greater heterogeneity within these subtypes or a less uniform remodeling of the immune and stromal microenvironment compared to the highly aggressive and immune-infiltrated nature of TNBC.
Clinical or Translational Implications
The identification of condition-specific CCI patterns has several important clinical and translational implications:
- Biomarker Discovery: The distinct CCI profiles, particularly for TNBC, could serve as novel diagnostic or prognostic biomarkers. Specific ligand-receptor pairs or interaction networks could help classify breast cancer subtypes more precisely, predict disease progression, or identify patients likely to respond to specific therapies.
- Therapeutic Targeting: The highly active CCIs in TNBC, such as SPP1-integrin, CCL3-CCR1, CXCL14-CXCR4, CD86-CTLA4, and WNT5A-SFRP2, represent promising therapeutic targets. Disrupting these interactions could inhibit tumor growth, metastasis, and overcome immune suppression. For instance, targeting the CD86-CTLA4 axis is already a successful strategy in immunotherapy. Identifying other critical interactions can lead to the development of novel combination therapies.
- Immunotherapy Enhancement: The pronounced immune-related CCIs in TNBC (e.g., macrophage-macrophage, macrophage-T cell, T cell-tumor cell interactions) provide a mechanistic basis for the observed responsiveness of TNBC to immunotherapies. Understanding these specific interactions can guide strategies to enhance immune cell infiltration, activation, and effector function within the tumor microenvironment.
- ECM Remodeling Interventions: The altered integrin-mediated interactions between fibroblasts and aneuploid epithelial cells in cancer highlight the potential for targeting ECM remodeling pathways. Interventions that normalize the ECM or block pro-tumorigenic ECM-integrin signaling could limit tumor invasion and improve drug delivery.
16. Epithelial Cell Condition-Specific Surfaceome Markers in Breast Cancer Subtypes
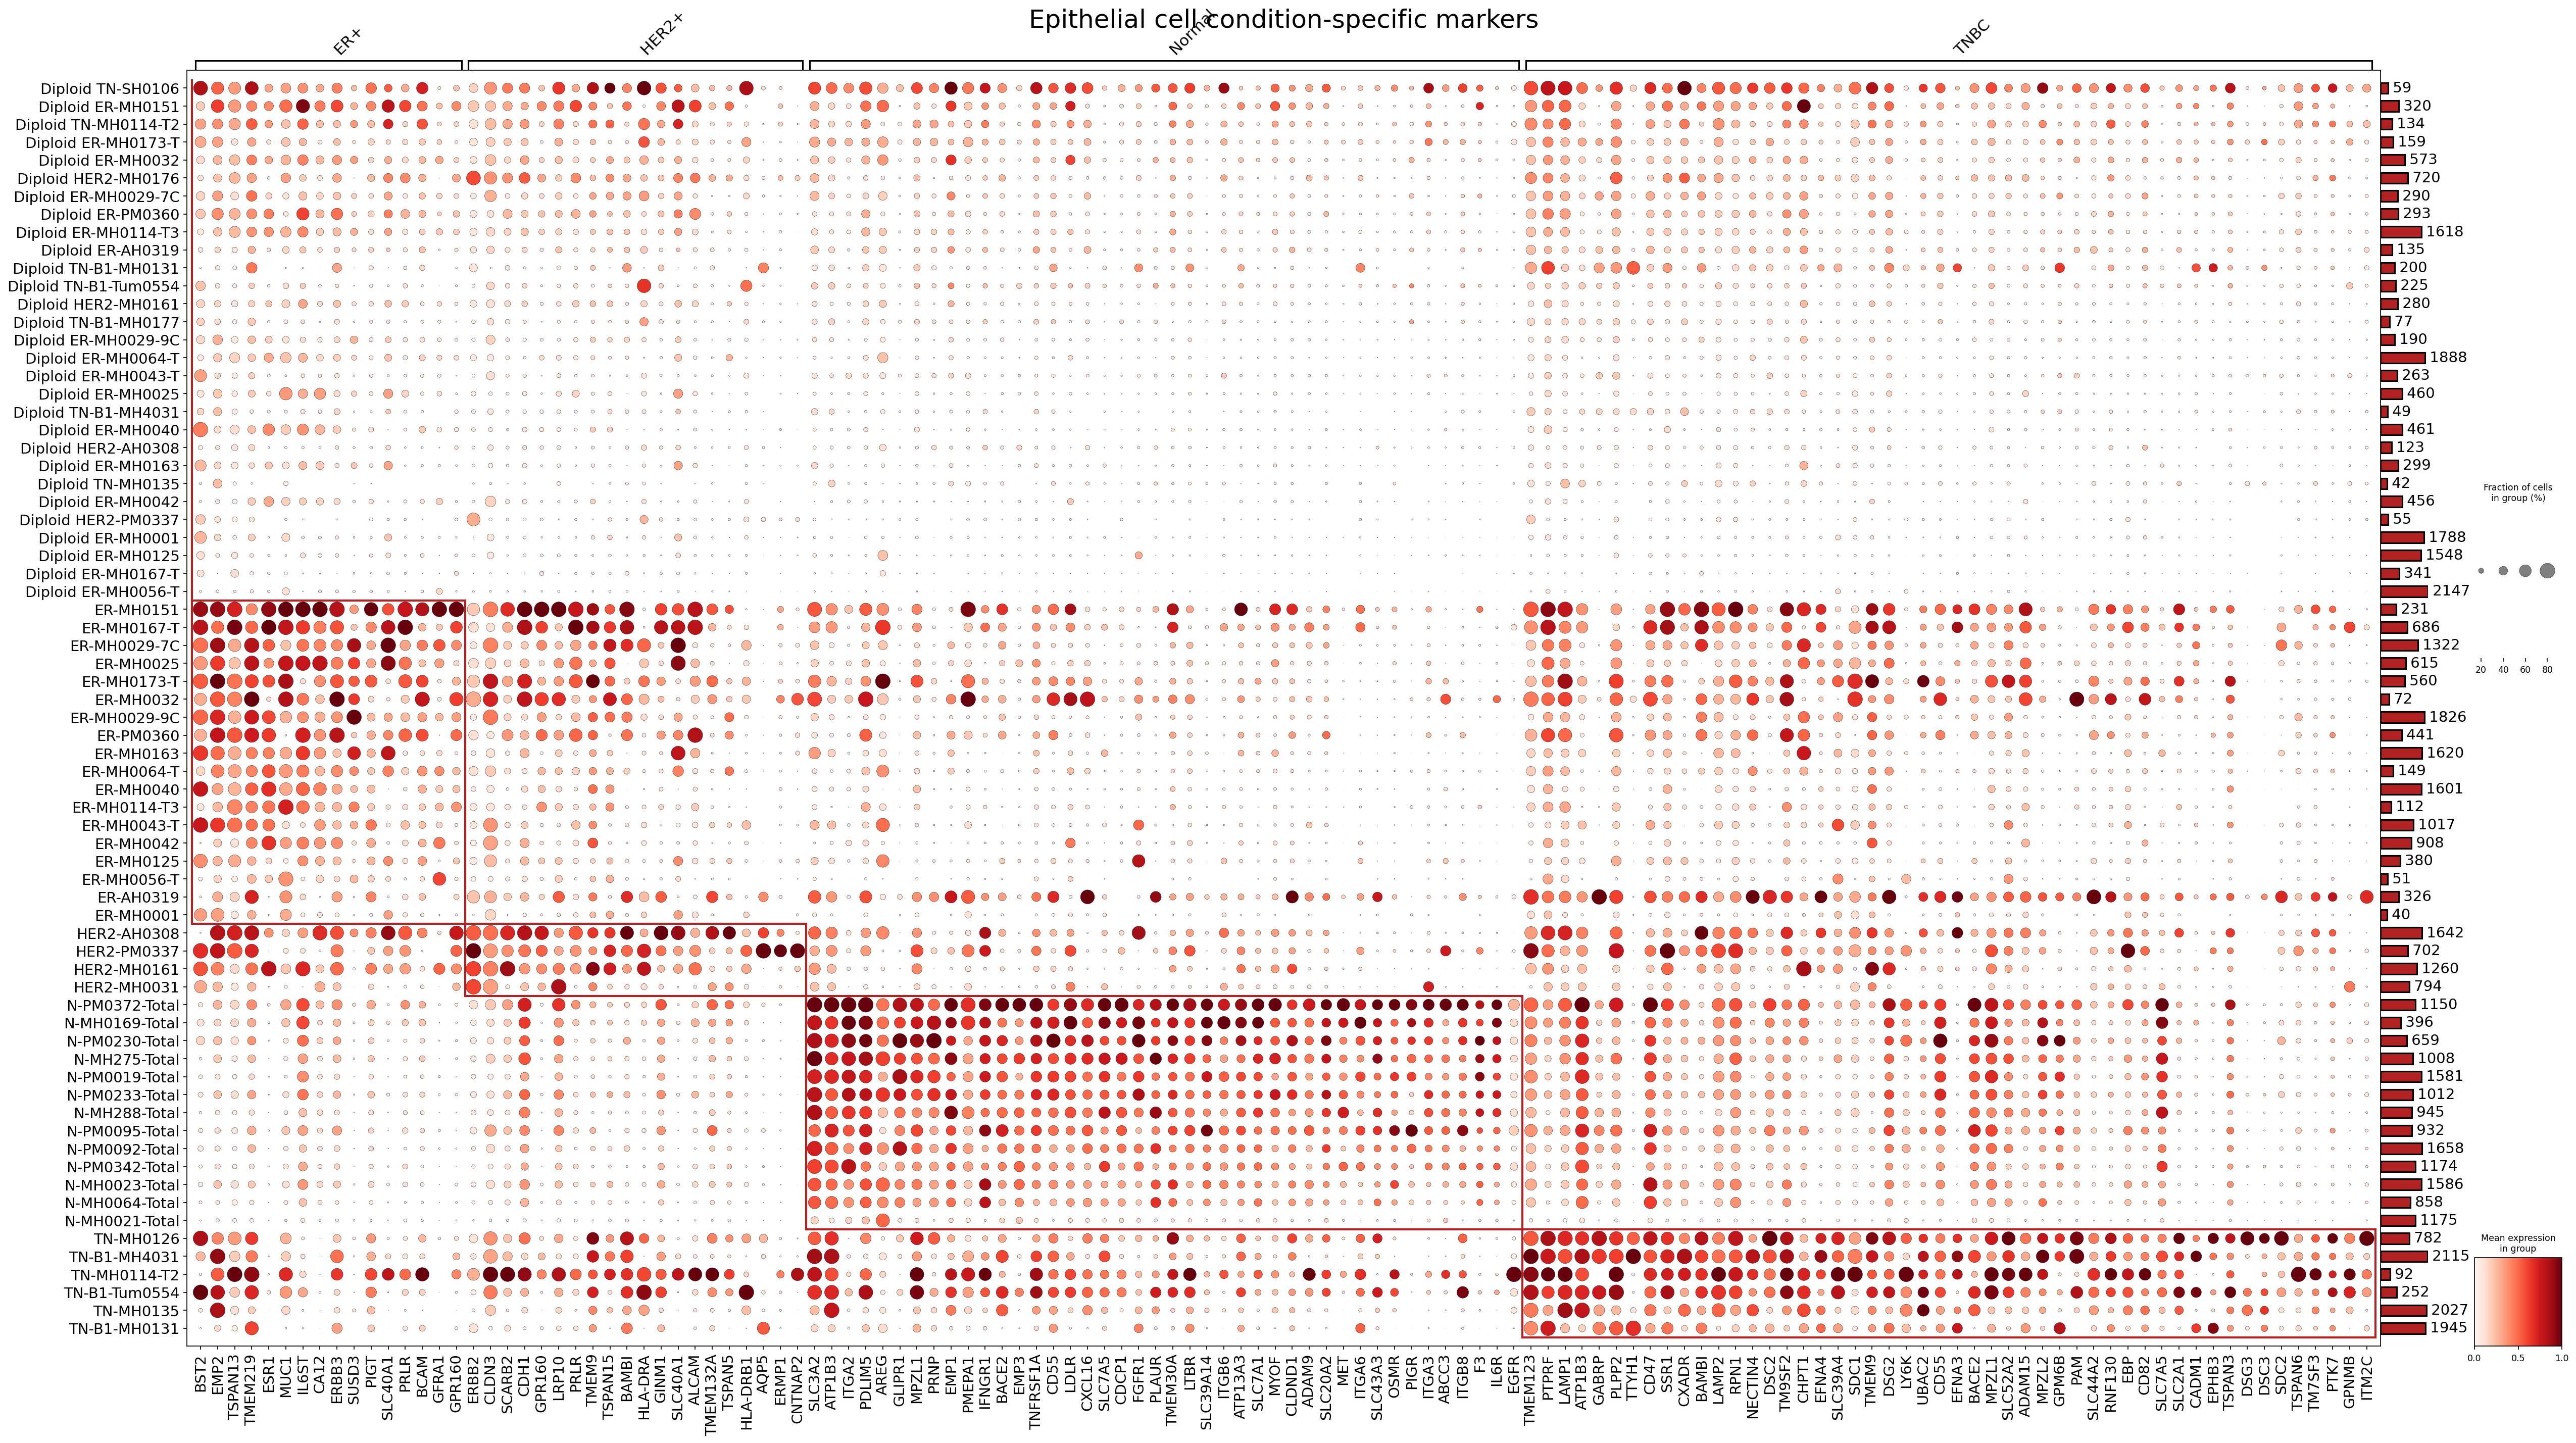
[Analysis Visualization Results]...
Analysis Overview
This analysis identifies and visualizes condition-specific surfaceome markers in epithelial cells across different breast tissue conditions: ER+ breast cancer, HER2+ breast cancer, Normal breast tissue, and Triple-Negative Breast Cancer (TNBC). The dot plot displays up to 50 unique surfaceome markers for each condition, showing both the fraction of cells expressing each marker (dot size) and the mean expression level (dot color intensity) within each sample group. Samples are also stratified by their inferred ploidy status (Diploid vs. Aneuploid) where applicable. The focus is on discovering cell-type-specific markers that could serve as diagnostic, prognostic, or therapeutic targets.
Visual Summary
The dot plot effectively illustrates distinct patterns of surfaceome marker expression across the four conditions, with clear clusters of highly expressed genes specific to each breast cancer subtype and normal tissue.
- ER+ Condition: A prominent cluster of markers is highly expressed in ER+ epithelial cells, particularly in both Diploid and Aneuploid ER+ samples. These markers show high mean expression and a high fraction of expressing cells within these groups. Noteworthy examples include *MUC1*, *ERBB3*, *IL6ST*, and *CA12*. While *ESR1* (Estrogen Receptor 1) is shown, which is a nuclear receptor and not a surfaceome marker in the classical sense, its detection likely reflects the strong ER+ identity of these cells, passing through the surfaceome filter possibly due to gene list curation or indirect association. The analysis primarily highlights other bona fide surface markers.
- HER2+ Condition: As expected, *ERBB2* (HER2) shows strong and pervasive expression across all HER2+ epithelial cells, regardless of ploidy, serving as the defining marker for this subtype. Other co-expressed surfaceome markers, such as *CLDN3* and *PRLR*, are also noticeable in this group.
- Normal Condition: Normal epithelial cells exhibit a distinct set of surfaceome markers. Genes related to normal physiological functions, such as *SLC40A1* (iron transporter), *ALCAM* (adhesion molecule), and *AQP5* (water channel), are evident. Interestingly, *HLA-DRA* and *HLA-DRB1*, components of MHC Class II, are also highly expressed in normal epithelial cells, which could indicate basal immune-related processes or responsiveness to microenvironmental cues in healthy tissue.
- TNBC Condition: TNBC epithelial cells display the largest and most diverse cluster of distinct surfaceome markers. High expression of *EGFR*, *PTK7*, *GPNMB*, *CD47*, and *SLC2A1* (GLUT1) is observed across multiple TNBC samples. This suggests a unique surface signature for this aggressive subtype.
- Ploidy Distinction: The plot distinguishes between Diploid and Aneuploid samples within the ER+ and HER2+ conditions. While specific ploidy-driven marker differences are not immediately striking at this broad level of visualization, both ploidy groups within a given tumor condition generally express the characteristic markers for that condition. Aneuploidy is a common feature of cancer, and its presence confirms the malignant nature of these samples.
Biological Interpretation
The identified surfaceome markers provide crucial insights into the distinct biology of breast cancer subtypes and normal mammary epithelium.
ER+ Markers:
- MUC1 (Mucin 1): A transmembrane glycoprotein often overexpressed in various cancers, including breast cancer. It plays roles in cell adhesion, signal transduction, and immune evasion. UniProt MUC1
- ERBB3 (HER3): A member of the epidermal growth factor receptor (EGFR) family. While lacking intrinsic kinase activity, it heterodimerizes with other HER receptors (like HER2 and EGFR) to activate downstream signaling pathways, promoting cell growth and survival. Its expression in ER+ cells suggests potential cross-talk with estrogen signaling or compensatory pathways. UniProt ERBB3
- IL6ST (gp130): The common signal transducing subunit for the IL-6 family of cytokines. Activation of IL-6 signaling pathways can promote tumor growth, survival, and metastasis in breast cancer. UniProt IL6ST
HER2+ Markers:
- ERBB2 (HER2): The defining oncoprotein for HER2+ breast cancer, involved in cell proliferation, survival, and angiogenesis. Its overexpression is a key driver of this subtype. UniProt ERBB2
- CLDN3 (Claudin-3): A tight junction protein whose expression is frequently dysregulated in breast cancer, often associated with tumor progression and metastasis.
- PRLR (Prolactin Receptor): The receptor for prolactin, a hormone involved in mammary gland development and lactation. Its aberrant expression can contribute to breast cancer progression. UniProt PRLR
Normal Markers:
- SLC40A1 (Ferroportin-1): The sole known iron exporter in mammals, crucial for maintaining cellular and systemic iron homeostasis. Its expression in normal epithelial cells suggests active iron regulation. UniProt SLC40A1
- AQP5 (Aquaporin-5): A water channel protein involved in fluid secretion and transport, particularly important in glandular tissues like the mammary gland. UniProt AQP5
- HLA-DRA/DRB1: Expression of MHC class II molecules by epithelial cells, especially in normal tissues, can be involved in presentation of antigens to T cells under specific conditions, influencing the local immune environment.
TNBC Markers:
- EGFR (Epidermal Growth Factor Receptor): A receptor tyrosine kinase frequently overexpressed and activated in TNBC, promoting cell proliferation, survival, and metastasis. It is a well-established therapeutic target in various cancers. UniProt EGFR
- PTK7 (Protein Tyrosine Kinase 7): A receptor tyrosine kinase-like orphan receptor involved in non-canonical Wnt signaling. It is often overexpressed in TNBC and associated with poor prognosis. UniProt PTK7
- GPNMB (Glycoprotein NMB): A transmembrane glycoprotein implicated in tumor cell motility, invasion, and angiogenesis. It is often highly expressed in TNBC and is a validated target for antibody-drug conjugates. UniProt GPNMB
- CD47: A "don't eat me" signal that interacts with SIRPα on myeloid cells to inhibit phagocytosis. Its upregulation in cancer cells, including TNBC, helps evade immune surveillance. UniProt CD47
- SLC2A1 (GLUT1): A glucose transporter protein that is highly expressed in many cancers, including TNBC, reflecting increased glucose uptake and metabolism characteristic of the Warburg effect. UniProt SLC2A1
Clinical or Translational Implications
The identification of condition-specific surfaceome markers in epithelial cells holds significant clinical and translational implications for breast cancer.
- Diagnostic and Prognostic Biomarkers: Markers highly specific to each breast cancer subtype could be developed into novel diagnostic tools to more precisely classify tumors, especially challenging cases like TNBC. For example, a panel of TNBC-specific surface markers could aid in differentiating TNBC from other subtypes or non-malignant conditions, and their expression levels might correlate with disease aggressiveness or patient outcomes.
- Therapeutic Targets: As these are surfaceome markers, they are directly accessible to therapeutic interventions such as antibody-drug conjugates (ADCs), monoclonal antibodies, or CAR-T cell therapies.
- HER2 (ERBB2) serves as the prime example, successfully targeted by trastuzumab, pertuzumab, and T-DM1.
- In TNBC, where targeted therapies are limited, markers like EGFR, PTK7, GPNMB, and CD47 represent promising avenues. EGFR-targeting agents have been explored with mixed success, but combinations or next-generation approaches could improve efficacy. GPNMB is already an ADC target (e.g., glembatumumab vedotin), and CD47 blockade is being investigated to activate anti-tumor immunity. PubMed search: GPNMB antibody drug conjugate TNBC
- For ER+ breast cancer, while endocrine therapy is standard, identifying novel surface targets like MUC1 or ERBB3 (which can be targeted) could offer additional treatment options, particularly in cases of resistance to endocrine therapy or for patients unsuitable for such treatments.
- Patient Stratification and Treatment Selection: A comprehensive panel of these surface markers could help refine patient stratification beyond current clinical classifications, identifying subgroups that might benefit from specific targeted therapies or clinical trial enrollment.
- Experimental Validation: The identified marker candidates warrant further experimental validation using techniques such as immunohistochemistry (IHC) on patient tissue arrays, flow cytometry on dissociated tumor cells, and functional studies in preclinical models to confirm their specificity, expression levels, and therapeutic tractability.
17. Macrophage Condition-Specific Surfaceome Markers in Breast Tissue
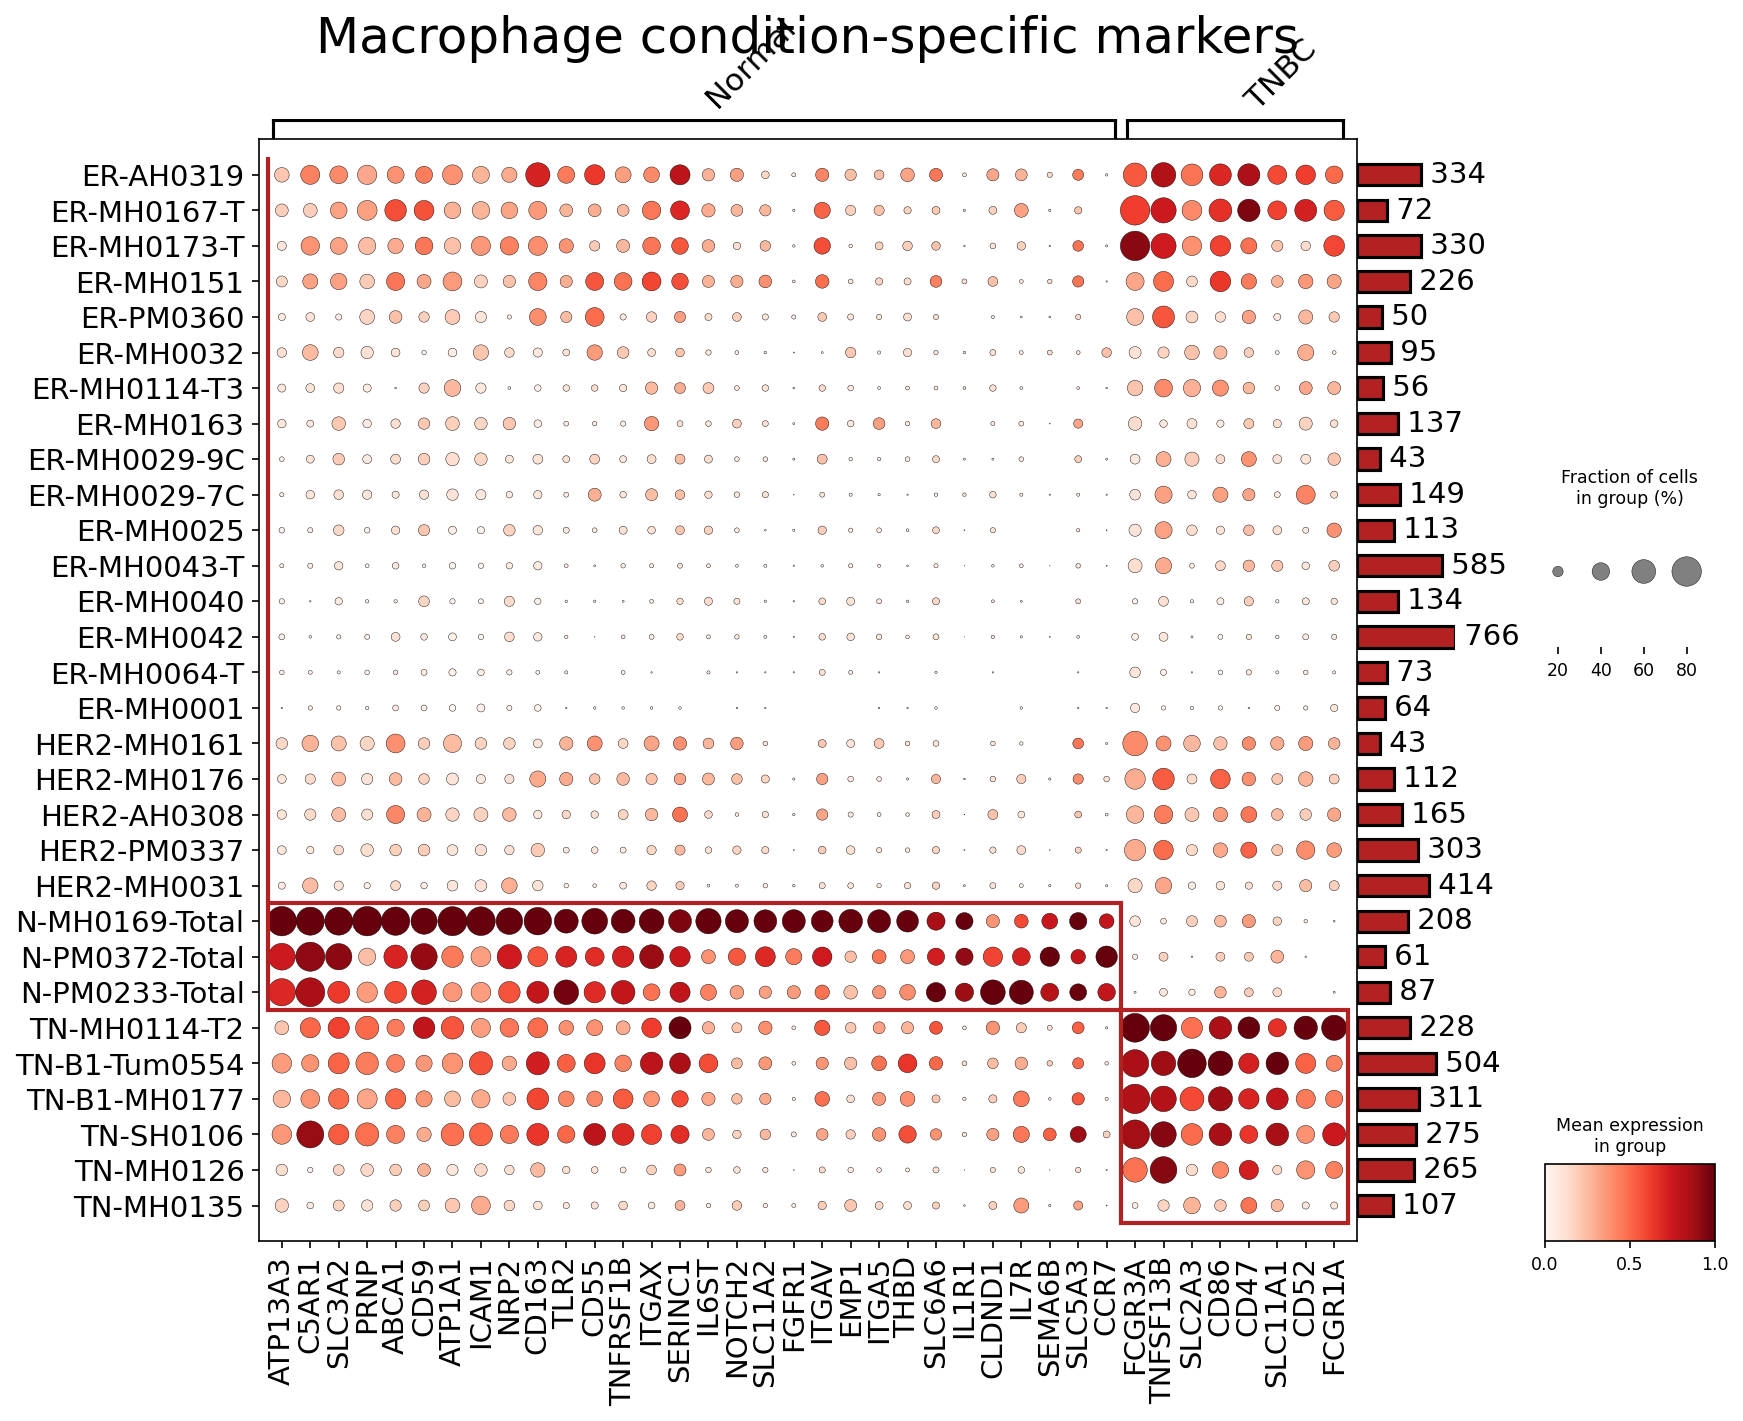
[Analysis Visualization Results]...
Analysis Overview
This analysis identifies and visualizes condition-specific surfaceome markers in Macrophage cells isolated from breast tissue. The dot plot displays the expression profiles of up to 50 surfaceome markers per condition (Normal and TNBC) across various patient samples. Each dot's size represents the fraction of cells within that sample/condition group expressing the gene, and its color intensity indicates the mean expression level of the gene in those cells. The goal is to highlight distinct macrophage phenotypes associated with normal tissue versus Triple-Negative Breast Cancer (TNBC).
Visual Summary
The dot plot clearly differentiates surfaceome markers expressed by macrophages in "Normal" breast tissue samples from those in "TNBC" samples.
- Normal Condition Markers: A prominent cluster of genes, including ATP13A3, C5AR1, SLC3A2, PRNP, ABCA1, CD59, ATP1A1, ICAM1, NRP2, CD163, TLR2, CD55, TNFRSF1B, ITGAX, SERINC1, IL6ST, NOTCH2, SLC11A2, FGFR1, ITGAV, EMP1, ITGA5, THBD, SLC6A6, CLDND1, IL1R1, SEMA6B, SLC5A3, IL7R, and CCR7, shows high expression (dark red color) and a high fraction of expressing cells (large dot size) specifically in the "Normal" samples (N-PM0169-Total, N-PM0372-Total, N-PM0233-Total). These markers are largely absent or expressed at very low levels in TNBC samples.
- TNBC Condition Markers: Conversely, a distinct set of markers, namely FCGR3A, TNFRSF13B, SLC2A3, CD86, CD47, CD52, and FCGR1A, exhibits high expression and prevalence in the "TNBC" samples. These markers show minimal to no expression in the "Normal" samples.
- Inter-sample Variability: While clear condition-specific patterns emerge, some variability is observed within the "Normal" and "TNBC" groups, particularly for samples not highlighted by the red box (e.g., ER-AH0319, HER2-MH0161, TN-B1-Tum0554). The N-PM0169-Total, N-PM0372-Total, and N-PM0233-Total samples show the most robust expression of the "Normal" specific markers, suggesting they represent a more archetypal normal macrophage phenotype in this dataset. The samples within the red box for TNBC (TN-B1-MH0114-T2, TN-B1-Tum0554, TN-B1-MH0177, TN-SH0106, TN-MH0126, TN-MH0135) show strong expression of the TNBC-associated markers.
Biological Interpretation
The identified surfaceome markers provide insights into the distinct functional states of macrophages in normal breast tissue versus the Triple-Negative Breast Cancer (TNBC) microenvironment.
Normal Breast Macrophages (N-PM0169-Total, N-PM0372-Total, N-PM0233-Total):
- CD163: This is a well-established scavenger receptor and a key marker for M2-polarized macrophages, which are typically associated with immune suppression, tissue remodeling, and angiogenesis. In normal tissue, M2-like macrophages likely play roles in homeostasis and tissue maintenance. GeneCards: CD163
- ICAM1 (CD54) & ITGAX (CD11c): These are adhesion molecules. ICAM1 is involved in leukocyte endothelial adhesion, and ITGAX is a subunit of complement receptor 4, involved in various immune responses. Their presence suggests immune surveillance and interaction with other cells.
- TLR2: Toll-like receptor 2 is involved in innate immunity, recognizing pathogen-associated molecular patterns (PAMPs) and danger-associated molecular patterns (DAMPs), indicating active immune sensing.
- CCR7: A chemokine receptor important for leukocyte migration to lymphatic tissues. Its expression could indicate a role in immune surveillance or homing to specific tissue niches.
- NRP2 (Neuropilin-2): Involved in angiogenesis, lymphatic development, and neural guidance. Its expression in normal tissue macrophages might relate to baseline tissue maintenance or interactions with vascular structures.
- TNBC-Associated Macrophages: The markers highly expressed in TNBC macrophages suggest a pro-tumorigenic phenotype, consistent with tumor-associated macrophages (TAMs) in aggressive cancers.
- FCGR3A (CD16a) & FCGR1A (CD64): These are Fc gamma receptors that bind to the Fc region of immunoglobulins. Their expression can lead to phagocytosis, antibody-dependent cellular cytotoxicity (ADCC), and antigen presentation. However, in the context of TAMs, FCGR expression can also contribute to immune evasion and pro-tumor functions, depending on the specific activating signals. GeneCards: FCGR3A GeneCards: FCGR1A
- CD86: A co-stimulatory molecule (B7-2) involved in T cell activation and differentiation. While generally associated with antigen-presenting cell activation, its role in TAMs can be complex, sometimes contributing to immune suppression or tolerance in the tumor microenvironment. GeneCards: CD86
- CD47: Known as the "don't eat me" signal, CD47 is often overexpressed on cancer cells to evade phagocytosis by macrophages. Its expression on macrophages themselves suggests complex cell-cell interactions within the tumor, potentially mediating interactions with CD47-expressing tumor cells or other immune cells. PubMed search: CD47 tumor microenvironment macrophage
- SLC2A3 (GLUT3): A glucose transporter. Upregulation of glucose transporters in TAMs can reflect their altered metabolic demands in the hypoxic and nutrient-deprived tumor microenvironment, often supporting a pro-tumorigenic phenotype.
These findings highlight significant phenotypic shifts in macrophages when transitioning from a normal tissue environment to a TNBC tumor microenvironment, characterized by distinct surface protein expression.
Clinical or Translational Implications
The identified condition-specific surfaceome markers in macrophages hold significant clinical and translational implications:
- Biomarker Potential: The differential expression of these surface markers could serve as diagnostic or prognostic biomarkers. For instance, high expression of FCGR3A, CD86, or CD47 on macrophages within a breast biopsy could indicate the presence of TNBC or a more aggressive tumor microenvironment. Conversely, the specific pattern of "Normal" markers might distinguish healthy tissue from cancerous lesions.
- Therapeutic Targets: The TNBC-associated macrophage surface markers represent potential therapeutic targets. Modulating the activity of receptors like FCGR3A, FCGR1A, or CD47 on TAMs could alter their pro-tumorigenic functions. For example, blocking CD47 on TAMs might enhance their phagocytic activity against tumor cells. PubMed search: Macrophage CD47 cancer therapy
- Immunotherapy Strategies: Understanding the distinct surfaceome profiles can inform the development of macrophage-targeted immunotherapies. Strategies could involve re-educating pro-tumorigenic TAMs towards an anti-tumor phenotype by targeting these specific surface receptors or pathways.
- Experimental Validation: These identified surface markers are excellent candidates for further experimental validation using techniques such as flow cytometry, immunohistochemistry (IHC), or immunofluorescence on breast tissue samples. Such validation can confirm their utility as cell-type-specific markers for distinguishing macrophage populations in normal versus TNBC contexts and assess their correlation with clinical outcomes.
18. Condition-Specific Surfaceome Markers in Breast Cancer Fibroblasts
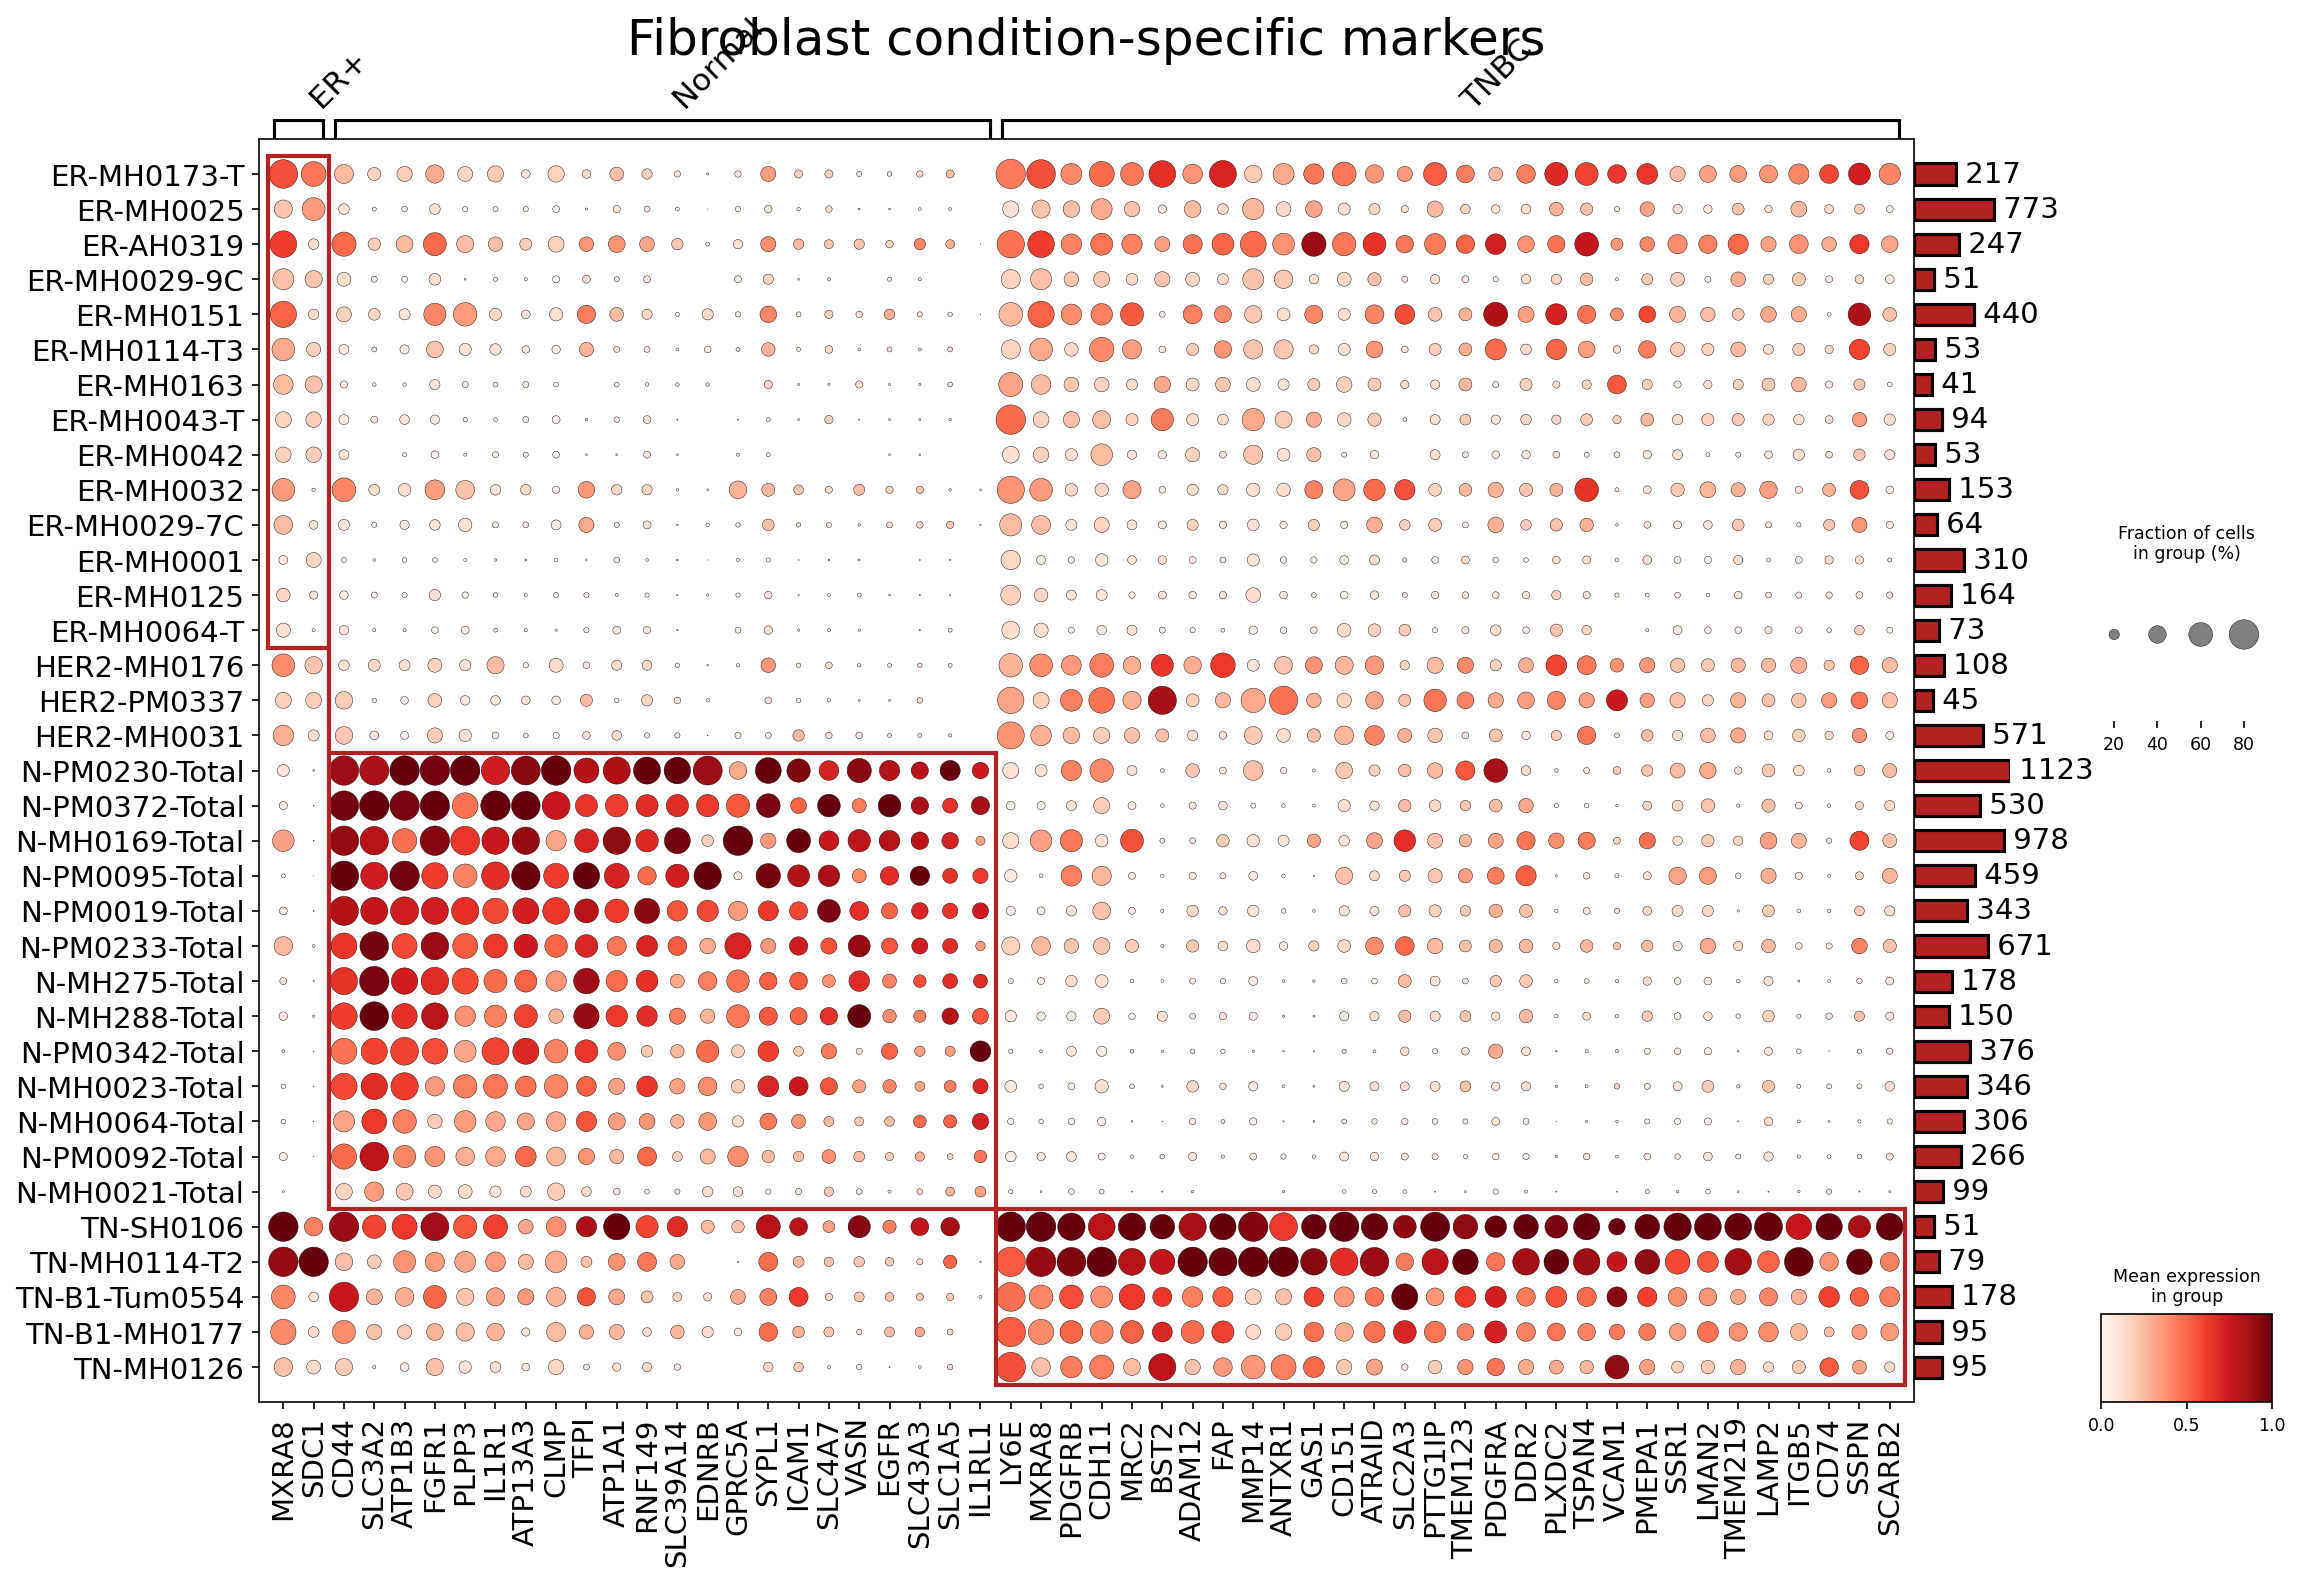
[Analysis Visualization Results]...
Analysis Overview
This analysis identifies condition-specific surfaceome markers in Fibroblasts across different breast cancer subtypes (ER+, HER2+, TNBC) and normal breast tissue using single-cell RNA sequencing data. The dot plot visualizes the expression of these surface-localized genes, showing both the fraction of cells expressing each gene (dot size) and the mean expression level (dot color intensity) within each patient sample group. The goal is to pinpoint surface proteins that characterize fibroblasts in different disease states, which can serve as potential biomarkers or therapeutic targets.
Visual Summary
The dot plot effectively highlights distinct surfaceome gene expression profiles in fibroblasts across the three primary conditions: ER+, Normal, and TNBC.
- Normal Fibroblasts display a robust and largely uniform expression of a distinct cluster of surface markers. Genes such as MXRA8, SDC1, CD44, SLC3A2, ATP1B3, FGFR1, PLPP3, IL1R1, ATP13A3, CLMP, TFPI, ATP1A1, RNF149, SLC39A14, EDNRB, GPRC5A, SYPL1, ICAM1, SLC4A7, VASN, EGFR, SLC43A3, SLC1A5 show high expression levels across a significant fraction of cells in most normal samples. This suggests a common fibroblast phenotype in healthy breast tissue.
- ER+ Fibroblasts show a less distinct and generally lower expression pattern compared to both Normal and TNBC groups. While some markers like MXRA8, SDC1, CD44, and ATP1B3 show moderate expression in certain ER+ samples, the overall intensity and prevalence are reduced. This indicates a different activation state or less pronounced specific surfaceome signature compared to the other conditions.
- TNBC Fibroblasts exhibit a strikingly distinct and highly activated surfaceome profile. A prominent cluster of genes, including LY6E, MXRA8, PDGFRB, CDH11, MRC2, BST2, ADAM12, FAP, MMP14, ANTXR1, GAS1, ATRAID, SLC2A3, PTTG1IP, TMEM123, PLXDC2, VCAM1, PMEPA1, LMAN2, TMEM219, ITGB5, SSPN, SCARB2, are highly expressed and present in a large fraction of cells across most TNBC samples. This signature clearly differentiates TNBC-associated fibroblasts from those in normal or ER+ tissues. The two HER2+ samples (HER2-PM0337 and HER2-MH0031) show a mixed pattern, with some overlap with TNBC-specific markers (e.g., FAP, MMP14) but generally lower expression than in the main TNBC cluster.
Biological Interpretation
The observed condition-specific surfaceome markers provide significant insights into the biological roles of fibroblasts in different breast cancer contexts.
- Normal Fibroblasts: The markers found in normal tissue fibroblasts likely reflect their physiological roles in maintaining tissue structure, contributing to the extracellular matrix (ECM), and engaging in basal cell-cell communication. For instance, SDC1 (Syndecan-1) is a key proteoglycan involved in cell adhesion and growth factor signaling, important for normal tissue homeostasis [GeneCards]. CD44 mediates cell adhesion and migration, critical for tissue integrity and repair [GeneCards]. The expression of these markers highlights the general quiescent and supportive functions of fibroblasts in a healthy microenvironment.
- TNBC Fibroblasts (Cancer-Associated Fibroblasts - CAFs): The highly distinct and robust signature in TNBC fibroblasts points to their active involvement in promoting tumor progression. Many identified markers are well-known to be associated with highly activated, pro-tumorigenic CAFs:
- FAP (Fibroblast Activation Protein): A canonical marker of CAFs, strongly implicated in ECM remodeling, immunosuppression, and tumor growth across various cancers [GeneCards]. Its high expression here is consistent with a pro-tumorigenic role in TNBC.
- PDGFRB (Platelet-Derived Growth Factor Receptor Beta): Essential for fibroblast proliferation, migration, and angiogenesis, often contributing to a desmoplastic tumor microenvironment [GeneCards].
- MMP14 (Matrix Metallopeptidase 14) and ADAM12 (ADAM Metallopeptidase Domain 12): These are metalloproteases crucial for degrading ECM components, facilitating tumor cell invasion, and metastasis [GeneCards]. Their upregulation indicates increased ECM remodeling in TNBC.
- VCAM1 (Vascular Cell Adhesion Molecule 1): Can promote immune cell recruitment and modulate immune responses within the tumor microenvironment, potentially contributing to immune evasion and metastasis [GeneCards].
- LY6E: Implicated in cell survival and proliferation in various cancers.
This collective signature strongly suggests that TNBC-associated fibroblasts are highly activated, contribute significantly to ECM remodeling, and create a highly permissive and aggressive tumor microenvironment.
- ER+ Fibroblasts: The less pronounced specific signature for ER+ fibroblasts may suggest that while fibroblasts are present and contribute to the tumor microenvironment, their activation state or specific roles, as captured by these surfaceome markers, might be less distinct or involve different molecular pathways compared to the highly aggressive TNBC subtype.
Clinical or Translational Implications
The identification of condition-specific surfaceome markers in fibroblasts holds significant clinical and translational potential.
- Diagnostic and Prognostic Biomarkers: The unique surfaceome signatures, particularly those of TNBC fibroblasts (e.g., FAP, PDGFRB, MMP14), could serve as powerful diagnostic or prognostic biomarkers. Their expression could help in stratifying breast cancer patients, identifying those with more aggressive disease characteristics, or monitoring treatment response. These markers could be assessed in tissue biopsies using immunohistochemistry or in circulating cells via flow cytometry.
- Therapeutic Targets: Given their surface localization and distinct expression in TNBC-associated fibroblasts, these markers represent attractive targets for novel therapeutic strategies. Targeting proteins like FAP, PDGFRB, or MMP14 in CAFs could disrupt the pro-tumorigenic microenvironment, inhibit tumor growth and metastasis, and potentially enhance the efficacy of conventional therapies. Several FAP inhibitors and PDGFR inhibitors are already under investigation in oncology PubMed search for FAP inhibitors cancer therapy.
- Understanding Tumor Microenvironment Heterogeneity: The distinct fibroblast profiles across different breast cancer subtypes emphasize the heterogeneity of the tumor microenvironment. This understanding can guide the development of precision medicine approaches, allowing for therapies that are tailored to the specific CAF phenotype in a patient's tumor.
- Experimental Validation: These findings warrant further experimental validation. Functional studies using in vitro fibroblast cultures and in vivo mouse models could elucidate the precise roles of these surface markers in fibroblast activation, tumor progression, and therapeutic resistance. Validating their protein expression and localization in patient tissue samples using techniques like multiplex immunofluorescence or spatial proteomics would be crucial for clinical translation.
19. T cell CD4+ Condition-Specific Surfaceome Markers in Breast Cancer
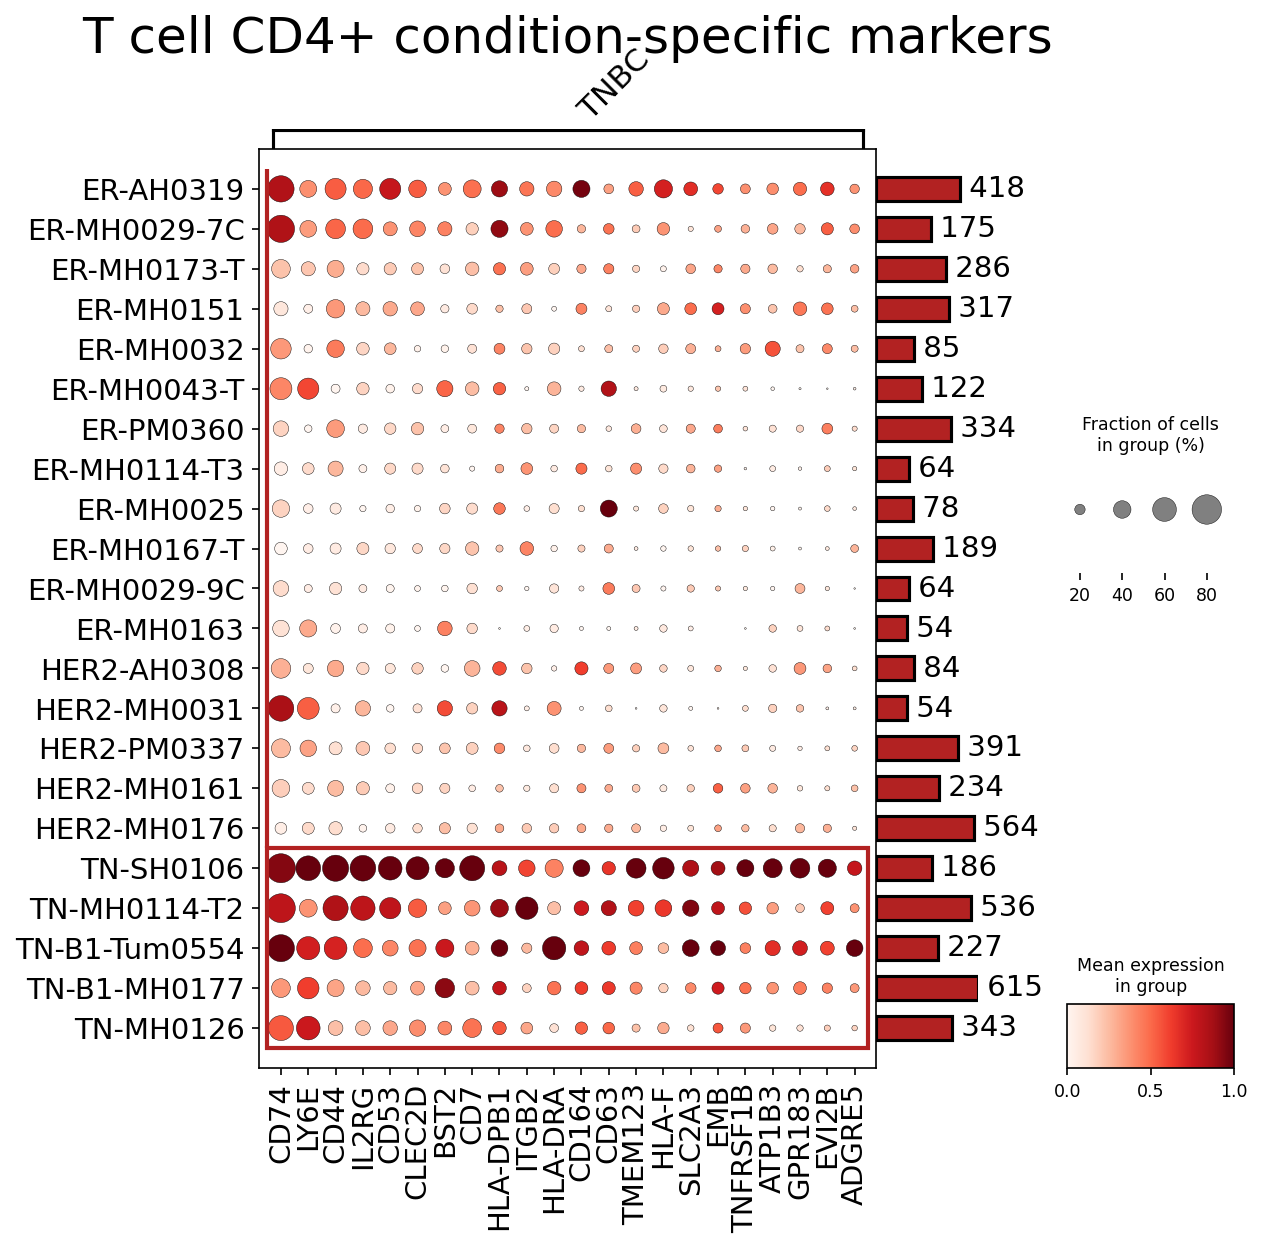
[Analysis Visualization Results]...
Analysis Overview
This analysis aimed to identify condition-specific surfaceome markers in CD4+ T cells across different breast cancer subtypes (ER+, HER2+, TNBC) by comparing gene expression between conditions and selecting up to 50 top differentially expressed surface proteins per condition. The results are visualized as a dot plot, where dot size represents the fraction of cells expressing the marker, and dot color intensity represents the mean expression level within each sample. The specific focus is on understanding unique surface marker profiles that might distinguish CD4+ T cells in one breast cancer subtype from others.
Visual Summary
The dot plot displays the expression of selected surfaceome markers across individual patient samples, grouped by their primary breast cancer subtype: ER+, HER2+, and TNBC.
- Distinct TNBC Profile: A striking pattern emerges, particularly for samples classified as TNBC (highlighted by the red box). These samples consistently show high expression (dark red dots) and a high fraction of cells (large dot size) for a broad panel of surface markers.
- Markers Enriched in TNBC CD4+ T cells: Key markers such as CD74, LY6E, CD44, IL2RG, CD53, CLEC2D, BST2, ITGB2, HLA-DRA, CD164, CD63, TMEM123, HLA-F, TNFRSF1B, ATP1B3, GPR1B3, and EVI2B exhibit prominent expression in almost all TNBC samples.
- Contrast with ER+ and HER2+: In stark contrast, CD4+ T cells from ER+ and HER2+ samples (above the red box) generally show much lower expression (lighter red or white dots) and a smaller fraction of expressing cells (smaller dots) for most of these identified markers. While some markers like CD74 or CD44 show moderate expression in a few ER+ or HER2+ samples, the overall profile is significantly less pronounced than in TNBC.
- Homogeneity within TNBC: Within the TNBC group, there appears to be a relatively consistent expression pattern across most of the identified markers, suggesting a shared immune phenotype of CD4+ T cells in this aggressive subtype.
Biological Interpretation
The observed enrichment of specific surfaceome markers on CD4+ T cells in TNBC suggests a distinct immune microenvironment and unique T cell activation/differentiation states within this cancer subtype compared to ER+ and HER2+ breast cancers.
Activated and Antigen-Experienced T cells:
- High expression of CD74 (MHC class II invariant chain) and HLA-DRA/HLA-F (MHC class II components) on CD4+ T cells can indicate an activated or antigen-experienced state, or even potentially an unusual capacity for antigen presentation by these T cells within the TNBC microenvironment [1, 2].
- CD44 is a well-known adhesion molecule associated with T cell activation, homing to inflammatory sites, and interaction with extracellular matrix components. Its high expression suggests T cells actively engaging with the tumor microenvironment [3].
- ITGB2 (CD18), a subunit of integrin adhesion molecules (e.g., LFA-1), is crucial for leukocyte adhesion, migration, and immune synapse formation. Elevated ITGB2 points to enhanced T cell adhesion and migratory capabilities, which are essential for tumor infiltration [4].
Immune Modulatory Roles:
- TNFRSF1B (TNF-R2) is a receptor for TNF-alpha, often expressed on activated T cells, including regulatory T cells (Tregs) and effector T cells in chronic inflammation. Its presence might indicate T cell involvement in immune regulation or effector functions within the TNBC context [5].
- CLEC2D (LLT1) expression on T cells could imply interactions with NK cells, potentially modulating innate immune responses [6].
- BST2 (Tetherin) is an interferon-inducible protein with roles in immune regulation and antiviral defense, hinting at an interferon-rich environment or specific immune checkpoints [7].
Cytokine Responsiveness and Metabolism:
- IL2RG (Common gamma chain) is a vital component of receptors for several cytokines (IL-2, IL-7, IL-15), crucial for T cell proliferation and survival. High levels suggest increased responsiveness to these cytokines within the TNBC milieu.
- SLC2A3 (GLUT3), a glucose transporter, could indicate an altered metabolic state of these T cells, potentially adapted to the nutrient-deprived tumor microenvironment [8].
The enrichment of these surface markers collectively points towards a highly active and potentially diverse population of CD4+ T cells in TNBC, which could include both anti-tumor effector cells and immunosuppressive cells (e.g., Tregs or exhausted T cells), all adapting to the unique challenges posed by this aggressive tumor type.
Clinical or Translational Implications
The identification of this panel of TNBC-specific surfaceome markers on CD4+ T cells holds significant clinical and translational potential:
- Biomarkers for TNBC: These markers could serve as a valuable signature for distinguishing TNBC from other breast cancer subtypes. They could be used for advanced diagnostic profiling, patient stratification, or monitoring disease progression, potentially through liquid biopsy approaches if these markers are present on circulating T cells or T cell-derived exosomes.
- Therapeutic Targets: Given their surface localization, these proteins are attractive candidates for targeted therapies. For instance, antibodies or antibody-drug conjugates (ADCs) against highly expressed and specific markers like CD74, LY6E, CD44, ITGB2, or TNFRSF1B could be developed to modulate CD4+ T cell function, enhance anti-tumor immunity, or selectively deplete specific T cell subsets that promote tumor growth or immunosuppression in TNBC.
- Immune Profiling and Stratification: These markers provide a robust set of targets for advanced immune profiling of TNBC patient samples using techniques like flow cytometry, mass cytometry, or immunohistochemistry. This could help in:
- Understanding Treatment Response: Correlating marker expression with response to immunotherapies or other standard treatments.
- Identifying Subpopulations: Delineating specific functional subsets of CD4+ T cells (e.g., effector, regulatory, exhausted) that are uniquely expanded or activated in TNBC.
- Experimental Validation: The findings warrant further experimental validation at the protein level using patient-derived cells and tissues. This would involve flow cytometry on fresh tumor infiltrates, mass cytometry, or multiplex immunohistochemistry/immunofluorescence to confirm surface protein expression and co-expression patterns. Such validation is critical before exploring their clinical utility.
References
- CD74 (Invariant chain): A chaperone for MHC class II molecules, involved in antigen presentation and can also function as a receptor for MIF. GeneCards: CD74
- HLA-DRA: Component of MHC Class II molecules, essential for presenting antigens to CD4+ T cells. GeneCards: HLA-DRA
- CD44: Cell adhesion molecule involved in cell-cell interactions and migration, associated with T cell activation and stemness. GeneCards: CD44
- ITGB2 (CD18): Integrin beta-2 subunit, critical for leukocyte adhesion and migration. GeneCards: ITGB2
- TNFRSF1B (TNF-R2): Receptor for TNF-alpha, involved in inflammation and T cell survival/activation. GeneCards: TNFRSF1B
- CLEC2D (LLT1): NK cell receptor ligand, can modulate NK cell activity; expressed on T cells may imply immune modulation. GeneCards: CLEC2D
- BST2 (Tetherin): Interferon-inducible protein involved in immune regulation. GeneCards: BST2
- SLC2A3 (GLUT3): Glucose transporter, implicated in altered metabolism of immune cells in the TME. GeneCards: SLC2A3
20. Dysregulation of Cell Cycle Genes in Breast Cancer Epithelial Cells Across Subtypes
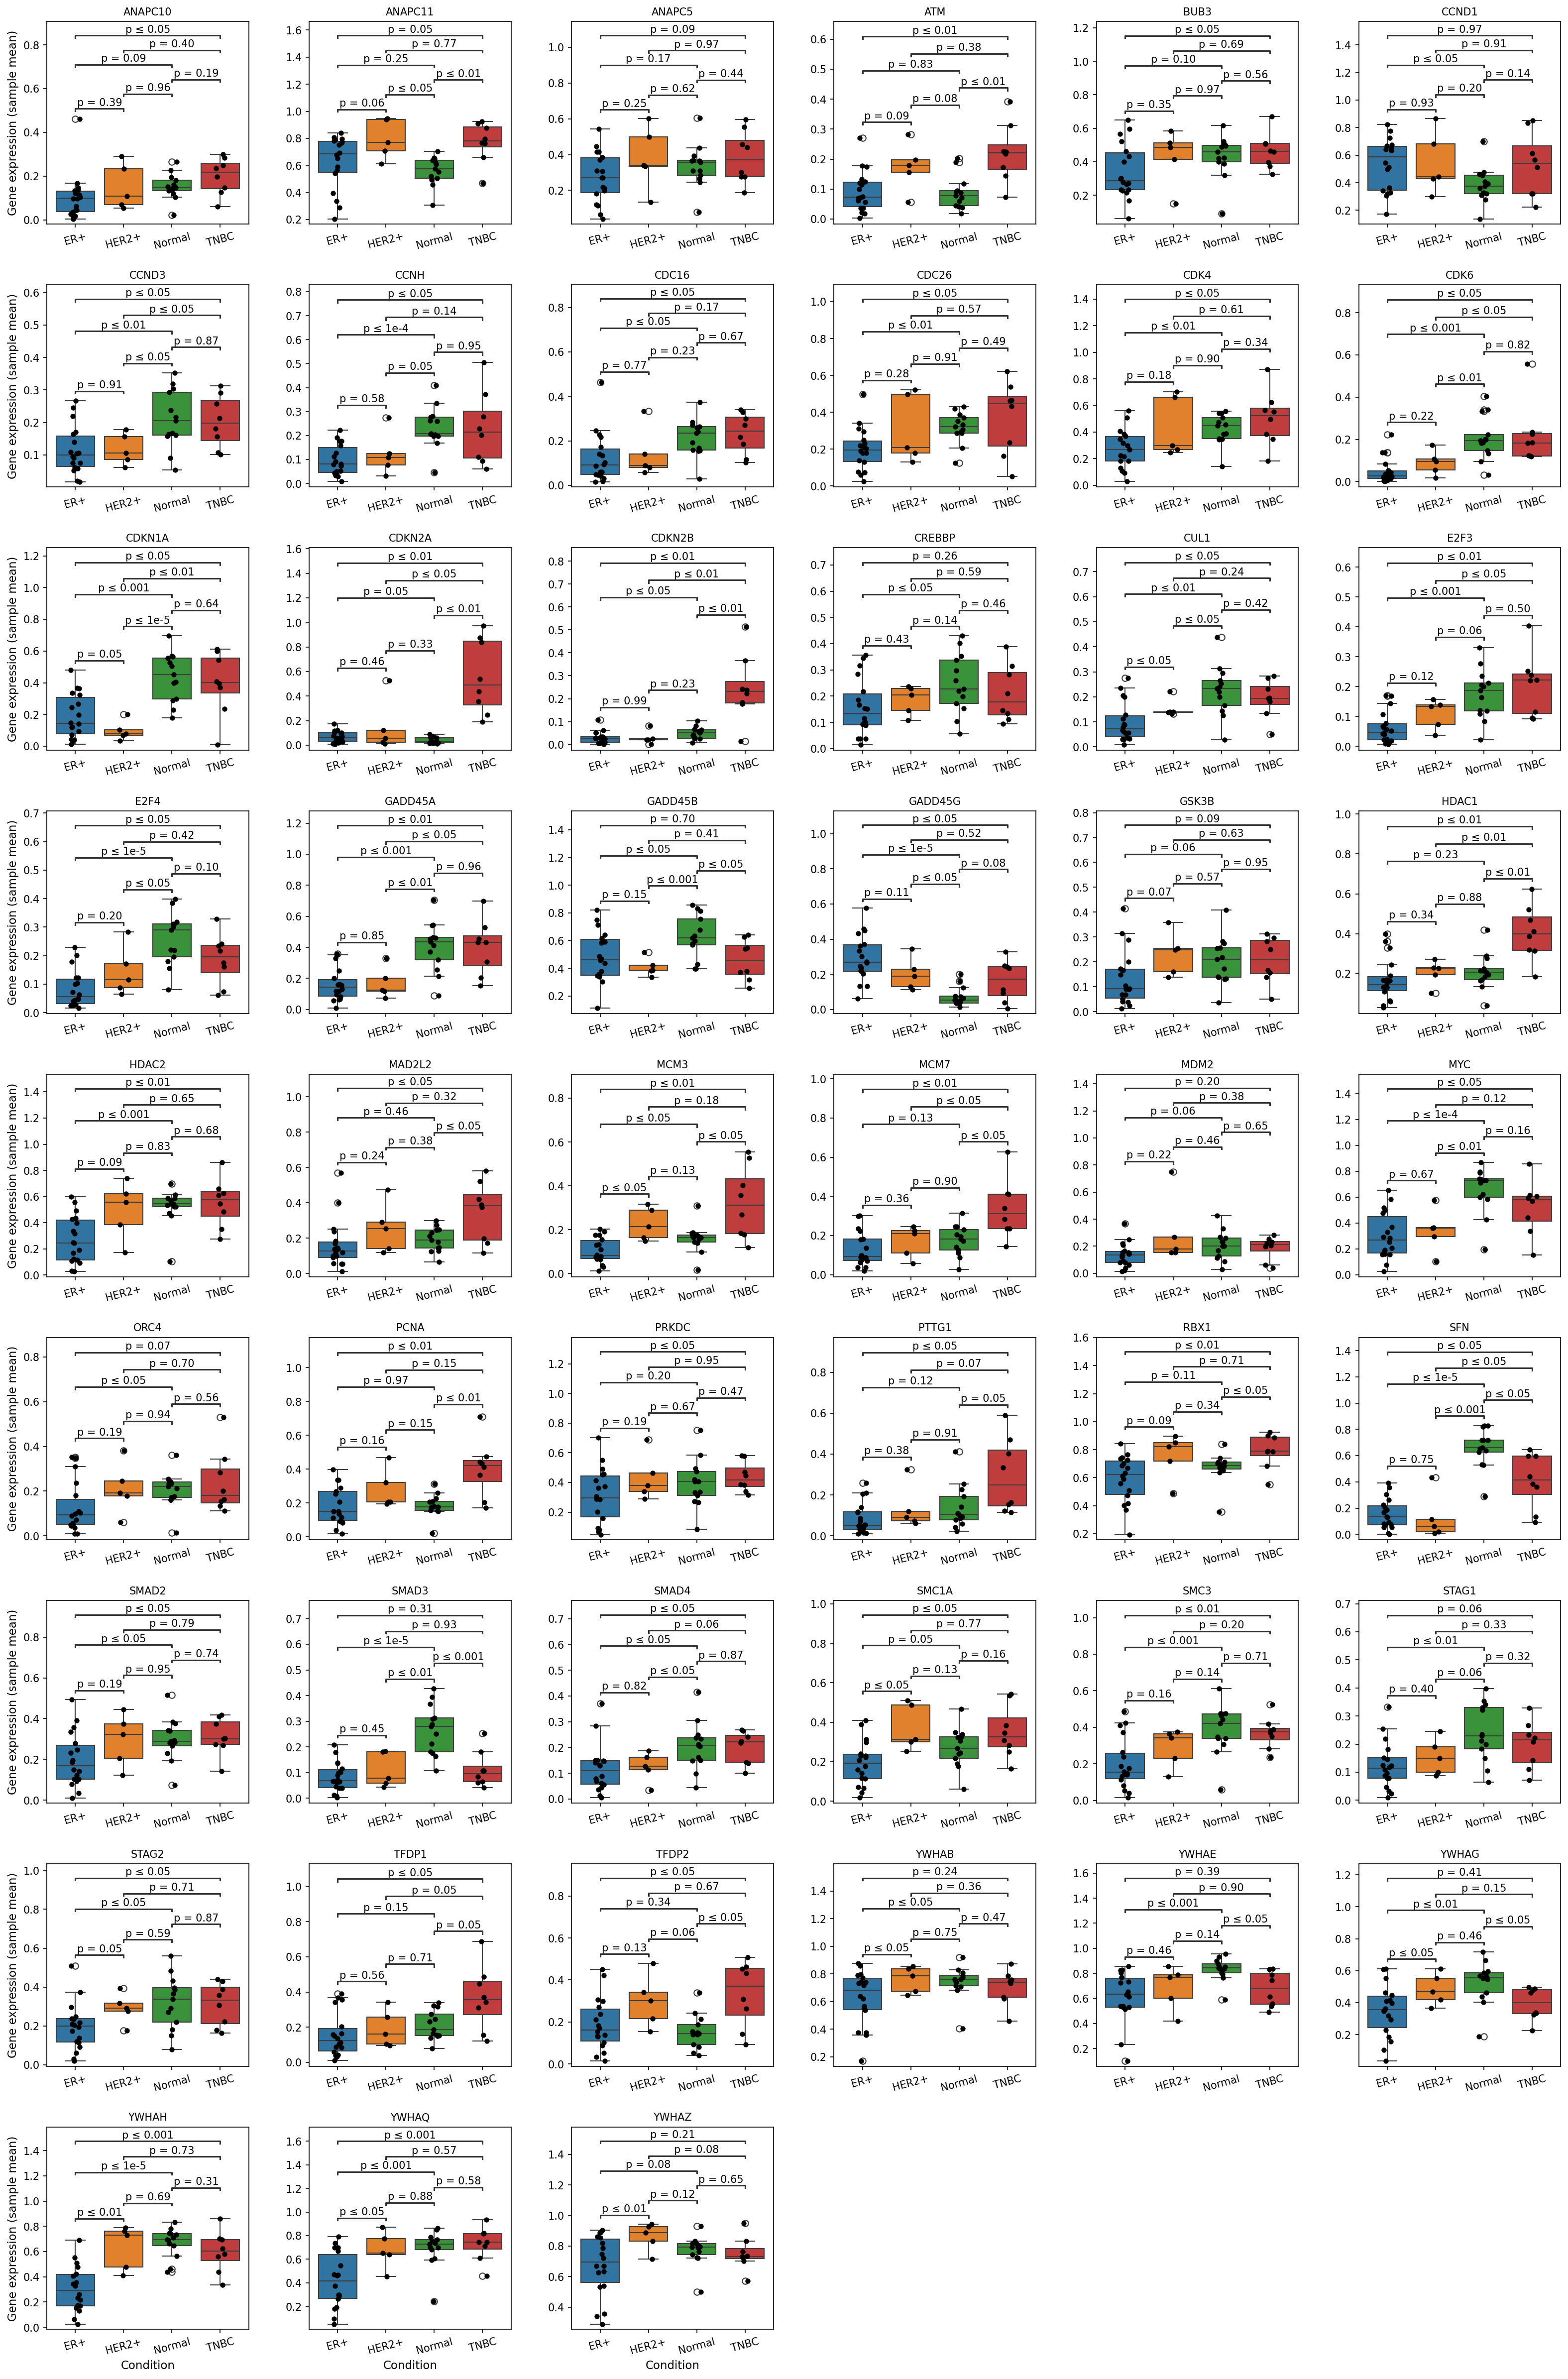
[Analysis Visualization Results]...
Analysis Overview
This analysis investigates the expression patterns of 36 selected cell cycle-related genes within Epithelial cells across different breast cancer conditions (ER+, HER2+, TNBC) compared to Normal breast tissue. The plot_box_for_gene_expression_with_signif_difference tool was used to visualize gene expression distributions and statistically significant differences between conditions using box plots, filtering for genes with a p-value cutoff of 0.1 and a log2 fold change cutoff of 0.1.
Visual Summary
The box plots clearly illustrate distinct expression profiles for many cell cycle genes across the four conditions (ER+, HER2+, Normal, TNBC) in epithelial cells.
- A predominant pattern observed is the upregulation of key proliferation-driving genes in one or more breast cancer subtypes (ER+, HER2+, TNBC) relative to Normal tissue, often with HER2+ and TNBC showing the highest expression levels.
- Conversely, downregulation of several cell cycle inhibitors and DNA damage response genes is evident in cancer subtypes compared to Normal.
- Statistical significance (p-values) is indicated for pairwise comparisons, highlighting many substantial differences, particularly when comparing cancer subtypes to Normal, and often between the more aggressive HER2+ and TNBC subtypes versus ER+.
- Genes such as E2F3, MYC, MCM3, MCM7, PCNA, ATM, HDAC1, HDAC2, and several 14-3-3 family members (YWHAE, YWHAG, YWHAH, YWHAQ, YWHAZ) generally show increased expression in cancer.
- In contrast, genes like CDKN1A, CDKN2A, CDKN2B, GADD45A, GADD45B, GADD45G, SMAD3, SMAD4, and SFN are typically expressed at lower levels in cancer conditions compared to Normal.
Biological Interpretation
The observed differential expression of cell cycle-related genes in epithelial cells provides critical insights into the molecular hallmarks of breast cancer, particularly sustained proliferative signaling and evasion of growth suppressors.
- Enhanced Proliferative Drive in Cancer Subtypes:
- Many genes associated with cell cycle progression and DNA replication are significantly upregulated in breast cancer epithelial cells. For instance, MYC, a potent oncogene and master regulator of cell growth and proliferation, shows markedly higher expression in HER2+ (p≤1e-4 vs Normal) and TNBC (p≤0.01 vs Normal) GeneCards: MYC.
- Similarly, DNA replication licensing factors MCM3 and MCM7 are generally elevated in HER2+ and TNBC compared to Normal (p≤0.05). PCNA, a marker of DNA synthesis, is also significantly increased in HER2+ and TNBC (p≤0.01 vs Normal) UniProt: PCNA.
- E2F3, a transcription factor crucial for driving cells into S-phase, exhibits a particularly strong upregulation in TNBC (p≤0.001 vs Normal, p≤0.01 vs ER+ and HER2+), indicating a highly aggressive proliferative phenotype unique to this subtype.
- Components of the Anaphase-Promoting Complex/Cyclosome (APC/C) such as ANAPC5, ANAPC10, ANAPC11, CDC26, and ubiquitin ligase components like CUL1 and RBX1 also show increased expression, suggesting accelerated cell cycle progression through regulated protein degradation.
- Compromised Cell Cycle Checkpoints and DNA Damage Response:
- Crucially, key cyclin-dependent kinase inhibitors (CDKIs) such as CDKN1A (p21), CDKN2A (p16), and CDKN2B (p15) are consistently downregulated across all breast cancer subtypes (ER+, HER2+, TNBC) compared to Normal tissue (e.g., CDKN2A p≤0.01 vs Normal for all cancer subtypes) PubMed Search: CDKN2A breast cancer. This loss of inhibitory control allows cancer cells to bypass critical cell cycle checkpoints, leading to uncontrolled proliferation.
- Genes involved in DNA damage-induced cell cycle arrest, the GADD45 family (GADD45A, GADD45B, GADD45G), are also significantly downregulated in cancer subtypes compared to Normal (e.g., GADD45G p≤1e-5 vs Normal across all cancer subtypes) GeneCards: GADD45G. This suggests a blunted DNA damage response, allowing damaged cells to continue dividing, contributing to genomic instability.
- Interestingly, ATM, a major DNA damage sensor kinase, is upregulated in HER2+ and TNBC compared to Normal (p≤0.01). This could reflect an increased burden of DNA damage due to rapid proliferation and genomic instability in these aggressive tumors, where ATM is activated but other downstream arrest/apoptosis pathways (e.g., GADD45) are suppressed.
- Dysregulation of TGF-beta Signaling:
- Key mediators of the tumor-suppressive TGF-beta pathway, SMAD3 and SMAD4, are consistently downregulated in breast cancer epithelial cells compared to Normal (e.g., SMAD3 p≤1e-5 vs Normal in ER+ and HER2+; p≤0.001 in TNBC) UniProt: SMAD3. This suggests that cancer cells evade growth inhibitory signals typically mediated by the TGF-beta pathway, further contributing to their uncontrolled proliferation.
- Differential Role of 14-3-3 Proteins:
- While SFN (14-3-3 sigma), often considered a tumor suppressor, is downregulated in all cancer subtypes compared to Normal, several other 14-3-3 family members (YWHAB, YWHAE, YWHAG, YWHAH, YWHAQ, YWHAZ) are significantly upregulated, especially in HER2+ and TNBC. The 14-3-3 proteins regulate diverse cellular processes including cell cycle, apoptosis, and signal transduction. This differential expression indicates a complex re-wiring of signaling pathways that may collectively favor cell survival and proliferation in aggressive breast cancer subtypes PubMed Search: 14-3-3 proteins cancer.
- Subtype-Specific Signatures:
- HER2+ and TNBC subtypes consistently exhibit a more pronounced proliferative signature compared to ER+ breast cancer and Normal tissue, characterized by higher expression of oncogenes (MYC, E2F3) and DNA replication machinery (MCMs, PCNA), coupled with lower expression of CDKIs and GADD45s. This aligns with their generally more aggressive clinical behavior and higher proliferation rates.
- TNBC particularly shows a strong signal for E2F3, HDAC1, and HDAC2 upregulation, suggesting an exceptionally strong proliferative drive and altered epigenetic regulation in this challenging subtype GeneCards: E2F3 and GeneCards: HDAC1.
Clinical or Translational Implications
The pervasive dysregulation of cell cycle genes in breast cancer epithelial cells, as highlighted by this analysis, carries significant clinical and translational implications:
- Biomarker Potential: The identified genes, particularly those consistently upregulated (e.g., MYC, E2F3, MCMs, PCNA) or downregulated (e.g., CDKN2A, GADD45G, SMAD3) in specific breast cancer subtypes, could serve as prognostic biomarkers or predictive markers for treatment response. For instance, high E2F3 expression in TNBC might correlate with increased aggressiveness and potentially poor prognosis.
- Therapeutic Targets: The striking upregulation of proliferation-driving genes (e.g., CDKs, E2F3, MYC) and downregulation of tumor suppressors (e.g., CDKIs) points to critical vulnerabilities that could be exploited therapeutically. For example, CDK4/6 inhibitors are already standard of care in ER+ breast cancer, and the data here (e.g., elevated CDK4/6 in HER2+/TNBC) might warrant further investigation into their utility in other subtypes, potentially in combination therapies PubMed Search: CDK4/6 inhibitors breast cancer. Targeting HDACs (HDAC1, HDAC2) which are upregulated, especially in TNBC, could also be a relevant strategy.
- Understanding Subtype Aggressiveness: The distinct cell cycle profiles, particularly the highly proliferative signatures in HER2+ and TNBC, underscore the biological basis of their aggressive nature and potentially inform the development of subtype-specific treatment strategies. The strong E2F3 signature in TNBC suggests that targeting the E2F pathway or its upstream regulators could be a promising avenue for this subtype.
- Genomic Instability: The simultaneous upregulation of ATM and downregulation of GADD45 family members suggests a state of chronic DNA damage and impaired DNA damage repair checkpoints in cancer cells. This might render them more susceptible to DNA-damaging agents or PARP inhibitors, especially in TNBC where these treatments are already being explored PubMed Search: PARP inhibitors breast cancer.
21. Gene Ontology (GSA) Analysis for Epithelial Cells Across Breast Cancer Conditions
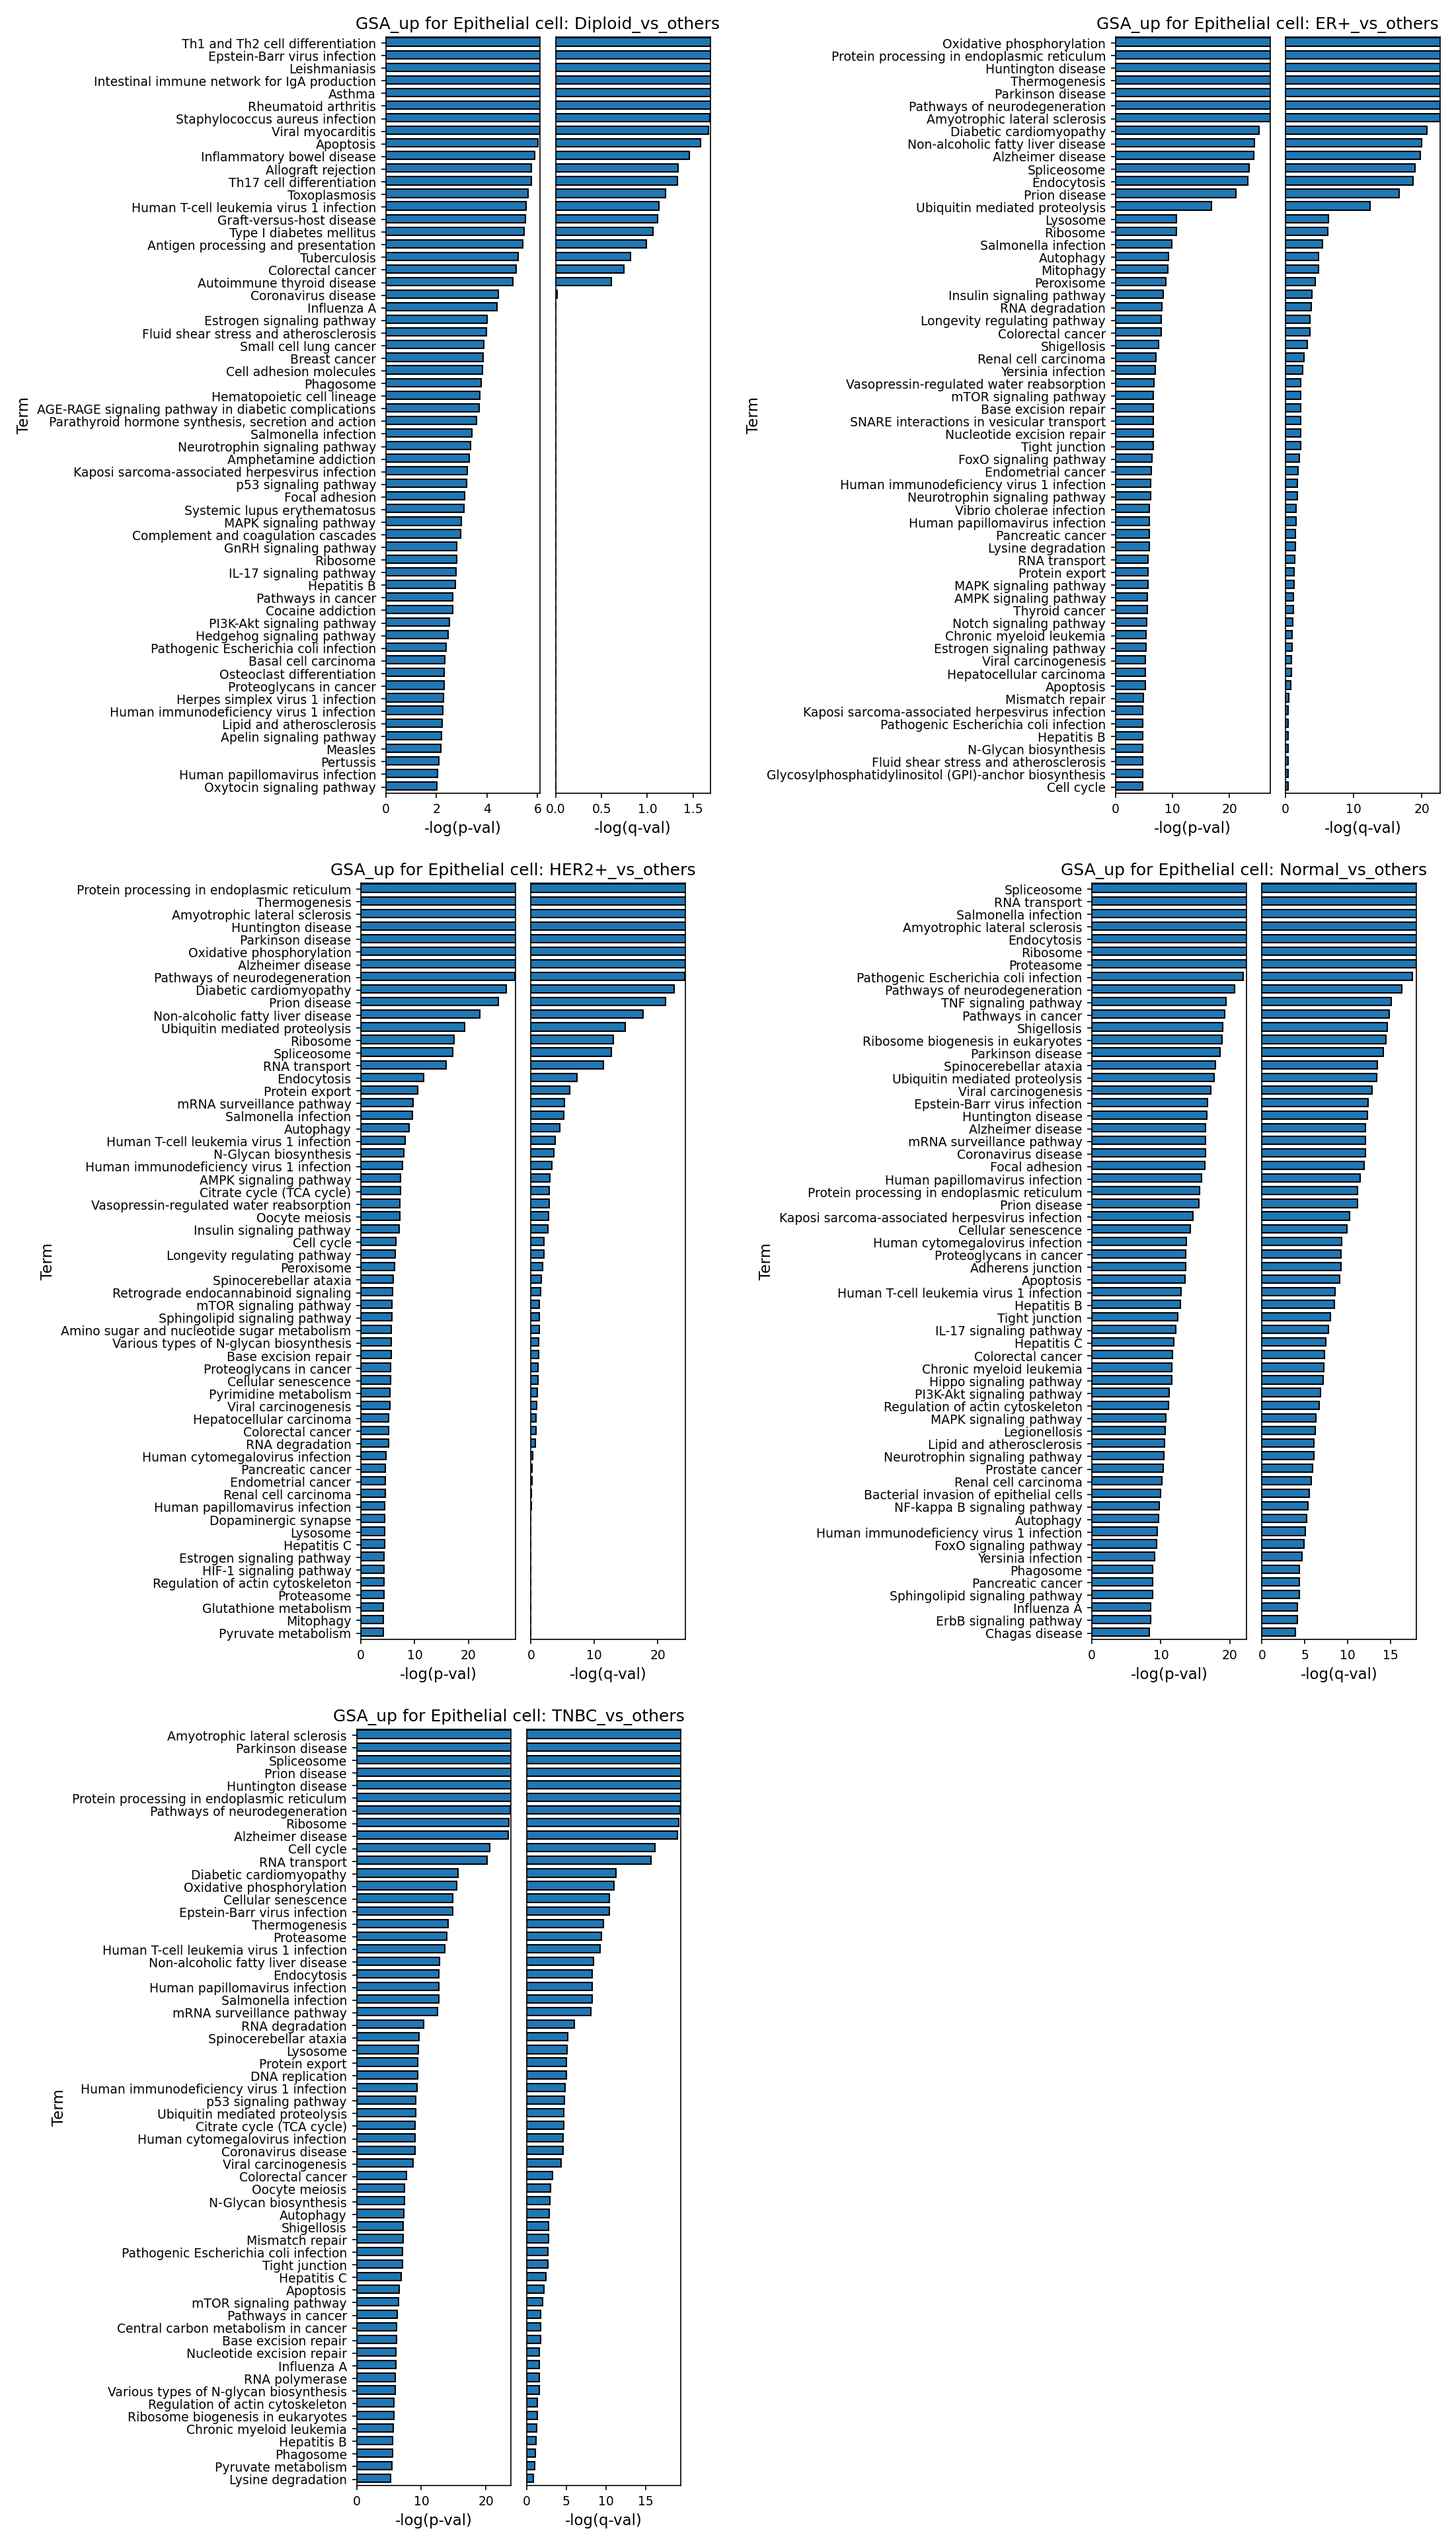
[Analysis Visualization Results]...
Analysis Overview
This analysis presents Gene Ontology (GSA) results for epithelial cells, a key cell type and the primary origin of breast cancer, across different conditions (Diploid, ER+, HER2+, Normal, TNBC). The results highlight pathways that are significantly upregulated in epithelial cells within each specific condition when compared to all other conditions present in the dataset. This differential pathway enrichment provides insights into the distinct biological programs and cellular states characterizing epithelial cells in various breast cancer subtypes and in a normal context. The comparisons are condition_vs_others, meaning, for example, ER+ epithelial cells are compared against epithelial cells from HER2+, TNBC, and Normal conditions combined.
Visual Summary
The provided bar plots illustrate the top enriched Gene Ontology terms for epithelial cells under five different conditions: Diploid, ER+, HER2+, Normal, and TNBC. Each plot displays two sets of bars for each term, representing the negative logarithm of the p-value (-log(p-val)) and the negative logarithm of the FDR-adjusted q-value (-log(q-val)). Longer bars indicate higher statistical significance.
- Diploid_vs_others: Epithelial cells identified as diploid show strong enrichment in pathways related to immune responses, infection (e.g., Th1 and Th2 differentiation, Epstein-Barr virus infection, Leishmaniasis, Staphylococcus aureus infection), and inflammatory diseases (e.g., Rheumatoid arthritis, Inflammatory bowel disease, Graft-versus-host disease). There's also some enrichment in cancer-related terms like "Small cell lung cancer" and "Breast cancer" as well as "Estrogen signaling pathway."
- ER+_vs_others: Epithelial cells from ER+ breast cancer exhibit a highly significant enrichment of metabolic pathways (e.g., Oxidative phosphorylation, Thermogenesis), protein processing and degradation pathways (e.g., Protein processing in endoplasmic reticulum, Ubiquitin mediated proteolysis, Spliceosome, Ribosome, Lysosome), and a recurring set of neurodegenerative disease pathways (e.g., Huntington disease, Parkinson disease, Alzheimer disease, Amyotrophic lateral sclerosis). Crucially, "Estrogen signaling pathway" is also strongly enriched.
- HER2+_vs_others: Similar to ER+ cells, HER2+ epithelial cells show substantial enrichment in pathways related to metabolism (e.g., Oxidative phosphorylation, Citrate cycle (TCA cycle)), protein processing (e.g., Protein processing in endoplasmic reticulum, Spliceosome, Ribosome, Proteasome), and cell cycle regulation. Neurodegenerative disease terms also appear prominently. Key signaling pathways like "mTOR signaling pathway" and "HIF-1 signaling pathway" are also enriched.
- Normal_vs_others: Normal epithelial cells display enrichment in fundamental cellular processes like "Spliceosome", "RNA transport", "Ribosome", and "Proteasome". Pathways related to cell adhesion (e.g., Focal adhesion, Adherens junction, Tight junction) and apoptosis are also notably enriched. Interestingly, various immune/infection-related pathways (e.g., Salmonella infection, TNF signaling pathway, Viral carcinogenesis) and several "Pathways in cancer" terms also appear as significantly enriched.
- TNBC_vs_others: Epithelial cells from Triple-Negative Breast Cancer (TNBC) show a profile emphasizing cell cycle, DNA replication and repair (e.g., Cell cycle, DNA replication, p53 signaling pathway, Mismatch repair, Base excision repair, Nucleotide excision repair), and metabolic processes (e.g., Oxidative phosphorylation, Citrate cycle (TCA cycle)). Protein processing pathways (e.g., Spliceosome, Protein processing in endoplasmic reticulum, Ribosome, Proteasome) and neurodegenerative disease terms are also highly significant, along with "mTOR signaling pathway" and "PI3K-Akt signaling pathway."
Biological Interpretation
The GSA results for epithelial cells provide crucial biological insights into the molecular underpinnings of different breast cancer subtypes and their distinction from normal tissue.
- Core Cancer Hallmarks in Tumor Epithelial Cells: All three tumor subtypes (ER+, HER2+, TNBC) show a consistent and pronounced enrichment of pathways associated with heightened cellular metabolism (e.g., Oxidative phosphorylation, TCA cycle), robust protein synthesis and processing (e.g., Ribosome, Spliceosome, ER protein processing, Ubiquitin-mediated proteolysis), and active cell proliferation (e.g., Cell cycle, DNA replication). These are fundamental hallmarks of cancer, reflecting the high energy and biosynthetic demands of rapidly dividing cells and their adaptation to cellular stress. The recurring "neurodegenerative disease" pathways (e.g., Huntington's, Parkinson's, Alzheimer's) in these analyses often reflect shared cellular stress responses, protein misfolding, or proteostasis dysregulation mechanisms that are common across various complex diseases, including cancer, rather than direct neurological involvement. GeneCards: Protein Misfolding Diseases
Subtype-Specific Drivers:
- ER+ Epithelial Cells: The strong enrichment of the "Estrogen signaling pathway" directly validates the molecular definition of ER+ breast cancer, where tumor growth is often driven by estrogen receptor activation. GeneCards: ESR1
- HER2+ Epithelial Cells: While "Estrogen signaling pathway" is less prominent, pathways such as "mTOR signaling pathway," "HIF-1 signaling pathway," and "Cell cycle" are highly enriched. This aligns with the aggressive, proliferative nature of HER2+ tumors, often characterized by uncontrolled growth signals and adaptation to hypoxic tumor microenvironments. GeneCards: ERBB2 (HER2)
- TNBC Epithelial Cells: The significant enrichment of "Cell cycle," "DNA replication," "p53 signaling pathway," "PI3K-Akt signaling pathway," and "mTOR signaling pathway" underscores the aggressive and often genomically unstable nature of TNBC. Mutations in *TP53* are common in TNBC, and the enrichment of the p53 pathway suggests either activated p53-dependent responses to stress or alterations in its downstream regulatory network. PubMed: TP53 and Breast Cancer
- Normal Epithelial Cell Characteristics: When compared to tumor epithelial cells (the "others" group), normal epithelial cells exhibit enrichment in pathways crucial for tissue homeostasis and integrity, such as "Focal adhesion," "Adherens junction," and "Tight junction," which maintain cell-cell contact and tissue architecture, often disrupted in cancer. Enrichment of "Apoptosis" pathways is also vital for normal tissue turnover and tumor suppression. The presence of "Pathways in cancer" in normal cells is intriguing; it might reflect baseline activity of pathways involved in normal cell growth and differentiation that become dysregulated in malignant transformation, or it could highlight active tumor-suppressive mechanisms or responses to the adjacent tumor microenvironment.
- Diploid Epithelial Cells and Immune Context: Diploid epithelial cells (compared to other epithelial cells which would largely be aneuploid tumor cells) show a striking enrichment of immune-related and infection pathways. This suggests that these cells, likely a mixture of normal adjacent epithelial cells and possibly a subset of less malignant tumor cells, retain a higher capacity for immune surveillance, response to pathogens, or interaction with the immune system compared to the more dedifferentiated, aneuploid tumor cells. This could imply a role for these diploid cells in anti-tumor immunity or as indicators of chronic inflammation in the microenvironment.
Clinical or Translational Implications
The distinct pathway enrichments observed in epithelial cells across different breast cancer subtypes have significant clinical and translational implications:
- Targeted Therapies: The identification of subtype-specific activated pathways (e.g., Estrogen signaling in ER+, PI3K-Akt/mTOR in TNBC, Cell cycle/metabolism in all) reinforces the rationale for targeted therapies. For instance, in ER+ breast cancer, the strong estrogen signaling highlights the continued importance of endocrine therapies. In TNBC, the activation of PI3K-Akt and mTOR pathways suggests these could be vulnerabilities for novel therapeutic interventions. PubMed: PI3K-Akt-mTOR in Breast Cancer
- Biomarker Discovery: Pathways consistently enriched in specific subtypes could yield novel biomarkers for diagnosis, prognosis, or prediction of treatment response. For example, high activity in certain metabolic pathways might indicate responsiveness to therapies that target cancer metabolism.
- Understanding Tumor Heterogeneity: The differences between normal and tumor epithelial cells, and even among tumor subtypes, underscore the complexity of breast cancer and the need for personalized medicine approaches. The finding that diploid epithelial cells retain immune-related functions could suggest strategies to engage these cells in anti-tumor immunity.
- Monitoring Treatment Resistance: As cancers evolve, their pathway activity profiles may shift. GSA of epithelial cells at different stages or after treatment could reveal mechanisms of acquired resistance.
- Repurposing Drugs: Given the overlap of cancer pathways with other disease contexts (e.g., neurodegenerative diseases as indicators of proteostasis stress), exploring drugs that modulate these common cellular processes could offer avenues for drug repurposing.
22. Gene Set Enrichment Analysis (GSEA) for Breast Cancer Cell Types
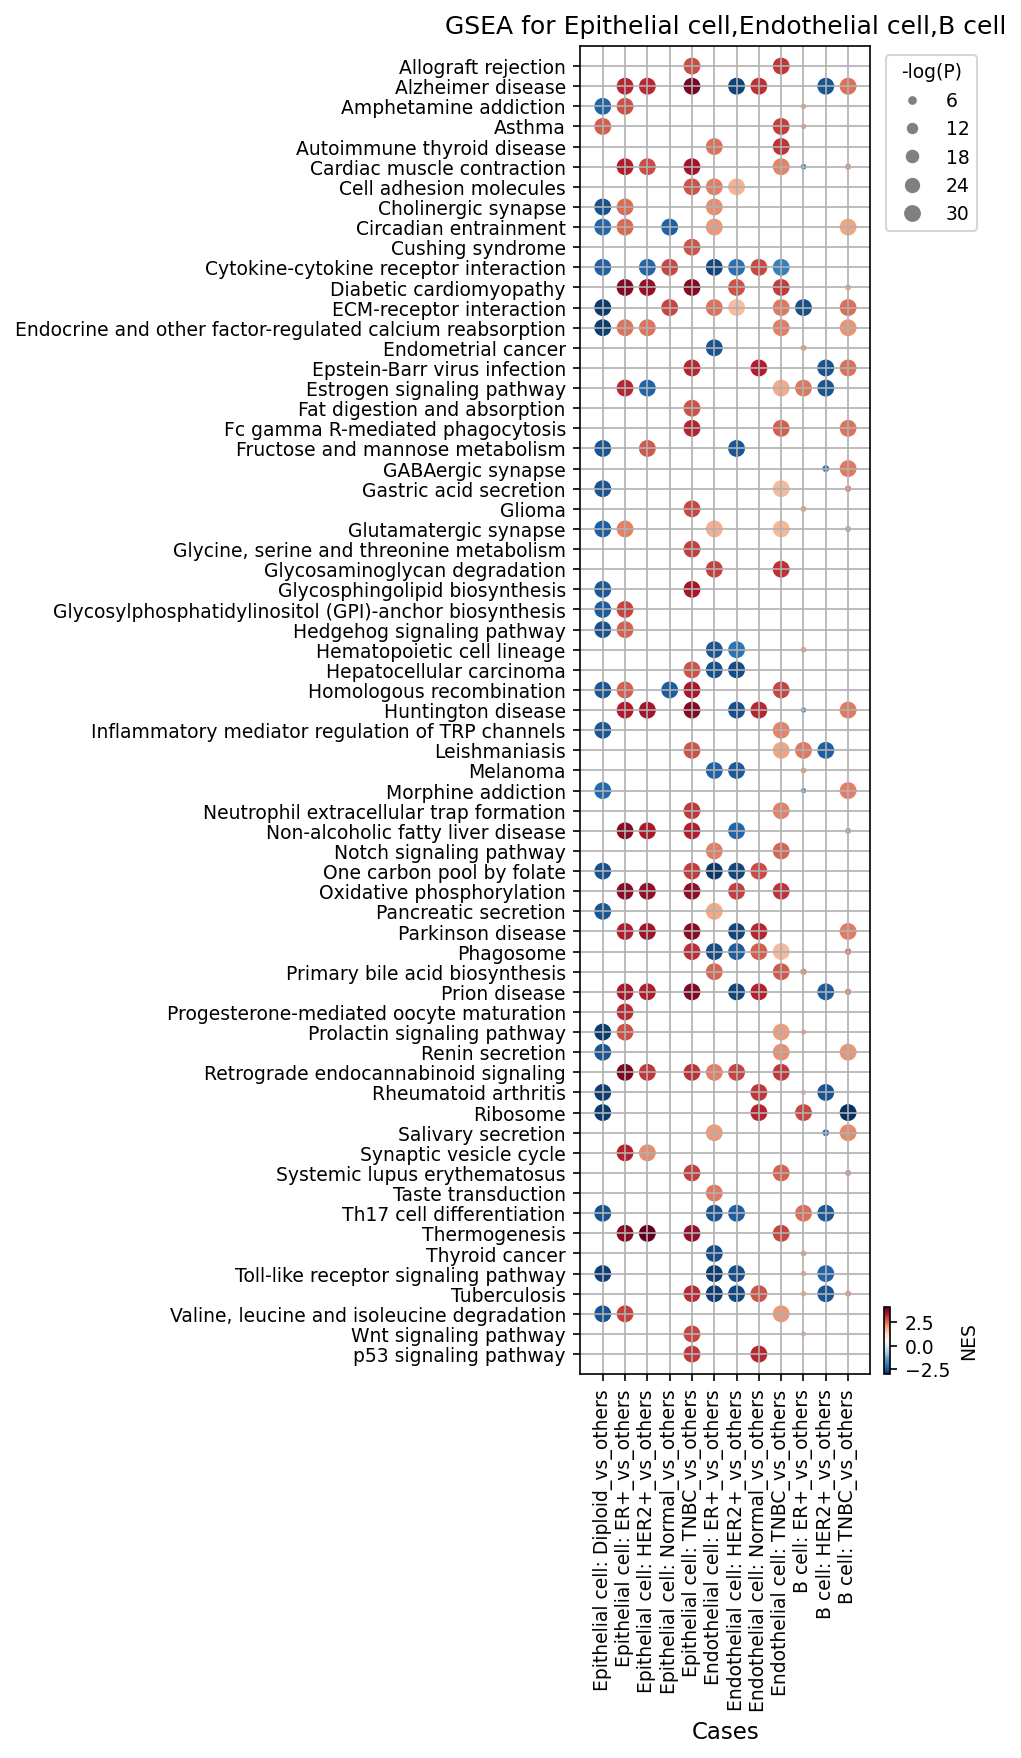
[Analysis Visualization Results]...
Analysis Overview
This analysis utilizes a dot plot to summarize Gene Set Enrichment Analysis (GSEA) results for key major cell types (Epithelial cell, Endothelial cell, B cell) derived from single-cell RNA-seq data of human breast tissue. The GSEA was conducted to identify gene sets (pathways) that are differentially enriched or depleted when comparing specific conditions (ER+, HER2+, TNBC, Normal) or ploidy status (Diploid) within a cell type against all other conditions/statuses combined for that cell type (_vs_others). The plot visually represents the Normalized Enrichment Score (NES) using color (red indicating positive enrichment, blue indicating negative enrichment) and the statistical significance (-log10(P-value)) through the size of the dots. The visualization highlights the top 80 most significant gene sets across all comparisons.
Visual Summary
The dot plot effectively illustrates distinct and overlapping pathway enrichment patterns across the examined cell types and breast cancer conditions.
- Epithelial Cells consistently demonstrate a high degree of pathway enrichment, characterized by numerous large, intensely colored dots. This is particularly noticeable in comparisons involving ER+, HER2+, and TNBC, underscoring significant transcriptional and functional alterations within these tumor-origin cells.
- Endothelial Cells also exhibit substantial pathway activity, suggesting their active and diverse roles within the tumor microenvironment (TME) across various breast cancer subtypes.
- B Cells show comparatively fewer and generally smaller, less intensely colored dots for the displayed pathways. This may indicate either less pronounced differential pathway activation within these specific gene sets or a focus of B cell activity on pathways not prominently featured among the top 80 identified.
- Condition-specific patterns are clearly observable, with ER+, HER2+, and TNBC subtypes each presenting unique pathway signatures, alongside some shared biological alterations. Comparisons involving Normal_vs_others further delineate pathways associated with healthy tissue contexts.
- Key metabolic and signaling pathways such as "Oxidative phosphorylation", "Ribosome", "ECM-receptor interaction", "Wnt signaling pathway", and "p53 signaling pathway" frequently appear with varying enrichment directions and magnitudes, highlighting their dynamic regulation in different cell type-condition contexts.
Biological Interpretation
The observed GSEA patterns provide crucial insights into the distinct biological processes characterizing different breast cancer subtypes and their associated microenvironments.
Epithelial Cells (Tumor Origin)
ER+ Breast Cancer:
- A strong positive enrichment for the Estrogen signaling pathway is observed, which is a hallmark of ER+ tumors, confirming their dependence on estrogen for growth and survival.
- Positive enrichment for Fat digestion and absorption and Glycine, serine and threonine metabolism suggests altered lipid and amino acid metabolism, which are often rewired in cancer cells to support rapid proliferation [1].
- Oxidative phosphorylation shows negative enrichment, potentially indicating a shift towards glycolysis (the Warburg effect) as a primary energy source in some ER+ subtypes [2].
HER2+ Breast Cancer:
- Significant positive enrichment for Ribosome and Oxidative phosphorylation indicates high protein synthesis and active mitochondrial metabolism, crucial for the aggressive proliferative capacity characteristic of HER2-driven growth [2, 3].
- The positive enrichment of the p53 signaling pathway could reflect a cellular response to oncogenic stress or genomic instability, or perhaps specific p53 alterations that modulate its function in HER2+ cancers.
TNBC (Triple-Negative Breast Cancer):
- Similar to HER2+, Oxidative phosphorylation and Ribosome are positively enriched, pointing to elevated metabolic activity and protein synthesis, which are consistent with the aggressive nature of TNBC [2].
- Strong positive enrichment for Cell adhesion molecules and ECM-receptor interaction highlights enhanced cell-cell and cell-extracellular matrix interactions, which are critical drivers of tumor invasion and metastasis in TNBC [4].
- Conversely, the Wnt signaling pathway exhibits negative enrichment, suggesting a potential downregulation or altered regulatory role of this pathway in TNBC epithelial cells compared to other contexts.
Diploid Epithelial Cells (vs. others):
- Several immune and stress-related pathways, such as "Allograft rejection," "Asthma," and "Autoimmune thyroid disease," are enriched. This suggests that diploid epithelial cells, when compared to a heterogeneous group including aneuploid cells and various cancer conditions, may be actively engaged in immune surveillance, inflammatory responses, or other cellular defense mechanisms.
Endothelial Cells (Tumor Microenvironment)
Endothelial cells are pivotal for angiogenesis and shaping the TME, influencing tumor growth and metastasis.
ER+ associated Endothelial Cells:
- Positive enrichment for Cytokine-cytokine receptor interaction and ECM-receptor interaction indicates active communication with the TME and remodeling of the extracellular matrix, facilitating angiogenesis and tumor growth.
HER2+ associated Endothelial Cells:
- Prominent positive enrichment for p53 signaling pathway, Ribosome, and Wnt signaling pathway suggests active involvement in supporting tumor proliferation and potentially responding to growth-related or stress signals. Negative enrichment for Cell adhesion molecules might imply a more migratory phenotype, contributing to vascular remodeling.
TNBC associated Endothelial Cells:
- Similar to ER+, Cell adhesion molecules, Cytokine-cytokine receptor interaction, and ECM-receptor interaction are highly enriched, emphasizing their active role in forming new blood vessels and interacting with various cellular components in the highly angiogenic and aggressive TNBC microenvironment.
- Notably, p53 signaling pathway shows negative enrichment, which could contribute to a pro-angiogenic, less controlled proliferative state of endothelial cells in TNBC.
Normal associated Endothelial Cells (vs. others):
- Positive enrichment for Allograft rejection and Toll-like receptor signaling pathway suggests a more active immune surveillance and inflammatory response capacity in the endothelium of normal breast tissue.
B Cells (Immune Compartment)
B cells contribute to the immune response within the TME, playing complex roles that can be either anti-tumorigenic or pro-tumorigenic.
- Generally, B cells show fewer and less intense enrichments for the top 80 pathways compared to epithelial and endothelial cells, suggesting that their primary differential activities across these conditions might lie in other, more B cell-specific pathways, or that the observed changes are less pronounced at a global pathway level.
HER2+ and TNBC associated B Cells:
- Both demonstrate positive enrichment for Toll-like receptor signaling pathway and Cytokine-cytokine receptor interaction. This signifies active innate immune sensing and robust communication, consistent with B cells participating in inflammatory and adaptive immune responses in these aggressive cancer subtypes.
- Ribosome is also positively enriched in HER2+ B cells, suggesting increased protein synthesis, potentially reflecting an active state.
ER+ associated B Cells:
- A modest positive enrichment for Estrogen signaling pathway suggests that estrogen may directly or indirectly influence B cell activity within the ER+ TME, potentially modulating local immune responses.
Clinical or Translational Implications
The differential pathway enrichment identified across breast cancer subtypes and cell types holds significant clinical and translational implications:
- Subtype-Specific Therapeutic Targets: The distinct metabolic and signaling pathway profiles (e.g., varying oxidative phosphorylation reliance in HER2+/TNBC versus ER+; differential Wnt signaling in TNBC epithelial cells) highlight subtype-specific vulnerabilities that could be exploited for precision therapies. For instance, interventions targeting mitochondrial metabolism might hold greater promise in HER2+ or TNBC than in ER+ breast cancers [2].
- Tumor Microenvironment Modulation: The extensive pathway activity observed in endothelial cells (e.g., ECM-receptor interaction, Cell adhesion molecules, Cytokine-cytokine receptor interaction) underscores their critical role in TME remodeling and angiogenesis. Strategies aimed at modulating these pathways could inhibit tumor growth and metastasis across various subtypes.
- Immunotherapy Strategies: The activation of Toll-like receptor signaling pathway and Cytokine-cytokine receptor interaction in B cells in aggressive subtypes (HER2+, TNBC) suggests an active, though potentially heterogeneous, immune response. A deeper understanding of these B cell interactions could inform and optimize immunotherapy strategies, potentially by enhancing effective anti-tumor immunity or dampening pro-tumorigenic B cell functions [5].
- Biomarker Discovery: The identified enriched pathways and their associated genes could serve as valuable candidates for the discovery of novel biomarkers for diagnosis, prognosis, or prediction of treatment response, particularly when interpreted within cell-type-specific contexts.
References:
- Metabolic Reprogramming in Breast Cancer: https://pubmed.ncbi.nlm.nih.gov/?term=metabolic+reprogramming+breast+cancer
- Oxidative Phosphorylation in Breast Cancer Subtypes: https://pubmed.ncbi.nlm.nih.gov/?term=oxidative+phosphorylation+breast+cancer+subtypes
- Ribosomal Biogenesis and Cancer: https://pubmed.ncbi.nlm.nih.gov/?term=ribosomal+biogenesis+cancer+review
- ECM and Cell Adhesion in TNBC Metastasis: https://pubmed.ncbi.nlm.nih.gov/?term=ECM+cell+adhesion+TNBC+metastasis
- B Cells and Breast Cancer Immunotherapy: https://pubmed.ncbi.nlm.nih.gov/?term=B+cells+breast+cancer+immunotherapy
23. Discussion
The single-cell analysis of human breast tissue reveals profound cellular and genomic reprogramming accompanying oncogenesis, with distinct features across ER+, HER2+, and TNBC subtypes. UMAPs clearly delineate normal from tumor cells, with aneuploid epithelial cells validating their malignant origin and exhibiting widespread CNVs, notably *ERBB2* amplification in HER2+ tumors. This genomic instability underscores the foundational heterogeneity of breast cancer, which is further highlighted by significant inter-patient variability in cellular composition and genomic profiles.
Cellular composition analyses highlight subtype-specific immune microenvironments. While all tumor conditions show increased cytotoxic T cells compared to normal, TNBC exhibits particularly high infiltration of both cytotoxic T cells and pro-inflammatory M1 macrophages, suggesting an 'immune-hot' yet complex environment. However, this is often balanced by elevated regulatory T cells (Tregs, especially in ER+ and TNBC) and pro-tumorigenic M2C macrophages (enriched in TNBC), indicating active immune evasion and suppression. Normal tissue, in contrast, shows higher innate lymphoid cells (ILCs) and NK cells, emphasizing their role in immune surveillance and tissue homeostasis.
Cell-cell interaction networks provide critical insights into this microenvironmental remodeling. Consistently across tumor subtypes, interactions involving tumor-associated macrophages (TAMs) and aneuploid epithelial cells dominate, often employing immunosuppressive axes like LGALS9-HAVCR2 (Galectin-9/TIM-3) and LAIR1-LILRB4. The TGFB1-TGFbeta_receptor1 pathway, particularly via macrophage-macrophage autocrine/paracrine signaling, emerges as a central immune checkpoint-related communication hub in HER2+ and TNBC. HER2+ tumors display unique interactions, including HBGEGF-ERBB2 and extensive angiogenesis (VEGFA-VEGFRs), alongside other immune checkpoints (NECTIN2-TIGIT, SIRPA-CD47). TNBC exhibits distinct pro-invasive and stemness-related interactions such as SPP1-integrin, WNT5A-SFRP2, and JAG1-NOTCH2, further amplified by activated cancer-associated fibroblasts (e.g., high expression of FAP, MMP14, PDGFRB). Furthermore, CD4+ T cells in TNBC exhibit an activated/antigen-experienced surfaceome phenotype (e.g., CD74, HLA-DRA/F, CD44, ITGB2), indicative of their dynamic engagement within this aggressive tumor microenvironment.
Transcriptomic analyses of epithelial cells confirm core cancer hallmarks: enhanced proliferation (e.g., MYC, E2F3, MCMs, PCNA), compromised cell cycle checkpoints (reduced CDKN1A/2A/2B, GADD45s), and dysregulated TGF-beta signaling (reduced SMAD3/4). HER2+ and TNBC demonstrate particularly aggressive proliferative signatures. Pathway enrichment (GSA/GSEA) further corroborates metabolic rewiring (e.g., oxidative phosphorylation, ribosome activity) and identifies subtype-specific drivers like estrogen signaling in ER+, and PI3K-Akt/mTOR pathways in TNBC. These findings collectively paint a comprehensive picture of breast cancer's complex ecosystem, highlighting shared vulnerabilities and subtype-specific dependencies that can be exploited for targeted intervention.
Hypotheses:
- The differential proportions of T cell subsets (e.g., increased cytotoxic T cells and Tregs) and macrophage polarization (increased M1, variable M2C) across breast cancer subtypes contribute directly to distinct immune evasion strategies and influence immunotherapy responses.
- Pervasive macrophage-mediated TGFB1-TGFbeta_receptor1 signaling, identified as a dominant cell-cell interaction in HER2+ and TNBC, actively promotes an immunosuppressive tumor microenvironment and drives tumor progression.
- Upregulation of specific surfaceome markers on cancer-associated fibroblasts (e.g., FAP, PDGFRB, MMP14) in TNBC, coupled with altered ECM-integrin interactions, collectively enhances tumor invasion, metastasis, and therapy resistance.
- The distinct activated/antigen-experienced surfaceome phenotype of CD4+ T cells in TNBC suggests a specific functional reprogramming that influences both anti-tumor immunity and immunosuppression within this aggressive subtype.
- The combined dysregulation of proliferation-driving genes (e.g., MYC, E2F3) and tumor suppressors (e.g., CDKN2A, GADD45s) in breast cancer epithelial cells, particularly in HER2+ and TNBC, underpins their aggressive growth and genomic instability.
Potential therapeutic targets:
- TGF-beta signaling (TGFB1-TGFbeta_receptor1 axis): Pervasive macrophage-macrophage autocrine/paracrine signaling via TGFB1-TGFbeta_receptor1 is a dominant communication hub in HER2+ and TNBC, promoting immunosuppression, angiogenesis, EMT, and metastasis. Blocking this axis could reprogram TAMs, enhance anti-tumor immunity, and reduce metastatic potential. Evidence: Strong statistical significance and interaction strength for Mac|Mac TGFB1-TGFbeta_receptor1 in HER2+ and TNBC (Section 12, 14). TGF-beta pathway is a major mediator of immune evasion (Section 14). Validation: Evaluate TGF-beta receptor inhibitors or neutralizing antibodies in preclinical models (PDX, syngeneic) of HER2+ and TNBC, particularly in combination with immune checkpoint inhibitors. Monitor macrophage polarization and T cell activity.
- Immune Checkpoint Receptors (TIM-3, TIGIT, CD47): LGALS9-HAVCR2 (Galectin-9/TIM-3) is consistently present across all tumor subtypes, and NECTIN2-TIGIT and SIRPA-CD47 are prominent in HER2+, indicating shared and subtype-specific immune evasion mechanisms. CD47 is also a highly expressed surface marker on TNBC epithelial cells and associated macrophages. Blocking these 'don't eat me' or T cell inhibitory signals could reactivate anti-tumor immunity. Evidence: LGALS9-HAVCR2 (TIM-3) in ER+, HER2+, TNBC (Section 12, 13). NECTIN2-TIGIT and SIRPA-CD47 in HER2+ (Section 12, 13). CD47 expression on TNBC epithelial cells (Section 16) and TNBC macrophages (Section 17). Validation: Evaluate antibodies targeting TIM-3, TIGIT, or CD47 as monotherapies or in combination with PD-1/PD-L1 inhibitors in HER2+ and TNBC preclinical models. Assess tumor growth, immune cell infiltration, and T cell function.
- Fibroblast Activation Protein (FAP): FAP is a canonical marker of highly activated cancer-associated fibroblasts (CAFs) specifically in TNBC, strongly implicated in ECM remodeling, immunosuppression, and tumor growth. Targeting FAP could disrupt the pro-tumorigenic microenvironment and enhance therapeutic efficacy. Evidence: FAP is highly and specifically expressed on TNBC-associated fibroblasts (Section 18). Validation: Test FAP-targeting antibody-drug conjugates or FAP inhibitors in TNBC preclinical models. Evaluate their impact on CAF activation, ECM stiffness, tumor invasion, and immune cell infiltration.
- HER2 (ERBB2) and HB-EGF-ERBB2 interaction: ERBB2 amplification and expression are defining features of HER2+ breast cancer. The HBGEGF-ERBB2 interaction further highlights its activation. While existing HER2-targeted therapies are effective, targeting this specific ligand-receptor axis could offer additional strategies for resistance or improved efficacy. Evidence: Prominent ERBB2 amplification on 17q12 in HER2+ samples (Section 4, 5). HBGEGF-ERBB2 interaction is significant in HER2+ (Section 12). ERBB2 is the defining surfaceome marker for HER2+ epithelial cells (Section 16). Validation: Explore novel therapeutic antibodies or small molecule inhibitors that specifically block the HB-EGF ligand binding to ERBB2, or combination strategies with existing HER2-targeted therapies in HER2+ models resistant to current treatments.
- Cell cycle drivers (e.g., E2F3, MYC) or related epigenetic regulators (HDACs): Epithelial cells in HER2+ and TNBC show significant upregulation of proliferation-driving genes (MYC, E2F3, MCMs) and HDACs, alongside downregulation of cell cycle inhibitors. Targeting these could selectively inhibit the aggressive proliferation of these aggressive subtypes. Evidence: MYC, E2F3, MCM3/7, PCNA, HDAC1/2 are significantly upregulated in HER2+ and TNBC epithelial cells (Section 20). Validation: Test E2F inhibitors or HDAC inhibitors as monotherapies or in combination with chemotherapy/targeted therapies in HER2+ and TNBC cell lines and preclinical models. Assess cell proliferation, cell cycle arrest, and apoptosis.
Follow-up validation ideas:
- Validate the proportions of T cell and macrophage subsets and their surfaceome markers (e.g., CD163, CD86, FCGR3A for macrophages; CD74, CD44, ITGB2 for CD4+ T cells) in independent cohorts of breast cancer patient samples using flow cytometry, mass cytometry, or immunohistochemistry.
- Investigate the spatial localization and co-localization of identified ligand-receptor pairs (e.g., LGALS9-HAVCR2, TGFB1-TGFbeta_receptor1, HBGEGF-ERBB2, SPP1-integrin) within the tumor microenvironment using spatial transcriptomics or proteomics to confirm physical interactions and their impact on cellular phenotypes.
- Establish in vitro co-culture systems of breast cancer epithelial cells with macrophages, fibroblasts, or T cells to functionally test the impact of blocking specific ligand-receptor interactions (e.g., using antibodies or genetic knockdown of TGFBR1, TIM-3, CD47, FAP) on tumor cell proliferation, invasion, and immune cell function.
- Utilize in vivo preclinical models (patient-derived xenograft or syngeneic mouse models) for breast cancer subtypes to evaluate the therapeutic efficacy of targeting key pathways or cell-cell interactions identified (e.g., FAP inhibitors, TGF-beta inhibitors, CD47 blockers) as single agents or in combination with standard therapies.
- Perform functional genomics perturbations (CRISPR-Cas9, shRNA) of key dysregulated cell cycle genes (e.g., MYC, E2F3, CDKN2A, GADD45G) in breast cancer cell lines to assess their impact on proliferation, cell cycle progression, and sensitivity to various therapeutic agents.
- Confirm recurrent CNV regions (e.g., ERBB2 on 17q12, SOX2 on 3q26.3, EIF3E/INTS8 on 8q24.3) using orthogonal genomic methods like FISH or array CGH on bulk tumor samples or specific cell populations isolated by laser capture microdissection.
Limitations:
This single-cell RNA-seq analysis provides a high-resolution snapshot of the breast cancer microenvironment but is inherently cross-sectional, thus limiting conclusions about disease progression or causality. While copy number variations are inferred, direct genomic validation by orthogonal methods (e.g., FISH, whole-genome sequencing) was not performed on individual cells. The detection sensitivity of scRNA-seq can lead to dropouts, potentially underestimating the expression of some markers or rare cell populations. Furthermore, the functional implications of identified cell-cell interactions and pathway enrichments require robust experimental validation in in vitro and in vivo models to establish mechanistic links and therapeutic efficacy. The observed correlations do not imply causation, and the vast patient-specific factors influencing tumor heterogeneity are complex.
24. Query List
- Show UMAP plots including condition, sample, major cell type, minor cell type, ploidy_dec, and celltype_subset in 2 columns and save.
- Show major cell type scores on UMAP and save.
- Show the overall Celltype_subset marker expression dot plot and save it. Keep target_cell as None and keep the other arguments at their default values.
- Select tumor-origin cells and unassigned cells, group by sample, show CNV heatmap, along with a summary of significantly amplified copy number regions, and save.
- Show CNV patterns on UMAP, including major cell type, minor cell type, ploidy results, condition, and sample, in 2 columns and save.
- Show population bar plot of minor cell types and save.
- Show subset population bar plot for T cells and save.
- If there are statistically significant differences in T cell subset populations between conditions, show box plots and save. Set ncols appropriately based on the total number of panels.
- Show subset population bar plot for macrophages and save.
- If there are statistically significant differences in macrophage subset populations between conditions, show box plots and save. Set ncols appropriately based on the total number of panels.
- Select tumor-origin cells and unassigned cells, show their ploidy population as a bar plot, and save.
- Show cell-cell interaction patterns by condition, including tumor-origin cells (Epithelial cell), fibroblasts, macrophages, T cells, etc., and save. Select a maximum of 80 cell-cell interactions per condition.
- Show cell-cell interactions by condition and save the result. Select at most 80 cell-cell interactions for each condition.
- Select only genes related to immune checkpoint and cell cycle pathways, show cell-cell interactions for these genes, and save.
- Find statistically significant differences in cell-cell interactions between conditions for major immune cells and stromal cells, show as a dot plot, and save. Set max_n_items_per_group = 25.
- Show the condition-specific markers for tumor-origin cells (Epithelial cell) as a dot plot and save the result. Use only surfaceome markers, up to 50 markers per condition.
- Extract condition-specific markers for Macrophage, show as a dot plot, and save. Only surfaceome markers, up to 50 per condition.
- Extract condition-specific markers for Fibroblast, show as a dot plot, and save. Only surfaceome markers, up to 50 per condition.
- Extract condition-specific markers for T cell CD4+, show as a dot plot, and save. Only surfaceome markers, up to 50 per condition.
- Select genes related to the Cell cycle pathway that show statistically significant expression differences between conditions in major disease-related cells (Epithelial cell), show as box plots, and save. Set max_n_items_to_plot = 24, and set ncols appropriately so that the aspect ratio is approximately 2x3 based on the total number of panels.
- Show Gene Ontology (GSA) analysis results for epithelial cells as bar plots and save the result.
- Show dot plot of Gene set enrichment analysis results for major cell types (Epithelial cell, Stromal cell, T cell, Endothelial cell, Myeloid cell, B cell) and save. Set color map to RdBu_r and n_pws_to_show = 80.