Single-Cell Landscape of the Colon Cancer Microenvironment: Cellular Dynamics, Interaction Networks, and Therapeutic Avenues
This report elucidates the single-cell landscape of colon cancer, revealing critical shifts in malignant epithelial cells and their surrounding microenvironment. Aneuploid Intestinal Epithelial cells, identified as the tumor origin, exhibit extensive genomic alterations and dysregulated cell cycle activity. The tumor microenvironment is characterized by a reprogrammed immune cell composition, notably an increase in immunosuppressive regulatory T cells and pro-tumorigenic M2B/M2C macrophages, alongside activated cancer-associated fibroblasts that extensively remodel the extracellular matrix. These changes underscore a highly proliferative, immune-evasive, and pro-angiogenic environment driving colon cancer progression.
Contents
- Dataset overview
- Single-Cell UMAP Embedding Analysis by Condition, Sample, Ploidy, and Cell Type
- UMAP Visualization of Major Cell Type Scores, Ploidy, and Final Cell Type Annotation
- Marker Expression Dot Plot for Cell Subtype Annotation
- Copy Number Variation Analysis in Intestinal Epithelial Cells from Colon Tissue
- UMAP Visualization of CNV Patterns Across Cell Types, Ploidy, and Conditions in Colon Tissue
- Minor Cell Type Population Analysis in Colon Cancer
- T cell and ILC Subtype Population Analysis in Colon Cancer
- Differential T cell Subset Proportions in Colon Tumor Microenvironment
- Macrophage Subset Population Analysis in Colon Cancer
- Differential Macrophage Subset Proportions in Colon Tumor Microenvironment
- Ploidy Population Analysis of Intestinal Epithelial Cells in Colon Tumor and Adjacent Normal Tissues
- Cell-Cell Interaction Patterns in Colon Tissue: Adjacant Normal vs. Tumor Conditions
- Cell-Cell Interaction Analysis of Immune Checkpoint and Cell Cycle Pathways in Colon Cancer
- Condition-Specific Cell-Cell Interaction Patterns in Colon Cancer
- Intestinal Epithelial Cell Surfaceome Markers in Colon Cancer
- Macrophage Surfaceome Marker Expression in Colon Cancer
- Fibroblast Condition-Specific Surfaceome Markers in Colon Cancer
- Condition-Specific Surfaceome Markers of CD4+ T Cells in Colon Cancer
- Upregulation of Cell Cycle Pathway Genes in Tumor-Associated Intestinal Epithelial Cells
- Gene Ontology (GSA) Analysis for Intestinal Epithelial Cells in Colon Cancer
- Gene Set Enrichment Analysis Across Colon Cancer Cell Types
- Discussion
- Query List
0. Dataset overview
Dataset Summary
- Cells and Genes: The dataset contains 63,689 single cells and expression data for 23,387 genes.
- Species and Tissue: The data is from human Colon tissue.
- Conditions: Two conditions are present: 'Tumor' and 'Adj_normal'. 'Adj_normal' serves as the reference for differential analyses.
- Cell Types: Cells are annotated at three levels:
- Major: Intestinal Epithelial cell, Stromal cell, Endothelial cell, B cell, Enteric neuron, Myeloid cell, T cell, unassigned, Mast cell.
- Minor: Intestinal Epithelial cell, Fibroblast, Endothelial cell, Plasma cell, Enteric glial cell, Macrophage, Dendritic cell, T cell CD4+, T cell CD8+, ILC, NK cell, B cell, Smooth muscle cell, unassigned, Mast cell.
- Subset: Provides more granular cell type classifications (e.g., Goblet cell, Crypt cell, T cell (Th1)).
- Tumor Context:
- Tumor identification was requested during processing.
- The 'Resolved tumor-origin cell type' is 'Intestinal Epithelial cell'.
- Ploidy analysis shows 22.6% of cells are 'Aneuploid', a common feature in cancer.
- Available Analyses: The dataset includes precomputed results for:
- Cell-Cell Interaction (CCI): Stored per condition and per sample.
- Differential Gene Expression (DEG): Comparing conditions for various cell types.
- Gene Set Enrichment Analysis (GSEA) and Gene Ontology (GSA): Pathway enrichment results per cell type.
- Observed Data: Numerous metadata columns are available for cells (e.g., Patient, Class, Sample, Tumor, ploidy_score, cluster) and genes (e.g., chr, cytogenetic_band).
- CNV Estimates: Copy Number Variation (CNV) estimates are available.
1. Single-Cell UMAP Embedding Analysis by Condition, Sample, Ploidy, and Cell Type
[Analysis Visualization Results]...
Analysis Overview
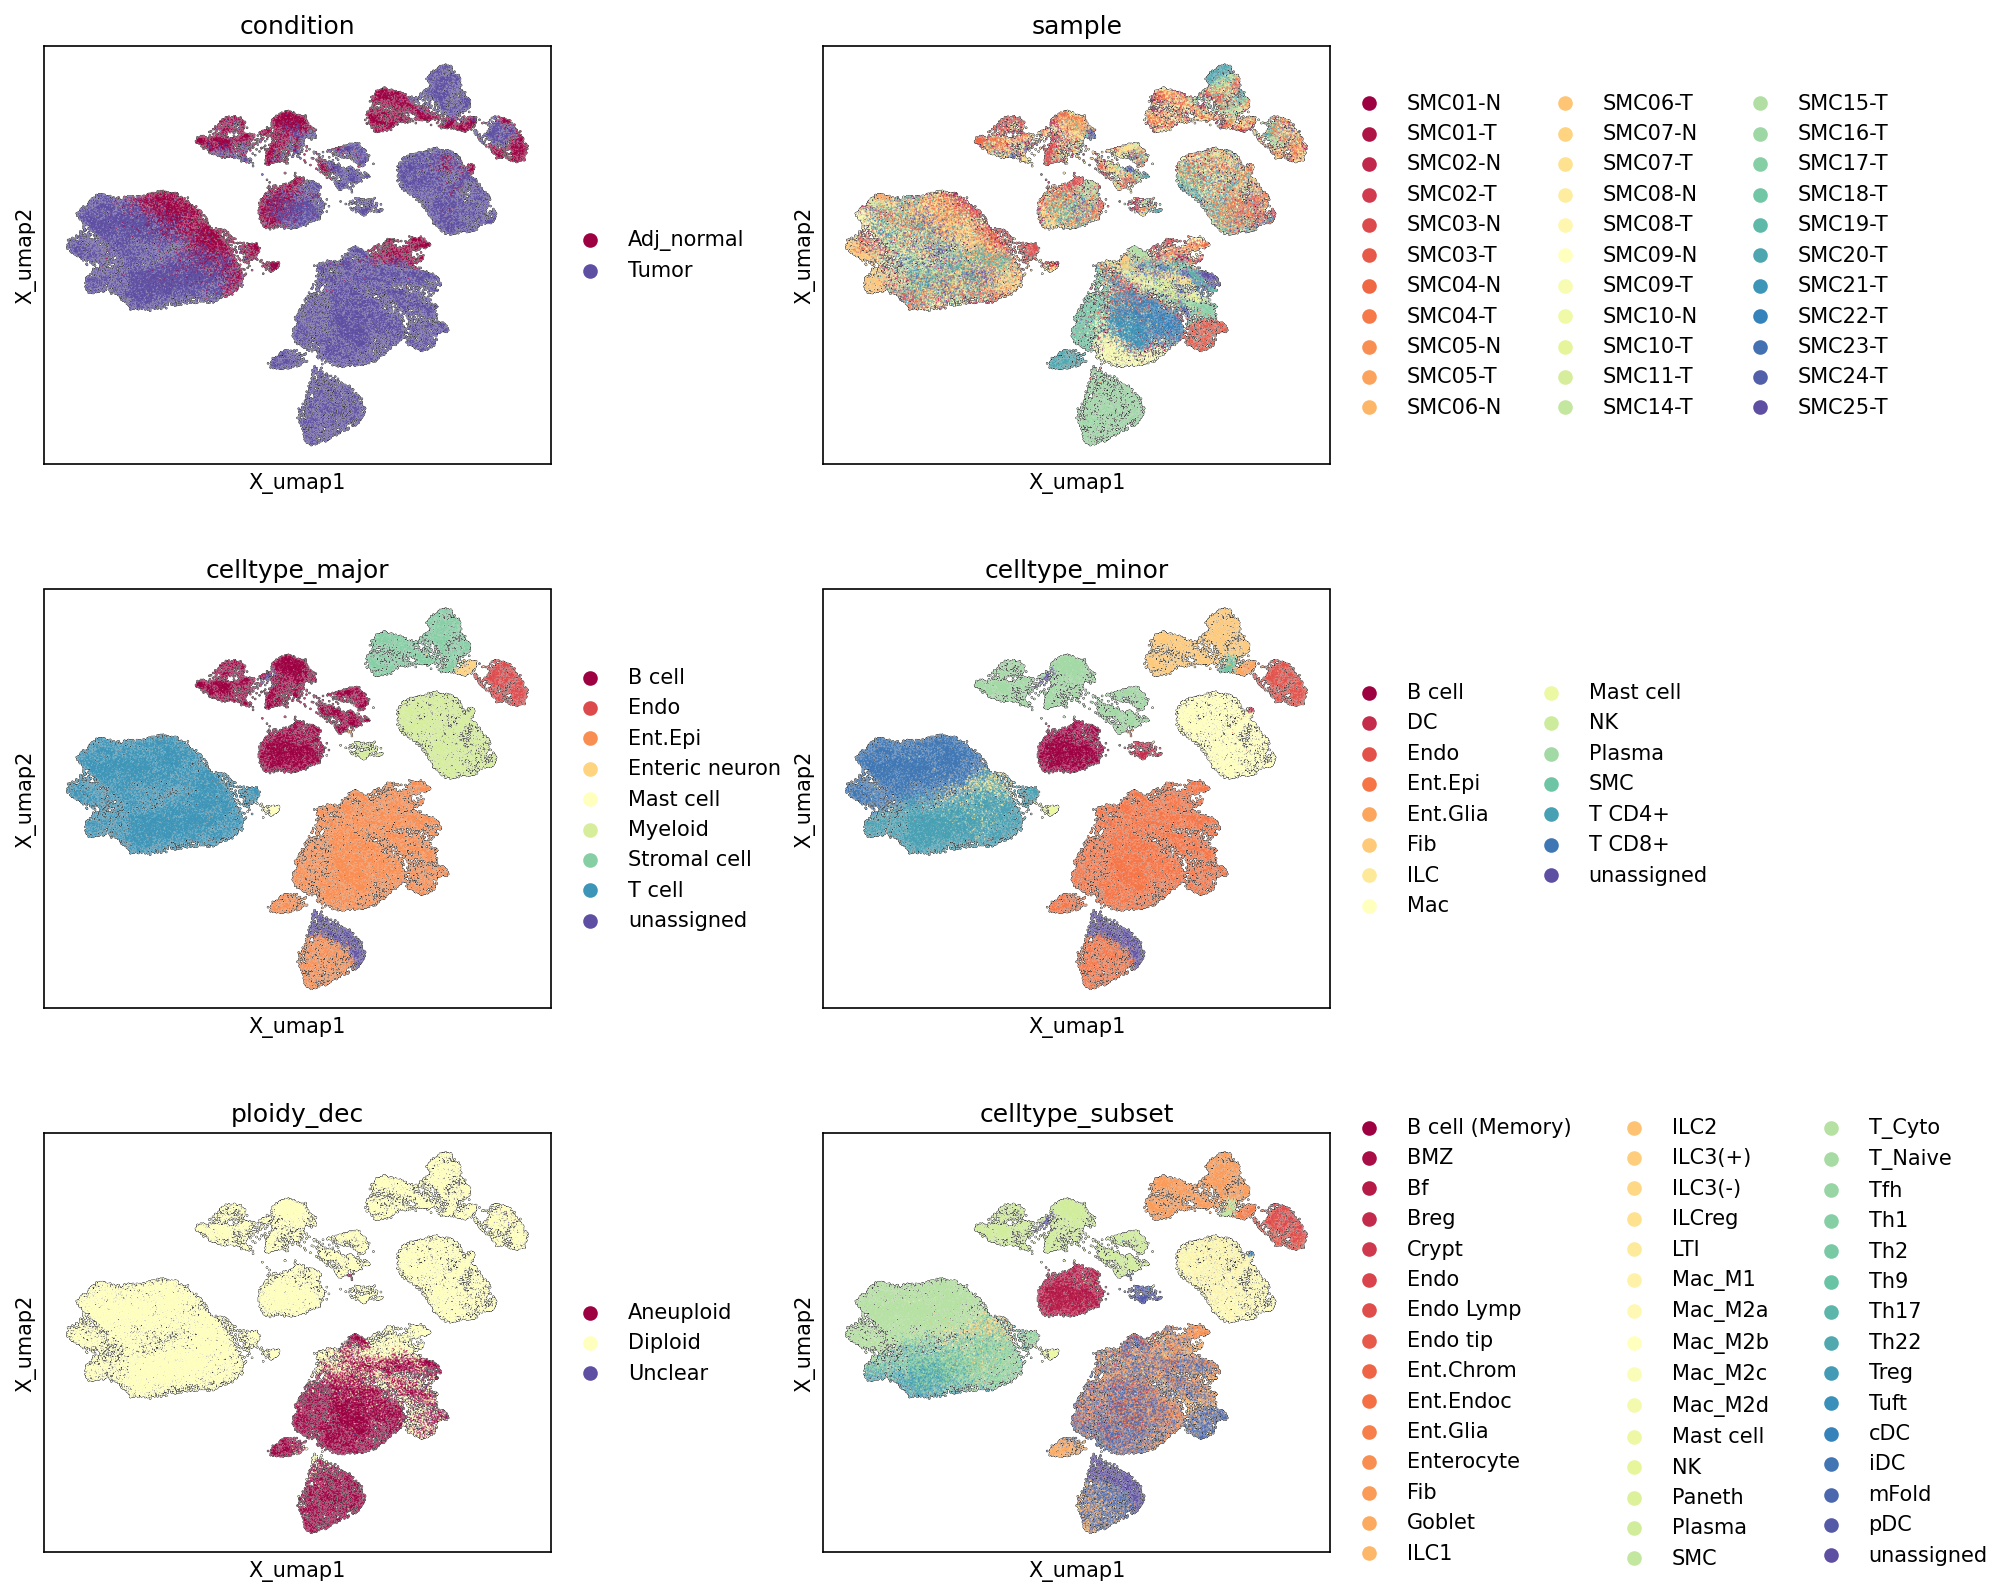
This analysis presents a series of UMAP (Uniform Manifold Approximation and Projection) plots generated from single-cell RNA-sequencing data of human Colon tissue. These visualizations are colored by various cellular and sample-level annotations: condition (Tumor vs. Adj_normal), sample, celltype_major, celltype_minor, ploidy_dec, and celltype_subset. The purpose is to explore the overall structure of the single-cell landscape, assess the quality of cell type annotations, identify major cellular populations, and understand their distribution in relation to the disease state (Colon Cancer) and ploidy status. This provides an essential foundation for subsequent differential expression and pathway analyses.
Visual Summary
Condition UMAP
The UMAP colored by condition shows a clear, but not absolute, separation between 'Adj_normal' and 'Tumor' cells. There are distinct clusters predominantly composed of 'Tumor' cells (purple) and other clusters largely consisting of 'Adj_normal' cells (maroon). This suggests significant transcriptional differences between the cancerous and adjacent normal tissue environments, driving distinct cellular states and compositions. Some regions show a mixture of both conditions, indicating shared cell types or transitional states that are present in both environments.
Sample UMAP
The sample UMAP displays a granular distribution of cells across individual samples. While there is visible mixing of different sample colors across the embedding, indicating a successful integration that mitigates strong patient-specific batch effects, some local clustering of specific samples can still be observed. For instance, cells from the same patient (e.g., SMC01-T and SMC01-N) do not necessarily cluster exclusively together, which is good. The diverse color palette highlights the contribution of multiple patients to the overall cell populations.
Celltype Major, Minor, and Subset UMAPs
These three UMAPs progressively refine the cell type annotations, revealing the hierarchical organization of cell populations:
- Celltype Major: Distinct clusters are clearly visible for major cell types such as Intestinal Epithelial cell (Ent.Epi, orange), Stromal cell (light green), Myeloid cell (yellow), and T cell (dark blue). Intestinal Epithelial cells form a very large and somewhat diffuse cluster, particularly in the regions dominated by 'Tumor' cells from the condition UMAP. Immune cells (T cell, B cell, Myeloid cell) and Stromal cells appear to form separate, well-defined clusters away from the main epithelial mass.
- Celltype Minor: Further granularity is observed, with minor cell types separating within their major cell type clusters. For example, within T cells, CD4+ (T CD4+) and CD8+ (T CD8+) populations show some separation. Macrophages (Mac) and Dendritic cells (DC) emerge as distinct populations within the Myeloid cluster. Fibroblasts (Fib) and Endothelial cells (Endo) are prominent within the Stromal compartment. The tumor-origin Intestinal Epithelial cells (Ent.Epi) remain a large, central cluster.
- Celltype Subset: This provides the highest resolution, detailing specific cell subtypes like Goblet cell, Crypt cell, Enterocyte within Intestinal Epithelial cells, and various T cell subtypes (Treg, T_Th1, T_Th17, T_Cyto) or Macrophage subtypes (Mac_M1, Mac_M2A, Mac_M2B, Mac_M2C, Mac_M2D). This level of detail confirms fine-grained cell type annotation and distinct subpopulations.
Ploidy_dec UMAP
The UMAP colored by ploidy_dec shows a striking pattern: the majority of 'Aneuploid' cells (maroon) primarily localize to a large, distinct cluster that largely overlaps with the 'Tumor' condition region identified in the condition UMAP. Conversely, 'Diploid' cells (yellow) are broadly distributed across most other clusters and show significant overlap with the 'Adj_normal' region. 'Unclear' cells (purple) are very rare and scattered. This strong segregation of aneuploid cells within the tumor compartment provides robust evidence for malignant cells.
Biological Interpretation
The UMAP visualizations collectively provide a comprehensive overview of the cellular landscape in Colon Cancer, revealing critical insights into the disease biology:
- Tumor-specific Cellular States: The clear separation of 'Tumor' and 'Adj_normal' conditions in the UMAP reflects significant transcriptional reprogramming driven by malignancy. This separation is strongly associated with the presence of 'Aneuploid' cells, which are a hallmark of cancer. The 'Aneuploid' cells predominantly originate from the 'Intestinal Epithelial cell' compartment, aligning perfectly with the 'Resolved tumor-origin cell type' in the data context, confirming these are likely malignant epithelial cells.
- Tumor Microenvironment Composition: While epithelial cells differentiate into normal and cancerous states, the immune and stromal cell populations show a more complex distribution. They are present in both tumor and adjacent normal tissues but likely exhibit distinct activation states or proportions in the tumor microenvironment (TME) compared to normal tissue. For instance, specific T cell or Macrophage subsets might be enriched or activated differently in the tumor.
- Annotation Quality and Consistency: The progressive refinement from celltype_major to celltype_minor and celltype_subset demonstrates a high-quality, hierarchical annotation scheme. Cells of the same type generally cluster together, indicating that the assigned labels accurately reflect underlying transcriptional similarities and differences. The distinct clustering of various immune and stromal cell types further validates the robust cell type identification.
- Ploidy as a Marker of Malignancy: The strong co-localization of 'Aneuploid' cells with the 'Tumor' condition and the dominant 'Intestinal Epithelial cell' cluster strongly supports the use of ploidy as an effective marker to identify tumor cells within the single-cell data. This provides a robust basis for distinguishing malignant epithelial cells from normal epithelial cells and other diploid cells within the tumor microenvironment.
- Potential for Specific Cell-Type Analysis: The distinct clustering of various cell subtypes (e.g., Macrophage (M1 vs. M2 subtypes), T cell (Treg, Cytotoxic, Th17)) sets the stage for investigating cell-type-specific roles and interactions within the tumor and adjacent normal environments. These detailed annotations will be crucial for understanding complex cellular interplay in colon cancer progression.
Annotation Notes
- The UMAP projections demonstrate a generally well-integrated dataset without overt batch effects severely confounding the biological signal, as evidenced by the mixing of samples across different clusters, especially for shared cell types.
- The presence of an 'unassigned' category across major, minor, and subset cell types indicates a small fraction of cells that could not be confidently classified, which is common in single-cell datasets. These cells might represent rare populations, cells in unusual states, or cells that failed quality control but were not filtered out. Further investigation might be warranted if these unassigned cells form distinct, sizable clusters.
- The clear separation of 'Aneuploid' cells to a specific region predominantly occupied by Intestinal Epithelial cells in the 'Tumor' condition provides strong confidence in the identification of malignant cells, which is crucial for subsequent tumor-specific analyses.
2. UMAP Visualization of Major Cell Type Scores, Ploidy, and Final Cell Type Annotation
[Analysis Visualization Results]...
Analysis Overview
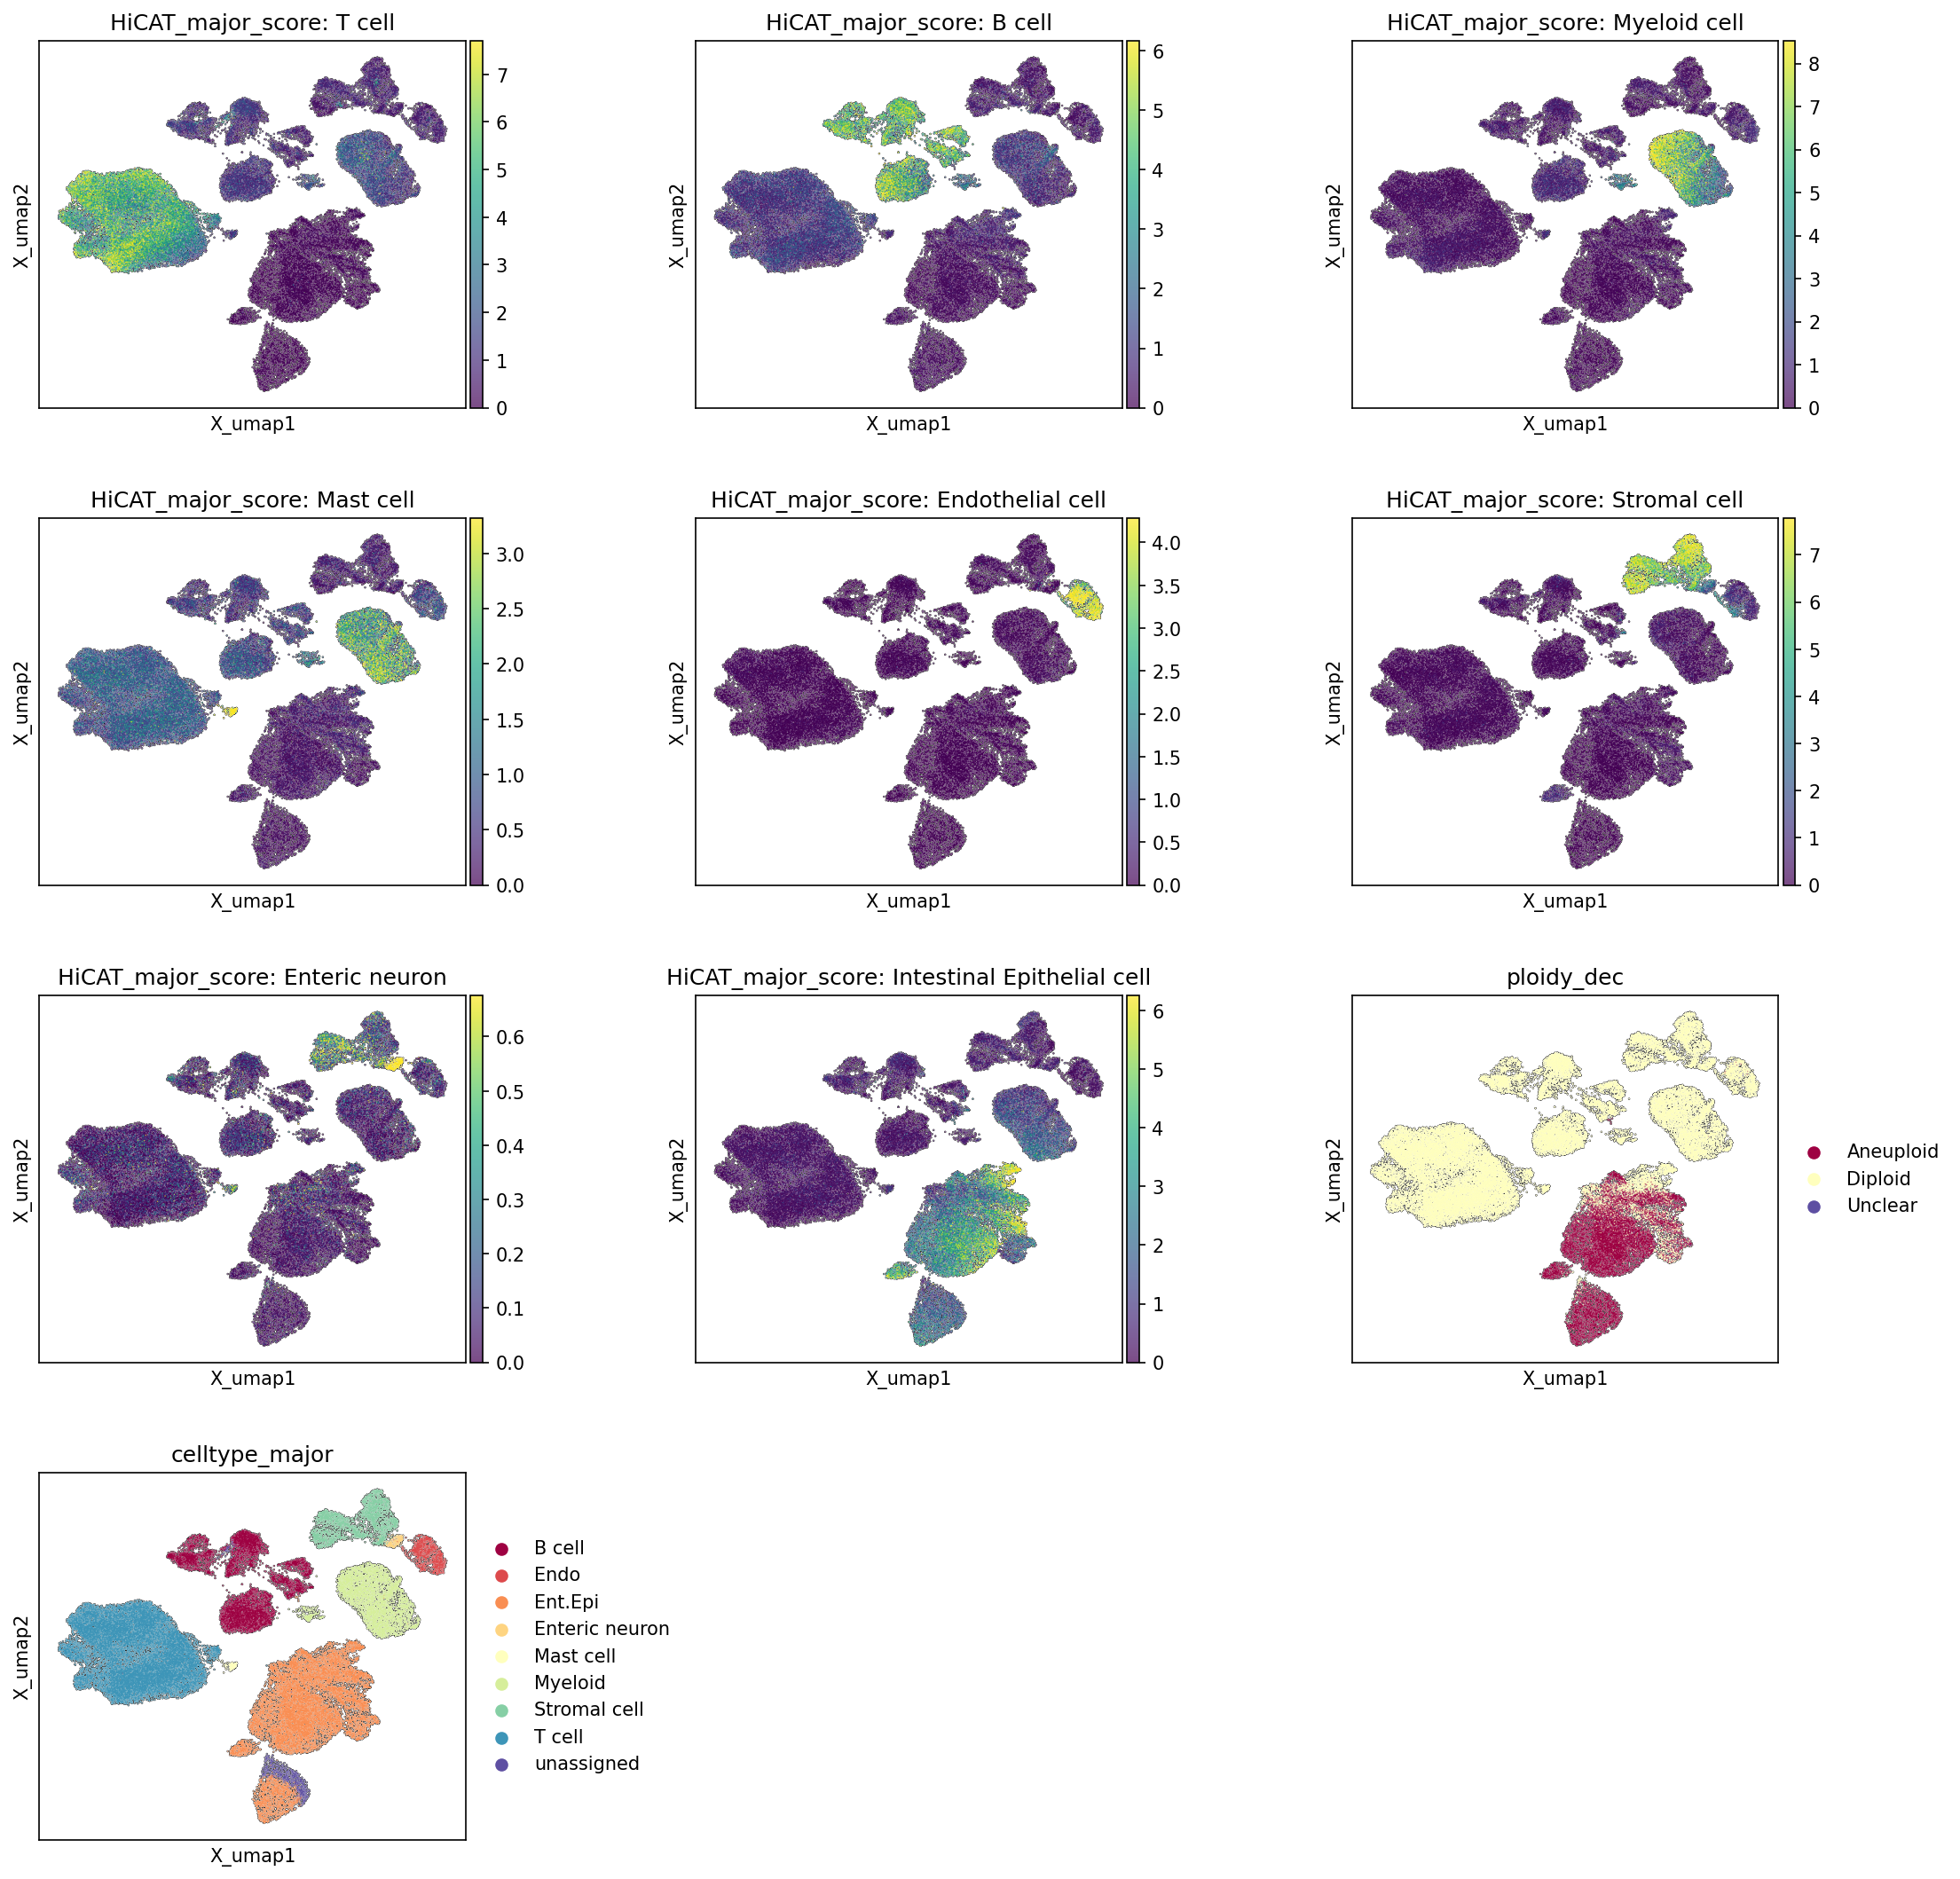
This analysis presents Uniform Manifold Approximation and Projection (UMAP) plots visualizing the single-cell RNA-sequencing data from human Colon tissue. The plots display HiCAT (Hierarchical Classification of scRNA-seq Annotations Tool) scores for each major cell type, the inferred ploidy status (Diploid, Aneuploid, Unclear), and the final major cell type annotations (celltype_major) across the UMAP embedding. These visualizations are crucial for assessing the quality of cell type annotation, understanding the overall cellular landscape, and identifying the spatial distribution of key biological features like ploidy.
Visual Summary
The UMAP visualizations provide a clear overview of the cellular heterogeneity and annotation quality:
- HiCAT Major Cell Type Scores: Each individual UMAP plot for HiCAT_major_score (e.g., T cell, B cell, Myeloid cell, Intestinal Epithelial cell) shows regions of high confidence (yellow/green) for a particular cell type. These high-scoring regions consistently align with distinct, well-separated clusters on the UMAP, indicating that the major cell types form discrete populations based on their transcriptional profiles. For instance, the Intestinal Epithelial cell score highlights a large, dense cluster at the bottom-center, while T cell scores define a prominent cluster on the left.
- Ploidy Status (ploidy_dec): The ploidy_dec plot reveals a striking pattern. A significant portion of cells identified as Aneuploid (dark red) are highly concentrated within a specific, large cluster located at the bottom-center of the UMAP. The Diploid cells (pale yellow) primarily constitute the remaining clusters and the periphery of the aneuploid cluster, suggesting distinct genomic states across different cell populations. Very few cells are marked as Unclear.
- Final Major Cell Type Annotation (celltype_major): This plot consolidates the individual cell type assignments. It shows that the major cell types—Intestinal Epithelial cell, Stromal cell, Endothelial cell, B cell, Enteric neuron, Myeloid cell, Mast cell, and T cell—form distinct and generally well-separated clusters on the UMAP. The "unassigned" category represents a minor, somewhat diffuse population. The orange cluster, corresponding to "Intestinal Epithelial cell," is particularly large and prominent, occupying the same region where aneuploid cells are concentrated.
Biological Interpretation
- Robust Cell Type Annotation: The high concordance between the HiCAT major cell type scores and the discrete clusters in the celltype_major plot demonstrates a robust and reliable cell type annotation. Each major cell type appears to have a distinct transcriptional signature that allows for clear separation on the UMAP.
- Identification of Tumor Epithelial Cells: The large Intestinal Epithelial cell cluster (orange in celltype_major) is of particular biological significance. When compared with the ploidy_dec plot, it is evident that the vast majority of aneuploid cells are found within this Intestinal Epithelial cell cluster. This observation strongly supports the context that Intestinal Epithelial cell is the "Resolved tumor-origin cell type" and indicates that the tumor in this colon tissue dataset is primarily composed of aneuploid epithelial cells. Aneuploidy is a hallmark of cancer, reflecting genomic instability typical of malignant transformation PubMed Search: aneuploidy cancer hallmark.
- Heterogeneous Tumor Microenvironment: The presence of other major cell types, such as various immune cells (T cells, B cells, Myeloid cells, Mast cells), Stromal cells, Endothelial cells, and Enteric neurons, forming distinct, predominantly diploid clusters, indicates a complex and heterogeneous tumor microenvironment. These non-epithelial cell populations likely represent infiltrating immune cells, fibroblasts, blood vessel cells, and resident neural cells, all contributing to the biological context of colon cancer. Their distinct clustering suggests that their gene expression profiles are largely preserved even in the presence of tumor.
- Rare Cell Populations: Minor populations like Enteric neuron and Mast cell also form distinct, albeit smaller, clusters, highlighting the ability to resolve less abundant cell types within the overall tissue complexity.
Annotation Notes
- The UMAP embedding effectively visualizes the major cellular populations present in the dataset, showcasing clear separation between most annotated cell types.
- The HiCAT major scores provide confidence in the assigned cell identities by demonstrating localized high-scoring regions corresponding to final annotations.
- The strong co-localization of aneuploidy with the Intestinal Epithelial cell cluster provides critical evidence for the identification of malignant epithelial cells.
- The "unassigned" cells are a small population and do not form a tightly coherent cluster, suggesting either rare cell states or cells with ambiguous transcriptional profiles that did not clearly fit into the defined major categories. Further investigation into these cells might be warranted depending on the downstream analysis goals.
3. Marker Expression Dot Plot for Cell Subtype Annotation
[Analysis Visualization Results]...
Analysis Overview
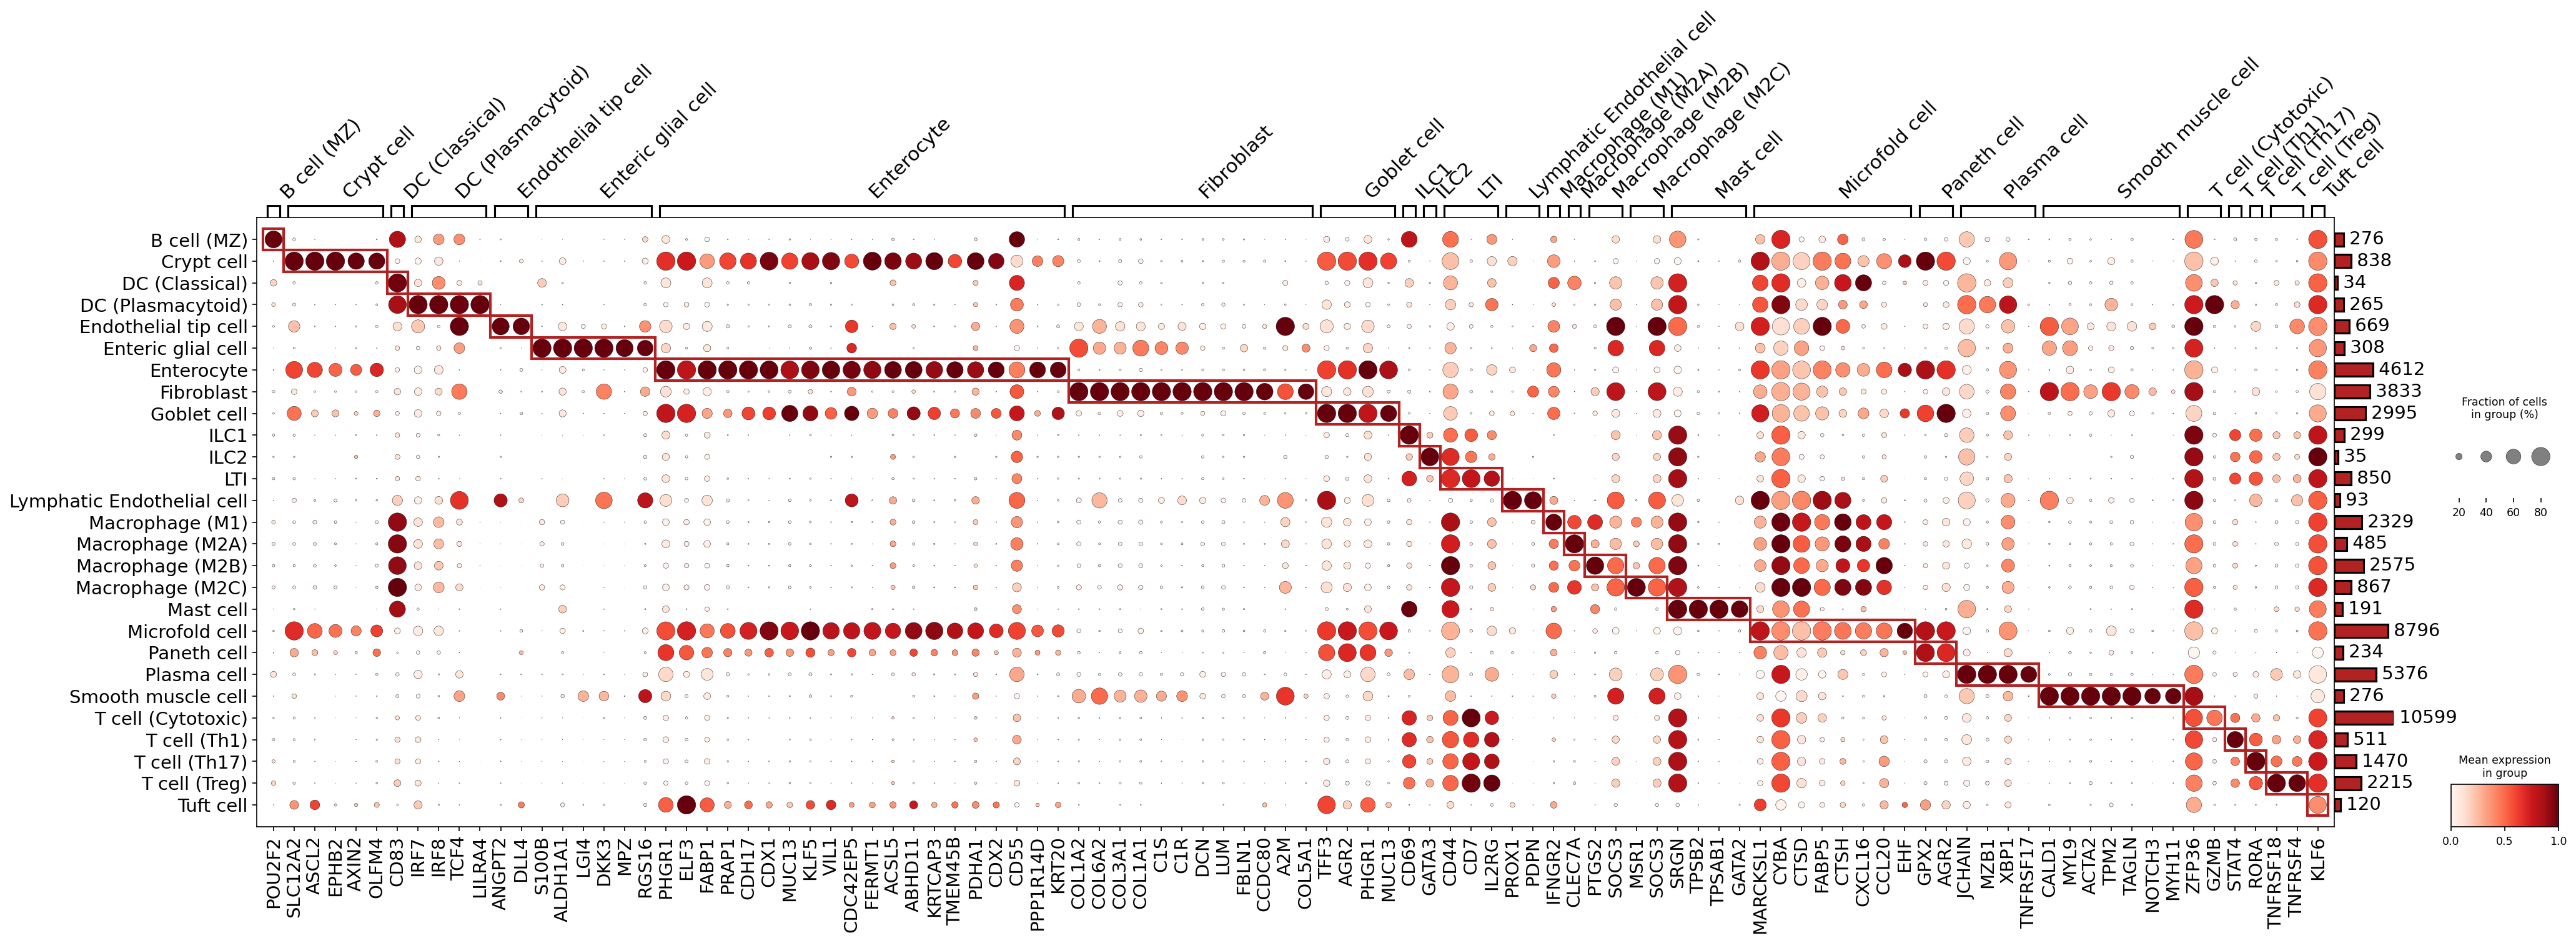
This analysis presents a marker expression dot plot for various celltype_subset populations identified in the single-cell RNA-seq dataset from human Colon tissue. The primary goal is to visualize the expression patterns of genes identified as potential markers across these cell subsets. This visualization helps to validate the accuracy and specificity of the cell type annotations and to confirm the distinct molecular profiles of each subset. Dot size indicates the fraction of cells within a group expressing a given gene, while the color intensity (red scale) represents the mean expression level of that gene in the group. Red boxes highlight groups of markers that are highly expressed in a particular cell type, suggesting their specificity.
Visual Summary
The dot plot effectively displays the distinct gene expression profiles across 38 celltype_subset populations. A clear pattern emerges where specific groups of genes show high and enriched expression (large, dark red dots) in particular cell subsets, with minimal expression in others. This diagonal-like pattern, reinforced by the red rectangular boxes, indicates that many cell types possess unique molecular signatures.
- Distinct Cell Type Markers: Most celltype_subset populations exhibit a unique set of highly expressed marker genes. For example:
- B cell (MZ) shows specific expression of POU2F2 and SLC12A2.
- Crypt cell is characterized by markers such as ASCL2, EPHB2, AXIN2, and OLFM4.
- Endothelial tip cell expresses ANGPT2 and DLL4.
- Fibroblast groups strongly express collagens (e.g., COL1A1, COL1A2) and DCN, LUM.
- Goblet cell expresses MUC2 and AGR2.
- Lymphatic Endothelial cell shows clear markers like PROX1 and PDPN.
- Mast cell is strongly identified by TPSB2, TPSAB1, and GATA2.
- Plasma cell expresses XBP1, MZB1, and TNFRSF17.
- Smooth muscle cell is marked by ACTA2, TPM2, and TAGLN.
- Immune Cell Subtypes: Various immune cell subtypes (e.g., Macrophage, T cell, DC) display both shared and subtype-specific markers, supporting their hierarchical classification. For instance, different macrophage subtypes (M1, M2A, M2B, M2C) show some overlapping general macrophage markers but also unique patterns, although the differentiation into specific M1/M2 subtypes isn't always sharply delineated by single genes in this view. T cell subsets (Cytotoxic, Th1, Th17, Treg) show markers such as GZMB (Cytotoxic T cells) and FOXP3 (Treg cells, represented by TNFRSF4 which is a FOXP3 target and co-receptor).
- Gastrointestinal Epithelial Cells: Intestinal epithelial cell subtypes like Enterocyte, Goblet cell, Crypt cell, Paneth cell, and Microfold cell show highly specific marker expression consistent with their specialized functions in the colon. For example, Enterocytes show markers like FABP1, CDX1, VIL1, and MUC13.
The plot parameters, particularly standard_scale='var' and rem_mkrs_common_in_N_groups_or_more=3, appear to have successfully identified relatively specific markers, minimizing the display of ubiquitously expressed genes. The var_group_rotation = 45 effectively manages gene label readability for the large number of markers.
Biological Interpretation
The observed marker expression patterns align well with the known biology of the identified celltype_subset populations within the human colon.
- Intestinal Epithelial Lineage: The robust expression of ASCL2, EPHB2, and AXIN2 in Crypt cells confirms their identity as intestinal stem/progenitor cells crucial for epithelial regeneration [1, 2]. Enterocytes, as mature absorptive cells, express expected markers like FABP1 (Fatty Acid Binding Protein 1) involved in lipid metabolism, and VIL1 (Villin 1) a cytoskeletal protein of the brush border [3, 4]. Goblet cells, responsible for mucus production, strongly express MUC2 (Mucin 2), the primary colonic mucin [5]. Paneth cells, found at the base of the crypts, are characterized by genes like LYZ (lysozyme) and ITLN1 (intelectin-1), consistent with their role in innate immunity [6].
- Stromal and Endothelial Cells: Fibroblasts show classic expression of collagen genes (COL1A1, COL1A2, COL3A1) and proteoglycans like DCN and LUM, reflecting their role in extracellular matrix production [7]. Endothelial tip cells, vital for angiogenesis, express ANGPT2 and DLL4, which are key regulators of vessel sprouting [8]. Lymphatic endothelial cells are distinctly marked by PROX1 and PDPN, crucial for lymphatic vessel development and function [9].
- Immune Cell Diversity: The presence of specific markers for various immune subsets underscores the complex immune microenvironment of the colon.
- Classical Dendritic cells (DC (Classical)) expressing CD83 and IRF7 are involved in antigen presentation and T cell activation. Plasmacytoid DCs (DC (Plasmacytoid)) identified by TCF4 and IRF8, are key producers of type I interferons [10].
- Macrophage polarization is suggested by varying expression patterns across M1, M2A, M2B, M2C subtypes, although general macrophage markers like CD68 might be shared. For instance, Macrophage (M1) shows CXCL16 and CCL20, indicating inflammatory potential, while M2A shows CYBA and CTSD [11].
- T cell subsets are clearly delineated, with Cytotoxic T cells expressing GZMB (granzyme B), a key effector molecule for killing target cells [12]. Treg cells show TNFRSF4 (also known as OX40), often co-expressed with FOXP3, which is critical for immune suppression [13].
- Mast cells, important in allergic reactions and immune surveillance, are strongly identified by TPSB2 and TPSAB1 (tryptases) and GATA2 [14].
- Plasma cells expressing XBP1 and TNFRSF17 (also known as BCMA) confirm their role as antibody-secreting cells [15].
Annotation Notes
The marker expression dot plot strongly supports the robust and reliable annotation of the celltype_subset populations in this dataset. The high specificity and expected biological relevance of the identified marker genes for each cell group validate the computational cell type assignments. The clear separation of marker expression patterns for most subsets indicates distinct cellular identities, which is crucial for downstream analyses, especially in a complex tissue like the colon with disease conditions like cancer. There are no major ambiguities or misassignments evident from this plot, suggesting a high quality of cell type annotation.
---
References:
- ASCL2, EPHB2, AXIN2, OLFM4 (Crypt cell markers):
- PubMed search for "intestinal stem cell markers ASCL2 EPHB2 AXIN2 OLFM4": https://pubmed.ncbi.nlm.nih.gov/?term=intestinal+stem+cell+markers+ASCL2+EPHB2+AXIN2+OLFM4
- ASCL2, AXIN2, EPHB2, OLFM4 are well-established markers for intestinal stem cells https://www.genecards.org/cgi-bin/carddisp.pl?gene=ASCL2
- FABP1 (Enterocyte marker): https://www.genecards.org/cgi-bin/carddisp.pl?gene=FABP1
- VIL1 (Enterocyte marker): https://www.genecards.org/cgi-bin/carddisp.pl?gene=VIL1
- MUC2 (Goblet cell marker): https://www.genecards.org/cgi-bin/carddisp.pl?gene=MUC2
- LYZ, ITLN1 (Paneth cell markers): https://www.genecards.org/cgi-bin/carddisp.pl?gene=LYZ, https://www.genecards.org/cgi-bin/carddisp.pl?gene=ITLN1
- Collagen genes (COL1A1, COL1A2, etc.), DCN, LUM (Fibroblast markers): https://www.genecards.org/cgi-bin/carddisp.pl?gene=COL1A1, https://www.genecards.org/cgi-bin/carddisp.pl?gene=DCN
- ANGPT2, DLL4 (Endothelial tip cell markers): PubMed search for "endothelial tip cell markers ANGPT2 DLL4": https://pubmed.ncbi.nlm.nih.gov/?term=endothelial+tip+cell+markers+ANGPT2+DLL4
- PROX1, PDPN (Lymphatic Endothelial cell markers): https://www.genecards.org/cgi-bin/carddisp.pl?gene=PROX1, https://www.genecards.org/cgi-bin/carddisp.pl?gene=PDPN
- CD83, IRF7, TCF4, IRF8 (DC markers): PubMed search for "dendritic cell markers CD83 IRF7 TCF4 IRF8": https://pubmed.ncbi.nlm.nih.gov/?term=dendritic+cell+markers+CD83+IRF7+TCF4+IRF8
- CXCL16, CCL20, CYBA, CTSD (Macrophage markers): PubMed search for "macrophage markers CXCL16 CCL20 CYBA CTSD": https://pubmed.ncbi.nlm.nih.gov/?term=macrophage+markers+CXCL16+CCL20+CYBA+CTSD
- GZMB (Cytotoxic T cell marker): https://www.genecards.org/cgi-bin/carddisp.pl?gene=GZMB
- TNFRSF4 (Treg marker, OX40): https://www.genecards.org/cgi-bin/carddisp.pl?gene=TNFRSF4
- TPSB2, TPSAB1, GATA2 (Mast cell markers): PubMed search for "mast cell markers TPSB2 TPSAB1 GATA2": https://pubmed.ncbi.nlm.nih.gov/?term=mast+cell+markers+TPSB2+TPSAB1+GATA2
- XBP1, TNFRSF17 (Plasma cell markers): https://www.genecards.org/cgi-bin/carddisp.pl?gene=XBP1, https://www.genecards.org/cgi-bin/carddisp.pl?gene=TNFRSF17
4. Copy Number Variation Analysis in Intestinal Epithelial Cells from Colon Tissue
[Analysis Visualization Results]...
Analysis Overview
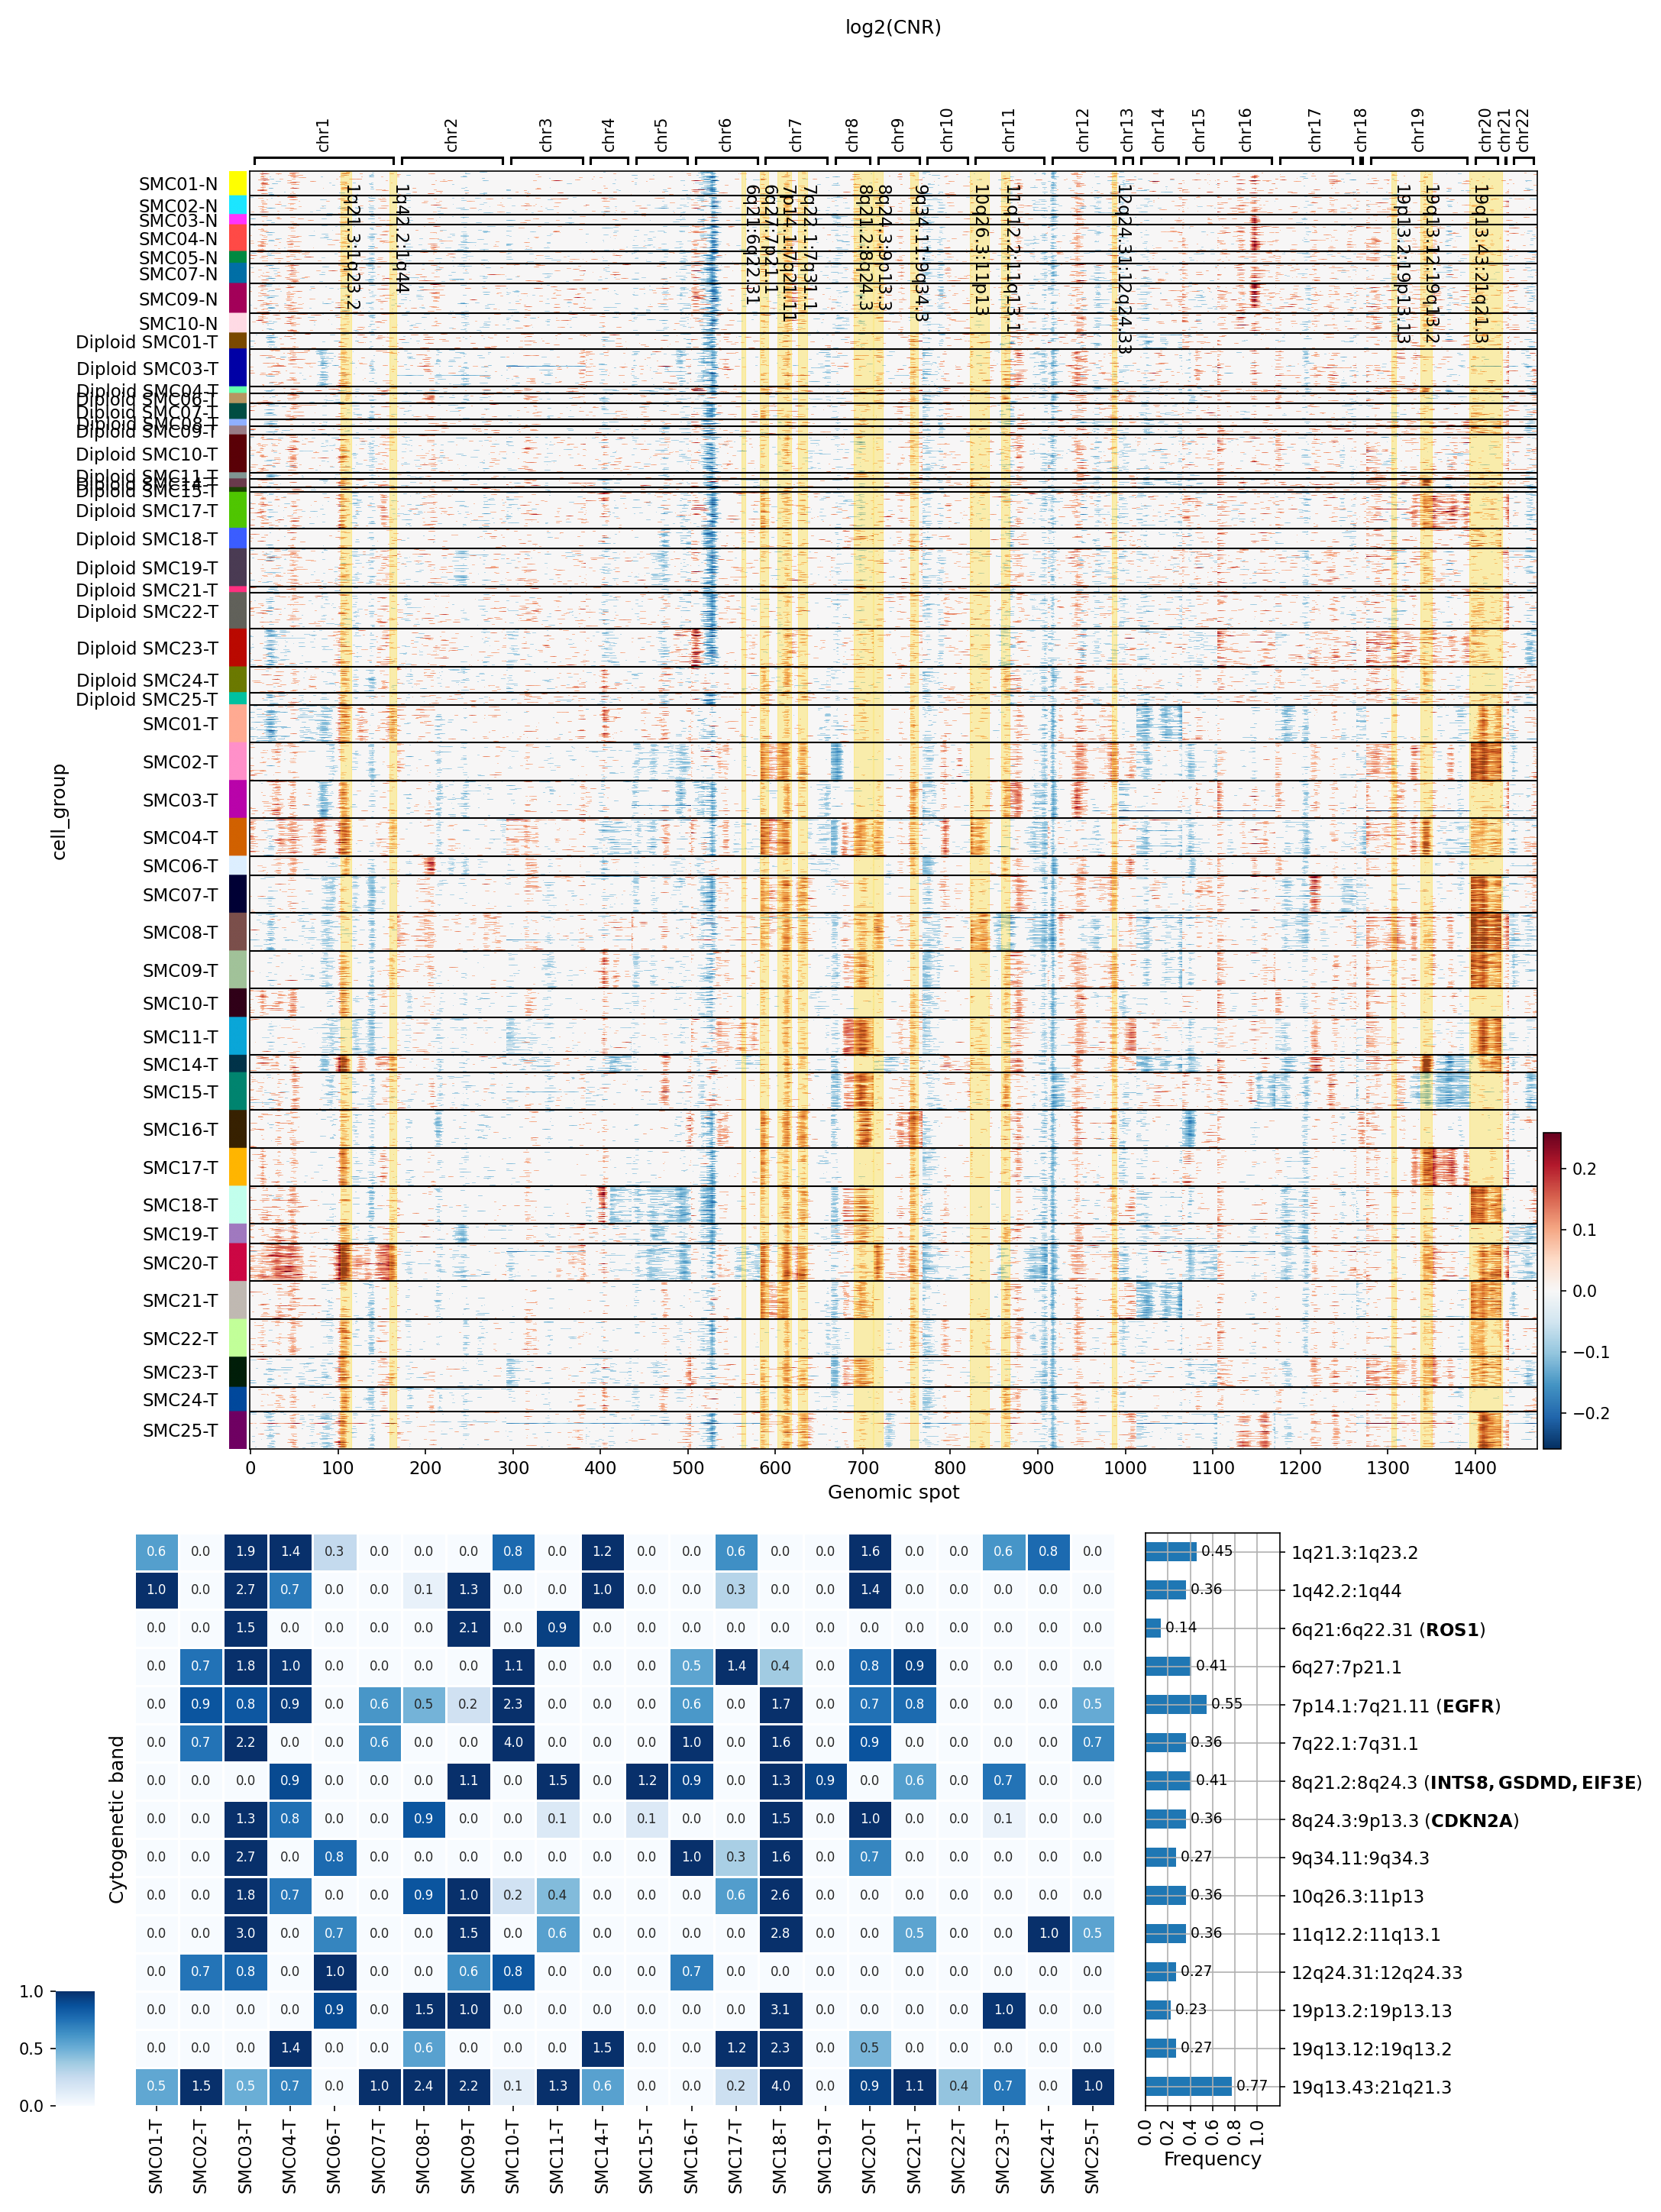
This analysis investigates copy number variations (CNVs) specifically within Intestinal Epithelial cells, which have been identified as the tumor-origin cell type in this dataset. The goal is to visualize CNV patterns across different samples and identify significantly amplified genomic regions. The results include a heatmap showing log2(CNR) values (Copy Number Ratio) across the genome for individual samples, alongside a summary heatmap highlighting frequently amplified cytogenetic bands and associated genes. The analysis groups cells by 'sample', providing insights into sample-specific CNV landscapes.
Visual Summary
CNV Heatmap
The heatmap displays log2(CNR) values across genomic spots for Intestinal Epithelial cells, grouped by individual samples.
- Color Scale: Red indicates amplification (log2(CNR) > 0), blue indicates deletion (log2(CNR) < 0), and yellow represents values close to baseline (no change).
- Sample Grouping: Samples are grouped, with SMCxx-N representing adjacent normal samples and SMCxx-T representing tumor samples. Some samples are also explicitly labeled as Diploid SMCxx-T, suggesting tumor samples where the majority of cells were identified as diploid, or that a diploid clone exists in the tumor.
Overall Patterns
- The SMCxx-N (normal) samples and those explicitly labeled Diploid SMCxx-T generally show minimal and sporadic CNV activity, consistent with a diploid state.
- In contrast, most SMCxx-T samples exhibit extensive and distinct patterns of both amplifications (red segments) and deletions (blue segments) across multiple chromosomes, reflecting genomic instability characteristic of cancer.
- Specific examples of broad amplifications can be observed in samples like SMC01-T (e.g., on chromosomes 7, 8, 13, 20), SMC03-T, SMC04-T, SMC06-T, SMC07-T, SMC08-T, SMC10-T, SMC11-T, SMC14-T, SMC15-T, SMC16-T, SMC18-T, SMC19-T, SMC20-T, SMC21-T, SMC22-T, SMC23-T, SMC24-T, and SMC25-T.
- Chromosomes 7, 8, 13, and 20 appear to harbor recurrent amplification events across multiple tumor samples. Chromosome 18 also shows recurrent deletions in several tumor samples.
Summary of Amplified Regions
The summary heatmap quantifies the frequency of significant copy number amplifications in specific cytogenetic bands across the tumor samples (SMCxx-T).
- Color Intensity: Deeper blue indicates higher frequency of amplification within that cytogenetic band across the tumor samples.
- Top Amplified Regions: The bar chart on the right ranks the top amplified regions by their overall frequency across the SMCxx-T samples.
- The most frequently amplified region is 19q13.43:21q12 (frequency ~0.82), indicating its amplification in approximately 82% of the tumor samples.
- Other highly amplified regions include 1q21.3:2q22 (frequency ~0.41), 1q42.2:1q44 (frequency ~0.27), 4q13.1:4q21.1 (frequency ~0.24), 6q27:7p15.3 (frequency ~0.27), 7p13:7q21.11 (EGFR) (frequency ~0.50), 7q22.1:7q22.3 (frequency ~0.24), 8p11.22:8q12.3 (frequency ~0.36), and 8p21.13:9p24.1 (EIF3E, INTS8, GSDMD, TPD52) (frequency ~0.59).
Biological Interpretation
The CNV analysis of Intestinal Epithelial cells strongly supports the presence of significant genomic alterations in tumor samples, consistent with the inferred context of Colon Cancer.
- Genomic Instability in Tumor Cells: The extensive CNVs (both amplifications and deletions) observed in SMCxx-T samples, compared to the relatively stable SMCxx-N and Diploid SMCxx-T cells, highlight the genomic instability inherent in these tumor-origin epithelial cells. This instability is a hallmark of cancer progression, contributing to tumor heterogeneity and adaptation.
Recurrent Amplifications in Colon Cancer
- 7p13:7q21.11 (EGFR): Amplification of the epidermal growth factor receptor (*EGFR*) gene is a well-known oncogenic driver in many cancers, including colorectal cancer. *EGFR* is a receptor tyrosine kinase that plays a crucial role in cell proliferation, differentiation, and survival pathways. Its amplification can lead to overexpression and constitutive activation, promoting uncontrolled cell growth. GeneCards: EGFR
- 8p21.13:9p24.1 (EIF3E, INTS8, GSDMD, TPD52): This region shows high amplification frequency.
- *EIF3E* (eukaryotic translation initiation factor 3 subunit E) is involved in translation initiation and has been implicated in various cancers.
- *GSDMD* (Gasdermin D) is a key mediator of pyroptosis, a pro-inflammatory form of programmed cell death. Its role in cancer is complex and context-dependent; while pyroptosis can suppress tumors, GSDMD can also promote tumor growth and metastasis in certain contexts. PubMed: GSDMD cancer review
- *TPD52* (Tumor Protein D52) is frequently overexpressed in several cancers and is associated with increased proliferation, survival, and metastasis. GeneCards: TPD52
- 19q13.43:21q12: This region shows the highest frequency of amplification, suggesting it harbors critical oncogenes or regulatory elements important for tumor development in these Intestinal Epithelial cells. Further investigation into specific genes within this broad region would be valuable.
- Validation of Tumor vs. Normal Classification: The clear distinction in CNV profiles between SMCxx-N (adjacent normal) and SMCxx-T (tumor) samples provides strong validation for the initial cell type and condition assignments. The presence of aneuploid cells was indicated in the data context (22.6% Aneuploid), and this analysis visually confirms the extensive aneuploidy and CNV burden within the tumor-derived Intestinal Epithelial cells.
Clinical or Translational Implications
The identified recurrent amplifications in Intestinal Epithelial cells, particularly those involving *EGFR*, hold significant clinical implications for Colon Cancer:
- Prognostic and Predictive Biomarkers: Amplification of *EGFR* is a recognized biomarker in colorectal cancer, often associated with more aggressive disease and potentially informing prognosis.
- Therapeutic Targeting: Patients with *EGFR* amplification may be candidates for anti-EGFR therapies (e.g., cetuximab, panitumumab), which are approved for metastatic colorectal cancer. Identifying this amplification in the tumor-origin cells of individual patients can guide personalized treatment strategies.
- Novel Therapeutic Avenues: The high frequency of amplification in regions containing genes like *GSDMD* and *TPD52* warrants further investigation into their functional roles in colon cancer and their potential as novel therapeutic targets or markers. Understanding the context-dependent roles of genes like *GSDMD* in pyroptosis could open new avenues for cancer immunotherapy or cell death induction.
5. UMAP Visualization of CNV Patterns Across Cell Types, Ploidy, and Conditions in Colon Tissue
[Analysis Visualization Results]...
Analysis Overview
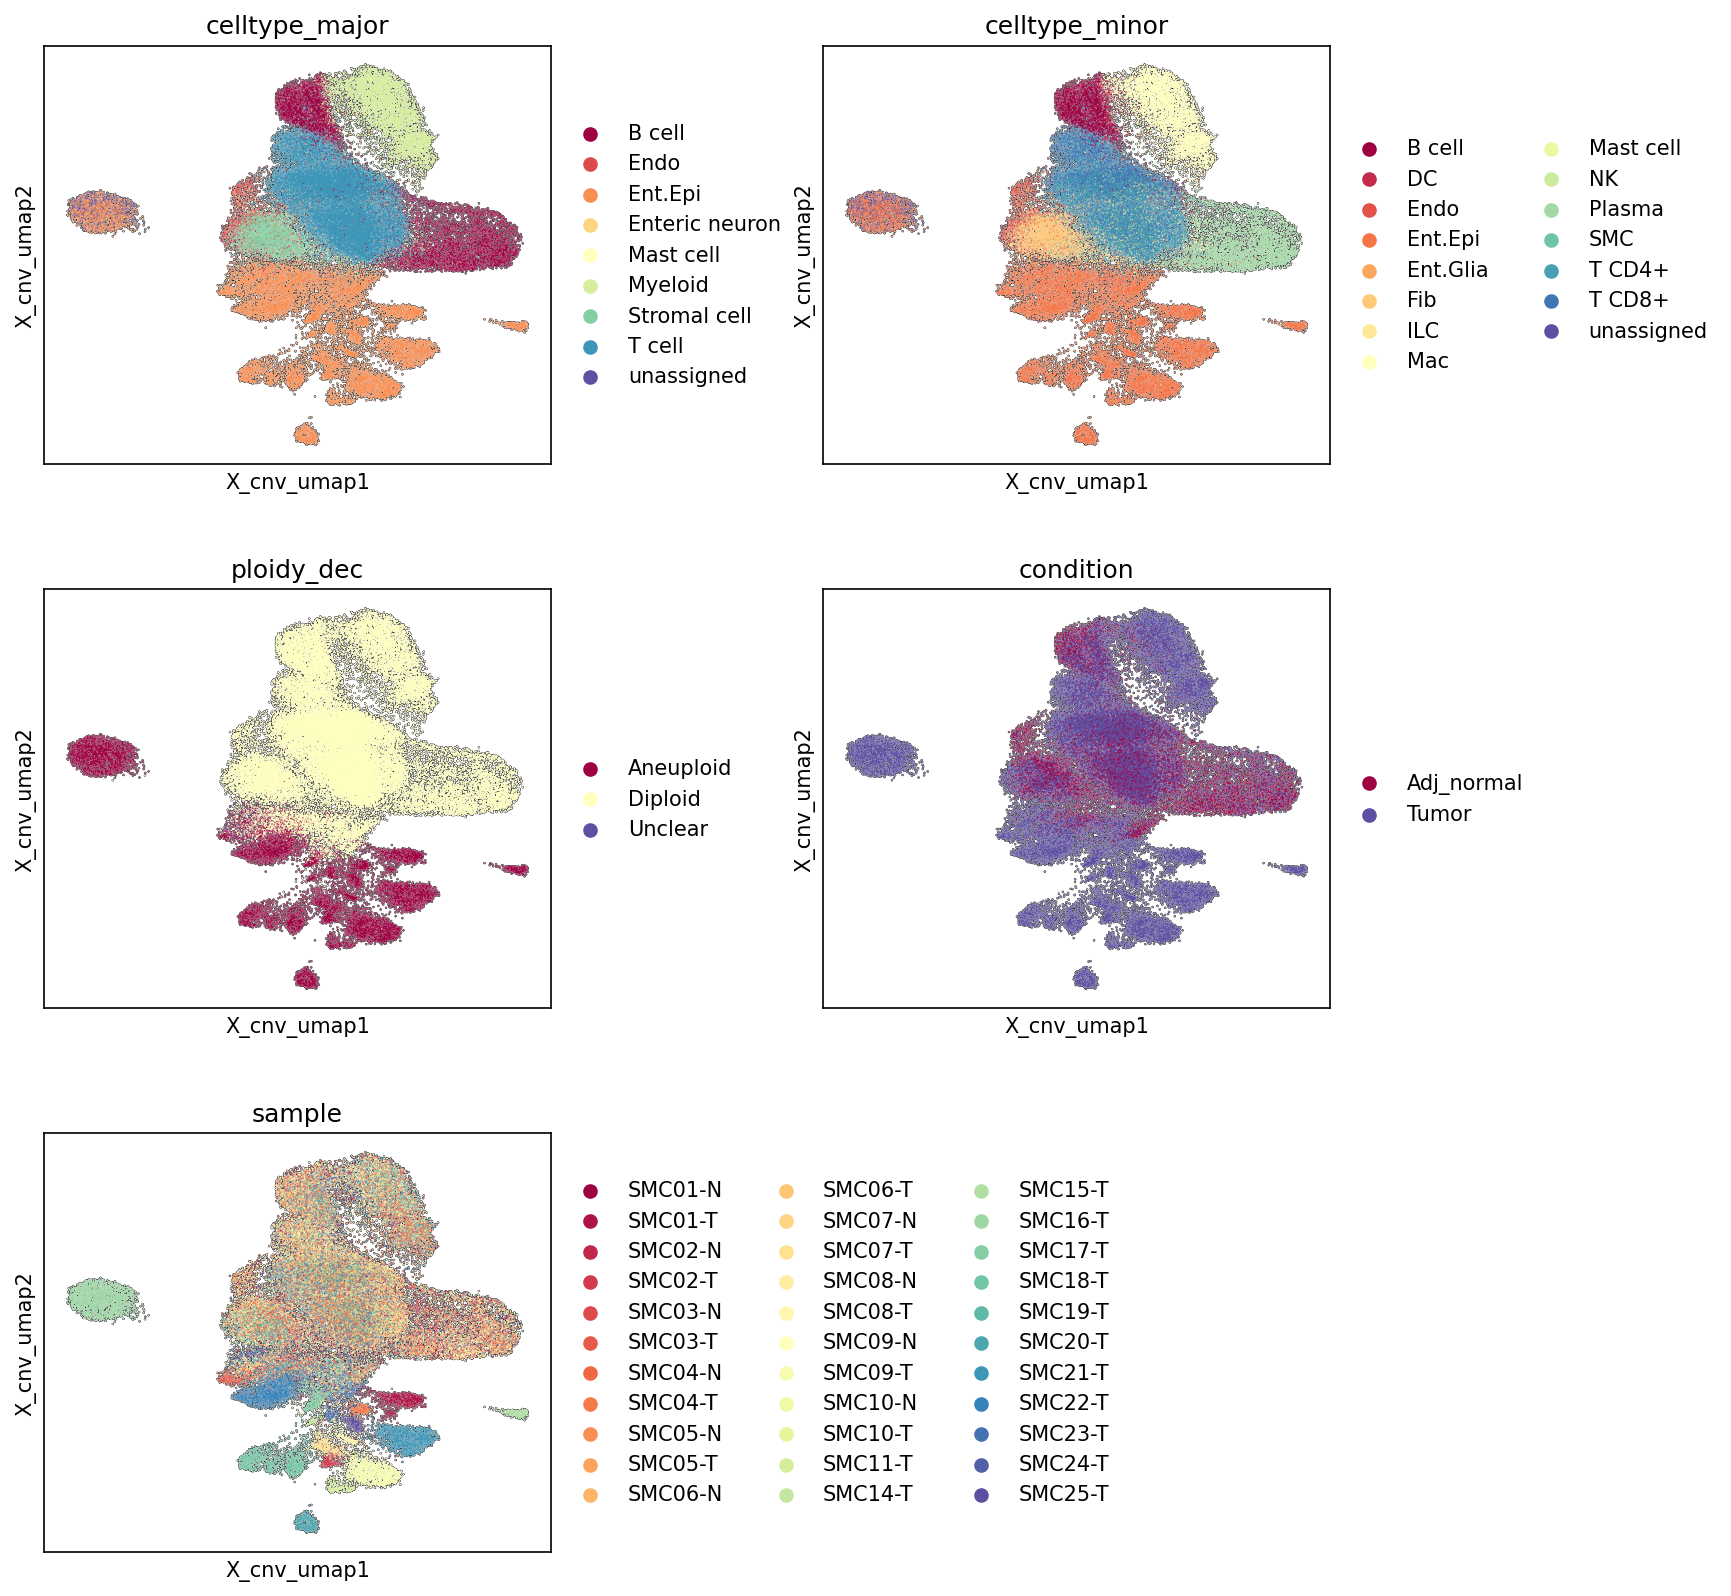
This analysis presents five UMAP (Uniform Manifold Approximation and Projection) plots, where the embedding space is generated based on inferred Copy Number Variation (CNV) patterns of individual cells. Each plot colors the cells according to a different metadata annotation: celltype_major, celltype_minor, ploidy_dec, condition (Tumor vs. Adj_normal), and sample. The primary goal is to visualize how cell types, ploidy status, and sample conditions distribute within the CNV-driven embedding, providing insights into cellular heterogeneity and disease-specific characteristics in Colon Cancer.
Visual Summary
- Overall Embedding Structure (CNV-driven): The UMAP reveals a large, interconnected central manifold of cells, with a prominent, distinct cluster of cells to the lower-left and a smaller, separate cluster to the far left. The embedding, being based on CNV, effectively groups cells with similar genomic alterations.
celltype_major and celltype_minor Distribution:
- Intestinal Epithelial cells (Ent.Epi) form the largest and most prominent cluster, primarily occupying the upper-right and central regions of the main manifold. This is consistent with their role as the tumor-origin cell type.
- Stromal cells (including Fibroblasts) and Myeloid cells (including Macrophages) also form significant, relatively distinct clusters, mostly separate from the core epithelial mass.
- T cells, B cells, and Endothelial cells form more diffuse or smaller, separated clusters. The small cluster on the far left of the UMAP appears to be predominantly Endothelial cells.
- The celltype_minor plot provides finer granularity, confirming the clear separation and clustering of specific subtypes like Fibroblasts, Macrophages, and T cell subsets (CD4+ and CD8+).
ploidy_dec Distribution:
- Diploid cells (yellow) represent the vast majority of cells and occupy most of the central and upper UMAP space, forming a large, broadly distributed cluster.
- Aneuploid cells (dark red) form a highly distinct and relatively compact cluster located primarily in the lower-left region of the main manifold. This cluster shows a strong overlap with the core Intestinal Epithelial cell population. A smaller, separate aneuploid cluster is also observed on the far left, largely coinciding with the small Endothelial cell cluster.
- Cells classified as Unclear (purple) are very few and scattered, not forming any discernible cluster.
condition Distribution:
- Cells from the Tumor condition (purple) largely co-localize with the distinct Aneuploid cluster observed in the ploidy_dec map, particularly the large cluster in the lower-left. They also extend into areas overlapping with diploid cells, likely representing tumor-infiltrating immune and stromal cells.
- Cells from the Adj_normal condition (dark red) predominantly occupy the large, diffuse diploid regions of the UMAP.
- There is a clear spatial separation between the bulk of tumor-associated cells (especially those with aneuploidy) and the adjacent normal tissue cells, although some intermixing within the diploid populations is expected.
sample Distribution:
- The sample plot shows that cells from different patients are generally well-intermixed within the broad diploid populations, indicating that the CNV-based embedding effectively captures biological variation over sample-specific batch effects in these regions.
- However, within the distinct aneuploid clusters, there is some discernible patterning where certain samples (e.g., SMC01-T, SMC02-T, SMC03-T, etc.) appear to contribute prominently, suggesting patient-specific CNV profiles within the malignant cell populations.
Biological Interpretation
The CNV-driven UMAP effectively delineates cellular populations based on their genomic integrity, providing strong evidence for the malignant origin of specific cell types in colon cancer.
- Identification of Malignant Epithelial Cells: The most striking observation is the clear separation of Aneuploid cells into a distinct cluster. This cluster overwhelmingly overlaps with Intestinal Epithelial cells from the Tumor condition. This robustly confirms the data context that the Resolved tumor-origin cell type is Intestinal Epithelial cell and that these cells exhibit characteristic genomic instability (aneuploidy) associated with cancer. This segregation based on CNV patterns highlights the utility of this approach in identifying malignant cells from the tumor microenvironment.
- Tumor Microenvironment Heterogeneity: While the malignant epithelial cells form a distinct aneuploid cluster, the UMAP also shows the presence of various immune (T cells, B cells, Myeloid cells) and stromal (Fibroblasts, Endothelial cells) populations. These non-malignant cells largely reside in the diploid regions of the UMAP, irrespective of whether they originate from Tumor or Adj_normal tissue. This suggests that their CNV profiles are largely stable, as expected, but their proximity to or intermixing with tumor cells (especially in the diploid regions of the condition UMAP) indicates their presence within the tumor microenvironment.
- CNV as a Primary Driver of Cell Clustering: The successful segregation of aneuploid tumor cells from diploid non-malignant cells, purely based on CNV features, demonstrates that large-scale chromosomal alterations are a dominant factor driving the clustering in this UMAP. This underscores the profound impact of CNV on cellular identity and transcriptional states in cancer.
- Potential for Specific Aneuploid Subpopulations: The presence of a smaller, distinct aneuploid cluster primarily composed of Endothelial cells (seen on the far left) suggests that while Intestinal Epithelial cells are the primary tumor-origin cell type, other cell types might also exhibit aneuploidy, possibly due to secondary transformation or response to the tumor microenvironment, or represent rare, distinct tumor subclones.
Annotation Notes
- Cell Type Consistency: The UMAP effectively demonstrates that Intestinal Epithelial cell forms a coherent cluster, and importantly, the subset of these cells that are Aneuploid largely define the Tumor condition, reinforcing the quality and biological consistency of the cell type and ploidy annotations.
- Batch Effect Assessment: While some patient-specific segregation is observed within the aneuploid clusters, the general intermixing of samples across the diploid populations indicates that the CNV-based embedding is primarily driven by biological differences rather than strong sample-specific batch effects, at least for the non-malignant cells.
- Unassigned Cells: The unassigned cell type constitutes a very minor population that does not form distinct clusters and is mostly scattered, suggesting these are either rare cell types or cells difficult to categorize robustly with current markers.
6. Minor Cell Type Population Analysis in Colon Cancer
[Analysis Visualization Results]...
Analysis Overview
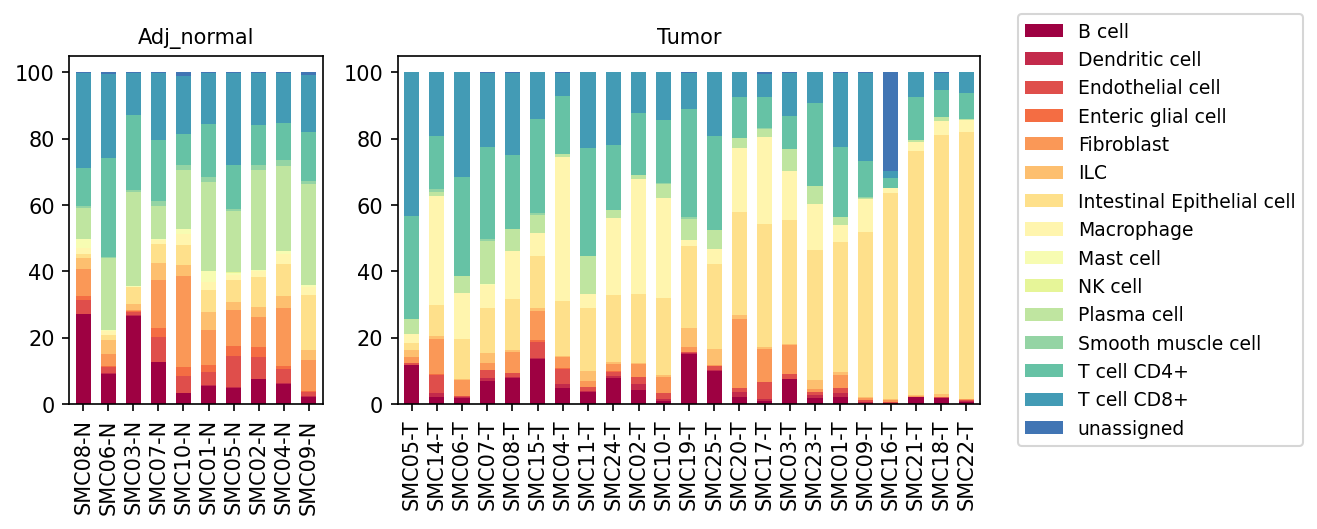
This analysis presents a population bar plot showing the relative proportions of various minor cell types across individual samples from both 'Adj_normal' (adjacent normal tissue) and 'Tumor' conditions. The plot provides a comprehensive overview of the cellular composition, highlighting shifts in the tumor microenvironment (TME) when comparing normal colon tissue to tumor tissue.
Visual Summary
The stacked bar plots display the percentage contribution of each minor cell type within each sample.
Adjacent Normal Samples:
- 'Adj_normal' samples (SMCXX-N) show a diverse cellular landscape, with significant contributions from Intestinal Epithelial cells (pale yellow), Fibroblasts (orange), T cells (CD4+ in teal, CD8+ in dark teal), Plasma cells (light green), and B cells (dark red). Macrophages (cream) are also consistently present.
- The proportions of these cell types are relatively consistent across different 'Adj_normal' samples, indicating a stable tissue architecture.
Tumor Samples:
- 'Tumor' samples (SMCXX-T) exhibit a striking shift in cellular composition. Intestinal Epithelial cells (pale yellow) become overwhelmingly dominant in most tumor samples, often constituting over 70-80% of the total cellularity. This is particularly pronounced in samples like SMC19-T, SMC25-T, SMC20-T, SMC17-T, SMC03-T, SMC01-T, SMC09-T, SMC16-T, SMC21-T, SMC18-T, and SMC22-T, where other cell types are significantly diminished in relative proportion.
- Conversely, the relative proportions of most immune cells (e.g., T cells CD4+, T cells CD8+, B cells, Plasma cells, NK cells, Macrophages) appear substantially reduced in many tumor samples compared to 'Adj_normal'.
- Fibroblasts (orange) remain a notable component in tumor samples, although their relative proportion can vary significantly among different tumor samples.
- Some tumor samples (e.g., SMC05-T, SMC14-T, SMC06-T, SMC07-T, SMC08-T, SMC15-T, SMC04-T) show a relatively more diverse immune and stromal composition compared to the highly epithelial-dominated tumor samples, indicating heterogeneity within the tumor microenvironment.
- The 'unassigned' category (dark blue) appears in some tumor samples, suggesting a small fraction of cells that could not be confidently assigned to a known minor cell type.
Biological Interpretation
The observed shifts in cell populations provide key insights into the biology of Colon Cancer:
- Tumor Cell Dominance: The pronounced increase in Intestinal Epithelial cells in tumor samples is consistent with the 'Resolved tumor-origin cell type' being Intestinal Epithelial cells. This indicates the proliferative expansion of malignant epithelial cells, a hallmark of carcinoma. The high proportion of epithelial cells in many tumor samples suggests a high tumor cellularity or "purity" in these regions.
- Remodeling of the Tumor Microenvironment (TME): The relative decrease in immune cells within tumor samples, particularly T cells, B cells, and Plasma cells, suggests a significant reorganization of the TME. While their *relative* proportion is diminished due to the overgrowth of tumor cells, the *absolute* numbers or states of these immune cells may still be critical for tumor progression and response to therapy.
- Stromal Involvement: The consistent presence of Fibroblasts in both conditions, and their variable but sometimes prominent contribution in tumor samples, highlights the crucial role of the stromal compartment. These are likely Cancer-Associated Fibroblasts (CAFs) in the tumor, which are known to contribute to tumor growth, angiogenesis, immune suppression, and extracellular matrix remodeling in various cancers, including colorectal cancer [PMID: 32363198].
- Immune Cell Exclusion/Dilution: The observed relative reduction in immune cell populations could represent:
- Immune cell exclusion: Physical barriers or suppressive signals within the TME preventing immune cell infiltration.
- Immune cell dilution: The rapid proliferation of tumor cells simply diluting the proportion of immune cells, even if absolute numbers remain stable or increase.
- Immune cell depletion: Actual loss or reduction of certain immune cell subsets.
Such changes have significant implications for the effectiveness of anti-tumor immune responses.
Clinical or Translational Implications
- Prognostic and Predictive Biomarkers: The overall cellular composition of the tumor, particularly the relative proportions of tumor cells, stromal cells (fibroblasts), and various immune cell subsets, can serve as valuable prognostic markers for colon cancer patients. For instance, a higher proportion of tumor-infiltrating lymphocytes (TILs) is often associated with better prognosis in various cancers, while a higher proportion of immunosuppressive cells (e.g., certain macrophage subtypes) might indicate a worse outcome.
Therapeutic Strategies:
- Immunotherapy: The observed shifts in immune cell populations underscore the importance of understanding the immune context of individual tumors. Tumors with a relatively lower proportion of effector T cells might be less responsive to immune checkpoint inhibitors, highlighting the need for strategies to enhance immune cell infiltration or function [GeneCards: PDCD1 (PD-1)].
- Targeting the Stroma: The significant presence of fibroblasts in the TME suggests that targeting CAFs could be a viable therapeutic strategy to disrupt tumor-stroma interactions and inhibit tumor progression [PMID: 30046030].
- Personalized Medicine: The sample-to-sample variability in cell type proportions within the 'Tumor' condition emphasizes the molecular and cellular heterogeneity of colon cancer. This heterogeneity necessitates personalized therapeutic approaches, where treatment decisions are guided by the specific cellular makeup of a patient's tumor.
7. T cell and ILC Subtype Population Analysis in Colon Cancer
[Analysis Visualization Results]...
Analysis Overview
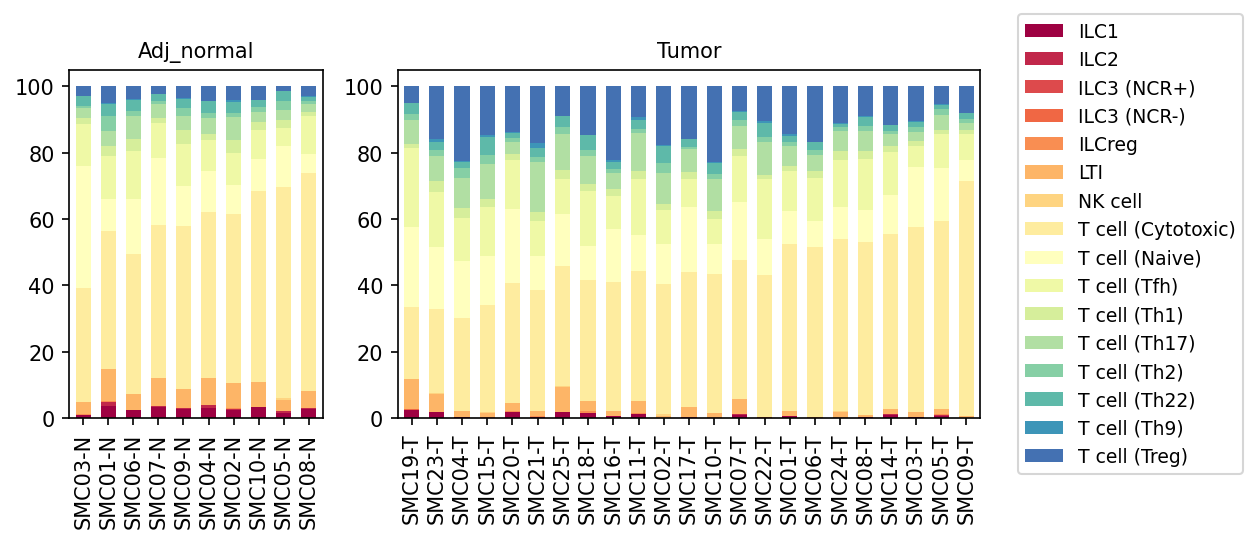
This analysis presents a stacked bar plot visualizing the relative proportions of T cell and Innate Lymphoid Cell (ILC) subsets within the overall "T cell" major cell type, across individual samples from both 'Adj_normal' (adjacent normal) and 'Tumor' conditions. The plot allows for a comparative assessment of the immune microenvironment composition, specifically focusing on the adaptive and innate lymphocyte populations, in the context of colon cancer.
Visual Summary
The plot displays distinct patterns in the composition of T cell and ILC subsets between 'Adj_normal' and 'Tumor' tissues.
- Overall Composition: In both conditions, T cell subsets dominate the population, with ILCs (ILC1, ILC2, ILC3 (NCR+), ILC3 (NCR-), ILCreg, LTI) and NK cells forming a smaller proportion.
'Adj_normal' Condition:
- The most prominent populations are T cell (Cytotoxic), T cell (Naive), T cell (Tfh), and T cell (Th1), with varying contributions across samples.
- T cell (Treg) (dark blue) is present in relatively lower proportions, typically occupying a small fraction at the top of the bars.
- Other Th subsets (Th17, Th2, Th22, Th9) are also observed as minor components.
'Tumor' Condition:
- A striking and consistent increase in the proportion of T cell (Treg) is observed across nearly all 'Tumor' samples compared to 'Adj_normal' samples. In many tumor samples, Tregs constitute a substantial portion of the T cell compartment, often exceeding 10-20%.
- Concomitantly, there appears to be a relative decrease in the proportions of effector T cells, such as T cell (Cytotoxic) and T cell (Naive) cells, although they still represent significant components in some samples.
- The proportions of other T helper subsets and ILCs generally remain low, without clear, consistent shifts across tumor samples, though some individual sample variability exists.
Biological Interpretation
The observed population shifts, particularly the enrichment of T cell (Treg) cells in the 'Tumor' microenvironment, carry significant biological implications for colon cancer.
- Treg Expansion in Tumor: Regulatory T cells (Tregs), characterized by the expression of FOXP3, are known for their immunosuppressive functions, essential for maintaining immune tolerance and preventing autoimmunity GeneCards: FOXP3. In the context of cancer, their substantial increase in the tumor microenvironment (TME) is a hallmark of immune evasion. Tregs actively suppress anti-tumor immune responses mediated by cytotoxic T cells and other effector immune cells, thereby promoting tumor growth and progression PubMed search: "Treg colon cancer immune suppression".
- Imbalance of Effector vs. Regulatory T cells: The relative decrease or dilution of T cell (Cytotoxic) populations in the tumor, alongside Treg expansion, indicates an unfavorable immune landscape where anti-tumor immunity is likely compromised. Cytotoxic T cells are crucial for directly killing cancer cells, and their suppression by Tregs can hinder effective tumor eradication.
- Other T Helper Subsets and ILCs: While present, the lack of dramatic shifts in other Th subsets or ILC populations suggests that the Treg expansion is a primary driver of the observed immune dysregulation within the T cell compartment in this colon cancer dataset.
Clinical or Translational Implications
The findings have several potential clinical and translational implications for colon cancer:
- Prognostic Biomarker: An elevated proportion of Tregs in the tumor microenvironment is frequently associated with poor prognosis in various cancers, including colorectal cancer PubMed search: "Treg prognostic biomarker colorectal cancer". The observed increase in Tregs could serve as a potential prognostic indicator for colon cancer patients.
- Immunotherapy Target: Given their role in immune suppression, Tregs represent an attractive target for immunotherapy. Strategies aimed at depleting or functionally inhibiting Tregs could enhance the efficacy of existing immunotherapies, such as checkpoint blockade, by unleashing anti-tumor effector responses. This approach could be particularly relevant in colon cancer patients exhibiting a high Treg infiltration.
- Monitoring Treatment Response: Changes in the Treg to effector T cell ratio could potentially be used to monitor the effectiveness of immunotherapeutic interventions, where a reduction in Treg proportion or an increase in cytotoxic T cells might indicate a favorable response.
8. Differential T cell Subset Proportions in Colon Tumor Microenvironment
[Analysis Visualization Results]...
Analysis Overview
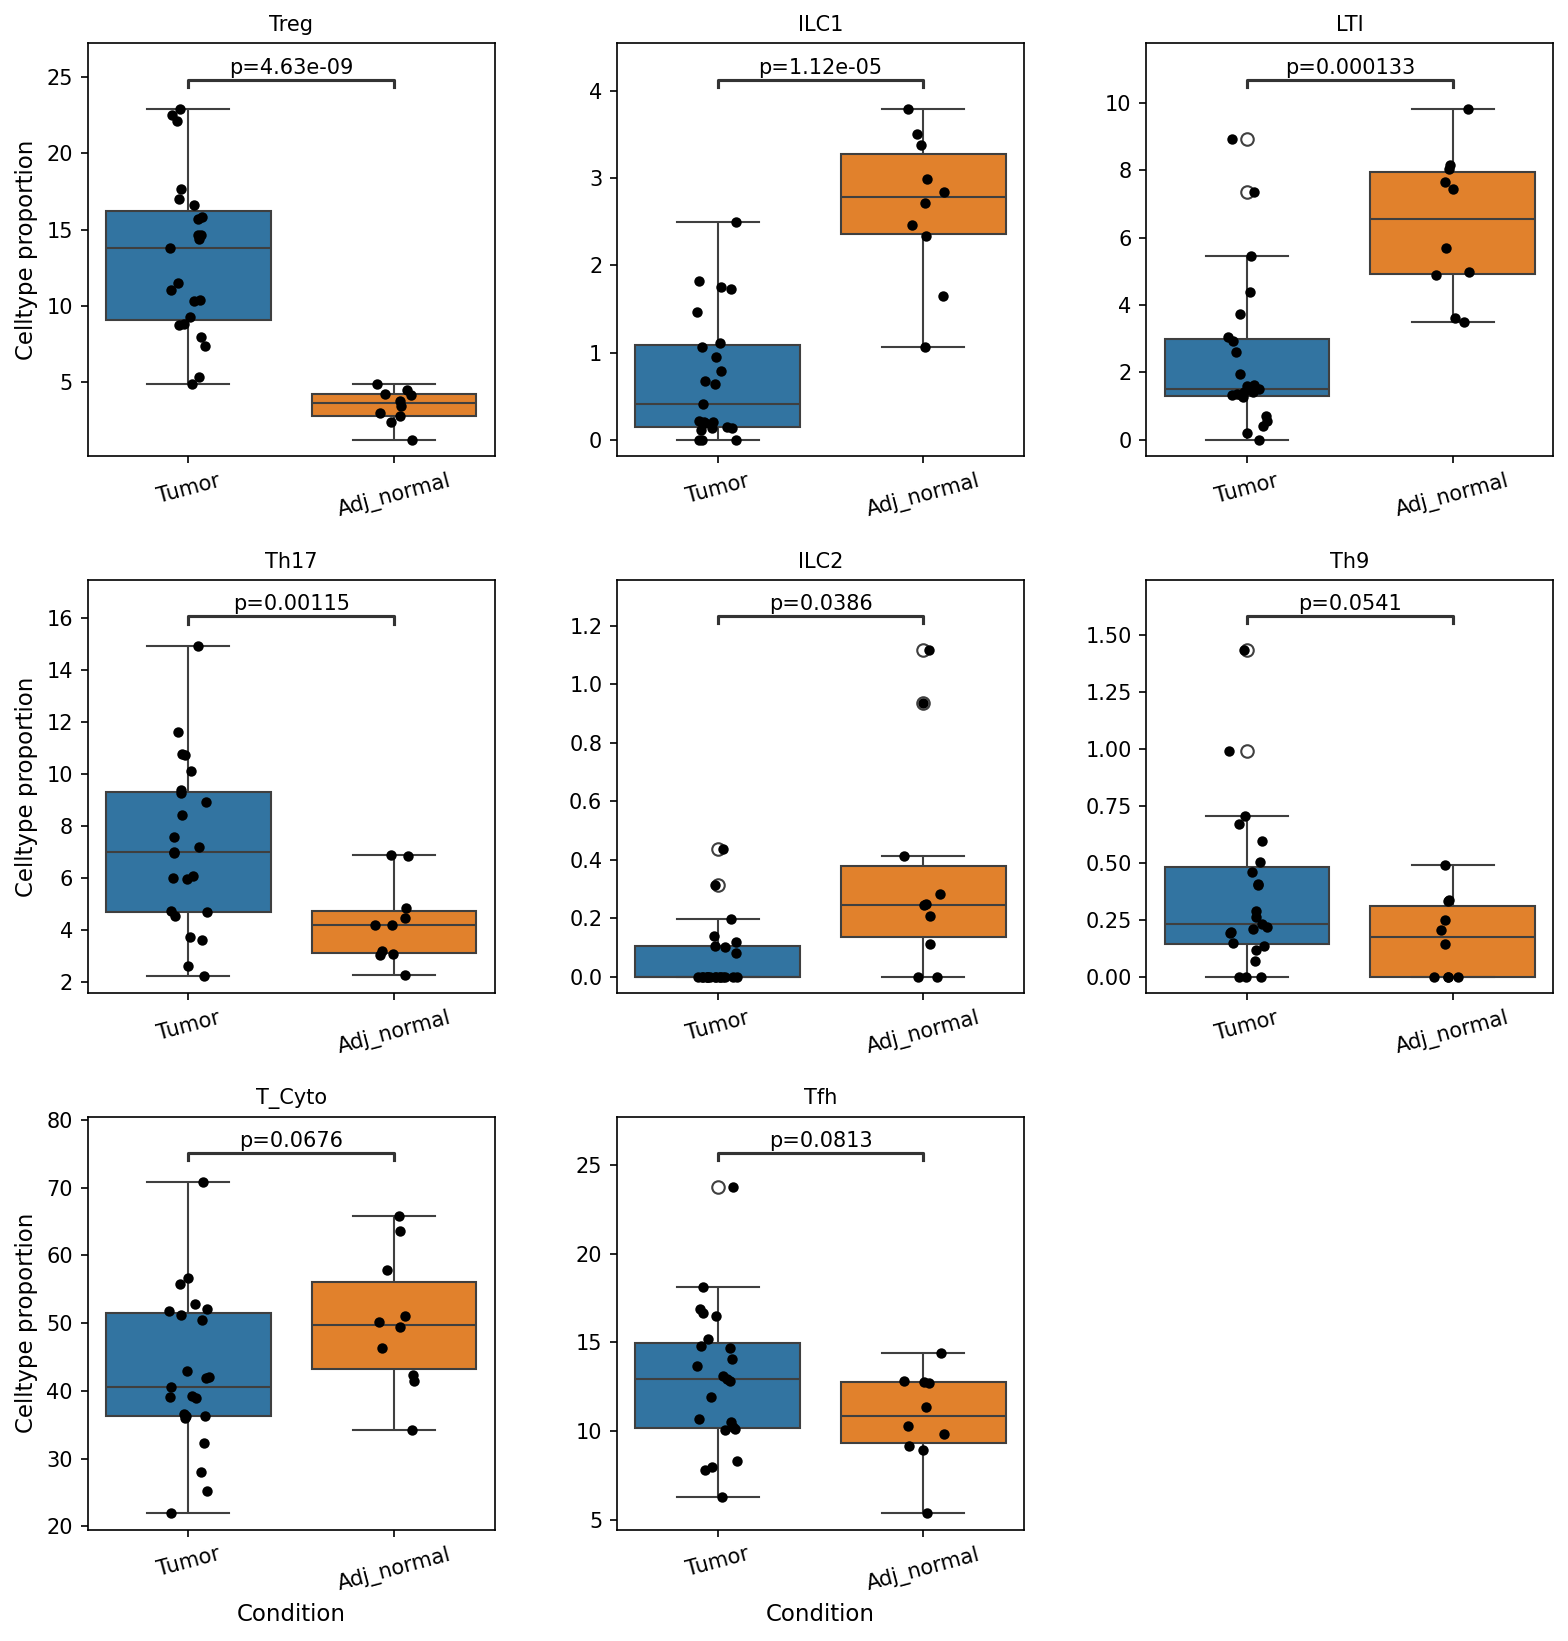
This analysis investigates the proportional representation of specific T cell subsets (Treg and Th17) in the Colon Tumor microenvironment compared to adjacent normal tissue. The aim is to identify statistically significant changes in these immune cell populations that may contribute to the disease context, Colon Cancer.
Visual Summary
The box plots display the cell type proportion for T cell (Treg) and T cell (Th17) subsets across 'Tumor' and 'Adj_normal' conditions.
Treg (Regulatory T cells):
- The proportion of Treg cells is significantly higher in 'Tumor' samples compared to 'Adj_normal' samples.
- The median Treg proportion in 'Tumor' samples is approximately 4%, whereas in 'Adj_normal' samples, it is considerably lower, around 1.3%.
- The difference is highly statistically significant, with a p-value of 6.19e-07.
Th17 (T helper 17 cells):
- Similarly, the proportion of Th17 cells also appears elevated in 'Tumor' samples compared to 'Adj_normal' samples.
- The median Th17 proportion in 'Tumor' samples is approximately 2.8%, compared to about 1.6% in 'Adj_normal' samples.
- This difference is statistically significant, with a p-value of 0.0454.
Overall, both Treg and Th17 T cell subsets show increased proportions in the tumor tissue compared to adjacent normal tissue in the colon.
Biological Interpretation
The observed increase in both Treg and Th17 cell populations in the colon tumor microenvironment has important biological implications for cancer progression and immune evasion.
- Increased Treg cells in Tumors: Regulatory T cells (Tregs) are crucial for maintaining immune tolerance and suppressing excessive immune responses. Their significant enrichment in the tumor context, as seen here, is a well-established mechanism of immune evasion employed by many cancers, including colorectal cancer. By suppressing effector T cells (like cytotoxic T cells and Th1 cells), Tregs can inhibit anti-tumor immunity, allowing cancer cells to escape immune surveillance and proliferate. This contributes to a more immunosuppressive tumor microenvironment [PubMed search: Treg colon cancer immune suppression].
- Increased Th17 cells in Tumors: The role of Th17 cells in cancer is more complex and context-dependent, often exhibiting both pro- and anti-tumorigenic properties. In colorectal cancer, Th17 cells are frequently associated with promoting inflammation, angiogenesis, and tumor growth. They can contribute to the recruitment of other immune cells (e.g., neutrophils) and release cytokines like IL-17, which can stimulate cancer cell proliferation and survival, as well as promote an immunosuppressive environment alongside Tregs [PubMed search: Th17 colon cancer IL-17]. The concurrent increase of Th17 cells suggests an inflammatory but potentially pro-tumorigenic microenvironment in these colon tumors.
The co-occurrence of elevated Treg and Th17 cells suggests a dysregulated immune response within the colon tumor, leaning towards immune suppression and chronic inflammation that can favor tumor growth rather than elimination.
Clinical or Translational Implications
The findings highlight specific immune cell populations that are significantly altered in Colon Cancer, providing potential avenues for clinical and translational research:
- Biomarkers: The proportions of Treg and Th17 cells could serve as potential biomarkers for distinguishing tumor from normal tissue, and possibly for prognosis, given their established roles in tumor progression and immune suppression in colorectal cancer.
- Immunotherapy Targets: Targeting these immune cell populations could be a therapeutic strategy.
- Treg Depletion/Inhibition: Strategies aimed at reducing Treg function or numbers could enhance anti-tumor immunity and improve the efficacy of existing immunotherapies [PubMed search: Treg depletion cancer therapy].
- Modulating Th17 activity: Given their dual role, modulating Th17 responses, perhaps by inhibiting their pro-tumorigenic pathways or shifting their phenotype, could also be explored [PubMed search: Th17 modulation colon cancer therapy].
- Understanding Immune Landscape: This analysis contributes to a deeper understanding of the immune landscape within colon tumors, which is critical for developing more effective, personalized immunotherapeutic approaches for patients with colon cancer.
9. Macrophage Subset Population Analysis in Colon Cancer
[Analysis Visualization Results]...
Analysis Overview
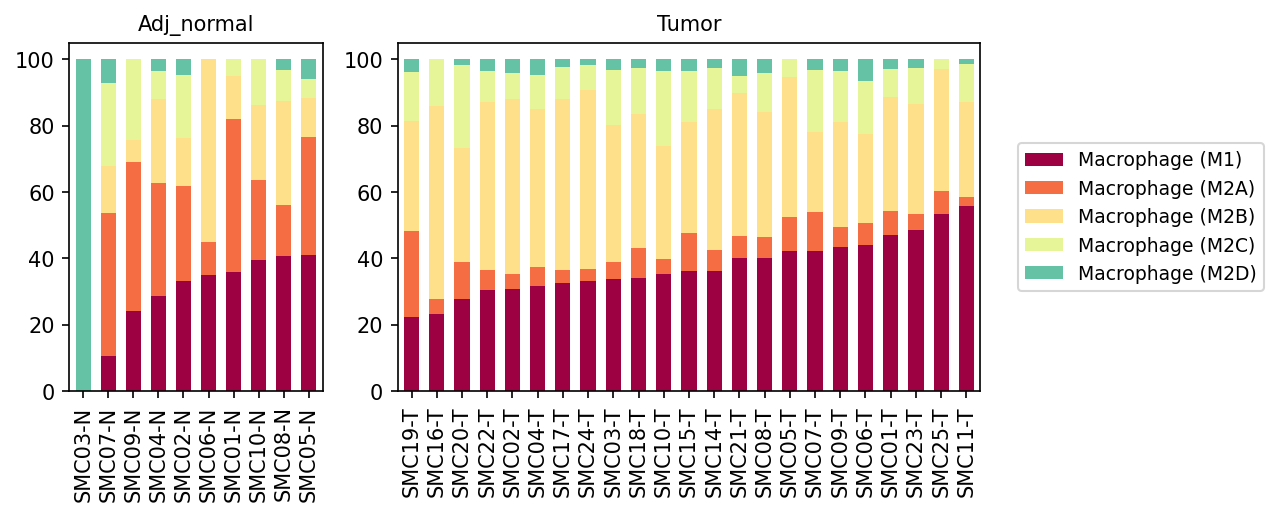
This analysis presents a population bar plot detailing the proportions of various macrophage subsets (Macrophage (M1), Macrophage (M2A), Macrophage (M2B), Macrophage (M2C), Macrophage (M2D)) across individual samples from both 'Adj_normal' (adjacent normal colon tissue) and 'Tumor' (colon tumor tissue) conditions. The goal is to identify shifts in macrophage polarization that may be associated with colon cancer progression. Each bar represents 100% of the total macrophages within a given sample, with colors indicating the relative proportion of each identified subset.
Visual Summary
The visualization clearly illustrates distinct differences in macrophage subset composition between adjacent normal and tumor colon tissues.
- Macrophage (M2D) Dominance in Adj_normal: In the 'Adj_normal' condition, one sample (SMC03-N) is almost entirely composed of Macrophage (M2D). Other adjacent normal samples display a more heterogeneous mix, with Macrophage (M1), Macrophage (M2A), Macrophage (M2B), and Macrophage (M2C) present in varying proportions.
- Shift in Tumor Microenvironment: In the 'Tumor' condition, Macrophage (M2D) is dramatically reduced, becoming a minor or almost absent population across nearly all tumor samples.
- Increased Macrophage (M1), (M2B), and (M2C) in Tumor: The tumor samples generally show a notable increase in the relative proportions of Macrophage (M1), Macrophage (M2B), and Macrophage (M2C) compared to the adjacent normal tissue.
- Macrophage (M1) (dark red) shows a consistent and often increasing proportion in tumor samples, frequently comprising 30-50% of the total macrophage population.
- Macrophage (M2B) (light orange/yellow) and Macrophage (M2C) (light yellow) together constitute a substantial portion of macrophages in tumor samples, often dominating over other M2 subtypes (like M2A).
- Reduced Macrophage (M2A) in Tumor (relative to other M2s): While present in both conditions, Macrophage (M2A) (coral) appears to contribute a smaller relative proportion in the tumor compared to the combined M2B and M2C subsets.
- Inter-sample Heterogeneity: While general trends are observed, there is still some sample-to-sample variability within both conditions, particularly in the 'Adj_normal' group. However, the 'Tumor' samples exhibit a more consistent pattern of macrophage subset redistribution.
Biological Interpretation
Macrophages are critical components of the tumor microenvironment (TME) and undergo distinct polarization states with varying functions. M1 macrophages are typically characterized by pro-inflammatory and anti-tumorigenic properties, while M2 macrophages are broadly associated with anti-inflammatory, immunosuppressive, tissue repair, and pro-tumorigenic functions. The classification into M2A, M2B, M2C, and M2D reflects further functional specialization.
The observed shifts in macrophage populations strongly suggest a profound reprogramming of macrophages within the colon cancer TME:
- Loss of M2D in Tumor: The near disappearance of Macrophage (M2D) in tumor tissues compared to adjacent normal tissues is a striking observation. M2D macrophages are often associated with regulatory or tolerogenic functions. Their reduction in tumors could indicate a loss of a specific regulatory immune component in the cancer context or a re-polarization into other M2 subtypes.
- Increased M1, M2B, and M2C Polarization in Tumor:
- The concurrent increase in Macrophage (M1) suggests an active, though potentially insufficient, anti-tumor immune response. M1 macrophages produce pro-inflammatory cytokines that can activate T cells and directly kill tumor cells [1].
- However, the significant presence and often dominance of Macrophage (M2B) and Macrophage (M2C) in tumor samples are highly indicative of a pro-tumorigenic and immunosuppressive TME.
- M2B macrophages are often induced by immune complexes and can produce both pro-inflammatory cytokines (like IL-6) and anti-inflammatory cytokines (like IL-10), playing complex roles in immune regulation, often contributing to fibrosis and tumor promotion [2].
- M2C macrophages are typically activated by IL-10 and TGF-β and are potent producers of immunosuppressive molecules (e.g., IL-10, TGF-β, arginase-1) that promote tumor growth, angiogenesis, and immune evasion by suppressing T-cell responses [3].
- Tumor-Associated Macrophages (TAMs): The observed macrophage phenotype in the tumor (high M1 but also high M2B/M2C and low M2D) collectively represents the complex nature of Tumor-Associated Macrophages (TAMs). While some M1-like activity might be present, the prominent M2B and M2C populations highlight a shift towards an overall immunosuppressive and pro-tumorigenic phenotype, which is a hallmark of TAMs in many cancers, including colon cancer [4]. These M2-like TAMs contribute to tumor progression through various mechanisms, including promoting angiogenesis, extracellular matrix remodeling, and suppressing adaptive immunity.
Clinical or Translational Implications
The distinct shifts in macrophage subsets observed in colon tumor tissue hold significant clinical and translational implications:
- Prognostic Biomarkers: The relative proportions of macrophage subsets, particularly the elevated presence of M2B and M2C populations and the reduction of M2D within the tumor, could serve as prognostic biomarkers for colon cancer progression, recurrence, or response to therapy.
- Therapeutic Targets: Reprogramming or targeting specific macrophage subsets, particularly M2B and M2C, represents a promising therapeutic strategy.
- Strategies could involve inhibiting the recruitment of M2-polarized macrophages to the tumor, blocking their pro-tumorigenic functions, or re-educating them towards an anti-tumor M1-like phenotype.
- Given the inferred Colon Cancer context, approaches to counteract the immunosuppressive environment created by M2B/M2C macrophages could enhance the efficacy of existing immunotherapies.
- Stratification for Immunotherapy: Understanding the macrophage polarization landscape could help stratify patients for immune-checkpoint blockade therapies or other immunomodulatory treatments, identifying those who might benefit most from TAM-targeted interventions.
---
References:
- M1 Macrophages: For general information on M1 macrophage function: PubMed Search: M1 macrophage anti-tumor
- M2B Macrophages: For general information on M2B macrophage function: PubMed Search: M2B macrophage cancer
- M2C Macrophages: For general information on M2C macrophage function: PubMed Search: M2C macrophage immunosuppression tumor
- Tumor-Associated Macrophages (TAMs) in Colon Cancer: For general information on TAMs in cancer: PubMed Search: Tumor associated macrophages colon cancer
10. Differential Macrophage Subset Proportions in Colon Tumor Microenvironment
[Analysis Visualization Results]...
Analysis Overview
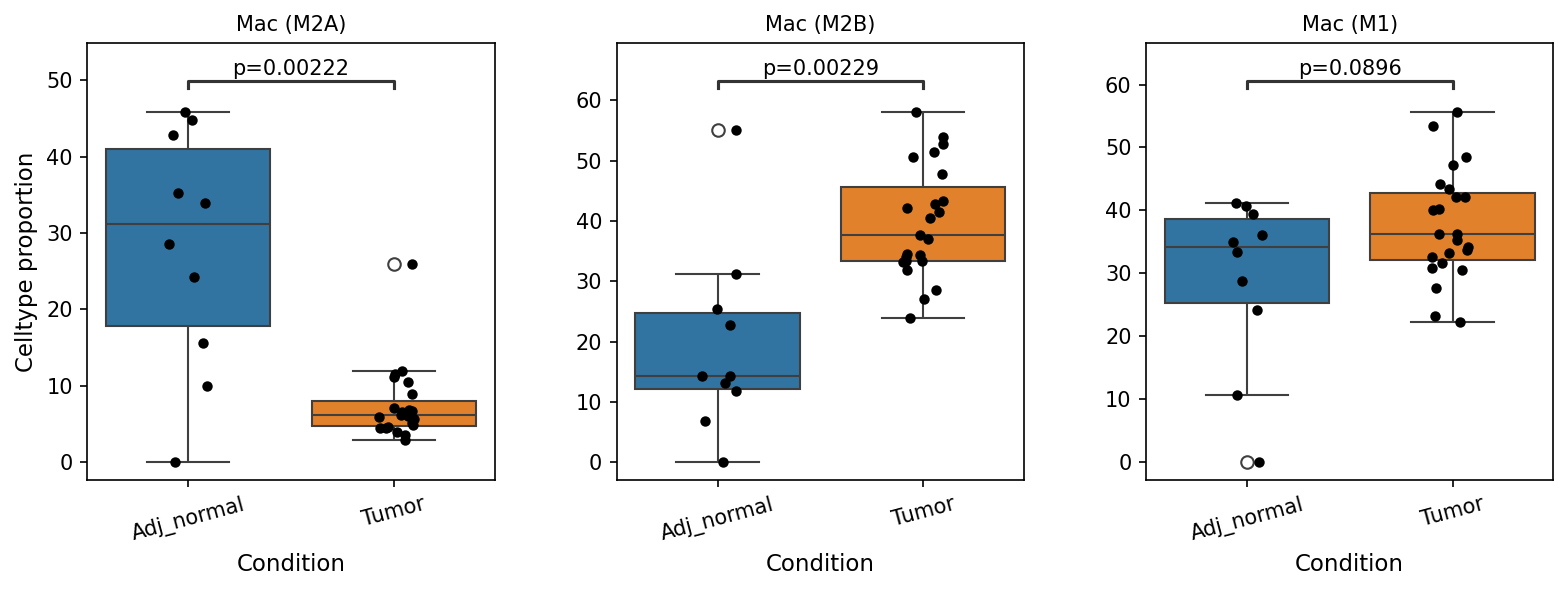
This analysis investigates the proportional changes of specific macrophage subsets—Mac (M2A), Mac (M2B), and Mac (M1)—between adjacent normal (Adj_normal) and tumor tissues in the human colon. The goal is to identify macrophage populations that are significantly altered in the tumor microenvironment, providing insights into their potential roles in colon cancer progression. Statistical significance was assessed with a p-value cutoff of 0.1, as indicated by the analysis parameters.
Visual Summary
The box plots illustrate the celltype proportion of three macrophage subsets across 'Adj_normal' and 'Tumor' conditions:
- Mac (M2A): The proportion of Mac (M2A) cells is significantly decreased in tumor tissue compared to adjacent normal tissue (p=0.00222). The median proportion drops notably from approximately 30-32% in 'Adj_normal' to about 7-8% in 'Tumor' samples.
- Mac (M2B): Conversely, the proportion of Mac (M2B) cells is significantly increased in tumor tissue compared to adjacent normal tissue (p=0.00229). The median proportion rises from around 12-15% in 'Adj_normal' to approximately 37-38% in 'Tumor' samples.
- Mac (M1): The proportion of Mac (M1) cells shows a trend towards a slight increase in tumor tissue compared to adjacent normal tissue, but this difference is not statistically significant at the p-value cutoff of 0.1 (p=0.0896). The median proportion remains relatively similar, around 35-37% for both conditions.
Biological Interpretation
Macrophages are highly plastic immune cells that can differentiate into various functional subsets, broadly classified as M1 (classically activated) and M2 (alternatively activated) phenotypes. These phenotypes play distinct and often opposing roles in the tumor microenvironment (TME).
- M1 Macrophages: Generally exhibit pro-inflammatory and anti-tumorigenic functions, characterized by the production of pro-inflammatory cytokines and enhanced antigen presentation, aimed at tumor cell destruction. The non-significant change in M1 macrophage proportion in colon tumors suggests that while the overall anti-tumorigenic capacity might not be severely compromised by a reduction in M1s, it also doesn't show a strong compensatory increase.
- M2 Macrophages (M2A, M2B, M2C, M2D): Are generally associated with immune suppression, tissue remodeling, angiogenesis, and promotion of tumor growth and metastasis.
- The significant decrease of Mac (M2A) in tumor tissue is an interesting observation. M2A macrophages are known to be involved in allergic responses and anti-parasitic immunity. Their reduction in the tumor context might indicate a shift away from these specific M2-like functions or a re-polarization towards other M2 subsets more directly involved in tumor support.
- The prominent increase of Mac (M2B) in the tumor microenvironment is highly relevant. Mac (M2B) macrophages are typically induced by immune complexes and Toll-like receptor (TLR) agonists and are known to produce both pro-inflammatory (e.g., IL-6, TNF-alpha) and anti-inflammatory (e.g., IL-10) cytokines. In cancer, M2B-like macrophages have been implicated in promoting tumor growth and metastasis, often through immunosuppressive mechanisms and supporting angiogenesis and tissue repair processes that benefit tumor progression [GeneCards: M2 Macrophage]. This observed increase suggests a significant shift towards a pro-tumorigenic macrophage phenotype within the colon tumor microenvironment.
The observed shifts indicate a re-programming of the macrophage landscape in colon cancer, favoring subsets that potentially contribute to tumor progression. This highlights the dynamic nature of immune cell populations within the TME and underscores the importance of specific macrophage subsets in cancer biology.
Clinical or Translational Implications
The distinct and significant changes in M2A and M2B macrophage populations in colon tumors could have several clinical implications:
- Biomarkers: The altered proportions of Mac (M2A) and especially Mac (M2B) could serve as potential diagnostic or prognostic biomarkers for colon cancer. Monitoring these subsets could provide insights into disease progression or response to therapy.
- Therapeutic Targets: The substantial enrichment of pro-tumorigenic Mac (M2B) populations within the tumor suggests that targeting these specific subsets, or modulating their polarization, could represent a promising therapeutic strategy for colon cancer. Strategies could involve inhibiting their recruitment, re-educating them towards an M1-like anti-tumor phenotype, or depleting them directly.
- Immune Microenvironment Modulation: Understanding these shifts contributes to a broader understanding of the immune landscape in colon cancer, which is crucial for developing immunotherapeutic approaches. Modulating the balance of macrophage subsets could enhance the efficacy of existing therapies or open avenues for novel immune-modulating treatments [PubMed: Cancer-associated macrophages and their role in the tumor microenvironment].
11. Ploidy Population Analysis of Intestinal Epithelial Cells in Colon Tumor and Adjacent Normal Tissues
[Analysis Visualization Results]...
Analysis Overview
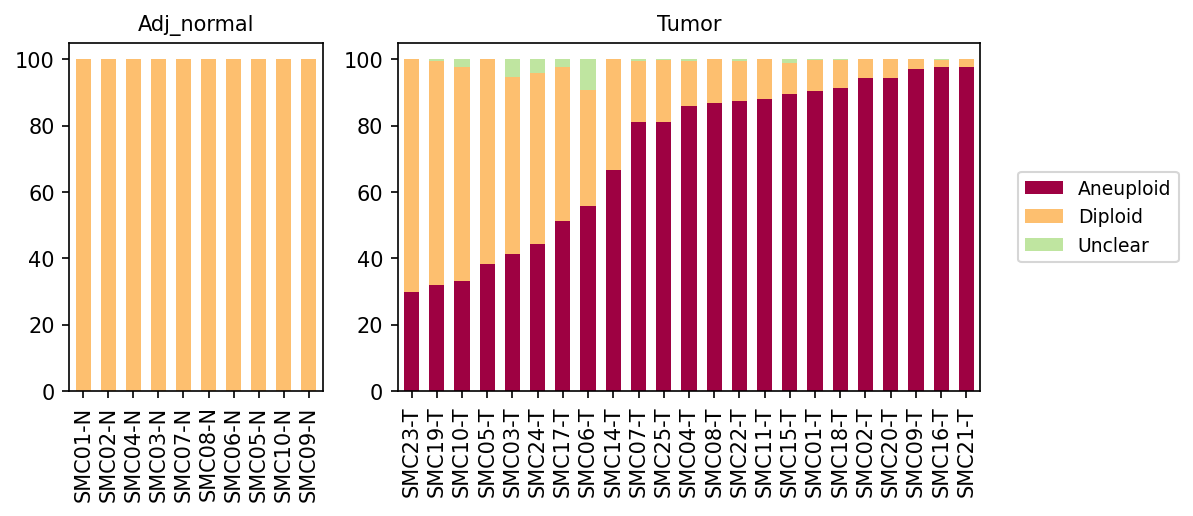
This analysis investigates the ploidy status (Aneuploid, Diploid, or Unclear) within the Intestinal Epithelial cell population across various patient samples, comparing Adjacent Normal (Adj_normal) and Tumor conditions. Ploidy status, reflecting the number of chromosome sets in a cell, is a critical indicator in cancer biology, as abnormal chromosome numbers (aneuploidy) are a hallmark of malignancy. The plot visualizes the proportional distribution of these ploidy states for Intestinal Epithelial cells in each sample.
Visual Summary
The stacked bar plots effectively illustrate the ploidy composition of Intestinal Epithelial cells per sample, stratified by tissue condition:
- Adjacent Normal (Adj_normal) Samples (Left Panel): In all adjacent normal samples (SMC01-N to SMC09-N), Intestinal Epithelial cells are predominantly, if not exclusively, Diploid (represented by the orange bars). The proportion of diploid cells consistently approaches 100%, with negligible to no observed Aneuploid (maroon) or Unclear (light green) populations. This indicates a stable, normal genomic state in the epithelial cells of non-malignant colon tissue.
- Tumor Samples (Right Panel): A stark contrast is observed in the tumor samples (SMC23-T to SMC21-T). All tumor samples show a significant presence of Aneuploid Intestinal Epithelial cells (maroon bars). The proportion of aneuploid cells varies considerably across individual tumor samples, ranging from approximately 30% (e.g., SMC23-T) to nearly 100% (e.g., SMC09-T, SMC16-T, SMC21-T). Conversely, the proportion of Diploid cells (orange bars) decreases in tumor samples, inversely correlating with the rise in aneuploidy. A minor "Unclear" population (light green) is also detectable in some tumor samples, particularly those with a lower overall aneuploid fraction. The samples in the tumor panel are implicitly ordered by increasing aneuploidy, highlighting the wide spectrum of genomic instability present within the tumor epithelial cells.
Biological Interpretation
The observed ploidy patterns strongly support the inferred context of Colon Cancer, particularly concerning the Intestinal Epithelial cells identified as the tumor-origin cell type:
- Normal Epithelial Homeostasis: The near-exclusive diploid state in Intestinal Epithelial cells from adjacent normal colon tissue is physiologically expected. Normal somatic cells maintain a diploid genome (two sets of chromosomes), and this genomic stability is crucial for proper tissue function and preventing disease development.
- Aneuploidy as a Cancer Hallmark: The prominent and variable presence of aneuploidy in Intestinal Epithelial cells within tumor samples is a classic hallmark of cancer GeneCards: Aneuploidy. Aneuploidy arises from chromosomal instability, a common feature of malignant cells where errors in chromosome segregation during cell division lead to an abnormal number of chromosomes. In the context of colon cancer, this indicates that the Intestinal Epithelial cells have undergone significant genomic alterations, driving oncogenic transformation and tumor progression.
- Tumor Heterogeneity: The substantial inter-sample variability in the proportion of aneuploid cells among different tumor samples underscores the high degree of heterogeneity characteristic of colon cancer. Some tumors are largely composed of aneuploid cells, suggesting a more advanced or aggressive genomic landscape, while others maintain a larger fraction of diploid cells, which could represent early-stage transformation, co-existing normal-like epithelial cells, or specific tumor subtypes. This heterogeneity is critical for understanding disease progression and treatment responses.
- Confirmation of Tumor Cell Identity: Given that 'Intestinal Epithelial cell' is designated as the 'Resolved tumor-origin cell type,' the finding that these specific cells exhibit high levels of aneuploidy in tumor conditions provides strong evidence that these are indeed the malignant cells driving tumor growth in colon cancer.
Clinical or Translational Implications
The ploidy analysis of Intestinal Epithelial cells in colon cancer has several clinical and translational implications:
- Diagnostic and Prognostic Value: The presence and degree of aneuploidy in Intestinal Epithelial cells can serve as a robust diagnostic marker for distinguishing malignant tissue from normal or benign lesions. Furthermore, the extent of aneuploidy is often correlated with tumor aggressiveness, risk of recurrence, and patient prognosis in various cancers, including colorectal cancer PubMed: Aneuploidy cancer prognosis. A higher proportion of aneuploid cells might indicate a more aggressive disease.
- Therapeutic Stratification: Understanding the aneuploid status of tumor cells could potentially guide therapeutic decisions. Tumors with high levels of chromosomal instability and aneuploidy might respond differently to chemotherapy or targeted therapies compared to genomically more stable tumors. Investigating mechanisms contributing to aneuploidy could identify novel therapeutic vulnerabilities PubMed: Aneuploidy therapy.
- Monitoring Tumor Evolution and Resistance: The heterogeneity in aneuploidy across samples suggests that monitoring ploidy status could be valuable for tracking tumor evolution, especially in cases of recurrence or resistance to treatment. Changes in aneuploid populations might reflect adaptation or clonal selection under therapeutic pressure.
12. Cell-Cell Interaction Patterns in Colon Tissue: Adjacant Normal vs. Tumor Conditions
[Analysis Visualization Results]...
Analysis Overview
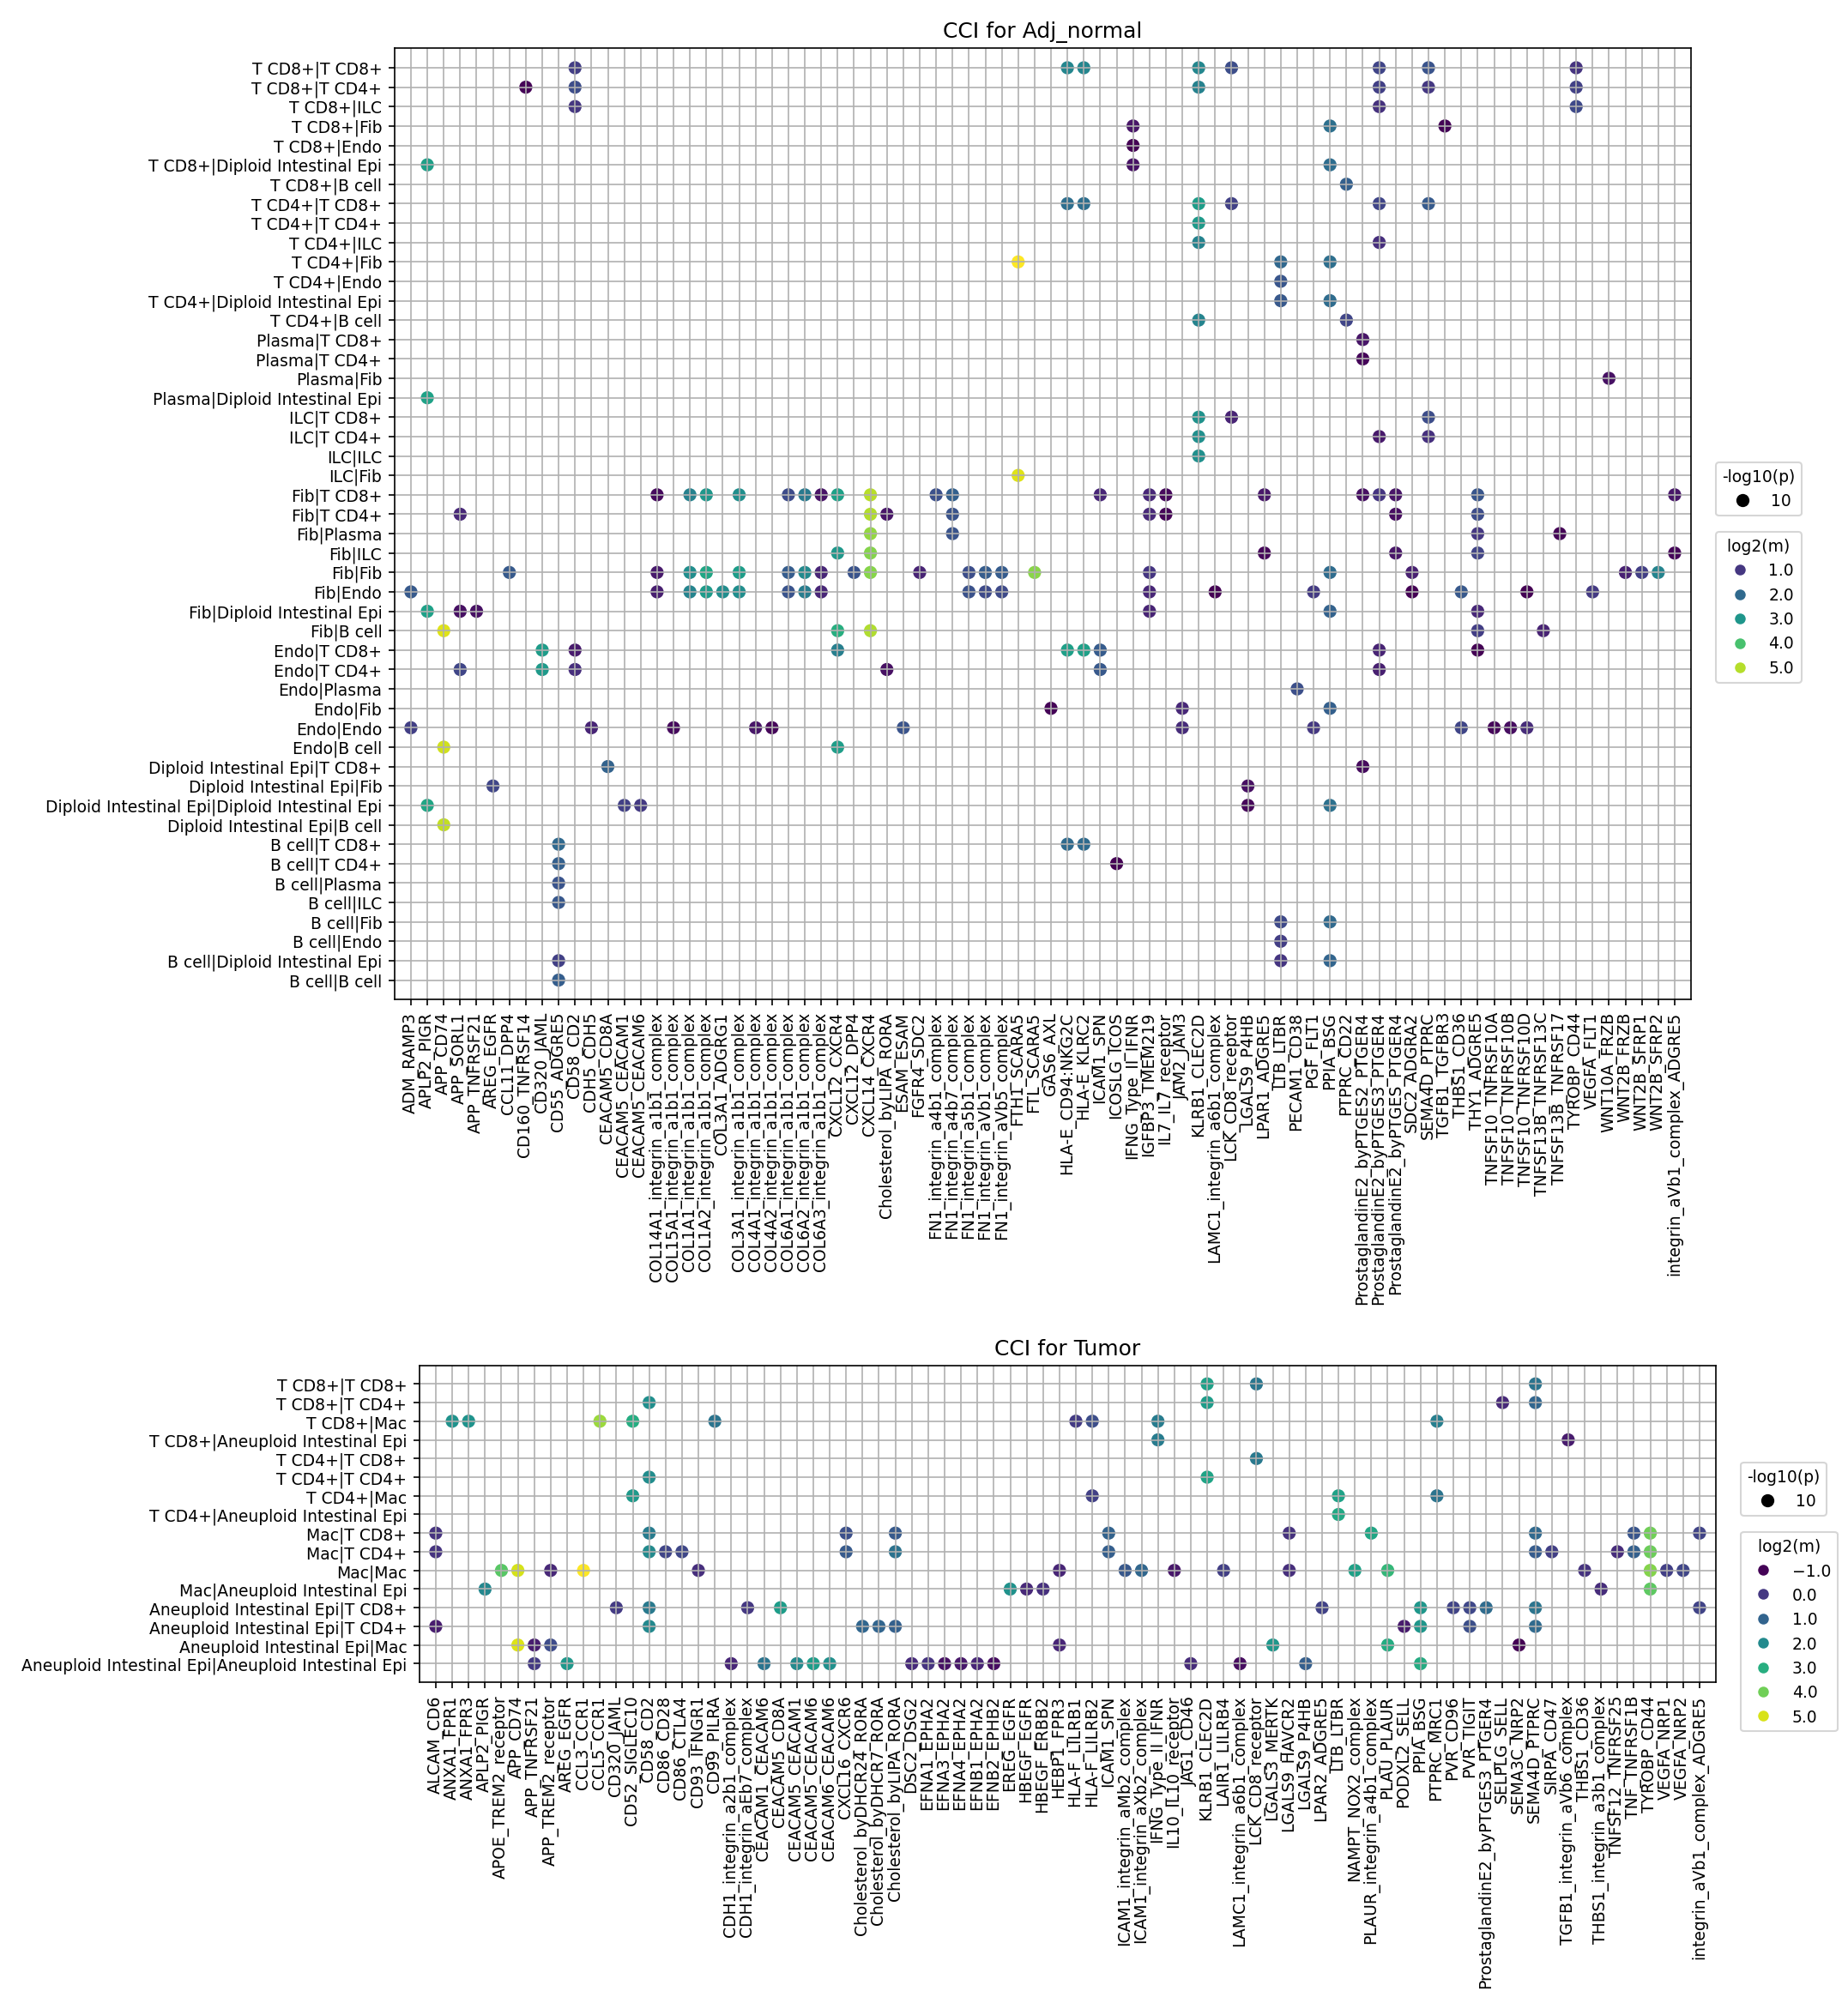
This analysis investigates cell-cell interaction (CCI) patterns using CellPhoneDB results, comparing adjacent normal colon tissue with tumor tissue. The focus is on key cell types: Intestinal Epithelial cells, Fibroblasts, Macrophages, CD4+ T cells, and CD8+ T cells. The visualization highlights the top 80 most significant ligand-receptor interactions for each condition, providing insights into how cellular communication networks differ in the tumor microenvironment (TME) compared to normal tissue. The interpretation prioritizes understanding ligand-receptor biology, potential therapeutic targets, and implications for experimental validation.
Visual Summary
The two dot plots display cell-cell interaction patterns for 'Adj_normal' and 'Tumor' conditions.
- X-axis: Represents specific ligand-receptor gene pairs mediating the interactions.
- Y-axis: Represents the interacting cell type pairs (e.g., 'Diploid Intestinal Epi|Fibroblast', 'Mac(Aneuploid Intestinal Epi)').
- Dot Size: Corresponds to the statistical significance of the interaction, represented as -log10(p-value). Larger dots indicate more significant interactions (smaller p-value, up to a cutoff of 0.05).
- Dot Color: Represents the mean expression level of the ligand-receptor pair across the interacting cell types, specifically log2(mean). Warmer colors (yellow/green) indicate higher mean expression, while cooler colors (blue/purple) indicate lower mean expression (with a cutoff of 0.01).
Observations:
- Adj_normal Condition: Characterized by prominent interactions involving Diploid Intestinal Epi, Fibroblast, T cell CD4+, and T cell CD8+. Many integrin complexes (e.g., FN1-integrin, COL6A1-integrin) are observed, particularly between fibroblasts and epithelial cells. Strong CDH1-CDH1 self-interaction within Diploid Intestinal Epi is evident. Immune interactions like CD2-CD58 and HLA-E-KLRC1 are also present.
- Tumor Condition: Shows a marked shift in interaction landscape. Aneuploid Intestinal Epi cells replace Diploid Intestinal Epi as the primary epithelial component. Interactions involving Macrophage cells become highly prevalent, engaging with Aneuploid Intestinal Epi and T cells. Key pro-tumorigenic and immunosuppressive interactions, such as SPP1-integrin_avb1_complex, VEGFA-VEGFR1/2, CXCL12-CXCR4, TNF-TNFRSF, and immune checkpoints like PDL1-PDCD1 and CD86-CTLA4, emerge or are significantly enhanced. The CDH1-CDH1 epithelial self-interaction is notably diminished or absent for Aneuploid Intestinal Epi cells.
Biological Interpretation
The observed cell-cell interaction patterns reveal critical biological differences between normal colon tissue and the colorectal tumor microenvironment, particularly emphasizing changes in epithelial cell properties, immune cell recruitment, and pro-tumorigenic signaling.
Epithelial Plasticity and Loss of Homeostasis
- In Adj_normal tissue, Diploid Intestinal Epi cells exhibit strong CDH1-CDH1 (E-cadherin) self-interactions, crucial for maintaining epithelial integrity and tight junctions. PubMed Search: E-cadherin colon epithelial integrity
- In the Tumor condition, this crucial epithelial adhesion is significantly reduced or absent for Aneuploid Intestinal Epi cells, consistent with epithelial-mesenchymal transition (EMT), a process linked to cancer invasion and metastasis.
Remodeling of the Immune Microenvironment
- The Tumor environment shows a strong increase in interactions involving Macrophage cells, particularly with Aneuploid Intestinal Epi and T cells. This suggests significant macrophage infiltration and their active participation in the tumor microenvironment.
- Crucially, interactions such as PDL1-PDCD1 (PD-1/PD-L1 axis) and CD86-CTLA4 are highly prominent in the tumor. These are well-established immune checkpoint pathways that lead to T cell exhaustion and immune evasion by cancer cells. PubMed Search: PD-1 PD-L1 CTLA-4 colon cancer immune evasion
- The presence of HLA-E-KLRC1 interactions in both conditions highlights the role of non-classical MHC-I molecules in immune regulation, potentially contributing to immune suppression in the tumor context.
Promotion of Tumor Growth and Angiogenesis
- SPP1-integrin_avb1_complex interactions are notably enriched and strong in the tumor, involving Macrophage and Aneuploid Intestinal Epi cells. Secreted Phosphoprotein 1 (SPP1, or Osteopontin) is known to promote tumor growth, angiogenesis, and immune evasion by polarizing macrophages towards pro-tumorigenic (M2-like) phenotypes. GeneCards: SPP1
- VEGFA-VEGFR1/VEGFR2 interactions are significant in the tumor, particularly between Macrophage and Aneuploid Intestinal Epi cells, directly indicating active pro-angiogenic signaling essential for tumor vascularization and growth. GeneCards: VEGFA
- CXCL12-CXCR4 interactions are also present in the tumor, involved in immune cell trafficking, tumor cell migration, and metastasis. PubMed Search: CXCL12 CXCR4 colon cancer metastasis
- Stromal Remodeling: While fibroblasts are less prominent in the tumor plot's y-axis categories than in the adjacent normal, the persistent presence of various integrin interactions (e.g., FN1-integrin, involving Aneuploid Intestinal Epi and Macrophage) suggests ongoing extracellular matrix (ECM) remodeling, which is critical for tumor progression and metastasis.
Clinical or Translational Implications
The distinct cell-cell interaction landscape in colon cancer compared to adjacent normal tissue offers several promising avenues for clinical translation and therapeutic development:
- Immunotherapy Targets: The prominent PDL1-PDCD1 and CD86-CTLA4 interactions in the tumor confirm the presence of active immune checkpoint pathways. This provides strong rationale for the continued use and potential optimization of existing anti-PD-1/PD-L1 and anti-CTLA-4 immunotherapies in colon cancer patients. Further investigation into specific cell type contributions to these interactions could refine patient selection or combination strategies.
Targeting the Tumor Microenvironment
- SPP1/Integrin Axis: The strong SPP1-integrin_avb1_complex interactions, particularly involving macrophages and tumor cells, represent a compelling therapeutic target. Inhibitors blocking SPP1 or its integrin receptors (e.g., $\alpha_V\beta_1$ integrin) could disrupt tumor growth, angiogenesis, and reverse immunosuppression within the TME.
- VEGF/VEGFR Pathway: The observed VEGFA-VEGFR interactions underscore the importance of angiogenesis in this colon cancer model. Anti-angiogenic therapies targeting the VEGF pathway are already in clinical use and these data reinforce their relevance.
- CXCL12/CXCR4 Axis: Targeting CXCL12-CXCR4 could modulate immune cell infiltration, reduce tumor cell migration, and potentially inhibit metastasis, making it another attractive therapeutic avenue.
- Biomarker Identification: The observed shifts in interaction patterns (e.g., loss of CDH1 self-interaction, emergence of SPP1, VEGFA, and immune checkpoint interactions) could serve as prognostic biomarkers for disease progression or indicators of response to specific therapies.
- Combination Therapies: Given the complexity of the TME, a multi-pronged therapeutic approach may be most effective. For instance, combining immune checkpoint inhibitors with agents that target the SPP1-integrin or VEGF-VEGFR axes could synergistically enhance anti-tumor responses and overcome resistance mechanisms.
- Experimental Validation: The specific ligand-receptor pairs identified as highly significant in the tumor context, such as SPP1-integrin_avb1_complex or PDL1-PDCD1 across specific cell types, serve as strong candidates for targeted experimental validation using in vitro co-culture models, organoids, or in vivo animal models to confirm their functional roles in colon cancer progression and therapeutic response.
13. Cell-Cell Interaction Analysis of Immune Checkpoint and Cell Cycle Pathways in Colon Cancer
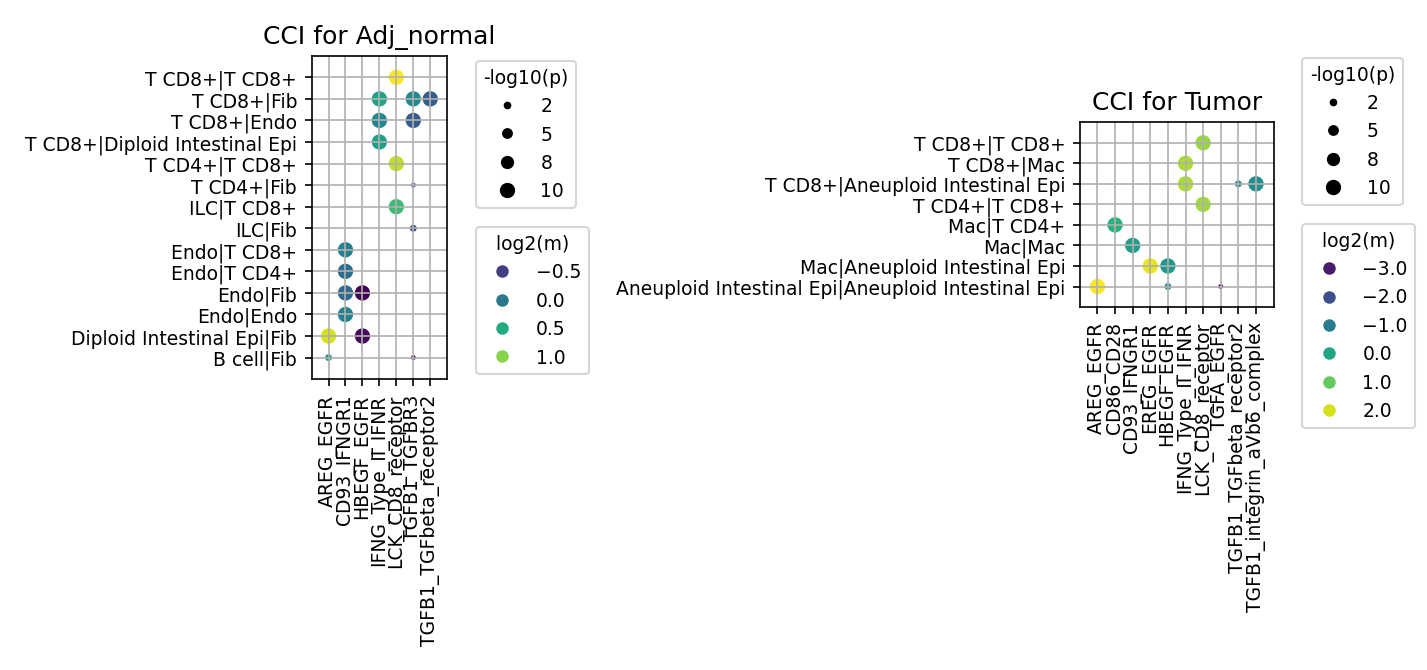
[Analysis Visualization Results]...
Analysis Overview
This analysis investigates cell-cell interactions (CCI) mediated by a selected panel of genes associated with immune checkpoint and cell cycle pathways in human colon tissue. The comparison focuses on interactions within "Adj_normal" (adjacent normal) tissue and "Tumor" tissue, utilizing single-cell RNA-seq data. The plot_cci_dots tool was used to visualize significant ligand-receptor interactions between various cell types, with interactions filtered for statistical significance (p-value < 0.05) and mean expression strength (mean > 0.01). The interpretation focuses on differences and prominent interactions across the two conditions to infer biological processes relevant to colon cancer.
Visual Summary
The provided dot plots illustrate significant cell-cell interactions for specific ligand-receptor pairs from the predefined list of immune checkpoint and cell cycle-related genes, comparing "Adj_normal" and "Tumor" conditions. Dot size indicates the statistical significance (-log10(p-value)), and dot color represents the interaction strength (log2(mean) expression).
CCI for Adj_normal
- Prominent Cell-Cell Pairs: Interactions involving T CD8+ cells (self-interactions and with Fibroblasts, Endothelial cells), T CD4+ cells (with Fibroblasts), Endothelial cells (self-interactions and with Fibroblasts, T cells), and Diploid Intestinal Epithelial cells with Fibroblasts are notably present.
- Key Ligand-Receptor Interactions: The strongest interactions (large, yellow/green dots) include AREG-EGFR and HBEGF-EGFR, particularly between Diploid Intestinal Epithelial cells and Fibroblasts, and within Endothelial cell populations. IFNG-Type II IFN receptor and LCK-CD8_receptor show strong self-interactions among T CD8+ cells. TGFB1-TGFBeta_receptor2 and TGFB1-TGFBR3 interactions are also observed.
CCI for Tumor
- Shift in Cell-Cell Pairs: The "Tumor" plot reveals a distinct set of prominent interacting cell types. "Aneuploid Intestinal Epithelial cells" (representing tumor cells) appear, showing strong autocrine/paracrine interactions. Macrophages (Mac) become highly active interactors with Aneuploid Intestinal Epithelial cells and T cells (CD4+ and CD8+). Fibroblast interactions, which were prominent in normal tissue, are not among the top interactions shown here.
Key Ligand-Receptor Interactions:
- EGFR Signaling: A highly active EGFR signaling axis is observed within Aneuploid Intestinal Epithelial cells, involving multiple ligands such as AREG-EGFR, HBEGF-EGFR, EREG-EGFR, and TGFA-EGFR. These interactions display very high mean expression values (log2(m) up to 2.0) and high significance.
- TGFB Signaling: Strong TGFB1-TGFBeta_receptor2 interactions are evident between T CD8+ cells and Aneuploid Intestinal Epithelial cells, and Macrophages and Aneuploid Intestinal Epithelial cells. The TGFB1-integrin_aVb6_complex also appears as a strong interaction, particularly between Macrophages and Aneuploid Intestinal Epithelial cells.
- Immune Co-stimulation: The CD86-CD28 interaction, a key co-stimulatory pathway, is prominently observed between Macrophages and T CD4+ cells, and between T CD4+ and T CD8+ cells in the tumor microenvironment.
- IFNG-Type II IFN receptor and LCK-CD8_receptor interactions persist among T CD8+ cells and between T CD8+ and Macrophages.
Biological Interpretation
The contrasting cell-cell interaction profiles between "Adj_normal" and "Tumor" conditions highlight significant shifts in communication networks, indicative of the evolving tumor microenvironment in colon cancer.
- Aberrant EGFR Signaling in Tumor Cells: The dramatic increase in autocrine and paracrine EGFR signaling within Aneuploid Intestinal Epithelial cells in the tumor is a hallmark of cancer progression. Multiple EGFR ligands (AREG, HBEGF, EREG, TGFA) are strongly engaged, driving proliferation, survival, and potentially metastasis of tumor cells. In contrast, in normal tissue, EGFR signaling appears more involved in maintaining epithelial-stromal homeostasis. GeneCards: EGFR
- TGFB Pathway Remodeling the Tumor Microenvironment: TGFB1 signaling, notably through TGFBeta_receptor2 and integrin_aVb6_complex, shows strong interactions involving Aneuploid Intestinal Epithelial cells, T CD8+ cells, and Macrophages in the tumor. TGFB is a pleiotropic cytokine; in advanced cancer, it often promotes immunosuppression, tumor growth, invasion, and metastasis. Its strong presence in interactions between tumor cells and immune cells suggests a role in immune evasion or shaping the immunosuppressive tumor microenvironment. PubMed Search: TGFB cancer immunotherapy
- Dynamic Immune Cell Interactions:
- Macrophages as Key Players: Macrophages emerge as central interacting partners in the tumor microenvironment, engaging with both tumor cells (Aneuploid Intestinal Epithelial cells) and T cells. This underscores their critical role in the tumor context, potentially acting as tumor-associated macrophages (TAMs) that can promote or suppress anti-tumor immunity depending on their polarization.
- T Cell Co-stimulation: The strong CD86-CD28 interaction between Macrophages and T cells (CD4+, CD8+) in the tumor indicates active antigen presentation and co-stimulation within the tumor microenvironment. While crucial for T cell activation, this pathway's ultimate effect on anti-tumor immunity depends on the balance with co-inhibitory signals and the overall inflammatory context. GeneCards: CD28
- IFN-gamma Signaling: Persistent IFNG signaling, particularly within T CD8+ cells and with Macrophages in both conditions, suggests an ongoing immune response. Interferon-gamma is a potent anti-tumor cytokine, but its efficacy can be dampened by immunosuppressive factors in the tumor microenvironment.
- Shift in Stromal Interactions: The reduced prominence of Fibroblast interactions among the top pairs in the tumor compared to normal tissue suggests a potential shift in the critical stromal components or their interacting pathways in the most active tumor environment. Other stromal cells or different pathways might become more dominant in the tumor context, or the epithelial-fibroblast interactions shift to different ligand-receptor pairs not captured here.
Clinical or Translational Implications
The identified shifts in cell-cell interactions within the colon tumor microenvironment offer several potential avenues for therapeutic intervention and biomarker development:
- Targeting EGFR in Colon Cancer: The robust activation of EGFR signaling in Aneuploid Intestinal Epithelial cells by multiple ligands reinforces EGFR as a crucial therapeutic target in colon cancer. Existing anti-EGFR therapies (e.g., cetuximab, panitumumab) could be highly relevant, and investigating the specific ligands involved might help predict patient response or resistance mechanisms.
- Modulating TGFB Signaling: Given the strong TGFB1 interactions in the tumor microenvironment, targeting TGFB signaling could be a strategy to overcome immunosuppression and inhibit tumor progression. Strategies include TGFB receptor kinase inhibitors or neutralizing antibodies against TGFB1.
Exploiting Immune Cell Interactions:
- Macrophages: The central role of macrophages in the tumor suggests that therapies targeting TAMs or reprogramming their phenotype (e.g., from M2-like to M1-like) could enhance anti-tumor immunity.
- T Cell Co-stimulation: While CD86-CD28 is a co-stimulatory pathway, understanding its precise role in the context of other immune checkpoints (e.g., PD-1/PD-L1, CTLA-4, which are included in the overall gene list but not prominent here) is crucial. Modulating the balance of co-stimulatory and co-inhibitory signals could be key to effective immunotherapy.
- Biomarker Discovery: The specific ligand-receptor pairs and cellular interactions identified as differentially active in the tumor could serve as potential biomarkers for disease progression, prognosis, or response to targeted therapies. For example, high expression of EGFR ligands within tumor cells might predict sensitivity to anti-EGFR agents.
14. Condition-Specific Cell-Cell Interaction Patterns in Colon Cancer
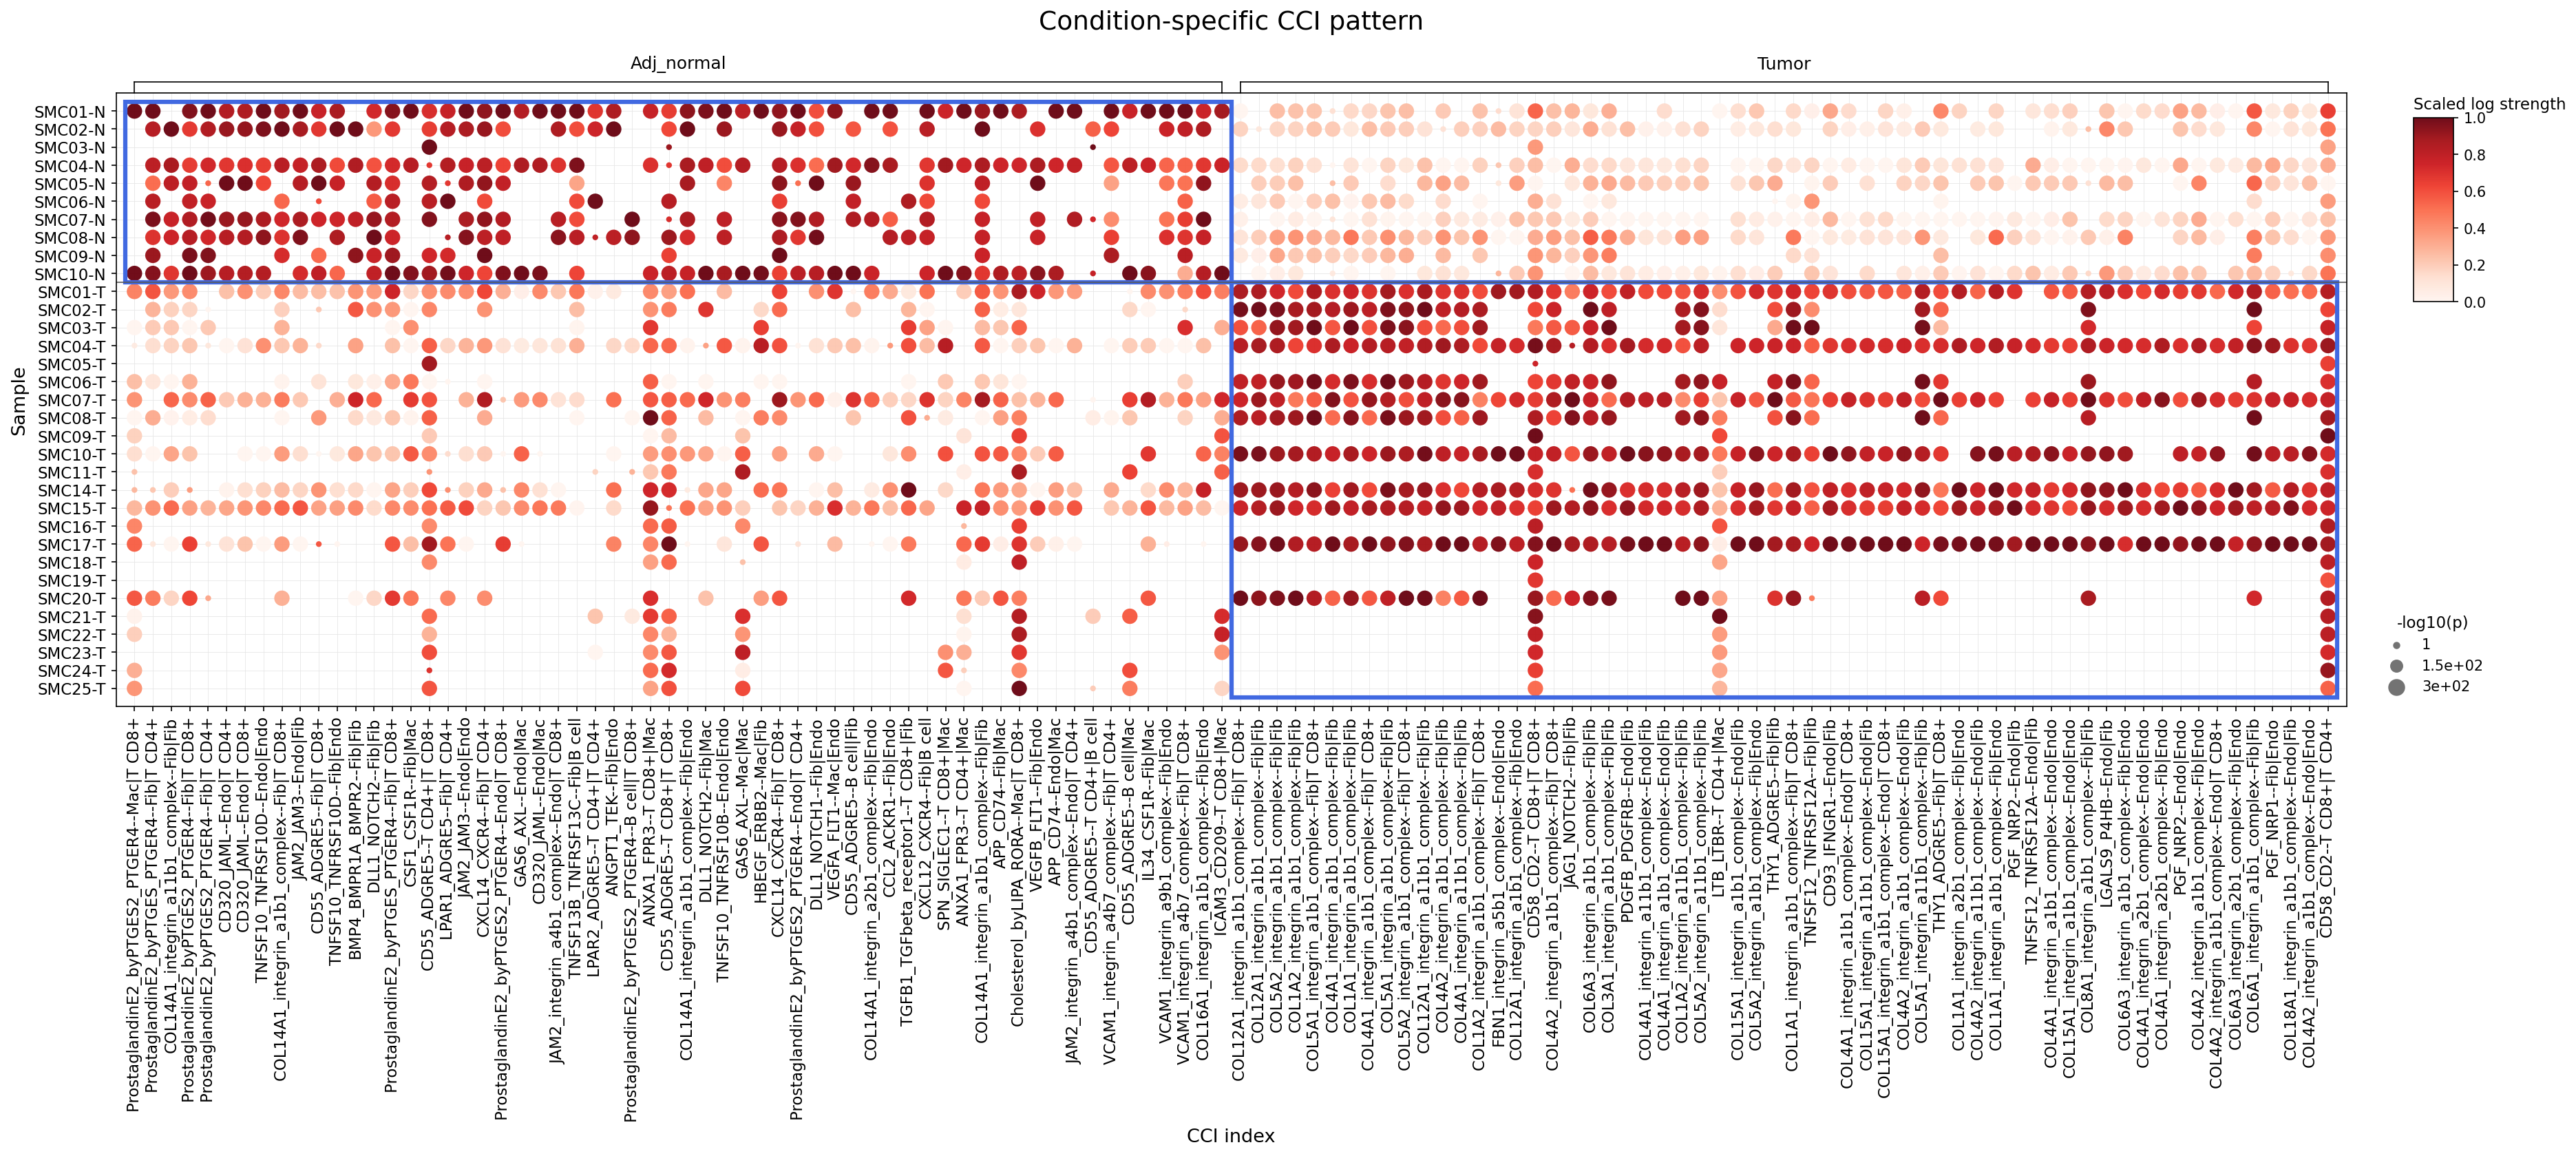
[Analysis Visualization Results]...
Analysis Overview
This analysis investigates cell-cell interaction (CCI) patterns that significantly differ between 'Adj_normal' and 'Tumor' conditions in human colon tissue. The focus is on major immune and stromal cell types, including B cells, Myeloid cells (Macrophages, Dendritic cells), T cells (CD4+, CD8+), Mast cells, Stromal cells (Fibroblasts, Smooth muscle cells, Enteric glial cells), and Endothelial cells. The results are visualized as a dot plot, where dot color intensity indicates interaction strength (scaled log strength) and dot size reflects statistical significance (-log10(p-value)).
Visual Summary
The dot plot clearly segregates samples by condition, with 'Adj_normal' samples predominantly occupying the top section and 'Tumor' samples the bottom section. This indicates distinct and condition-specific CCI landscapes.
Key observations:
- Adj_normal Condition: Characterized by a strong presence of interactions involving COL14A1_integrin_a1b1_complex between Fibroblasts, ProstaglandinE2_byPTGES2_PTGER4 signaling from Macrophages to CD8+ T cells, and cell adhesion molecules like JAM2_JAM3 and TNFSF10_TNFRSF10D within Endothelial cells. These interactions tend to be robust across most normal samples, indicated by consistently large, dark dots.
- Tumor Condition: Displays a notably higher number and diversity of strong, significant interactions compared to the adjacent normal tissue. A predominant theme is the extensive remodeling of the extracellular matrix (ECM) and enhanced cell adhesion, evidenced by numerous strong Collagen-Integrin interactions involving Fibroblasts with other Fibroblasts, Endothelial cells, CD8+ T cells, and Macrophages. Interactions such as SPP1_integrin_a1b1_complex, CXCL12_CXCR4, CD55_ADGRE5, and VEGFA_FLT1 also show markedly increased strength and prevalence in tumor samples. ProstaglandinE2 signaling from various stromal cells to T cells appears to be more widespread and intensified in the tumor microenvironment.
- Differential Activity: Many interactions prominent in the 'Adj_normal' samples are significantly diminished or absent in 'Tumor' samples (e.g., COL14A1-integrin_a1b1 in Fibroblasts). Conversely, a vast array of new or highly upregulated interactions emerges in the 'Tumor' context. The overall pattern suggests a shift from tissue maintenance and baseline immune regulation in normal tissue to pro-tumorigenic ECM remodeling, immune evasion, and angiogenesis in colon cancer.
Biological Interpretation
The distinct CCI profiles between adjacent normal and tumor colon tissues highlight fundamental changes in the tumor microenvironment (TME) that drive cancer progression.
Interactions Predominant in 'Adj_normal' Colon Tissue:
- COL14A1_integrin_a1b1_complex--Fib|Fib
- Signaling Pathways & Mechanisms: Collagen XIV (COL14A1) is a fibril-associated collagen with interrupted triple helices (FACIT), which associates with fibrillar collagens (e.g., type I) and modulates extracellular matrix (ECM) organization. Integrin α1β1 is an ECM receptor that binds collagens. In adjacent normal tissue, this interaction between fibroblasts likely contributes to the maintenance of the tissue's structural integrity and healthy ECM composition, crucial for normal cellular function and tissue homeostasis.
- Therapeutic Target Potential: Low as a direct cancer target, but its observed decrease in tumor tissue indicates a disruption of normal ECM architecture.
- Relevant Therapeutic Agents: No direct agents, but understanding this shift provides context for ECM-modulating therapies.
- ProstaglandinE2_byPTGES2_PTGER4--Mac|T CD8+
- Signaling Pathways & Mechanisms: Prostaglandin E2 (PGE2), produced by macrophages (via PTGES2, prostaglandin E synthase 2), binds to its receptor PTGER4 (EP4 receptor) on CD8+ T cells. PGE2 is a potent lipid mediator involved in inflammation and immune modulation. In normal conditions, this interaction may play a role in resolving inflammation or maintaining immune tolerance, possibly dampening excessive immune responses.
- Therapeutic Target Potential: Moderate. While observed in normal tissue, an imbalance or shift in its role can contribute to disease.
- Relevant Therapeutic Agents: COX-2 inhibitors (e.g., celecoxib) reduce PGE2 synthesis. PTGER4 antagonists could block this signaling. [PubMed search: "PGE2 immune regulation"]
- JAM2_JAM3--Endo|Endo
- Signaling Pathways & Mechanisms: Junctional adhesion molecules (JAMs), specifically JAM2 and JAM3, are immunoglobulin superfamily proteins that form tight junctions between endothelial cells. This interaction maintains the integrity of the vascular barrier, regulating paracellular permeability and leukocyte transmigration in healthy blood vessels.
- Therapeutic Target Potential: Low as a primary cancer target. Its disruption in tumor tissue could lead to leaky vasculature, a hallmark of tumor angiogenesis.
- Relevant Therapeutic Agents: No direct therapeutic agents targeting JAM2/JAM3 in cancer.
Interactions Predominant in 'Tumor' Colon Tissue:
- Extensive Collagen-Integrin Interactions (e.g., COL1A1_integrin_a1b1_complex--Fib|T CD8+, COL4A1_integrin_a1b1_complex--Fib|Fib, COL1A1_integrin_a2b1_complex--Endo|Endo)
- Signaling Pathways & Mechanisms: The prominent increase in diverse collagen-integrin interactions (e.g., involving COL1A1, COL4A1, COL5A1, COL12A1) across multiple cell types (Fibroblasts, Endothelial cells, T cells CD8+, Macrophages) signifies profound extracellular matrix (ECM) remodeling. Integrins are crucial for cell adhesion, migration, proliferation, and survival. In the tumor microenvironment (TME), altered collagen deposition and increased ECM stiffness promote tumor growth, invasion, and metastasis. These interactions facilitate cross-talk between cancer-associated fibroblasts, endothelial cells (angiogenesis), and immune cells (modulating their activity and trafficking).
- Therapeutic Target Potential: High. Integrins are attractive targets given their role in tumor invasion, metastasis, and angiogenesis. Modulating ECM components can also impact tumor progression.
- Relevant Therapeutic Agents: Integrin inhibitors (e.g., cilengitide, though targeting different integrin subtypes), matrix metalloproteinase (MMP) inhibitors to degrade ECM, and lysyl oxidase (LOX) inhibitors to reduce ECM stiffness are under investigation. [GeneCards: ITGA1 (Integrin Alpha 1), ITGB1 (Integrin Beta 1)]
- ProstaglandinE2_byPTGES2_PTGER4--Fib|T CD8+ / Mac|T CD8+ / Endo|T CD8+
- Signaling Pathways & Mechanisms: Similar to normal tissue, PGE2 acts on CD8+ T cells via PTGER4. However, in the tumor, the sources expand to include fibroblasts and endothelial cells, and the signaling appears intensified and more widespread. Elevated PGE2 in the TME is profoundly immunosuppressive, inhibiting CD8+ T cell proliferation, cytokine production, and cytotoxic function, thereby facilitating immune evasion.
- Therapeutic Target Potential: High. Inhibiting PGE2 synthesis or its signaling is a promising strategy to enhance anti-tumor immunity and improve the efficacy of immunotherapies.
- Relevant Therapeutic Agents: COX-2 inhibitors (e.g., celecoxib) and PTGER4 antagonists. [PubMed search: "PGE2 T cell cancer immunotherapy"]
- SPP1_integrin_a1b1_complex--Fib|Fib
- Signaling Pathways & Mechanisms: Secreted Phosphoprotein 1 (SPP1), also known as Osteopontin, is a pleiotropic protein involved in cell adhesion, migration, and immune responses. Its interaction with integrin α1β1 on fibroblasts suggests an enhanced role in ECM remodeling and fibroblast activation in the TME. SPP1 is frequently overexpressed in various cancers, promoting tumor growth, invasion, and metastasis, and can modulate the immune microenvironment towards an immunosuppressive phenotype.
- Therapeutic Target Potential: High. SPP1 is a recognized pro-tumorigenic factor and a potential therapeutic target.
- Relevant Therapeutic Agents: Anti-SPP1 antibodies are under preclinical and clinical investigation. Integrin inhibitors that specifically block SPP1 binding could also be relevant. [GeneCards: SPP1 (Secreted Phosphoprotein 1)]
- CXCL12_CXCR4--Fib|T CD8+ (and other cell types like Fib|T CD4+, Fib|B cell, Endo|Endo)
- Signaling Pathways & Mechanisms: The CXCL12-CXCR4 chemokine axis is critical for cell trafficking. In the TME, this axis is often dysregulated, promoting tumor cell proliferation, survival, angiogenesis, and metastasis. It also plays a significant role in recruiting immune cells, including T cells and B cells, to specific niches within the tumor where they might become dysfunctional or pro-tumorigenic. The broad involvement of fibroblasts, T cells, B cells, and endothelial cells highlights its central role in coordinating the complex cellular interactions within the TME.
- Therapeutic Target Potential: High. CXCR4 antagonists are clinically validated for other indications and are actively investigated as anti-cancer agents to reduce tumor growth, metastasis, and improve immune responses.
- Relevant Therapeutic Agents: CXCR4 antagonists (e.g., Plerixafor/AMD3100). [PubMed search: "CXCL12 CXCR4 cancer immunotherapy"]
- VEGFA_FLT1--Fib|Endo
- Signaling Pathways & Mechanisms: Vascular Endothelial Growth Factor A (VEGFA) is a primary driver of angiogenesis, the formation of new blood vessels, which is essential for tumor growth and metastasis. Fibroblasts in the TME can produce VEGFA, which then acts on FLT1 (VEGFR1) on endothelial cells. This interaction fosters communication between stromal and endothelial cells to support uncontrolled blood vessel formation that feeds the tumor.
- Therapeutic Target Potential: High. VEGF/VEGFR signaling is a well-established and clinically validated target in cancer therapy.
- Relevant Therapeutic Agents: Anti-VEGFA antibodies (e.g., Bevacizumab) and multi-kinase inhibitors targeting VEGFR (e.g., Sunitinib, Sorafenib). [PubMed search: "VEGFA cancer angiogenesis"]
Clinical or Translational Implications
The identified condition-specific cell-cell interactions offer valuable insights into the pathobiology of colon cancer and present several promising avenues for therapeutic intervention.
- Targeting ECM Remodeling: The extensive upregulation of various collagen-integrin interactions in the tumor microenvironment suggests that therapies aimed at normalizing the ECM, reducing its stiffness, or blocking specific integrin pathways could inhibit tumor growth, invasion, and metastasis. This could involve direct integrin inhibitors or agents that modulate ECM-modifying enzymes like MMPs or LOX.
- Overcoming Immunosuppression: The prominent and diversified PGE2 signaling in the tumor microenvironment, particularly its interaction with CD8+ T cells, indicates a key mechanism of immune evasion. Targeting the PGE2 pathway, either through COX-2 inhibitors or PTGER4 antagonists, could re-invigorate anti-tumor T cell responses and potentially enhance the efficacy of existing immunotherapies (e.g., checkpoint blockade).
- Disrupting Chemokine Axes: The robust CXCL12-CXCR4 signaling across multiple stromal and immune cell types in the tumor highlights its role in sustaining the pro-tumorigenic TME. CXCR4 antagonists could impede tumor cell dissemination, reduce immune-suppressive cell recruitment, and facilitate the infiltration of effector immune cells.
- Inhibiting Angiogenesis: The strong VEGFA-FLT1 interaction between fibroblasts and endothelial cells confirms active angiogenesis. Anti-angiogenic therapies targeting the VEGF/VEGFR pathway are already part of standard care for some cancers and remain a critical strategy to starve tumors of nutrients and oxygen.
- Novel Targets: Interactions involving SPP1 and ADGRE5 present emerging therapeutic opportunities. Inhibiting SPP1, a known oncogenic factor, could disrupt tumor progression and metastasis. Modulating the CD55-ADGRE5 axis might interfere with tumor growth, angiogenesis, and immune regulation.
Overall, these findings underscore the complex interplay between immune and stromal cells in shaping the colon cancer microenvironment. A multi-pronged therapeutic approach, combining established therapies with novel agents targeting these specific cell-cell interaction pathways, holds significant promise for more effective colon cancer treatment.
15. Intestinal Epithelial Cell Surfaceome Markers in Colon Cancer
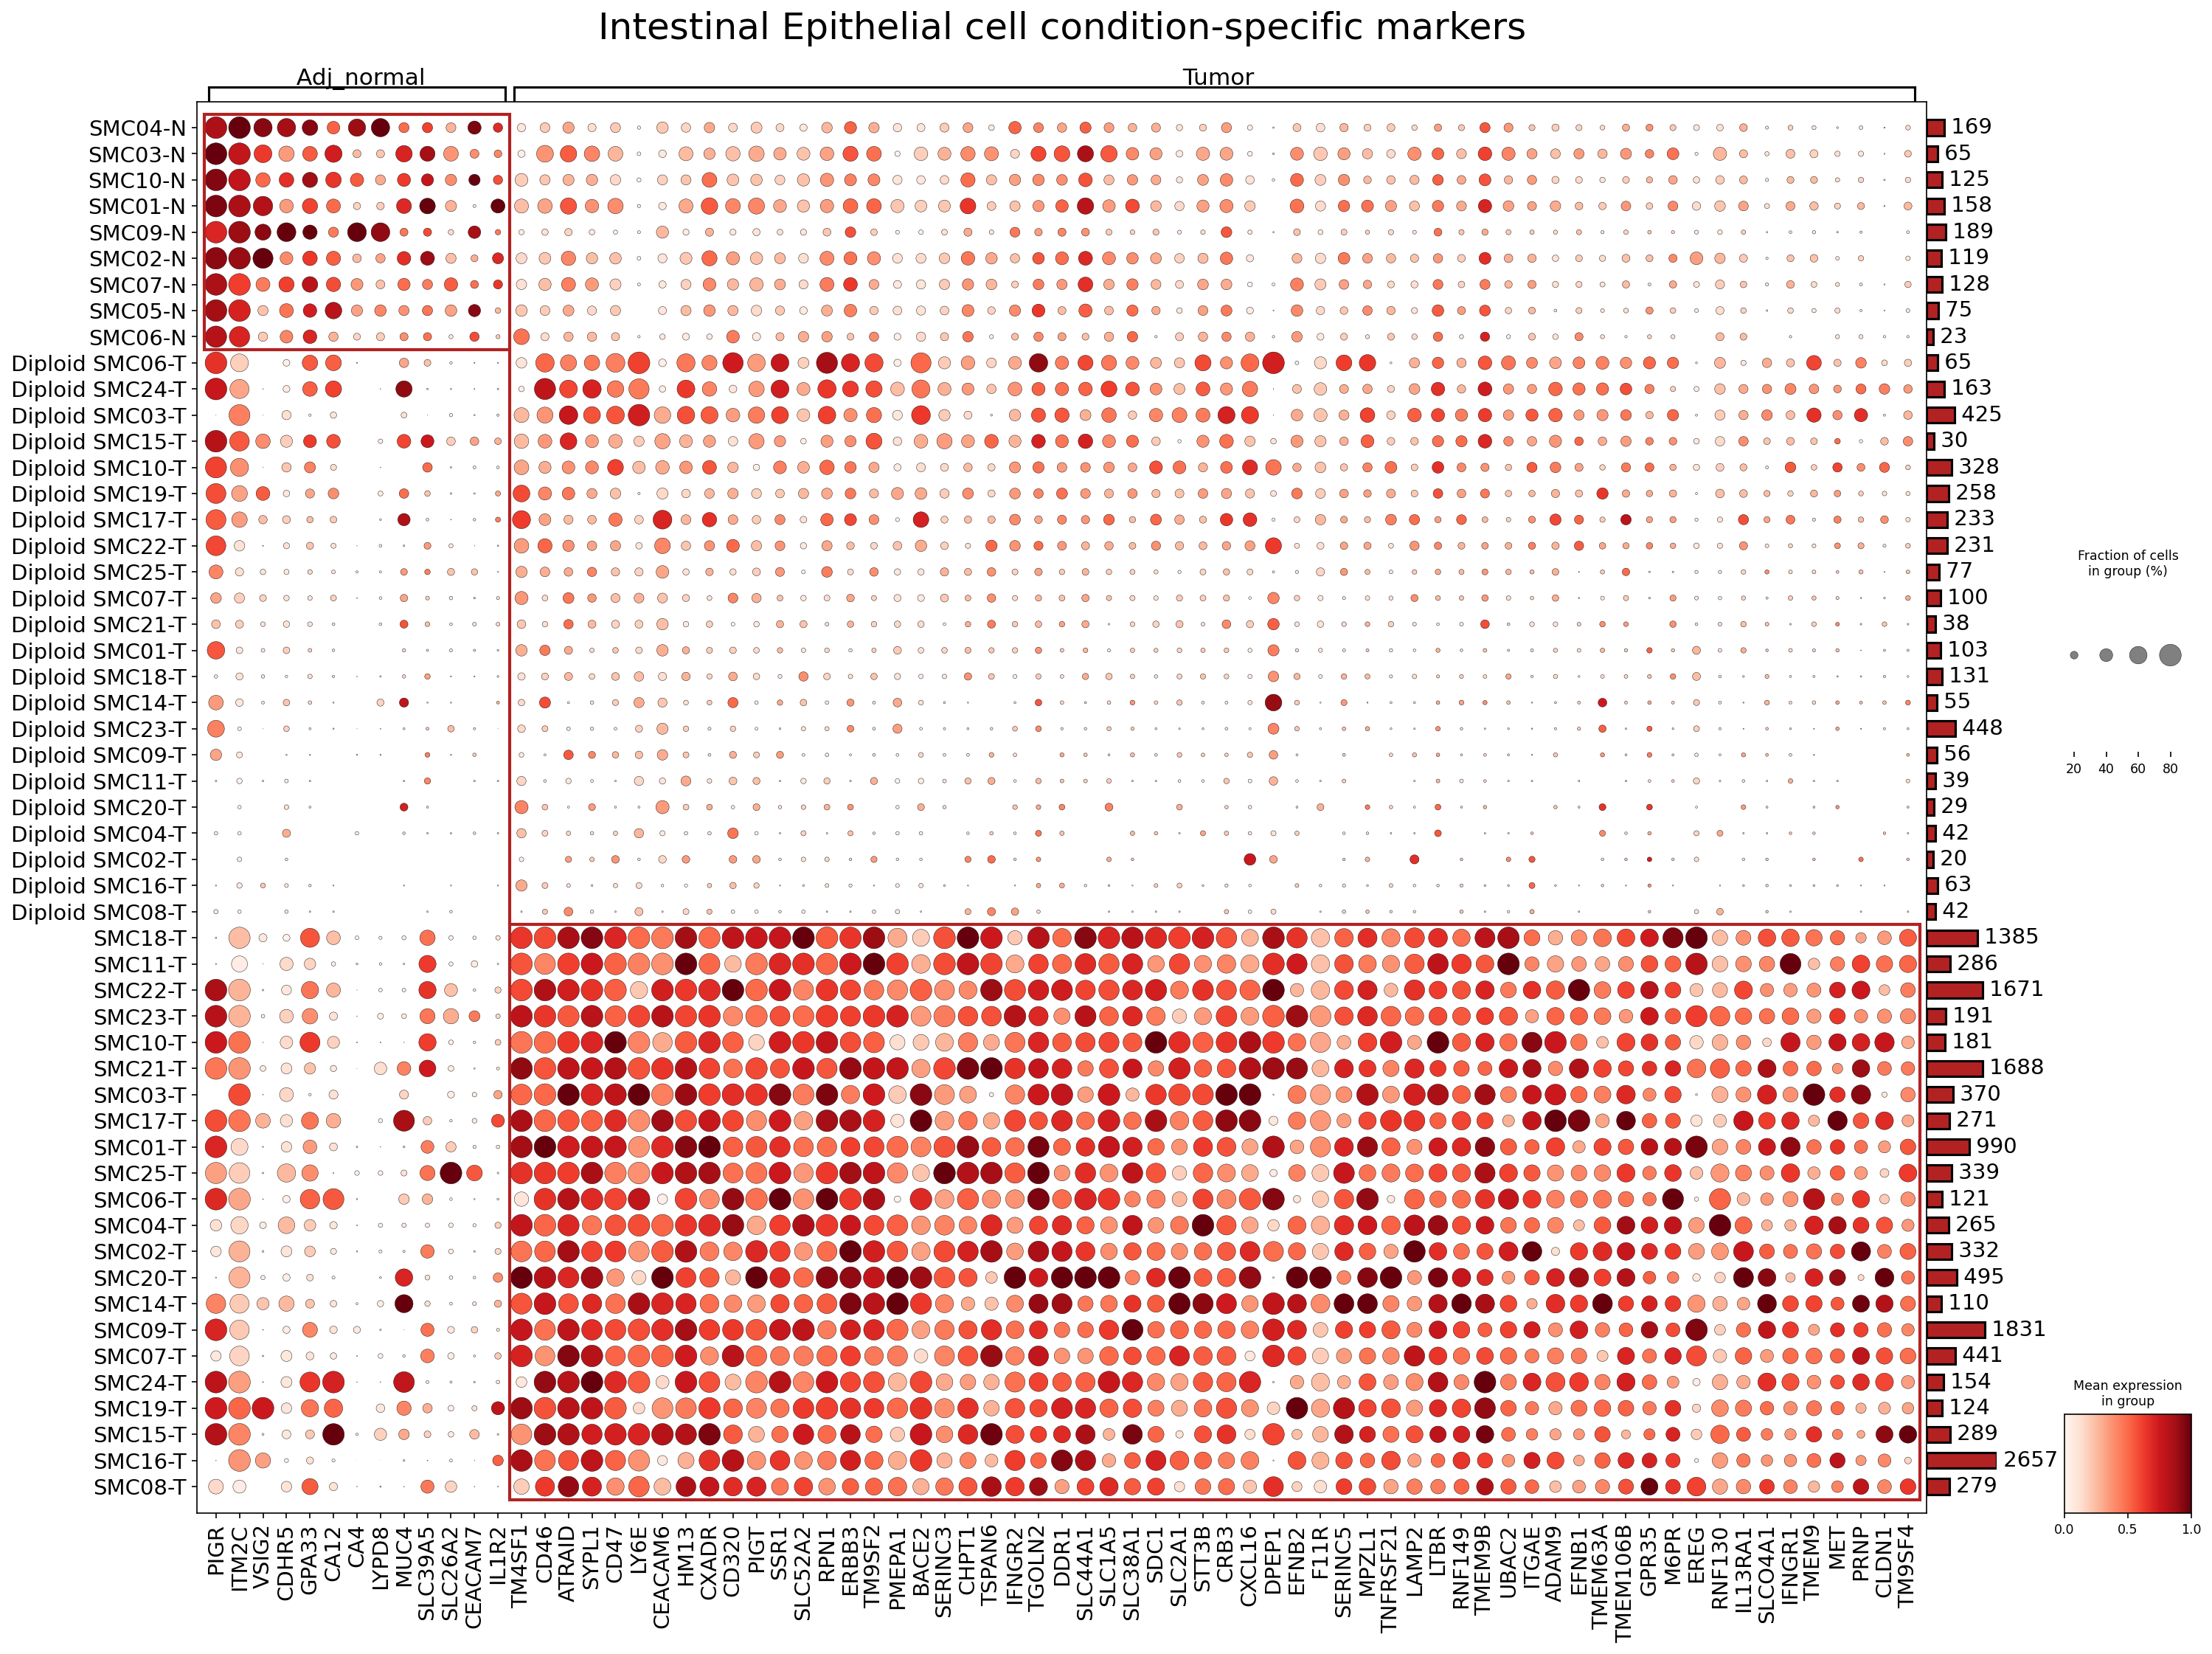
[Analysis Visualization Results]...
Analysis Overview
This analysis identifies and visualizes the expression patterns of surfaceome markers in Intestinal Epithelial cells across 'Adj_normal' and 'Tumor' conditions from single-cell RNA-seq data. The goal is to highlight condition-specific markers, differentiate between established and potential therapeutic targets, and provide biological context for each. The dot plot displays mean expression levels and the fraction of cells expressing each marker for different patient samples within the specified conditions.
Visual Summary
The dot plot, titled "Intestinal Epithelial cell condition-specific markers," illustrates gene expression and prevalence across various patient samples categorized by 'Adj_normal' and 'Tumor' conditions.
- Overall Pattern: There is a clear distinction in surfaceome marker expression between 'Adj_normal' intestinal epithelial cells and those from 'Tumor' samples.
- Adj_normal Samples (SMCxx-N): This group, located in the upper-left quadrant, shows relatively high expression of a specific set of markers, including PIGR, VSIG2, ITM2C, CDH5, and GPR35. The expression of many other markers that are prominent in tumor cells is generally low or absent in normal cells.
- Tumor Samples: These are further subdivided into 'Diploid SMCxx-T' and 'SMCxx-T' (likely representing aneuploid or highly transformed tumor cells).
- Diploid SMCxx-T Samples: Located in the middle section, these samples, despite being from tumor tissue, largely resemble the 'Adj_normal' samples in their marker expression profile. They show low expression of most tumor-associated markers, suggesting they might represent residual normal epithelial cells within the tumor microenvironment or less transformed tumor cell populations.
- SMCxx-T Samples: Located in the bottom section, these samples exhibit a striking upregulation of a broad panel of surfaceome markers. Genes like CEACAM5, CD47, SPP1, MUC13, CD24, LY6E, CEACAM6, ERBB3, MET, CLDN1, SDC1, ITGAE, and various SLC transporters (e.g., SLC1A5, SLC38A1) show high mean expression (dark red dots) and high prevalence (large dot size) across nearly all of these tumor samples. This robust and widespread overexpression in the SMCxx-T group points to their potential as diagnostic and therapeutic targets.
Dot Size and Color
- Dot Size: Corresponds to the fraction of cells in each group (sample) that express the marker. Larger dots indicate a higher percentage of expressing cells.
- Dot Color Intensity (Red Scale): Represents the mean expression level of the marker within that group. Darker red indicates higher mean expression.
- Cell Counts: The bars on the right indicate the number of Intestinal Epithelial cells contributing to each sample group, showing a wide range (e.g., from 20 to over 2600 cells per sample).
Biological Interpretation
The differential expression of surfaceome markers highlights critical biological changes occurring in Intestinal Epithelial cells during colon cancer progression. These markers offer insights into altered cellular functions such as adhesion, signaling, metabolism, and immune evasion, and many represent attractive targets for therapeutic intervention.
Established Therapeutic Targets
- CEACAM5 (Carcinoembryonic Antigen-related Cell Adhesion Molecule 5)
- Signaling Pathways/Mechanisms: CEACAM5 is a cell adhesion molecule and a member of the immunoglobulin superfamily. It is involved in cell-cell adhesion, cell proliferation, invasion, and anti-apoptotic signaling. Overexpression of CEACAM5 is a common feature in many adenocarcinomas, including colorectal cancer, and is associated with tumor progression and metastasis. It can interact with extracellular matrix components and other CEACAM family members, influencing cell growth and survival pathways.
- Relevant Therapeutic Agents: CEACAM5 is a well-established target for antibody-drug conjugates (ADCs) and other immunotherapies in various cancers. Examples include clinical trials testing anti-CEACAM5 antibodies and ADCs.
- Supporting Evidence: Elevated CEACAM5 expression is a prognostic biomarker and a target for therapies in gastrointestinal cancers. PubMed search: CEACAM5 colon cancer therapeutics
- CD47
- Signaling Pathways/Mechanisms: CD47 is a transmembrane glycoprotein that acts as a "don't eat me" signal by binding to SIRPα (Signal Regulatory Protein Alpha) on phagocytic cells (e.g., macrophages, dendritic cells). Its overexpression in cancer cells allows them to evade phagocytosis by the innate immune system, promoting tumor survival and progression. It can also influence cell growth and survival independently of immune evasion.
- Relevant Therapeutic Agents: Monoclonal antibodies targeting CD47 (e.g., magrolimab) are in clinical development for various solid tumors and hematologic malignancies, aiming to block the "don't eat me" signal and unleash anti-tumor immunity.
- Supporting Evidence: CD47 overexpression is a common immune evasion mechanism in many cancers, and anti-CD47 therapies have shown promise in preclinical and clinical studies. PubMed search: CD47 colon cancer therapeutics
- ERBB3 (HER3)
- Signaling Pathways/Mechanisms: ERBB3 is a receptor tyrosine kinase (RTK) of the epidermal growth factor receptor (EGFR/HER) family. It lacks intrinsic kinase activity but heterodimerizes with other HER family members (especially EGFR and HER2) and is activated by ligands like neuregulin-1 (NRG1). This leads to activation of downstream signaling pathways, including PI3K/Akt and MAPK/ERK, which drive cell proliferation, survival, and resistance to various therapies.
- Relevant Therapeutic Agents: Antibodies targeting ERBB3 (e.g., patritumab deruxtecan, seribantumab) are under investigation in clinical trials for a range of cancers, often in combination with inhibitors of other HER receptors or chemotherapy, due to its role in mediating therapeutic resistance.
- Supporting Evidence: ERBB3 is implicated in tumor growth and drug resistance in various cancers, including colorectal cancer, making it a valuable therapeutic target. PubMed search: ERBB3 colon cancer therapeutics
- MET (Mesenchymal-Epithelial Transition factor)
- Signaling Pathways/Mechanisms: MET is a receptor tyrosine kinase activated by its ligand, hepatocyte growth factor (HGF). HGF/MET signaling plays crucial roles in embryogenesis, tissue regeneration, and wound healing. In cancer, aberrant activation of MET (via gene amplification, mutation, or overexpression) promotes cell proliferation, survival, migration, invasion, angiogenesis, and metastasis. It often activates PI3K/Akt, MAPK/ERK, and STAT3 pathways.
- Relevant Therapeutic Agents: Tyrosine kinase inhibitors (TKIs) targeting MET (e.g., capmatinib, tepotinib) are approved for non-small cell lung cancer with MET exon 14 skipping mutations and are being evaluated in other MET-driven cancers, including colorectal cancer.
- Supporting Evidence: Aberrant MET activation is a known oncogenic driver and a therapeutic target in several cancer types. PubMed search: MET colon cancer therapeutics
Potential Therapeutic Targets
- SPP1 (Secreted Phosphoprotein 1 / Osteopontin)
- Signaling Pathways/Mechanisms: SPP1 is a secreted glycoprotein that mediates cell-matrix interactions and cell signaling. It binds to several integrin receptors (e.g., αvβ3, αvβ5, αvβ1, α4β1, α9β1) and CD44 variant isoforms. SPP1 is frequently overexpressed in various cancers, promoting tumor cell adhesion, migration, invasion, angiogenesis, and epithelial-mesenchymal transition (EMT). It can activate downstream pathways like FAK, Src, and PI3K/Akt.
- Relevant Therapeutic Agents: Given its role in tumor progression and metastasis, SPP1 and its receptors are considered potential targets. Strategies include blocking antibodies against SPP1 or its integrin receptors, which are primarily in preclinical or early clinical development.
- Supporting Evidence: SPP1 is a recognized contributor to tumor aggressiveness and a prognostic biomarker in multiple cancers. PubMed search: SPP1 colon cancer therapeutics
- MUC13 (Mucin 13)
- Signaling Pathways/Mechanisms: MUC13 is a transmembrane mucin that is overexpressed in various epithelial cancers, including colorectal cancer. It can promote cell proliferation, survival, and migration by modulating various signaling pathways, including Wnt/β-catenin and MAPK pathways. It has been implicated in inflammation-associated carcinogenesis and can protect cells from apoptosis.
- Relevant Therapeutic Agents: Due to its surface expression and oncogenic roles, MUC13 is a promising candidate for antibody-based therapies, such as antibody-drug conjugates (ADCs) or bispecific antibodies. Preclinical studies are exploring its potential.
- Supporting Evidence: MUC13 acts as a prognostic marker and contributes to cancer progression in gastrointestinal malignancies. PubMed search: MUC13 colon cancer therapeutics
- LY6E (Lymphocyte Antigen 6 Family Member E)
- Signaling Pathways/Mechanisms: LY6E is a glycosylphosphatidylinositol (GPI)-anchored protein located on the cell surface. It is broadly overexpressed in many types of human cancers and is associated with tumor progression, metastasis, and resistance to chemotherapy. LY6E can modulate various signaling pathways, potentially by interacting with growth factor receptors like EGFR, leading to enhanced cell survival and proliferation.
- Relevant Therapeutic Agents: LY6E's widespread overexpression and surface localization make it an attractive target for antibody-drug conjugates (ADCs) or immunotherapeutic approaches. Several groups are investigating its potential as a target.
- Supporting Evidence: LY6E has been identified as a pan-cancer oncogene and a promising therapeutic target in preclinical models. PubMed search: LY6E colon cancer therapeutics
Clinical or Translational Implications
The identified surfaceome markers in Intestinal Epithelial cells from colon cancer offer several clinical and translational implications:
- Diagnostic and Prognostic Biomarkers: Markers like CEACAM5 and MUC13, with their distinct upregulation in tumor cells, could serve as robust diagnostic markers for colon cancer, potentially detectable in biopsies or circulating tumor cells. Their expression levels might also correlate with disease stage, aggressiveness, or patient prognosis.
- Therapeutic Targets: The strong and consistent overexpression of targets such as CEACAM5, CD47, ERBB3, and MET in the SMCxx-T (transformed tumor) population highlights their direct applicability for targeted therapies. Existing drugs (e.g., ADCs for CEACAM5, anti-CD47 antibodies, ERBB3 inhibitors, MET TKIs) could be explored or further developed for colon cancer patients expressing these markers.
- Novel Drug Development: Potential targets like SPP1, MUC13, and LY6E, which currently have fewer established therapeutic agents, represent opportunities for novel drug development. Their surface localization makes them amenable to antibody-based therapies (e.g., ADCs, bispecific antibodies, CAR T-cells), which can specifically deliver cytotoxic payloads or immune activation signals to tumor cells while minimizing off-target effects.
- Understanding Tumor Heterogeneity: The observation that 'Diploid SMCxx-T' cells largely retain a normal-like marker profile, contrasting with the highly expressive SMCxx-T population, underscores the heterogeneity within the tumor microenvironment. This suggests that a subset of epithelial cells within the tumor may not be highly transformed or may represent a less aggressive phenotype. This heterogeneity needs to be considered for diagnostic panels and therapeutic strategies to avoid treating all tumor-associated cells identically.
In summary, this analysis provides a valuable resource for prioritizing surfaceome markers in colon cancer, distinguishing between those with established clinical relevance and promising novel candidates for future therapeutic development.
16. Macrophage Surfaceome Marker Expression in Colon Cancer
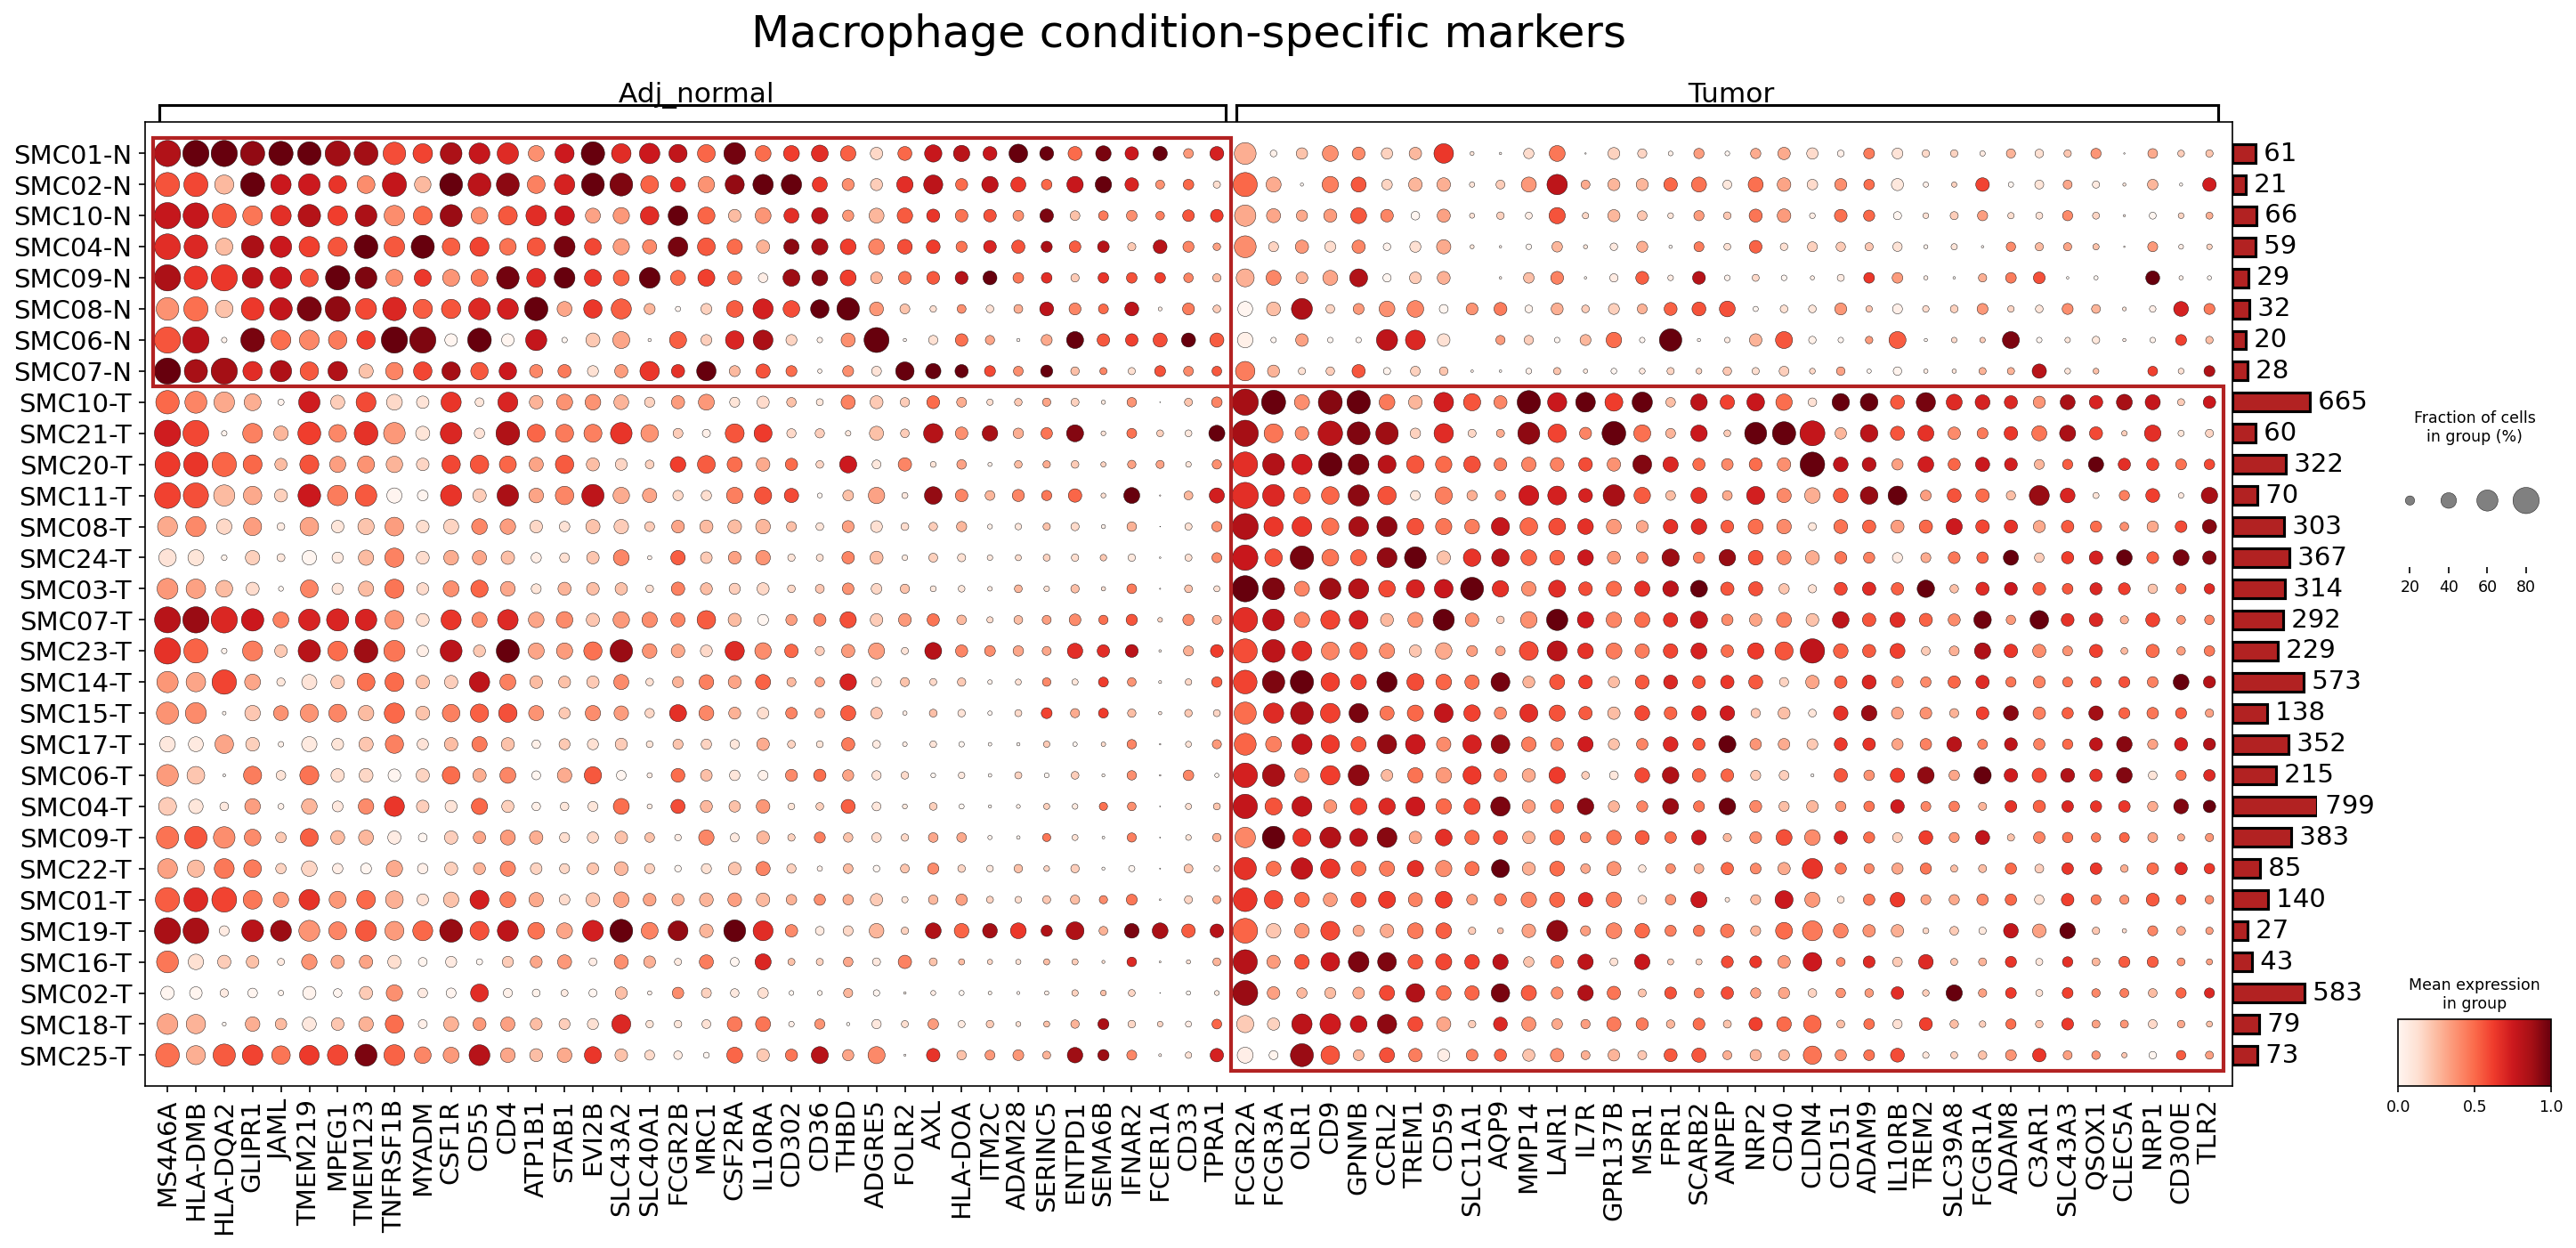
[Analysis Visualization Results]...
Analysis Overview
This analysis investigates the differential expression of surfaceome markers in Macrophage cells, comparing adjacent normal colon tissue ("Adj_normal") with colon tumor tissue ("Tumor"). The goal is to identify condition-specific macrophage markers that could indicate altered cell states, contributing to the tumor microenvironment (TME) in colon cancer. The dot plot visualizes the mean expression (color intensity) and the fraction of cells expressing each marker (dot size) across individual patient samples within each condition. Only surfaceome markers were considered, with a maximum of 40 markers displayed per condition.
Visual Summary
The dot plot clearly illustrates a distinct shift in the surfaceome profile of macrophages between adjacent normal and tumor conditions.
- Adj_normal Macrophages: Macrophages from adjacent normal tissue samples (e.g., SMC01-N, SMC02-N) predominantly express markers such as MS4A6A, STAB1, HLA-DMB, HLA-DQA2, and AXL. These markers generally show high mean expression and are present in a large fraction of cells within these normal samples.
- Tumor Macrophages: In contrast, macrophages isolated from tumor tissue samples (e.g., SMC10-T, SMC03-T, SMC01-T) show a strong upregulation of a different set of markers, including MRC1 (CD206), GPNMB, NRP2, TREM2, FCGR3A (CD16A), and CD9. These markers are characterized by high mean expression and a substantial fraction of expressing cells across most tumor samples, while being largely absent or expressed at much lower levels in adjacent normal macrophages.
- Heterogeneity: There is notable heterogeneity in marker expression among individual patient samples within both conditions, suggesting inter-patient variability in macrophage phenotypes. For example, some tumor samples (e.g., SMC02-T, SMC18-T) show comparatively lower expression of tumor-associated markers than others (e.g., SMC01-T, SMC19-T).
- Overall Shift: The data suggest a robust phenotypic shift in macrophages within the colon cancer TME, moving from a likely homeostatic or immune-surveillance state in normal tissue towards a pro-tumorigenic and immunosuppressive state in the tumor.
Biological Interpretation
The observed differential expression of surfaceome markers indicates a significant reprogramming of macrophage function in the colon tumor microenvironment. Macrophages, known for their plasticity, adapt their phenotype in response to environmental cues, playing critical roles in both tumor suppression and promotion.
Markers Predominant in Adjacent Normal Macrophages
- MS4A6A (Membrane Spanning 4-domains A6A)
- Signaling Pathways: MS4A6A is a member of the MS4A family, which includes B cell differentiation antigen CD20. Proteins in this family are transmembrane proteins often involved in signaling complexes that regulate cell activation and calcium homeostasis in immune cells. The precise signaling of MS4A6A in macrophages is still under investigation, but it likely contributes to receptor-mediated signal transduction.
- Role in TME: Its higher expression in normal colon macrophages may indicate a role in maintaining tissue homeostasis or mediating basal immune surveillance in healthy tissue. Its relative downregulation in the tumor environment suggests a shift away from these healthy-tissue-associated functions as macrophages become tumor-associated.
- Pertinent Information: Members of the MS4A family are recognized for their involvement in diverse immune cell functions. GeneCards: MS4A6A
- STAB1 (Stabilin-1)
- Signaling Pathways: STAB1 is a multifunctional scavenger receptor that binds to various ligands, including modified lipoproteins, apoptotic cells, and hyaluronan. It is involved in endocytosis, phagocytosis, and antigen presentation, contributing to immune regulation and vascular homeostasis. It can mediate the clearance of cellular debris and resolution of inflammation.
- Role in TME: In normal tissue, STAB1-expressing macrophages contribute to tissue maintenance, efferocytosis (clearance of dead cells), and immune tolerance. Its decreased expression in tumor-associated macrophages might suggest impaired debris clearance mechanisms or a functional shift away from a homeostatic, anti-inflammatory role in the TME, potentially contributing to persistent inflammation and a pro-tumorigenic environment.
- Pertinent Information: STAB1 can also be expressed by M2-like macrophages in some contexts, indicating its complex and context-dependent roles. However, its *relative* prominence here in normal tissue suggests a baseline homeostatic function. GeneCards: STAB1
- AXL (AXL Receptor Tyrosine Kinase)
- Signaling Pathways: AXL is a receptor tyrosine kinase activated by its ligand GAS6. Upon ligand binding, AXL initiates intracellular signaling cascades primarily through the PI3K/Akt and MAPK/ERK pathways, promoting cell survival, proliferation, migration, and immune suppression.
- Role in TME: While AXL is generally known to be upregulated in various cancers and frequently promotes tumor growth, metastasis, and therapy resistance in tumor cells and some stromal cells, its *higher expression in adjacent normal macrophages and relatively lower expression in tumor macrophages* in this specific dataset is noteworthy. This might suggest a context-specific role in normal macrophage function, potentially involved in tissue repair or homeostatic immune dampening. Its downregulation in TAMs could imply that in colon cancer, other pro-tumorigenic pathways or receptors become more dominant, or AXL expression is actively suppressed by the tumor microenvironment.
- Pertinent Information: AXL is a well-established oncogene and a target for numerous therapeutic interventions in other cancer types. GeneCards: AXL
Markers Predominant in Tumor Macrophages
- MRC1 (CD206, Mannose Receptor C-type 1)
- Signaling Pathways: MRC1 is a C-type lectin receptor involved in endocytosis and phagocytosis of various glycoconjugates. It plays a role in antigen presentation, immune regulation, and pathogen recognition. While it lacks an intrinsic signaling motif, its ligand binding can modulate intracellular signaling pathways, influencing macrophage polarization and function.
- Role in TME: MRC1 is a canonical marker for M2-like macrophages, which are prevalent in the TME and are generally associated with pro-tumorigenic functions. These functions include promoting tumor growth, angiogenesis, tissue remodeling, and immune suppression (e.g., by inhibiting T cell responses). The high expression of MRC1 in tumor macrophages in this dataset strongly indicates a dominant M2-like phenotype, contributing to cancer progression.
- Potential as Therapeutic Target: MRC1 represents a promising target for depleting or reprogramming pro-tumorigenic TAMs.
- Relevant Therapeutic Agents: Strategies could involve using MRC1-targeting antibodies for imaging or for delivering cytotoxic payloads (e.g., antibody-drug conjugates) to selectively eliminate M2-like TAMs. GeneCards: MRC1
- GPNMB (Glycoprotein NMB, Osteoactivin)
- Signaling Pathways: GPNMB is a type I transmembrane glycoprotein involved in cell adhesion, migration, and immune modulation. It can promote cell survival and growth, and its soluble form may act as a ligand, potentially activating signaling pathways such as PI3K/Akt through as-yet-unidentified receptors.
- Role in TME: GPNMB is frequently overexpressed in TAMs and various tumor cells, and its expression correlates with tumor progression, metastasis, and poor prognosis in several cancers, including colorectal cancer. In the TME, GPNMB+ TAMs are thought to promote angiogenesis, suppress anti-tumor immunity, and support tumor cell survival. Its high expression in tumor macrophages here points to their significant role in tumor advancement.
- Potential as Therapeutic Target: GPNMB is an attractive target for cancer therapy, particularly for antibody-drug conjugates, due to its surface expression on both tumor cells and TAMs.
- Relevant Therapeutic Agents: Glembatumumab vedotin is an ADC targeting GPNMB that has been evaluated in clinical trials for solid tumors. GeneCards: GPNMB
- TREM2 (Triggering Receptor Expressed on Myeloid Cells 2)
- Signaling Pathways: TREM2 is a transmembrane receptor expressed on myeloid cells, forming a signaling complex with DAP12 (TYROBP). Upon ligand binding (e.g., phospholipids, APOE), TREM2/DAP12 activates intracellular signaling cascades, including Syk and PI3K/Akt pathways, which regulate phagocytosis, cell survival, proliferation, and anti-inflammatory responses.
- Role in TME: TREM2+ macrophages represent a distinct, often immunosuppressive, subset of TAMs associated with advanced disease and poor prognosis in several cancers. These macrophages contribute to immune evasion, promote angiogenesis, and support tumor growth by clearing apoptotic cells and remodeling the extracellular matrix. Its prominent expression in tumor macrophages, especially compared to adjacent normal tissue, highlights its potential as a key driver of disease-associated macrophage functions in colon cancer.
- Potential as Therapeutic Target: TREM2 is a compelling therapeutic target. Modulating TREM2 activity (e.g., inhibition to suppress pro-tumorigenic functions or agonism to enhance phagocytosis in specific contexts) could reprogram TAMs to be less supportive of tumor growth or even contribute to anti-tumor immunity.
- Relevant Therapeutic Agents: Antibodies targeting TREM2 are being explored in both neurodegenerative diseases and cancer, with early-stage preclinical and clinical development. GeneCards: TREM2
Clinical or Translational Implications
The identification of distinct surfaceome marker profiles for macrophages in normal versus tumor colon tissue has significant clinical and translational implications for Colon Cancer.
- Biomarker Discovery: The differentially expressed surfaceome markers, particularly MRC1, GPNMB, and TREM2, could serve as biomarkers for the presence of pro-tumorigenic macrophages in the TME. These could be used for patient stratification, prognosis, or monitoring treatment response using techniques like immunohistochemistry, flow cytometry, or advanced imaging.
- Therapeutic Targeting of TAMs:
- MRC1, GPNMB, and TREM2 represent highly promising therapeutic targets. Given their elevated expression on tumor-associated macrophages, strategies aimed at blocking their function, depleting these macrophage subsets, or reprogramming them towards an anti-tumor phenotype could be effective.
- Antibody-drug conjugates (ADCs) targeting GPNMB or MRC1 could selectively deliver cytotoxic drugs to TAMs, minimizing off-target effects.
- Small molecule inhibitors or blocking antibodies against TREM2 could disrupt the pro-tumorigenic signaling pathways within TAMs, potentially shifting their polarization.
- Targeting these markers could be combined with existing immunotherapies (e.g., checkpoint inhibitors) to overcome macrophage-mediated immune suppression and enhance anti-tumor responses.
- Understanding Macrophage Plasticity: The detailed surfaceome profile helps to better understand the plasticity of macrophages in the context of colon cancer, revealing specific phenotypes associated with disease. This knowledge can guide the development of therapies that aim to "re-educate" pro-tumorigenic macrophages.
- Diagnostic and Prognostic Value: High expression of markers like MRC1, GPNMB, and TREM2 in patient biopsies could correlate with more aggressive disease or poorer prognosis, providing valuable information for clinical decision-making.
17. Fibroblast Condition-Specific Surfaceome Markers in Colon Cancer
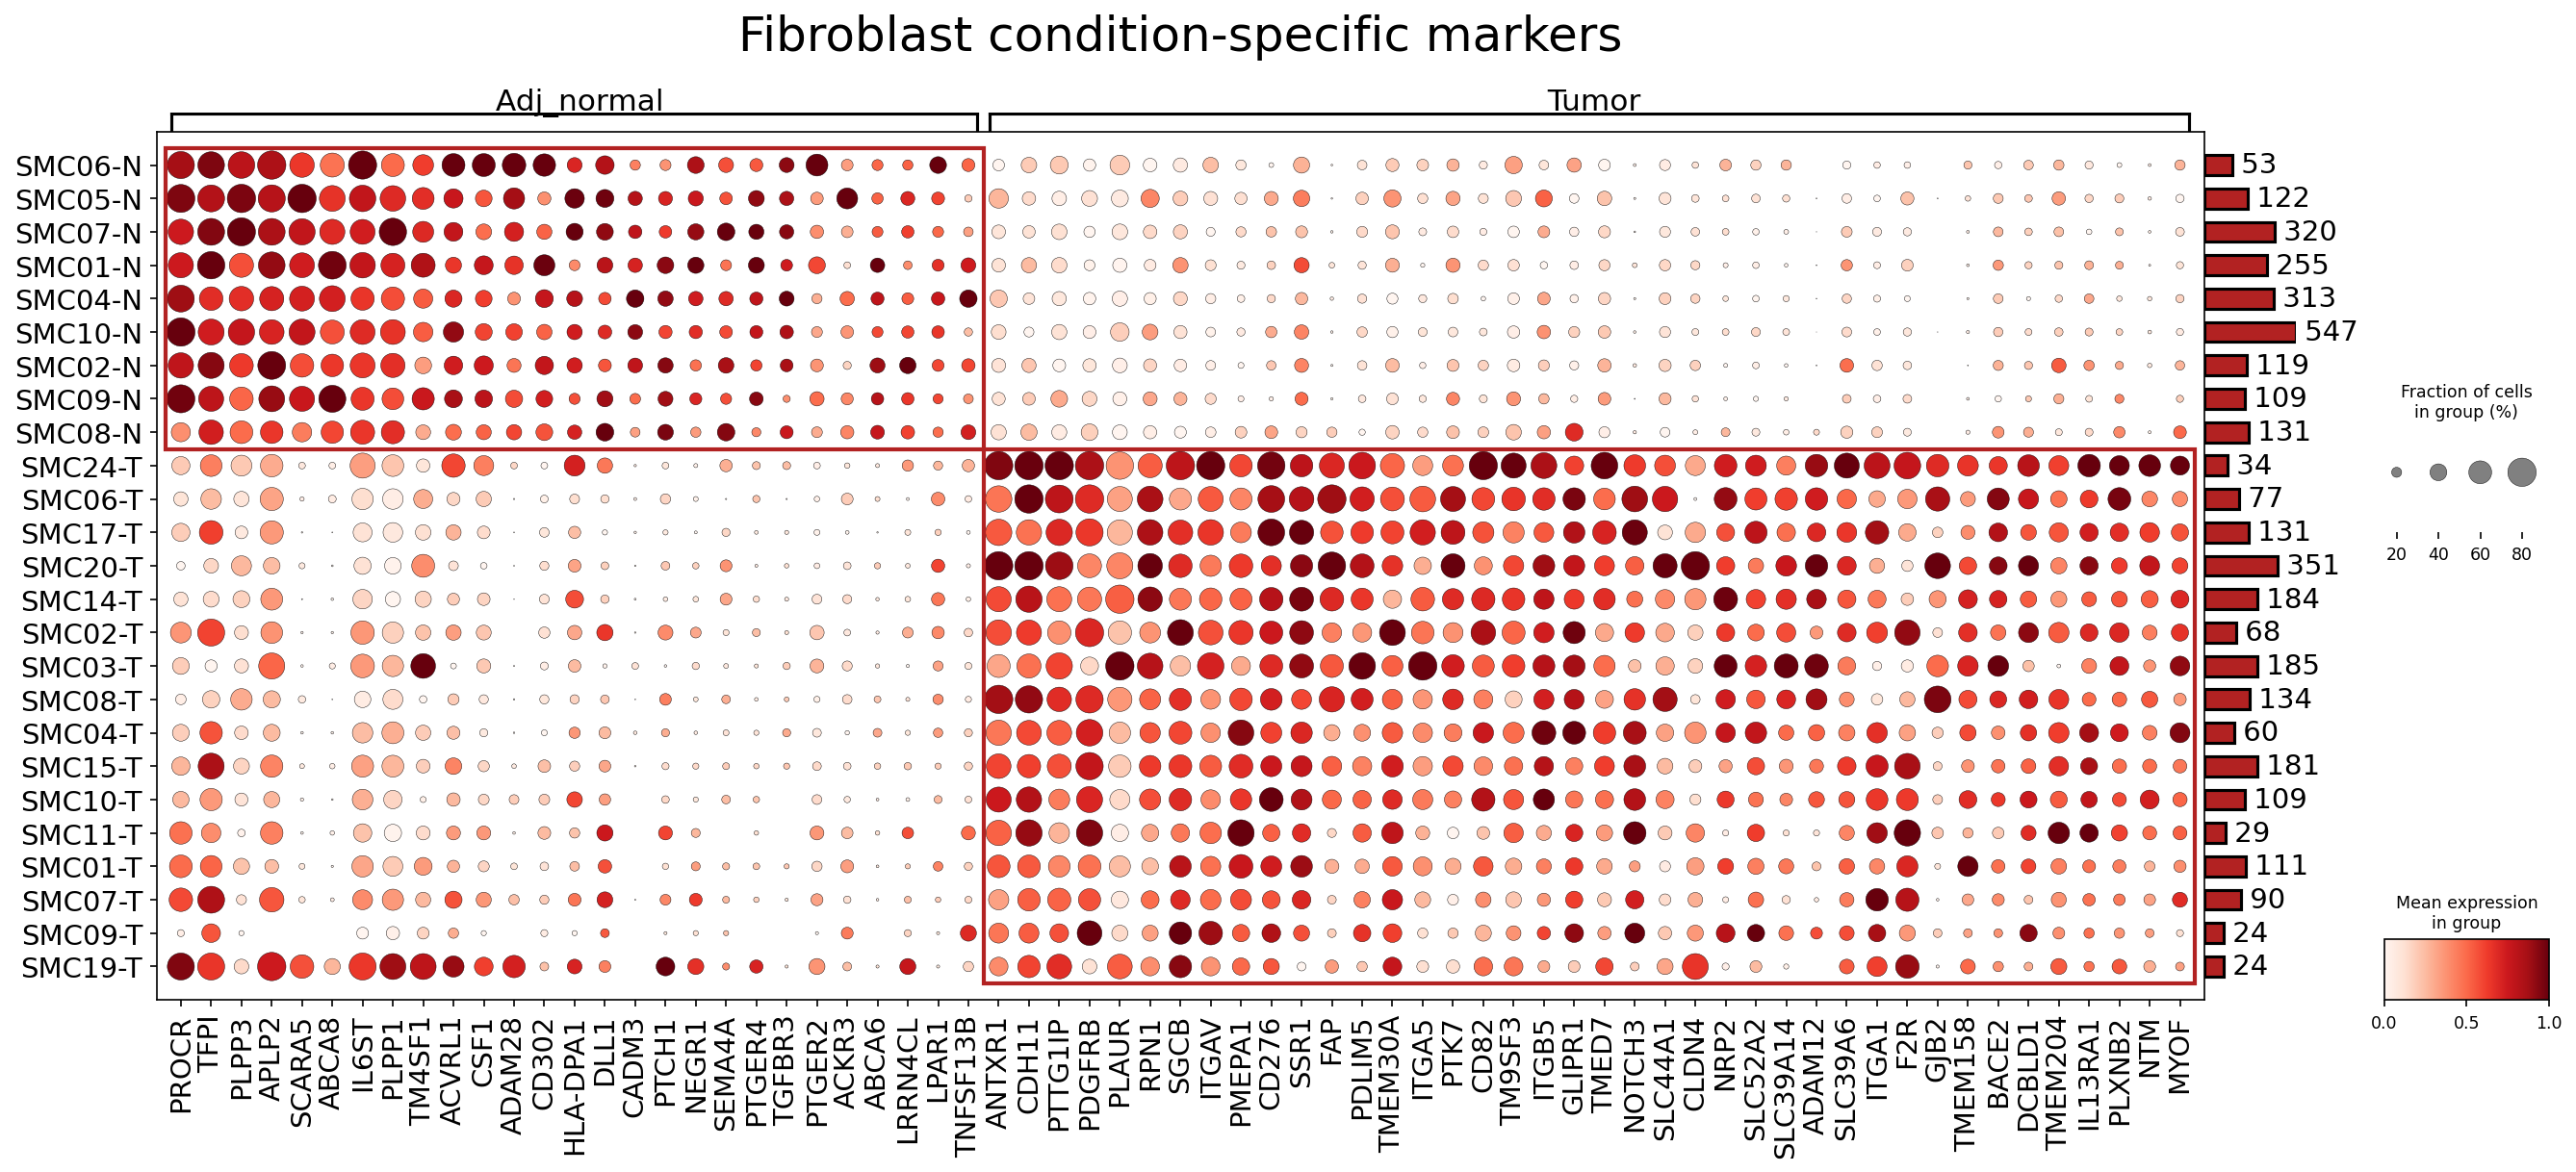
[Analysis Visualization Results]...
Analysis Overview
This analysis identifies surfaceome markers specifically expressed in Fibroblast cells across 'Adj_normal' and 'Tumor' conditions within the colon tissue single-cell RNA-seq dataset. The goal is to highlight differential surface protein expression patterns that could distinguish normal fibroblasts from cancer-associated fibroblasts (CAFs) and potentially serve as therapeutic targets or diagnostic biomarkers in Colon Cancer. Only surfaceome markers were considered, with a maximum of 40 markers per condition displayed in the dot plot.
Visual Summary
The dot plot effectively illustrates distinct surfaceome expression profiles for Fibroblasts from 'Adj_normal' versus 'Tumor' conditions.
- Clear Condition-Specific Clustering: Fibroblasts from 'Adj_normal' samples (SMC06-N to SMC08-N) exhibit high expression of a specific set of markers on the left side of the plot. Conversely, fibroblasts from 'Tumor' samples (SMC24-T to SMC19-T) show high expression of a largely non-overlapping set of markers on the right side. This distinct segregation highlights significant phenotypic shifts in fibroblasts within the tumor microenvironment.
- Adj_normal Fibroblast Markers: Markers such as PROCR, TFPI, PLPP3, SCARA5, APLP2, IL6ST, TMEM181, ACVRL1, ADAM28, SEMA4A, and others are prominently expressed in 'Adj_normal' fibroblasts. These markers generally show high mean expression (dark red color) and a high fraction of expressing cells (large dot size) in normal samples, with minimal to no expression in tumor samples.
- Tumor Fibroblast (CAF) Markers: A striking upregulation of numerous surfaceome markers is observed in 'Tumor' fibroblasts. Highly expressed markers in CAFs include FAP, PDGFRA, PDGFRB, ITGAV, CDH11, PMEPA1, CD276, THY1 (CD90), NOTCH3, LPAR1, and ANTXR1, among many others. These markers typically show intense red coloration and large dot sizes in tumor samples, indicating both high expression levels and a widespread presence across tumor-associated fibroblasts.
- Absence of Common Markers: There are very few, if any, markers that are highly expressed in both conditions, reinforcing the idea of a significant shift in fibroblast identity and function in the tumor microenvironment.
- Cell Count Variability: The bar chart on the right indicates the number of fibroblast cells analyzed per sample, ranging from 24 to 547 cells, ensuring sufficient cellular representation for marker detection across most samples.
Biological Interpretation
The observed differential surfaceome expression points to a profound functional reprogramming of fibroblasts within the colon cancer tumor microenvironment (TME), transforming them into Cancer-Associated Fibroblasts (CAFs). This reprogramming leads to the acquisition of new surface markers that reflect their altered roles in supporting tumor growth, invasion, and immune evasion.
Markers Enriched in Adj_normal Fibroblasts
Fibroblasts in adjacent normal tissue appear to maintain a relatively quiescent or homeostatic state, characterized by markers potentially involved in tissue maintenance or anti-fibrotic processes.
- PROCR (Endothelial Protein C Receptor): While primarily expressed on endothelial cells, its presence on a subset of normal fibroblasts might indicate roles in regulating inflammation or maintaining vascular integrity in the normal colon. GeneCards: PROCR
- TFPI (Tissue Factor Pathway Inhibitor): A natural anticoagulant, its expression in normal fibroblasts could contribute to maintaining vascular homeostasis and preventing aberrant coagulation. GeneCards: TFPI
- IL6ST (Interleukin 6 Signal Transducer, also known as gp130): This is a co-receptor for IL-6 and other cytokines. Its expression in normal fibroblasts suggests responsiveness to inflammatory signals, which are typically tightly regulated in healthy tissue. GeneCards: IL6ST
Markers Enriched in Tumor Fibroblasts (CAFs)
The vast array of upregulated surfaceome markers in tumor fibroblasts signifies their active and diverse roles in promoting tumor progression, making them crucial components of the TME.
- FAP (Fibroblast Activation Protein alpha): This is a hallmark marker of activated fibroblasts, particularly CAFs. FAP is a serine protease involved in extracellular matrix (ECM) remodeling, promoting tumor invasion, angiogenesis, and immunosuppression. Its activity contributes to the desmoplastic reaction often seen in solid tumors like colon cancer.
- Signaling Pathways: Interacts with ECM components (collagen, gelatin) and can cleave various substrates, indirectly influencing signaling through growth factor availability and receptor interactions.
- Role in TME: ECM remodeling, creation of physical barriers for immune cells, release of pro-tumorigenic factors.
- Therapeutic Potential: High. FAP-targeting strategies aim to inhibit its enzymatic activity or deplete FAP-positive cells.
- Therapeutic Agents: FAP-specific antibodies (e.g., sibrotuzumab, although clinical efficacy has varied), FAP-targeted prodrugs, FAP-directed CAR-T cell therapy, FAP-targeted radioligand therapy. GeneCards: FAP
- PDGFRA / PDGFRB (Platelet-Derived Growth Factor Receptor Alpha/Beta): These receptor tyrosine kinases are critical drivers of fibroblast proliferation, migration, and activation in response to PDGF ligands secreted by tumor cells and other stromal cells. Their activation leads to robust CAF expansion and matrix production.
- Signaling Pathways: Activated by PDGF ligands, leading to downstream activation of MAPK/ERK, PI3K/Akt, and STAT pathways, promoting cell growth, survival, and motility.
- Role in TME: Induces fibroblast proliferation, differentiation into myofibroblasts, and secretion of ECM components, enhancing tumor growth and metastasis.
- Therapeutic Potential: High. Targeting PDGF signaling can reduce CAF activation.
- Therapeutic Agents: Tyrosine kinase inhibitors (TKIs) like imatinib, sorafenib, or regorafenib, which inhibit PDGFR activity. GeneCards: PDGFRA, GeneCards: PDGFRB
- ITGAV / ITGA5 / ITGB5 (Integrin Subunits Alpha V / Alpha 5 / Beta 5): Integrins are cell surface receptors that mediate cell-ECM interactions and cell-cell adhesion, playing crucial roles in cell migration, invasion, and mechanotransduction. Upregulation of specific integrins like ITGAV/ITGB5 (which forms the vitronectin receptor) and ITGA5 (a fibronectin receptor subunit) in CAFs enhances their ability to remodel the ECM and facilitate tumor cell motility.
- Signaling Pathways: Integrin engagement activates FAK, Src, and Rho GTPase pathways, impacting cell proliferation, survival, and cytoskeletal organization.
- Role in TME: Mediate CAF adhesion and migration, facilitate ECM remodeling, and transmit mechanical signals that influence tumor cell behavior.
- Therapeutic Potential: Moderate to high. Inhibiting specific integrins can disrupt tumor-stromal interactions and metastasis.
- Therapeutic Agents: Integrin antagonists (e.g., cilengitide targeting αVβ3/αVβ5, although with mixed clinical results, new targets are emerging). GeneCards: ITGAV, GeneCards: ITGA5, GeneCards: ITGB5
- CD276 (B7-H3): An immune checkpoint molecule of the B7 family, CD276 is often overexpressed in various cancers and on CAFs. It can suppress anti-tumor immune responses, promoting immune evasion.
- Signaling Pathways: Primarily functions in immune regulation, inhibiting T cell activation and proliferation, though its precise signaling mechanisms are still being elucidated.
- Role in TME: Contributes to an immunosuppressive microenvironment, protecting tumor cells and CAFs from immune attack.
- Therapeutic Potential: High. Blockade of CD276 can restore anti-tumor immunity.
- Therapeutic Agents: Monoclonal antibodies targeting CD276 are in clinical development. GeneCards: CD276
- CDH11 (Cadherin-11): A type II classical cadherin involved in cell-cell adhesion, which can promote cell migration and invasion when expressed aberrantly. In CAFs, CDH11 can facilitate tumor cell invasion and metastasis.
- Signaling Pathways: Mediates homophilic cell-cell adhesion, influencing Rho GTPase activity and Wnt signaling, affecting cell motility and tissue architecture.
- Role in TME: Enhances CAF migration and can promote tumor cell invasion through heterotypic interactions.
- Therapeutic Potential: Moderate. Targeting CDH11 could disrupt tumor-stromal interactions. GeneCards: CDH11
- THY1 (CD90): A glycosylphosphatidylinositol-anchored protein expressed on various cell types, including activated fibroblasts and cancer stem cells. In CAFs, it's often associated with an activated myofibroblastic phenotype.
- Signaling Pathways: Involved in cell adhesion, migration, and activation, potentially interacting with integrins and growth factor receptors.
- Role in TME: Can promote CAF survival, migration, and interaction with other TME components.
- Therapeutic Potential: Moderate. Targeting CD90 could inhibit CAF functions. [GeneCards: THY1](GeneCards]
- NOTCH3: Part of the highly conserved Notch signaling pathway, which plays critical roles in cell fate determination, differentiation, and tissue development. Aberrant Notch signaling in CAFs can promote their activation and pro-tumorigenic functions.
- Signaling Pathways: Ligand binding to Notch receptors leads to proteolytic cleavage and release of an intracellular domain (NICD) that translocates to the nucleus to activate target gene transcription (e.g., Hes and Hey family genes).
- Role in TME: Regulates CAF activation, proliferation, and interaction with tumor cells, contributing to tumor growth and angiogenesis.
- Therapeutic Potential: High. Targeting Notch signaling can affect both tumor cells and CAFs.
- Therapeutic Agents: Gamma-secretase inhibitors (GSIs) and Notch-specific antibodies are under investigation. GeneCards: NOTCH3
- LPAR1 (Lysophosphatidic Acid Receptor 1): A G protein-coupled receptor that binds lysophosphatidic acid (LPA), a bioactive lipid. LPA-LPAR signaling can promote various pro-tumorigenic processes, including CAF activation, proliferation, and migration.
- Signaling Pathways: Activates G protein-coupled signaling cascades, leading to activation of MAPK/ERK, PI3K/Akt, and Rho pathways.
- Role in TME: Drives CAF activation, ECM production, and contributes to tumor growth and metastasis.
- Therapeutic Potential: Moderate. LPAR antagonists could inhibit CAF functions. GeneCards: LPAR1
- ANTXR1 (Anthrax Toxin Receptor 1, also known as TEM8): While known as a receptor for anthrax toxin, ANTXR1 is also expressed on endothelial cells and CAFs in the tumor microenvironment, where it plays a role in angiogenesis and tumor growth.
- Signaling Pathways: Involved in cell adhesion and migration, potentially through interaction with ECM components and downstream signaling.
- Role in TME: Supports angiogenesis and CAF functions, contributing to tumor progression.
- Therapeutic Potential: Moderate. ANTXR1-targeting agents are being explored. GeneCards: ANTXR1
- PMEPA1 (Prostate Transmembrane Protein, Androgen Induced 1): Involved in TGF-beta signaling, a critical pathway for CAF activation and fibrosis. PMEPA1 can modulate TGF-beta receptor signaling and promote CAF-mediated ECM deposition.
- Signaling Pathways: Interacts with components of the TGF-beta signaling pathway, potentially influencing SMAD activation.
- Role in TME: Promotes CAF activation and the fibrotic response within the tumor.
- Therapeutic Potential: Moderate. Targeting PMEPA1 could modulate TGF-beta driven CAF activity. GeneCards: PMEPA1
Clinical or Translational Implications
The robust and distinct surfaceome signature of CAFs in colon cancer suggests several promising avenues for clinical translation.
- Diagnostic and Prognostic Biomarkers: Upregulated CAF-specific surface markers like FAP, PDGFRB, CD276, and THY1 could serve as diagnostic markers to identify the presence and extent of desmoplastic reaction in colon cancer biopsies. Their expression levels might also have prognostic value, correlating with disease progression or response to therapy.
- Therapeutic Targets for CAF Depletion/Reprogramming:
- Direct Targeting of CAFs: Markers such as FAP, PDGFRB, and CD276 represent attractive targets for depleting pro-tumorigenic CAFs or reprogramming them into a more quiescent state.
- FAP-targeting strategies (e.g., FAP-specific antibodies, CAR-T cells, small molecule inhibitors, or radioligands) are actively being investigated in preclinical and clinical settings for various solid tumors, including colorectal cancer. These approaches aim to reduce the immunosuppressive and pro-fibrotic TME.
- PDGFR inhibitors are already used in other cancers and could be repurposed or specifically tailored for CAF targeting in colon cancer, potentially combined with chemotherapy or immunotherapy.
- CD276 (B7-H3) antibodies could be developed to block its immunosuppressive functions, enhancing the efficacy of immunotherapies.
- Targeting CAF Signaling Pathways: Inhibiting pathways crucial for CAF activation, such as PDGF, Integrin, LPA, or Notch signaling, using drugs like TKIs, integrin antagonists, or gamma-secretase inhibitors, could suppress CAF functions.
- ECM Remodeling Modulators: Targeting enzymes like FAP that remodel the ECM could improve drug penetration into tumors and reduce physical barriers for immune cells.
- Direct Targeting of CAFs: Markers such as FAP, PDGFRB, and CD276 represent attractive targets for depleting pro-tumorigenic CAFs or reprogramming them into a more quiescent state.
- Combination Therapies: Targeting CAFs alongside tumor cells or immune checkpoints holds significant promise. For instance, combining FAP inhibition with conventional chemotherapy or immune checkpoint blockade (e.g., PD-1/PD-L1 inhibitors) could lead to synergistic anti-tumor effects by simultaneously attacking tumor cells and disrupting the supportive TME.
- Minimizing Off-Target Effects: The 'surfaceome-only' approach ensures that identified markers are accessible for antibody-based therapies or cell-surface-directed interventions, minimizing off-target effects on intracellular proteins. The distinct expression pattern between normal and tumor-associated fibroblasts further supports the specificity of these targets, aiming for minimal toxicity to healthy tissues.
In conclusion, the identification of a unique surfaceome signature for tumor-associated fibroblasts in colon cancer provides a rich resource for developing novel diagnostic tools and therapeutic strategies aimed at modulating the tumor microenvironment to improve patient outcomes.
18. Condition-Specific Surfaceome Markers of CD4+ T Cells in Colon Cancer
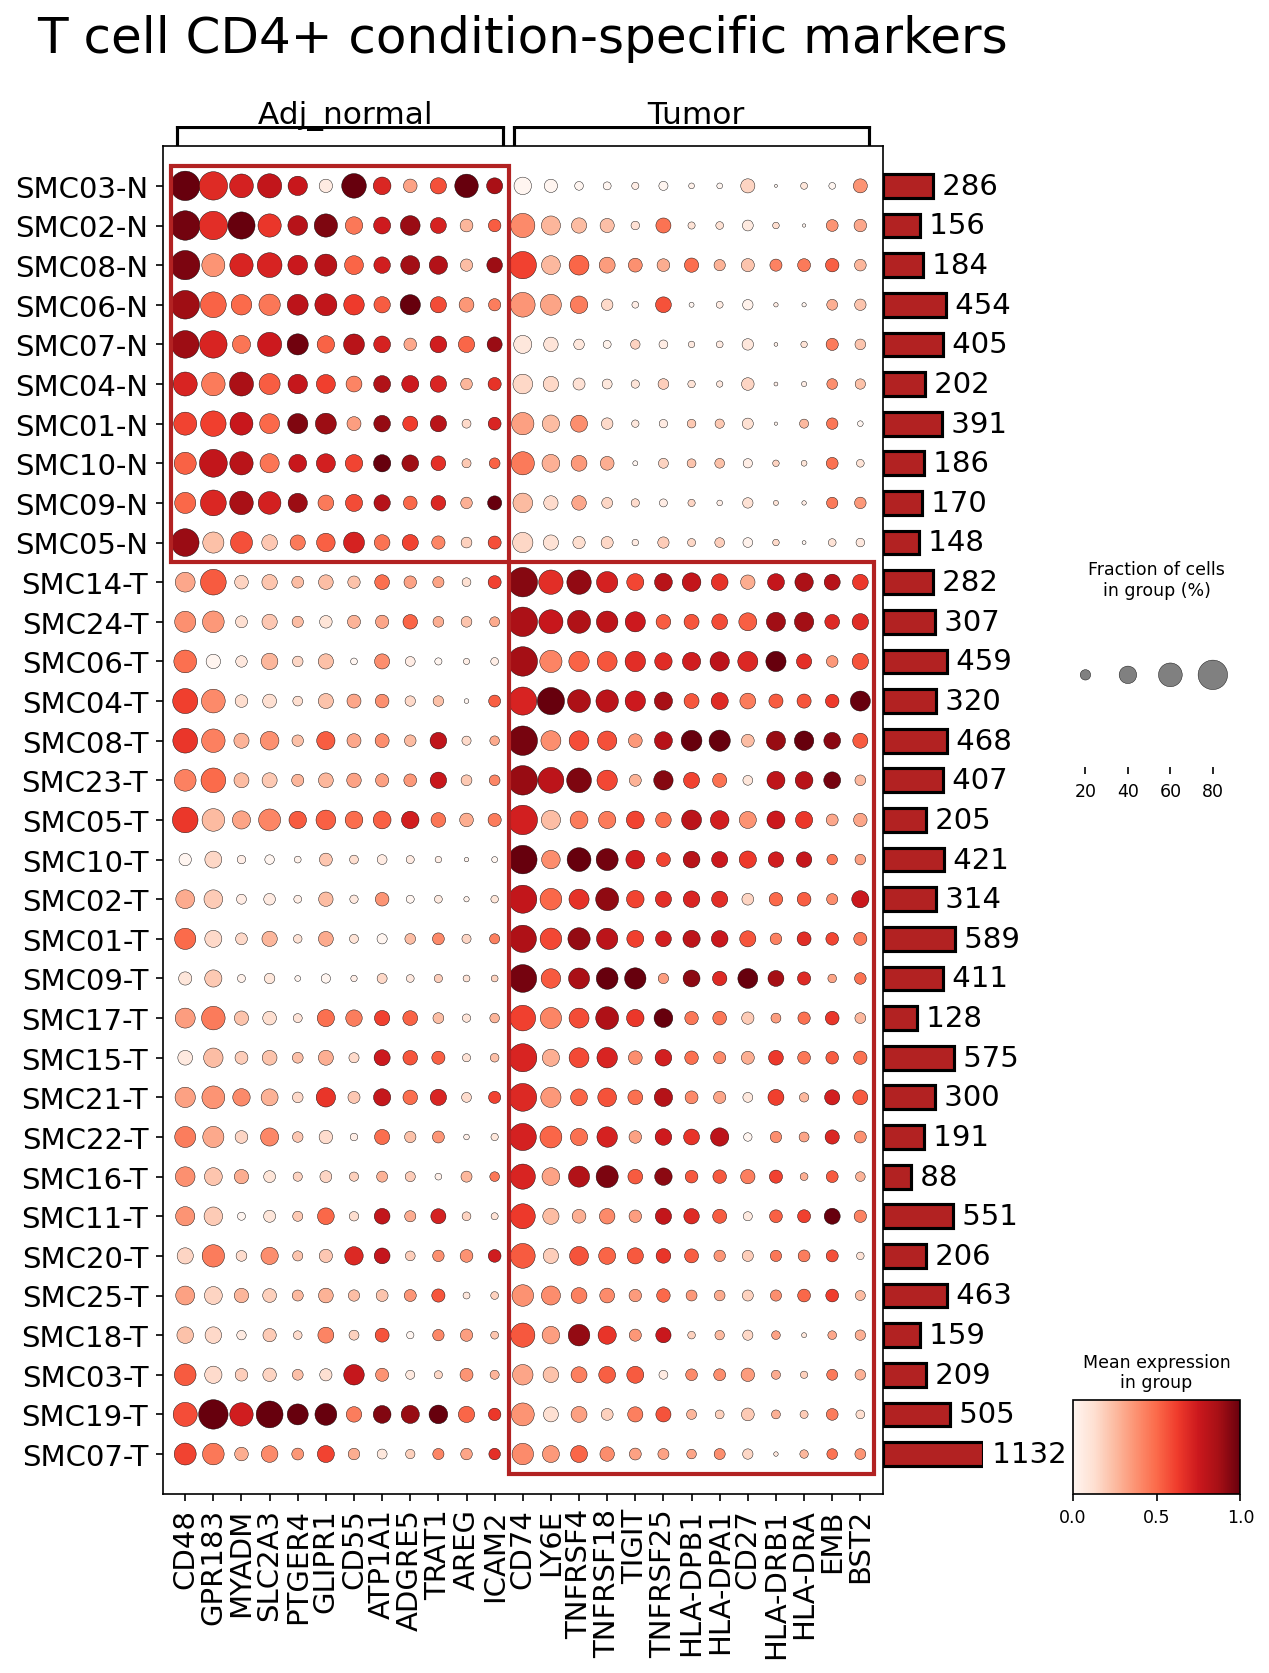
[Analysis Visualization Results]...
Analysis Overview
This analysis investigates the differential expression of surfaceome markers on CD4+ T cells isolated from colon 'Adj_normal' and 'Tumor' tissues. The goal is to identify markers that are uniquely or highly expressed in one condition versus the other, providing insights into CD4+ T cell activation states, functional changes, and potential therapeutic targets within the tumor microenvironment (TME) of Colon Cancer. The dot plot visualizes the mean expression level (color intensity) and the fraction of cells expressing each marker (dot size) across individual patient samples for both conditions.
Visual Summary
The dot plot clearly delineates two distinct sets of surfaceome markers that are preferentially expressed in CD4+ T cells, depending on whether they originate from 'Adj_normal' or 'Tumor' tissue.
- Adj_normal-Specific Markers: A prominent cluster of markers, including CD48, GPR183, MYADM, SLC2A3, PTGER4, GLIPR1, CD55, ATP1A1, ADGRE5, TRAT1, AREG, and ICAM2, shows high mean expression (dark red dots) and a high fraction of expressing cells (large dots) exclusively in 'Adj_normal' samples. These markers are largely absent or expressed at very low levels in 'Tumor' samples.
- Tumor-Specific Markers: Conversely, a distinct group of markers, including CD74, LY6E, TNFRSF4, TNFRSF18, TIGIT, TNFRSF25, HLA-DPA1, HLA-DPB1, CD27, HLA-DRB1, HLA-DRA, EMB, and BST2, exhibits high mean expression and high cell fractions predominantly in 'Tumor' samples. These markers are either absent or very dimly expressed in 'Adj_normal' samples.
- Sample-Specific Variability: While the overall trend is clear, some inter-sample variability in expression levels and cell fractions is observable within each condition, reflecting individual patient differences. The number of cells per sample (indicated by the bar plot on the right) varies, but the observed marker patterns are consistent across multiple samples within each condition.
Biological Interpretation
The differential expression of these surfaceome markers highlights significant phenotypic and functional reprogramming of CD4+ T cells in the colon tumor microenvironment compared to adjacent normal tissue.
Markers Enriched in Adjacent Normal Tissue (Adj_normal)
These markers characterize CD4+ T cells in a presumably healthy or homeostatic immune environment. Their downregulation or absence in tumor tissue may suggest a loss of normal T cell functions or immune evasion mechanisms.
- CD48 (SLAMF2): A co-stimulatory receptor involved in T cell activation and adhesion, interacting with 2B4 (CD244). High expression in normal tissue might reflect active immune surveillance or readiness for antigen recognition. GeneCards: CD48
- GPR183 (EBI2): A chemokine-like receptor essential for immune cell migration to lymphoid follicles, binding oxysterols like 7α,25-dihydroxycholesterol. Its presence in normal tissue CD4+ T cells suggests normal trafficking and compartmentalization. Loss in tumor could impair effective T cell homing. GeneCards: GPR183
- MYADM (Myeloid Associated Differentiation Marker): Plays roles in cell adhesion and motility. Its normal tissue expression could relate to T cell trafficking and interactions in healthy gut mucosa.
- SLC2A3 (GLUT3): A glucose transporter, indicating metabolic activity. Its higher expression in normal tissue might reflect different metabolic demands or adaptation compared to the TME, which is often nutrient-deprived.
- PTGER4 (EP4): A receptor for prostaglandin E2 (PGE2), involved in immune regulation, often associated with immunosuppression or inflammatory responses. Its presence in normal tissue may reflect fine-tuning of immune responses.
- GLIPR1 (GLI Pathogenesis-Related 1): Associated with cell growth, differentiation, and apoptosis. Its role in T cells is less defined but may contribute to homeostatic maintenance.
- CD55 (DAF): Decay-accelerating factor, a complement regulatory protein. Its presence may protect T cells from complement-mediated lysis in a non-tumoral setting.
- ATP1A1 (Na+/K+-ATPase α1): A component of the sodium-potassium pump, crucial for maintaining ion gradients and cell volume. Essential for basic cell function, its differential expression might reflect metabolic or functional states.
- ADGRE5 (CD97): An adhesion G protein-coupled receptor involved in cell-cell interactions and immune cell migration. Important for maintaining tissue integrity and immune cell positioning.
- TRAT1 (T-cell receptor associated transmembrane adapter 1): Involved in TCR signaling and T cell activation. Essential for proper T cell function.
- AREG (Amphiregulin): An EGFR ligand. While primarily known for roles in epithelial growth and repair, T cells can produce AREG to promote tissue repair and modulate immune responses. Its presence in normal tissue could relate to mucosal healing or homeostatic immune-epithelial crosstalk. PubMed Search: T cell amphiregulin gut
- ICAM2 (CD102): Intercellular Adhesion Molecule 2, involved in leukocyte adhesion and transmigration. Its expression indicates the T cells' ability to interact with endothelial cells and migrate effectively in normal tissue.
Markers Enriched in Tumor Tissue (Tumor)
These markers frequently signify activated, exhausted, or dysregulated CD4+ T cell states within the immunosuppressive tumor microenvironment, reflecting the host immune response and attempts at immune evasion by the tumor.
- CD74 (Invariant Chain): While known for its role in MHC class II antigen presentation, CD74 can also act as a receptor for MIF (Macrophage Migration Inhibitory Factor), a pro-inflammatory cytokine. Upregulation on T cells in the TME might indicate activation, altered antigen processing, or participation in MIF-mediated inflammatory/immunosuppressive circuits. GeneCards: CD74
- LY6E: Lymphocyte antigen 6 complex locus E. Often associated with T cell activation and can contribute to immune evasion by tumors.
- TNFRSF4 (OX40, CD134): A co-stimulatory receptor on activated T cells, member of the TNF receptor superfamily. Its engagement promotes T cell proliferation, survival, and cytokine production. High expression indicates activated T cell states attempting to mount an anti-tumor response. GeneCards: TNFRSF4
- TNFRSF18 (GITR, CD357): Glucocorticoid-induced TNFR-related protein, another co-stimulatory receptor. Expressed on activated effector T cells and constitutively on regulatory T cells (Tregs). In effector T cells, it enhances anti-tumor immunity. GeneCards: TNFRSF18
- TIGIT (T-cell immunoreceptor with Ig and ITIM domains): An inhibitory immune checkpoint receptor, binding CD155 (PVR) and CD112 (PVRL2). Its expression often signifies T cell exhaustion and immunosuppression, a hallmark of chronic antigen exposure in cancer. PubMed Search: TIGIT immune checkpoint cancer
- TNFRSF25 (DR3): Death receptor 3, also known as Apo3. A TNF receptor superfamily member involved in apoptosis and T cell activation. Its expression in the TME may reflect chronic T cell activation or pro-apoptotic signals.
- HLA-DPA1, HLA-DPB1, HLA-DRB1, HLA-DRA (MHC Class II molecules): While classical MHC class II molecules are expressed by professional antigen-presenting cells (APCs), T cells can upregulate them, especially CD4+ T cells, upon chronic activation or under inflammatory conditions. This might signify T cell activation, antigen presentation in specific contexts, or a state of chronic immune stimulation within the TME. GeneCards: HLA-DRA
- CD27: A co-stimulatory receptor (TNF receptor superfamily member) expressed on activated and memory T cells. It promotes T cell survival, proliferation, and differentiation. Its presence suggests an activated or memory T cell phenotype in the tumor, potentially attempting to respond to tumor antigens. GeneCards: CD27
- EMB (Embigin): A transmembrane glycoprotein involved in cell adhesion and migration, often associated with tumor progression and metastasis. Its expression on T cells could influence their migratory capacity or interactions within the TME.
- BST2 (CD317, Tetherin): Bone marrow stromal antigen 2, an interferon-inducible protein. While known for antiviral defense, it can be expressed on various immune cells in cancer and has been implicated in immune evasion and inflammation within the TME. GeneCards: BST2
Clinical or Translational Implications
The distinct expression profiles of surfaceome markers on CD4+ T cells in colon cancer offer several clinical and translational implications:
- Biomarkers for Disease State: The identified tumor-specific markers (e.g., TIGIT, OX40, GITR, MHC Class II molecules) could serve as diagnostic or prognostic biomarkers for distinguishing tumor-infiltrating CD4+ T cells and assessing their activation/exhaustion status in colon cancer patients.
- Therapeutic Targets:
- Immune Checkpoint Blockade: The high expression of TIGIT on CD4+ T cells in tumor samples strongly suggests its role as an inhibitory checkpoint. Anti-TIGIT antibodies are under active investigation in clinical trials for various cancers, including colorectal cancer, often in combination with anti-PD-1 therapy, to reverse T cell exhaustion and enhance anti-tumor immunity. PubMed Search: TIGIT colorectal cancer immunotherapy
- Costimulatory Agonists: The upregulation of TNFRSF4 (OX40), TNFRSF18 (GITR), and CD27 on tumor-infiltrating CD4+ T cells highlights their potential as targets for agonistic antibodies. Activating these receptors could boost T cell proliferation, survival, and effector functions, thereby improving anti-tumor responses. Agonistic antibodies against OX40, GITR, and CD27 are being explored in clinical settings. PubMed Search: OX40 agonist cancer therapy; PubMed Search: GITR agonist cancer therapy; PubMed Search: CD27 agonist cancer therapy
- Modulating Inflammation/Antigen Presentation: Upregulation of CD74 and MHC Class II molecules might indicate altered antigen presentation or inflammatory pathways in the TME. While not direct T cell targets, targeting pathways related to CD74 (e.g., MIF-CD74 axis) could modulate the immune response.
- Understanding T Cell Dysfunction: The shift from markers associated with homeostatic/surveillance functions in normal tissue to those indicating activation, exhaustion, or altered immune regulation in the tumor provides critical insights into the mechanisms of T cell dysfunction in colon cancer. This understanding can guide the development of combination therapies to overcome immunosuppression.
- Experimental Validation: These markers warrant further investigation through immunohistochemistry, flow cytometry, or functional assays to validate their expression patterns at the protein level and elucidate their precise functional consequences on CD4+ T cell subsets within human colon tumor samples. This could involve sorting CD4+ T cells based on these markers and assessing their proliferative capacity, cytokine production, and anti-tumor efficacy *in vitro* and *in vivo*.
19. Upregulation of Cell Cycle Pathway Genes in Tumor-Associated Intestinal Epithelial Cells
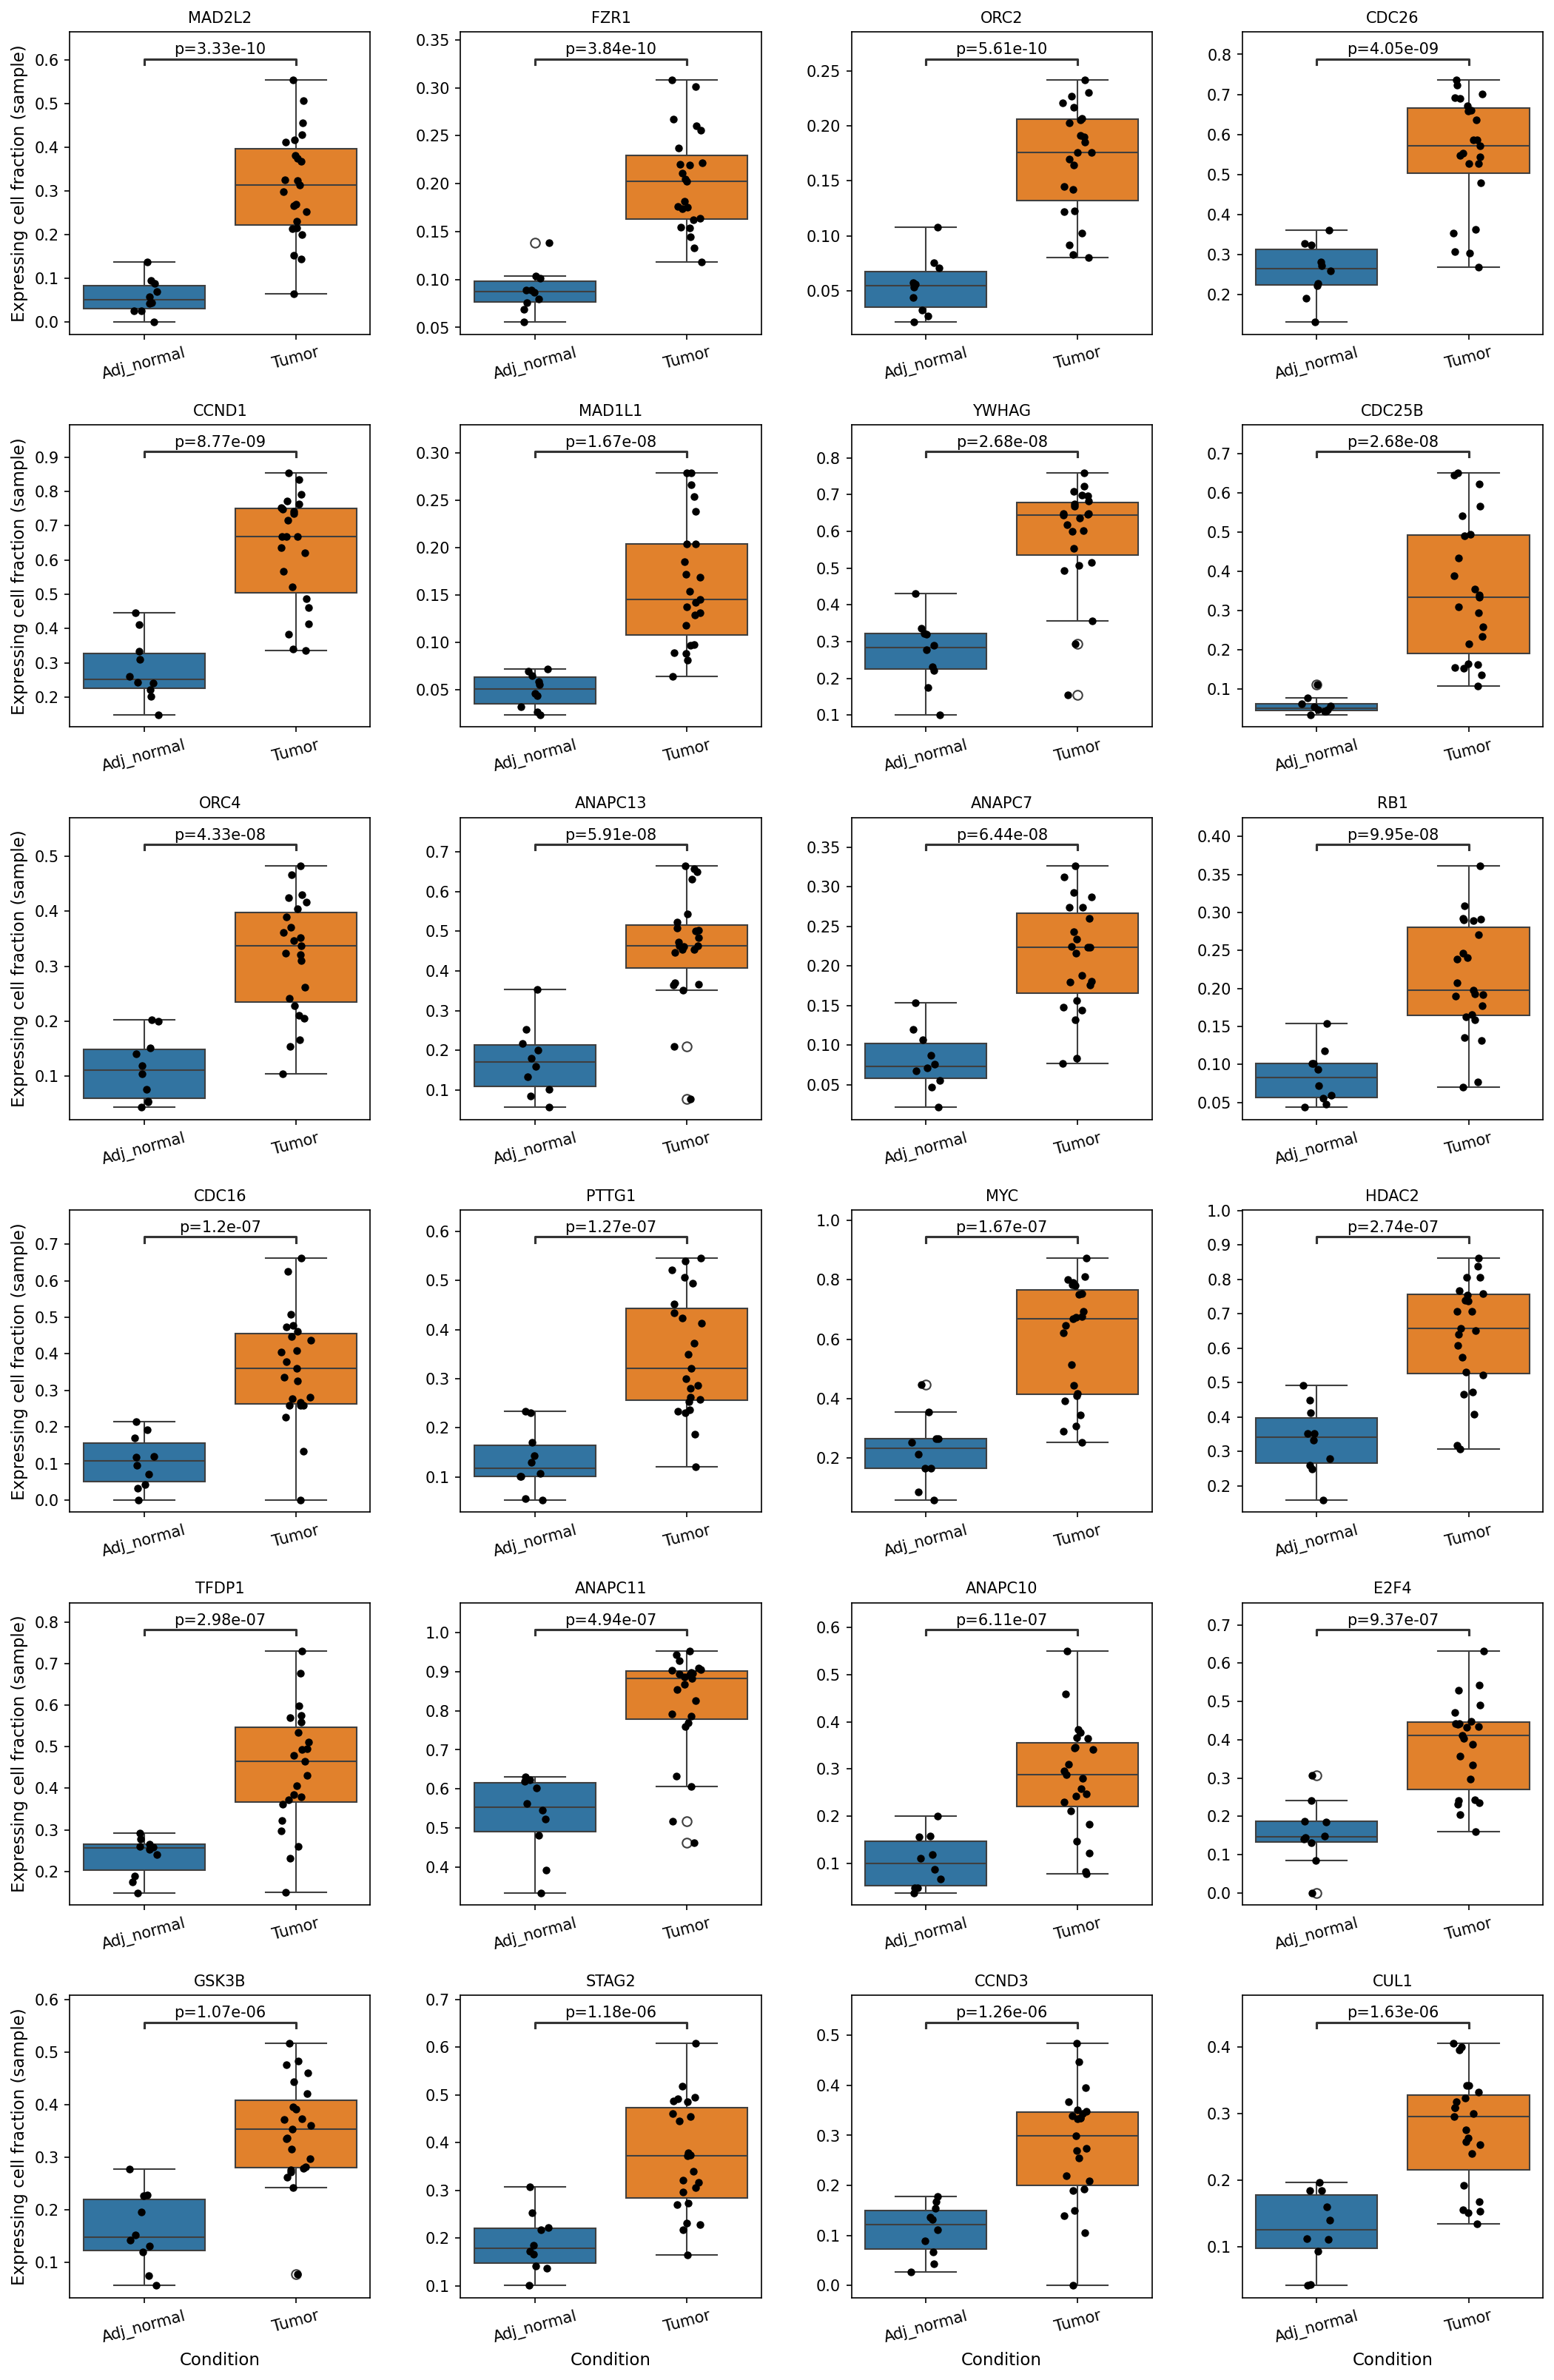
[Analysis Visualization Results]...
Analysis Overview
This analysis investigates the "expressing cell fraction (sample)" of key cell cycle pathway genes in Intestinal Epithelial cells, comparing cells from "Adj_normal" (adjacent normal) colon tissue with those from "Tumor" tissue. The results are presented as box plots for 24 selected genes, highlighting statistically significant differences between the two conditions. This aims to identify cell cycle genes whose expression patterns are altered in tumor-origin epithelial cells, which are central to colon cancer pathology.
Visual Summary
The visualization consists of 24 box plots, each representing a specific cell cycle gene. For every gene, the "expressing cell fraction (sample)" is compared between "Adj_normal" and "Tumor" conditions within Intestinal Epithelial cells.
- Consistent Upregulation in Tumor: Across all 24 plotted genes, there is a clear and consistent pattern of increased "expressing cell fraction" in Intestinal Epithelial cells from Tumor samples compared to those from Adj_normal samples. This indicates that a significantly higher proportion of epithelial cells in tumor tissue are expressing these cell cycle-related genes.
- Statistical Significance: All observed differences are highly statistically significant, as indicated by the very low p-values (e.g., MAD2L2 with p=3.33e-10, FZR1 with p=3.84e-10, CCND1 with p=8.77e-09, MYC with p=1.67e-07).
- Magnitude of Change: The median "expressing cell fraction" in Tumor samples is often several times higher than in Adj_normal samples. For instance, for MAD2L2, the median fraction in Tumor is approximately 0.3 (30%) compared to about 0.08 (8%) in Adj_normal. Similar substantial shifts are observed for genes like CCND1, MYC, and members of the Anaphase Promoting Complex (APC/C) such as ANAPC13, ANAPC7, ANAPC11, and ANAPC10.
- Reduced Spread in Normal Samples: In many cases, the box plots for "Adj_normal" samples show a tighter distribution and lower median, suggesting a more tightly regulated and quiescent state of cell cycle gene expression. In contrast, Tumor samples exhibit a wider spread and higher median, reflecting greater cellular heterogeneity and/or increased proliferation rates.
Biological Interpretation
The observed widespread upregulation of cell cycle pathway genes in Intestinal Epithelial cells from colon tumor tissue provides strong biological evidence consistent with uncontrolled cellular proliferation, a hallmark of cancer. Given that Intestinal Epithelial cells are the "Resolved tumor-origin cell type" and the presence of "Aneuploid" cells (22.6% of the total cells in the dataset), these findings directly support the inferred diagnosis of Colon Cancer.
- Activation of Proliferative Programs: The genes identified are critical components regulating progression through different phases of the cell cycle. Their increased expression fraction indicates that a larger proportion of Intestinal Epithelial cells in the tumor are actively engaged in division, rather than being in a quiescent state.
- Cyclins and CDKs: Genes like CCND1 (Cyclin D1) and CCND3 (Cyclin D3) are key regulators of G1 phase progression, while CDK1 (Cyclin-dependent kinase 1) is essential for entry into mitosis. Upregulation of these genes drives cells through checkpoints into division cycles. GeneCards: CCND1
- DNA Replication Machinery: Genes like ORC2, ORC4, MCM2, and MCM4 (Minichromosome Maintenance Complex Components) are involved in initiating and executing DNA replication. Their elevated expression signals active DNA synthesis, a prerequisite for cell division.
- Mitotic Regulators: Genes such as MAD2L2 (MAD2 mitotic arrest deficient-like 2), BUB1B (BUB1 mitotic checkpoint serine/threonine kinase B), CDC20, and components of the Anaphase Promoting Complex (APC/C) like FZR1 (CDH1), ANAPC13, ANAPC11, ANAPC10, ANAPC7, and CDC26, are crucial for proper chromosome segregation and mitotic exit. Their increased expression suggests an activated, albeit potentially error-prone, mitotic machinery. PubMed: The Anaphase-Promoting Complex/Cyclosome (APC/C)
- Transcriptional Regulators and Oncogenes: MYC is a potent proto-oncogene that promotes cell growth, proliferation, and inhibits differentiation, often deregulated in cancer. RB1 (Retinoblastoma 1) is a tumor suppressor that, when dysregulated or overcome, leads to uncontrolled cell cycle progression. TFDP1 (Transcription Factor Dp-1) and E2F4 are involved in E2F-mediated transcription, which regulates cell cycle progression. GSK3B (Glycogen Synthase Kinase 3 Beta) is involved in various cellular processes including cell proliferation and survival, often implicated in cancer when dysregulated. GeneCards: MYC
- Contribution to Aneuploidy: The dysregulation of mitotic checkpoint genes (e.g., MAD2L2, BUB1B) and APC/C components in a higher fraction of tumor cells can lead to errors in chromosome segregation, contributing to the observed aneuploidy in the tumor cell population. Aneuploidy is a common feature of colorectal cancer and is associated with genomic instability.
Clinical or Translational Implications
The pervasive upregulation of cell cycle pathway genes in Intestinal Epithelial cells of colon tumors has significant clinical and translational implications:
- Biomarker Potential: The identified genes could serve as biomarkers for early detection, prognosis, or monitoring of therapeutic response in colon cancer. High expression of specific cell cycle drivers or regulators might indicate more aggressive tumor behavior.
- Therapeutic Targets: Components of the cell cycle machinery are well-established targets for anti-cancer therapies. The consistent and significant upregulation of these genes in tumor-origin epithelial cells suggests that inhibiting these pathways could be an effective strategy for treating colon cancer. For example, CDK inhibitors are already used in various cancers. Identifying the most consistently and highly upregulated genes or pathways can guide the selection of targeted therapies.
- Understanding Tumor Progression: These findings provide insights into the molecular mechanisms driving tumor growth in colon cancer, particularly within the malignant epithelial component. Understanding which specific cell cycle components are most affected can help unravel the unique vulnerabilities of colon cancer cells.
20. Gene Ontology (GSA) Analysis for Intestinal Epithelial Cells in Colon Cancer
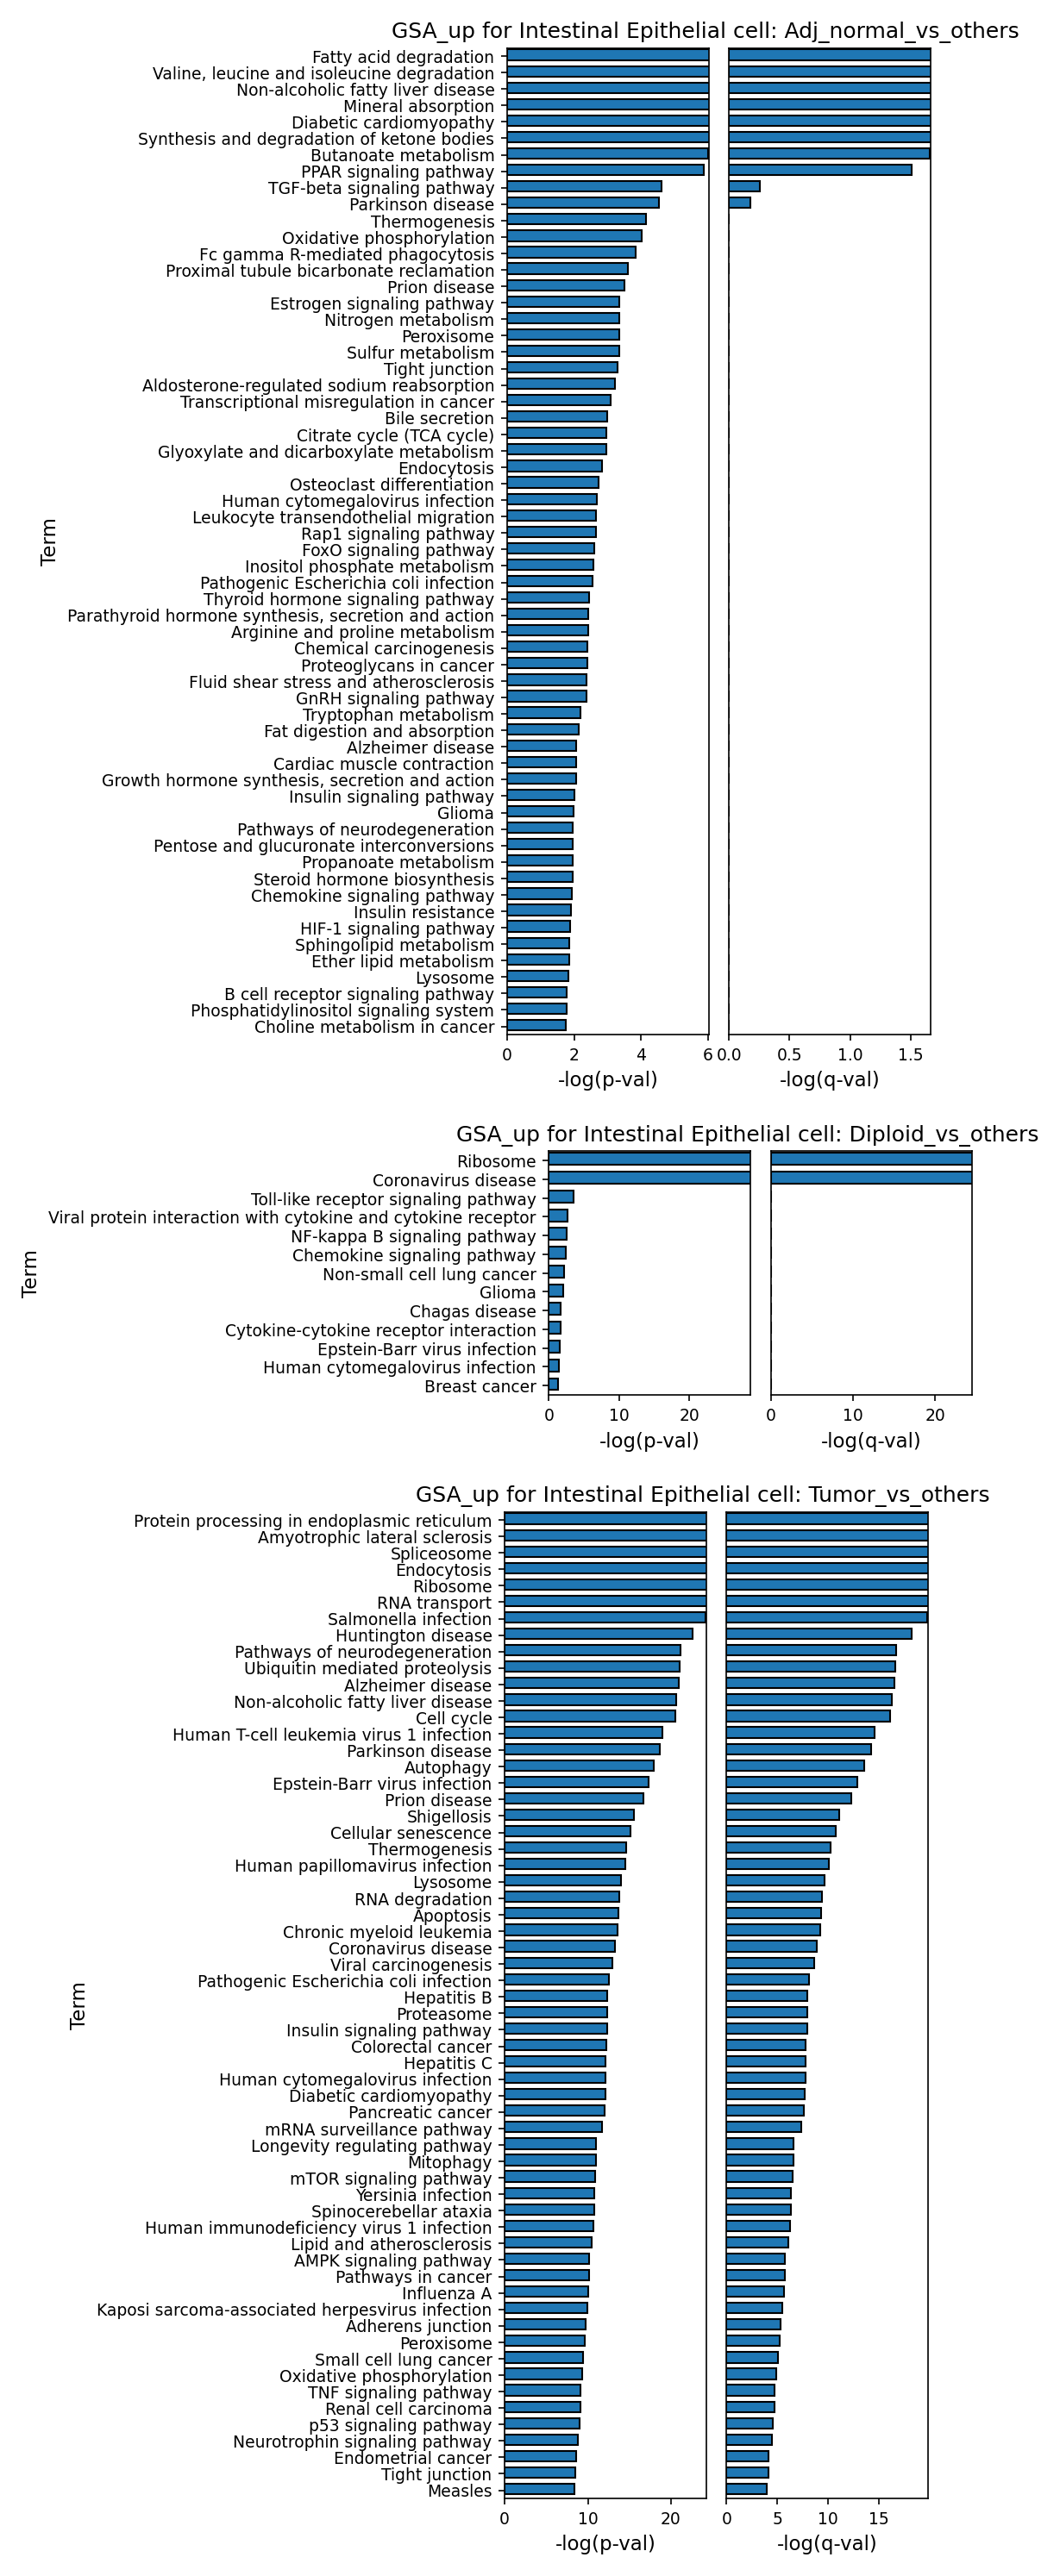
[Analysis Visualization Results]...
Analysis Overview
This analysis presents Gene Ontology (GO) enrichment results, specifically Gene Set Analysis (GSA), for Intestinal Epithelial cells. The goal is to identify biological pathways and processes that are significantly upregulated in specific cellular contexts within the colon tissue: 'Adj_normal' (adjacent normal tissue), 'Diploid' (cells identified as diploid), and 'Tumor' (cells from tumor tissue), each compared to 'others' within the dataset. These comparisons illuminate the distinct functional states of Intestinal Epithelial cells under varying physiological and pathological conditions, with a focus on Colon Cancer.
Visual Summary
The provided visualizations are three bar plots, each displaying the top significantly enriched Gene Ontology terms for Intestinal Epithelial cells under different comparative conditions, sorted by -log(p-val) and showing corresponding -log(q-val):
- GSA_up for Intestinal Epithelial cell: Adj_normal_vs_others: This plot highlights pathways upregulated in Intestinal Epithelial cells from adjacent normal colon tissue. The most prominent terms are related to metabolic processes, including various forms of fatty acid, amino acid (valine, leucine, isoleucine), and ketone body metabolism, as well as mineral absorption. Signaling pathways like PPAR and TGF-beta are also highly enriched.
- GSA_up for Intestinal Epithelial cell: Diploid_vs_others: This plot shows pathways upregulated in diploid Intestinal Epithelial cells. The top terms include "Ribosome", indicating active protein synthesis, alongside several immune and inflammation-related pathways such as "Coronavirus disease" (a general disease category often reflecting immune response pathways), "Toll-like receptor signaling pathway", "Viral protein interaction with cytokine and cytokine receptor", "NF-kappa B signaling pathway", and "Chemokine signaling pathway".
- GSA_up for Intestinal Epithelial cell: Tumor_vs_others: This plot displays pathways upregulated in Intestinal Epithelial cells from tumor tissue. There is a strong enrichment for fundamental cellular processes related to protein synthesis, processing, and degradation, including "Protein processing in endoplasmic reticulum", "Spliceosome", "Endocytosis", "Ribosome", "RNA transport", and "Ubiquitin mediated proteolysis". Pathways related to cellular stress responses like "Autophagy" and "Cellular senescence" are also prominent. Several cancer-specific and broader disease terms, along with crucial signaling pathways (e.g., NF-kappa B, TNF, p53 signaling), are enriched, indicating a shift towards a highly active and dysregulated state.
Biological Interpretation
The Gene Ontology analysis reveals distinct functional profiles for Intestinal Epithelial cells depending on their tissue origin and ploidy status, reflecting significant biological shifts associated with Colon Cancer:
- Normal Epithelial Function (Adj_normal_vs_others): The enrichment of metabolic pathways (fatty acid, amino acid, ketone body metabolism, butanoate metabolism) and mineral absorption in 'Adj_normal' Intestinal Epithelial cells underscores their primary physiological roles in nutrient processing and maintaining gut homeostasis. The presence of PPAR and TGF-beta signaling pathways highlights their involvement in regulating metabolism, inflammation, and cellular differentiation, essential for the normal functioning and integrity of the intestinal lining PubMed search: PPAR signaling intestine, PubMed search: TGF-beta signaling intestinal epithelium.
- Baseline Cellular Activity and Immune Surveillance (Diploid_vs_others): The upregulation of "Ribosome" pathways in diploid Intestinal Epithelial cells suggests a baseline level of active protein synthesis, vital for normal cell maintenance and function. The strong enrichment of immune-related pathways like "Toll-like receptor signaling pathway", "NF-kappa B signaling pathway", and "Chemokine signaling pathway" indicates that diploid intestinal epithelial cells are active participants in the local immune response and host defense against pathogens or environmental stimuli PubMed search: intestinal epithelial cells immune response. This may represent the fundamental immune readiness of healthy or near-healthy cells within the complex gut microenvironment.
- Tumor-associated Dysregulation and Proliferation (Tumor_vs_others): In contrast, Intestinal Epithelial cells from 'Tumor' tissue exhibit a profound shift in their molecular landscape. The intense enrichment of pathways involved in "Protein processing in endoplasmic reticulum", "Ribosome", "Spliceosome", "RNA transport", and "Ubiquitin mediated proteolysis" signifies a highly activated cellular factory, characteristic of rapidly proliferating cancer cells that demand elevated rates of protein synthesis, folding, and degradation to support their unchecked growth and division PubMed search: protein synthesis cancer. The presence of "Autophagy" and "Cellular senescence" suggests cellular stress responses that can be activated in oncogenesis, either as tumor-suppressive mechanisms or adapted by cancer cells for survival PubMed search: autophagy cancer. The enrichment of key oncogenic signaling pathways such as "NF-kappa B signaling pathway", "TNF signaling pathway", "p53 signaling pathway", and "HIF-1 signaling pathway" directly points to mechanisms driving tumor progression and survival in colon cancer PubMed search: NF-kB p53 colon cancer. The appearance of several infection-related terms could suggest an altered inflammatory microenvironment or immune evasion strategies employed by tumor cells.
Overall, the GSA results clearly delineate the functional divergence from a metabolically active and immune-responsive healthy state to a highly proliferative, stressed, and oncogenically active state in tumor-derived Intestinal Epithelial cells.
Clinical or Translational Implications
The distinct pathway enrichments observed in tumor-derived Intestinal Epithelial cells offer valuable insights for potential therapeutic strategies in Colon Cancer:
- Targeting Metabolic Reprogramming: The marked upregulation of protein synthesis, processing, and degradation pathways in tumor cells highlights their high metabolic demand. Targeting components of the ribosome, endoplasmic reticulum, or proteasome could disrupt tumor growth and viability.
- Modulating Oncogenic Signaling: The significant enrichment of "NF-kappa B signaling pathway", "TNF signaling pathway", "p53 signaling pathway", and "HIF-1 signaling pathway" points to these as critical drivers of colon cancer progression. Therapeutic interventions aimed at modulating these pathways (e.g., NF-κB inhibitors, p53 reactivators) could be highly effective in controlling tumor growth and sensitizing cells to other treatments GeneCards: NFKB1.
- Understanding Tumor Microenvironment: The presence of immune and infection-related pathways, alongside stress responses, suggests complex interactions within the tumor microenvironment. This could inform immunotherapeutic approaches or strategies to alleviate cellular stress and inflammation within the tumor.
21. Gene Set Enrichment Analysis Across Colon Cancer Cell Types
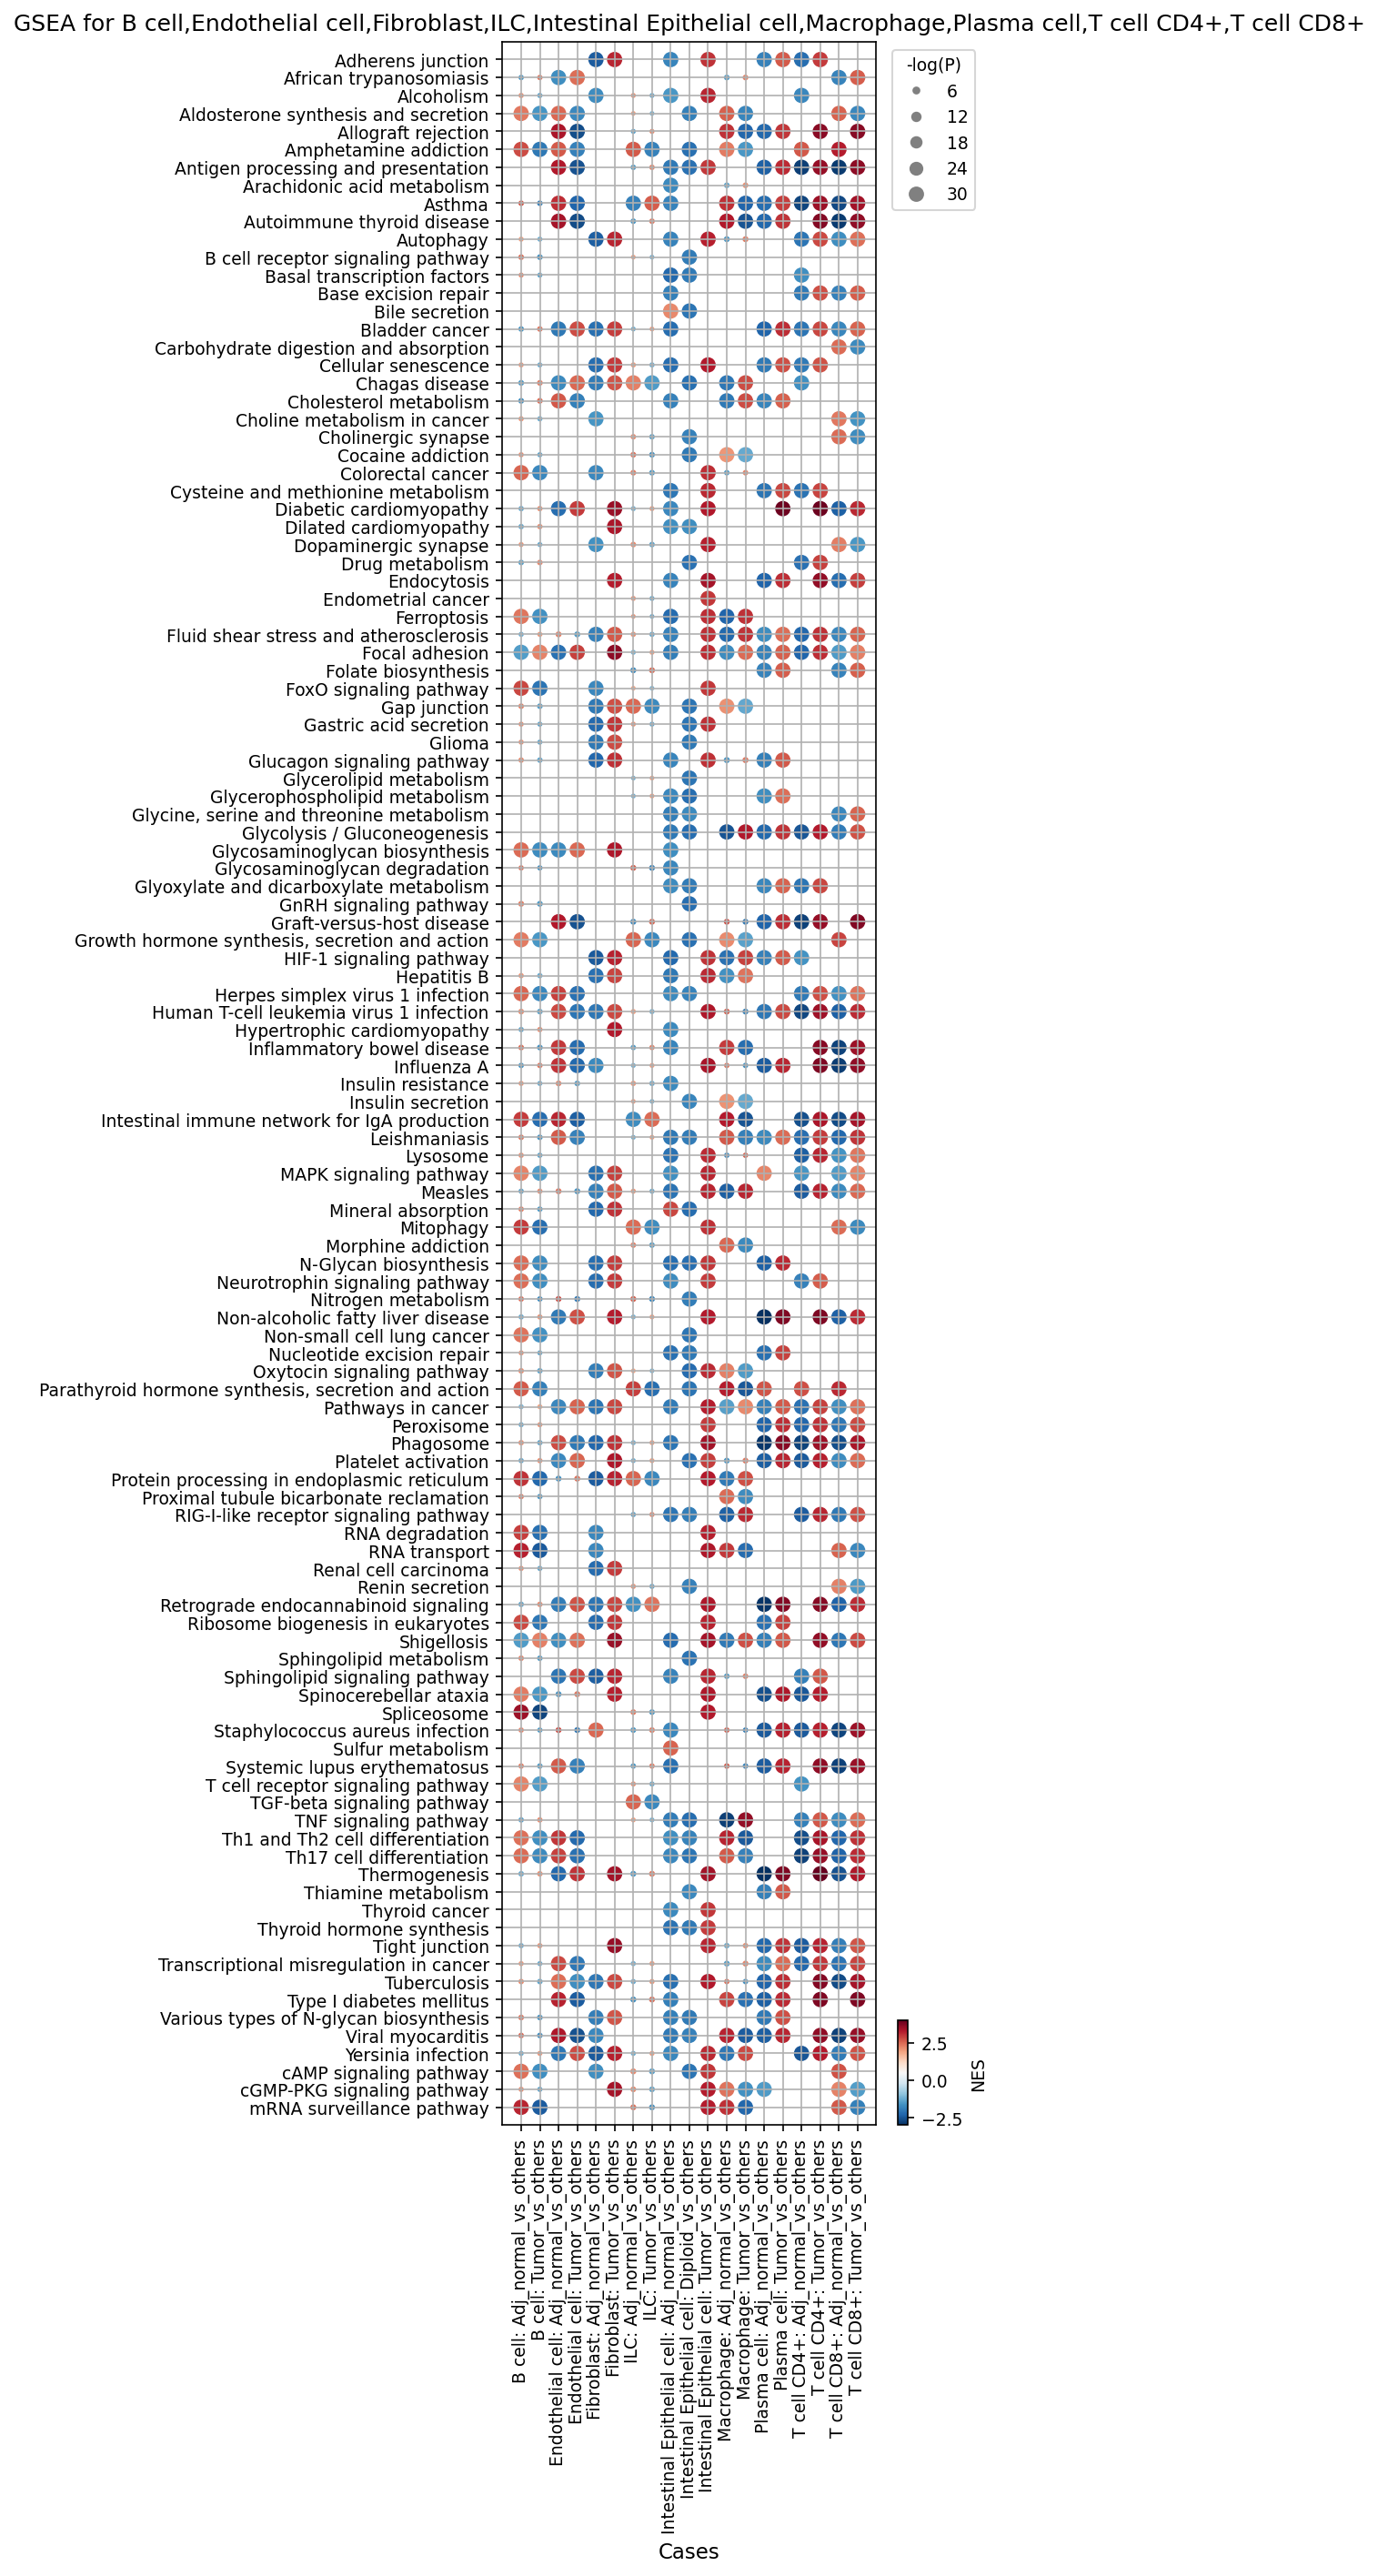
[Analysis Visualization Results]...
Analysis Overview
This analysis presents Gene Set Enrichment Analysis (GSEA) results for various cell types found in human colon tissue, comparing gene expression profiles between 'Tumor' and 'Adj_normal' conditions. The results are visualized as a dot plot, where each dot represents the enrichment of a specific gene set (pathway) within a given cell type and condition. The color of the dot indicates the Normalized Enrichment Score (NES), with red signifying enrichment (upregulation of genes in the pathway) and blue indicating depletion (downregulation of genes in the pathway) in the test condition relative to the reference. The size of the dot reflects the statistical significance, specifically -log(p-value), with larger dots denoting higher significance. The reference condition for these comparisons is 'Adj_normal' tissue.
Visual Summary
The dot plot effectively illustrates distinct pathway enrichment patterns across different cell types and conditions.
- Clear Condition-Specific Patterns: For most cell types, there are noticeable differences in pathway enrichment between the 'Adj_normal_vs_others' and 'Tumor_vs_others' columns. Red dots (positive NES) are more prevalent in 'Tumor_vs_others' columns for many cancer-associated pathways, while blue dots (negative NES) or red dots for normal physiological functions are often seen in 'Adj_normal_vs_others' columns.
- Metabolic Reprogramming is Widespread: Pathways related to altered metabolism, such as "HIF-1 signaling pathway" and "Glycolysis / Gluconeogenesis", show strong and significant enrichment (large red dots) in 'Tumor_vs_others' comparisons across a broad range of cell types, including Intestinal Epithelial cells, Fibroblasts, Endothelial cells, Macrophages, and T cells. Conversely, "Oxidative phosphorylation" often appears depleted (blue dots) in tumor cells and enriched (red dots) in adjacent normal cells.
- Immune and Inflammatory Responses: Immune cell types (Macrophages, T cells, B cells, ILC) exhibit significant enrichment in immune-related pathways in the 'Tumor_vs_others' condition. These include "TNF signaling pathway", "MAPK signaling pathway", "Cytokine-cytokine receptor interaction", "Antigen processing and presentation", and "T cell receptor signaling pathway".
- Structural and Adhesion Changes: In Intestinal Epithelial cells, pathways like "Adherens junction" and "Tight junction" are often depleted (blue dots) in the 'Tumor_vs_others' comparison, but enriched (red dots) in 'Adj_normal_vs_others'. Conversely, "Focal adhesion" and "ECM-receptor interaction" show enrichment in tumor-associated Fibroblasts and Endothelial cells.
- Cancer-Specific Signatures: "Pathways in cancer" and "Transcriptional misregulation in cancer" are notably enriched in Intestinal Epithelial cells and also appear in other stromal and immune cells in the 'Tumor_vs_others' context.
Biological Interpretation
The GSEA results provide robust biological insights into the cellular and molecular changes occurring in colon cancer.
- Hallmarks of Cancer – Metabolic Reprogramming: The consistent enrichment of the HIF-1 signaling pathway and Glycolysis / Gluconeogenesis across tumor-associated epithelial, stromal, and immune cells highlights a profound metabolic shift characteristic of the Warburg effect in cancer. This switch to aerobic glycolysis provides building blocks for rapid cell proliferation and adaptation to the hypoxic tumor microenvironment. Conversely, the depletion of oxidative phosphorylation suggests a reduced reliance on mitochondrial respiration in many tumor-associated cells. PubMed search: Warburg effect cancer metabolism
- Tumor Microenvironment Remodeling:
- Intestinal Epithelial Cells: As the resolved tumor-origin cell type, these cells show direct enrichment in "Pathways in cancer" and "Transcriptional misregulation in cancer," along with depletion of cell-cell adhesion pathways ("Adherens junction", "Tight junction"). This indicates epithelial-mesenchymal transition (EMT), a process critical for cancer invasion and metastasis.
- Fibroblasts (CAFs): Enrichment in "Focal adhesion" and "ECM-receptor interaction" suggests activated cancer-associated fibroblasts (CAFs) actively remodeling the extracellular matrix (ECM), which promotes tumor growth, invasion, and metastasis. CAFs also exhibit elevated HIF-1 signaling and glycolysis, indicating their metabolic contribution to the tumor. PubMed search: cancer associated fibroblasts ECM remodeling
- Endothelial Cells: Enrichment in "HIF-1 signaling pathway" and pathways related to angiogenesis underscores the robust formation of new blood vessels essential for tumor growth and nutrient supply.
- Immune Landscape in the Tumor:
- Macrophages: Strong enrichment in "Phagosome", "Lysosome", "Antigen processing and presentation", and inflammatory pathways (e.g., "TNF signaling pathway") suggests an activated state, likely representing tumor-associated macrophages (TAMs). TAMs can adopt diverse phenotypes, often contributing to immune suppression and tumor progression (e.g., M2-like polarization) in colon cancer.
- T cells (CD4+, CD8+) and ILC: Activation of "T cell receptor signaling pathway" and pathways related to T helper cell differentiation (Th1, Th2, Th17) in the tumor context indicates active immune responses. However, depending on the specific context, these responses can either be anti-tumorigenic or contribute to immune evasion and chronic inflammation.
- B cells and Plasma cells: Enrichment in B cell receptor signaling and protein processing in plasma cells points to active humoral immunity within the tumor microenvironment, which can have complex and context-dependent roles in cancer.
- Dysregulated Signaling Pathways: Prominent enrichment of MAPK signaling pathway and TNF signaling pathway across multiple cell types in the tumor suggests widespread activation of inflammatory and proliferative signaling cascades, contributing to tumor progression and immune modulation.
Clinical or Translational Implications
The comprehensive GSEA findings offer several potential clinical and translational implications for Colon Cancer:
- Therapeutic Targeting of Metabolism: The pervasive enrichment of HIF-1 signaling and glycolysis pathways across diverse tumor and stromal cells suggests that targeting these metabolic vulnerabilities could be a broad therapeutic strategy. Inhibitors of glycolysis or HIF-1 signaling might effectively suppress tumor growth and modulate the microenvironment.
- Modulating the Tumor Microenvironment: Pathways related to ECM remodeling in fibroblasts and angiogenesis in endothelial cells present opportunities for stroma-targeting therapies aimed at disrupting the pro-tumorigenic support system.
- Immunotherapy Enhancement: The distinct immune pathway enrichments in macrophages and T cells highlight the complex immune landscape. Strategies to reprogram pro-tumorigenic TAMs (e.g., from M2 to M1 phenotype) or to enhance effective anti-tumor T cell responses could improve immunotherapy outcomes. For example, understanding T cell differentiation patterns could guide adoptive cell therapies or checkpoint blockade.
- Biomarker Discovery: The identified significantly enriched/depleted pathways could serve as diagnostic or prognostic biomarkers. For instance, high expression of glycolysis-related genes or specific changes in adhesion molecules might indicate disease progression or aggressiveness.
- Understanding Treatment Resistance: The observed metabolic adaptations and inflammatory signaling could contribute to treatment resistance, providing insights into mechanisms that could be overcome by combination therapies.
22. Discussion
The comprehensive single-cell analysis of human colon tissue provides profound insights into the complex cellular and molecular reprogramming that characterizes the colon cancer microenvironment (TME). Malignant Intestinal Epithelial cells, unequivocally identified as the tumor origin through their widespread aneuploidy and extensive copy number variations (CNVs), are at the forefront of this transformation. Recurrent amplifications in regions containing oncogenes like *EGFR* (7p13:7q21.11), *EIF3E*, *GSDMD*, and *TPD52* (8p21.13:9p24.1) signify critical genomic drivers of malignancy. These tumor cells exhibit pervasive upregulation of cell cycle genes such as *CCND1*, *MYC*, and *MAD2L2*, indicative of uncontrolled proliferation. Furthermore, Gene Ontology and GSEA reveal a strong enrichment in protein synthesis, processing, and degradation pathways, along with metabolic reprogramming (e.g., HIF-1 signaling, glycolysis) and depletion of cell-cell adhesion pathways (e.g., adherens and tight junctions), collectively pointing to an invasive and highly active cancerous phenotype.
The immune microenvironment undergoes a significant dysregulation, characterized by a dramatic increase in immunosuppressive T cell populations. Both Regulatory T cells (Tregs) and T helper 17 (Th17) cells are significantly elevated in tumor samples, suggesting a compromised anti-tumor immune response. Macrophages within the TME display a distinct polarization shift: a significant decrease in M2D macrophages, coupled with a notable increase in pro-tumorigenic M2B and M2C subsets. Tumor-associated macrophages (TAMs) also upregulate markers such as MRC1 (CD206), GPNMB, and TREM2, further reinforcing their M2-like, pro-tumorigenic phenotype. CD4+ T cells in the tumor express activation and exhaustion markers like TNFRSF4 (OX40), TNFRSF18 (GITR), and the inhibitory checkpoint receptor TIGIT, indicating a chronic state of immune stimulation coupled with functional impairment.
Cell-cell interaction (CCI) analyses further delineate the intricate communication networks driving tumor progression. The tumor microenvironment is permeated by prominent immune checkpoint interactions, including PDL1-PDCD1 and CD86-CTLA4, underscoring active immune evasion mechanisms. Widespread prostaglandin E2 (PGE2) signaling, originating from stromal and immune cells and acting on T cells, contributes significantly to immune suppression. Moreover, the TME is characterized by profound stromal remodeling and pro-angiogenic signaling. Cancer-associated fibroblasts (CAFs) display a distinct surfaceome signature, including key markers like FAP, PDGFRA/B, ITGAV, CD276 (B7-H3), NOTCH3, and LPAR1, reflecting their activated state. These CAFs, along with other TME components, engage in extensive collagen-integrin interactions, leading to extracellular matrix remodeling. Furthermore, VEGFA-VEGFR and CXCL12-CXCR4 axes are highly active, promoting angiogenesis and facilitating tumor cell migration and metastasis. The observed loss of CDH1 (E-cadherin) self-interaction in aneuploid epithelial cells, contrasted with its strong presence in normal tissue, is a clear signature of epithelial-mesenchymal transition (EMT), a critical process in cancer invasion and metastasis. The overall data paints a picture of a highly collaborative TME where malignant epithelial cells, reprogrammed immune cells, and activated stromal components collectively foster an environment conducive to tumor growth, immune evasion, and metastatic potential.
Hypotheses:
- Aberrant EGFR signaling and dysregulated cell cycle gene activation in aneuploid Intestinal Epithelial cells are primary drivers of colon tumor growth and genomic instability, dictating tumor cell proliferation and survival.
- The sustained increase in immunosuppressive regulatory T cells (Tregs) and pro-tumorigenic M2B/M2C macrophages creates an immune-privileged environment, actively promoting immune evasion and tumor progression in colon cancer.
- Cancer-Associated Fibroblasts (CAFs), through extensive extracellular matrix remodeling (e.g., collagen-integrin interactions) and activation of specific signaling pathways (e.g., PDGF, Notch), serve as key orchestrators of tumor cell invasion, angiogenesis, and immune suppression.
- The pervasive metabolic reprogramming, evidenced by enriched HIF-1 signaling and glycolysis across tumor, stromal, and immune cells, represents a central adaptive mechanism fueling rapid tumor growth and establishing an immunosuppressive TME in colon cancer.
- The loss of epithelial integrity markers like CDH1 and the emergence of pro-invasive surfaceome markers on aneuploid Intestinal Epithelial cells facilitate epithelial-mesenchymal transition and metastatic dissemination in colon cancer.
Potential therapeutic targets:
- EGFR signaling (including ERBB3): EGFR is frequently amplified and robustly activated by multiple ligands (AREG, HBEGF, EREG, TGFA) in aneuploid Intestinal Epithelial cells, driving tumor proliferation, survival, and metastasis. ERBB3, a key heterodimerization partner, is also highly expressed on tumor epithelial cells, mediating resistance to therapy. Evidence: CNV analysis shows recurrent amplification of 7p13:7q21.11 (EGFR) in tumor samples (Section 4). CCI analysis reveals high AREG-EGFR, HBEGF-EGFR, EREG-EGFR, TGFA-EGFR activity within aneuploid epithelial cells (Section 13). Surfaceome marker analysis confirms high expression of ERBB3 on tumor Intestinal Epithelial cells (Section 15). Validation: Assess efficacy of anti-EGFR monoclonal antibodies (e.g., Cetuximab, Panitumumab) or multi-HER inhibitors (e.g., Patritumab deruxtecan targeting ERBB3) in colon cancer models or clinical trials, particularly for patients with EGFR amplification or overexpression. Evaluate combination strategies to overcome resistance.
- FAP (Fibroblast Activation Protein alpha): FAP is a hallmark marker of activated cancer-associated fibroblasts (CAFs), involved in extracellular matrix (ECM) remodeling, promoting tumor invasion, angiogenesis, and immunosuppression. Its activity contributes to the desmoplastic reaction in colon cancer. Evidence: FAP is prominently expressed in tumor fibroblasts (CAFs) but not in adjacent normal fibroblasts (Section 17). Validation: Evaluate FAP-targeting strategies (e.g., FAP-specific antibodies, FAP-directed CAR-T cell therapy, FAP-targeted radioligand therapy) in colon cancer models to deplete CAFs, normalize ECM, and enhance anti-tumor immunity. Combine with conventional chemotherapy or immune checkpoint blockade.
- PDGFRA/B (Platelet-Derived Growth Factor Receptors Alpha/Beta): PDGFRs are receptor tyrosine kinases that are critical drivers of fibroblast proliferation, migration, and activation in response to PDGF ligands secreted by tumor cells and other stromal cells, leading to robust CAF expansion and matrix production. Evidence: PDGFRA and PDGFRB are significantly upregulated in tumor fibroblasts (CAFs) compared to normal fibroblasts (Section 17). Validation: Test tyrosine kinase inhibitors (TKIs) that inhibit PDGFR activity (e.g., Imatinib, Sorafenib, Regorafenib) in preclinical models to assess reduction in CAF activity, ECM stiffness, and tumor growth. Investigate combination therapies to improve efficacy.
- CD47: CD47 is a 'don't eat me' signal, overexpressed on tumor Intestinal Epithelial cells, allowing them to evade phagocytosis by innate immune cells like macrophages, thereby promoting tumor survival and progression. Evidence: CD47 is significantly upregulated on tumor Intestinal Epithelial cells compared to normal epithelial cells (Section 15). Validation: Test anti-CD47 antibodies (e.g., Magrolimab) in preclinical models or clinical trials to block immune evasion and promote phagocytosis of colon cancer cells. Explore combination with other immunotherapies.
- MRC1 (CD206), GPNMB, and TREM2 (Macrophage-associated): These markers are highly upregulated on tumor-associated macrophages (TAMs), characterizing pro-tumorigenic M2-like phenotypes that promote tumor growth, angiogenesis, and immune suppression. Targeting them could deplete or reprogram these harmful TAMs. Evidence: MRC1 (CD206), GPNMB, and TREM2 are significantly upregulated on macrophages in tumor samples compared to adjacent normal tissue (Section 16). Validation: Develop and test antibody-drug conjugates (ADCs) or specific blocking antibodies against MRC1, GPNMB (e.g., Glembatumumab vedotin for GPNMB), or TREM2 to selectively deplete or reprogram pro-tumorigenic TAMs in colon cancer models. Assess their impact on tumor growth and immune microenvironment.
- TIGIT (T-cell immunoreceptor with Ig and ITIM domains): TIGIT is an inhibitory immune checkpoint receptor highly expressed on CD4+ T cells in the tumor, contributing to T cell exhaustion and immunosuppression, a hallmark of chronic antigen exposure in cancer. Evidence: TIGIT is significantly upregulated on CD4+ T cells in tumor samples compared to adjacent normal tissue (Section 18). Validation: Evaluate anti-TIGIT antibodies, alone or in combination with anti-PD-1 therapy, in colon cancer models or clinical trials to restore anti-tumor T cell function and reverse exhaustion.
- PGE2-PTGER4 Axis: Widespread and intensified PGE2 signaling from tumor stromal cells (fibroblasts, macrophages, endothelial cells) to CD8+ T cells is profoundly immunosuppressive, inhibiting T cell proliferation, cytokine production, and cytotoxic function, thereby facilitating immune evasion. Evidence: Condition-specific CCI analysis reveals strong PGE2_byPTGES2_PTGER4 interactions in tumor, originating from multiple stromal and immune cell types (Section 14). Validation: Test COX-2 inhibitors (e.g., Celecoxib) to reduce PGE2 synthesis or PTGER4 antagonists to block PGE2 signaling, aiming to disrupt immunosuppression and enhance anti-tumor T cell responses in colon cancer.
- CXCL12-CXCR4 Axis: This chemokine axis is critical for tumor cell proliferation, survival, angiogenesis, metastasis, and the recruitment of immune-suppressive cells (e.g., Tregs, M2 macrophages) to the TME, involving broad interactions across fibroblasts, T cells, B cells, and endothelial cells. Evidence: Strong CXCL12_CXCR4 interactions are observed in tumor samples, involving fibroblasts, T cells, B cells, and endothelial cells (Section 12, 14). Validation: Evaluate CXCR4 antagonists (e.g., Plerixafor/AMD3100) to inhibit tumor cell dissemination, reduce immune-suppressive cell recruitment, and improve effector immune cell infiltration in colon cancer models and clinical settings.
- SPP1 (Secreted Phosphoprotein 1 / Osteopontin) and its Integrin Receptors: SPP1 is a pleiotropic pro-tumorigenic factor, overexpressed in various cancers. It promotes tumor cell adhesion, migration, invasion, angiogenesis, and can polarize macrophages towards an immunosuppressive phenotype by interacting with integrin receptors (e.g., αvβ1). Evidence: SPP1_integrin_avb1_complex interactions are notably enriched and strong in the tumor, involving macrophages and aneuploid Intestinal Epithelial cells (Section 12). SPP1 is also highly expressed as a surfaceome marker on tumor Intestinal Epithelial cells (Section 15). Validation: Develop and test anti-SPP1 antibodies or specific integrin inhibitors that block SPP1 binding to disrupt tumor growth, angiogenesis, and reverse immunosuppression. Evaluate in preclinical colon cancer models.
Follow-up validation ideas:
- Functional Validation of Key Oncogenes and Pathways: Employ CRISPR/Cas9 gene editing to delete, overexpress, or inhibit specific amplified genes (e.g., *EGFR*, *TPD52*) or dysregulated cell cycle components (e.g., *CCND1*, *MYC*) in 2D and 3D colon cancer cell models (e.g., organoids) to assess their impact on tumor cell proliferation, survival, and sensitivity to targeted therapies.
- Spatiotemporal Profiling of the Tumor Microenvironment: Utilize spatial transcriptomics or proteomics (e.g., GeoMx DSP, Vizgen MERSCOPE) on human colon tumor sections to map the precise localization and interaction hotspots of identified cell types (e.g., M2B macrophages, Tregs, CAFs) and key ligand-receptor pairs (e.g., SPP1-integrin, CXCL12-CXCR4, PDL1-PDCD1). This can confirm *in situ* the physical proximity and activity of interacting cells.
- In Vivo Therapeutic Efficacy Testing: Conduct *in vivo* studies using patient-derived xenograft (PDX) or syngeneic mouse models of colon cancer to test the efficacy of novel or repurposed therapeutic agents targeting the identified pathways and cell populations (e.g., anti-FAP ADCs, CXCR4 antagonists, anti-TIGIT antibodies). Evaluate tumor growth, metastasis, and changes in the TME composition (e.g., immune cell infiltration, macrophage polarization) using flow cytometry and immunohistochemistry.
- Functional Assays for Immune Cell Reprogramming: Perform *ex vivo* co-culture experiments with sorted tumor-infiltrating macrophages (e.g., MRC1+, TREM2+) and T cells (e.g., TIGIT+, OX40+) to assess the functional consequences of specific ligand-receptor interactions or cytokine milieu on T cell proliferation, cytokine production, and cytotoxic activity. Test the ability of immunomodulatory agents (e.g., PGE2 antagonists, M2-to-M1 reprogramming agents) to reverse immune suppression.
- Clinical Correlative Studies: Validate the prognostic or predictive value of identified surfaceome markers (e.g., CEACAM5, CD47, GPNMB, FAP) and altered cell population ratios (e.g., Treg/effector T cell, M2B/M2A macrophage) in independent cohorts of colon cancer patients through multiplex immunofluorescence, flow cytometry, or quantitative PCR on clinical biopsies, correlating with patient outcomes and response to therapy.
Limitations:
This report is based on a single-cell RNA-seq dataset from human colon tissue, offering a snapshot of cellular states and interactions. While extensive computational analyses were performed, interpretations are inferential and require experimental validation. The resolved tumor-origin cell type and inferred disease context are based on dataset metadata and characteristics, not clinical diagnosis. Single-cell data represents transcriptomic snapshots, and does not directly provide protein expression levels or functional dynamics in real-time. The effects of identified genes and pathways on disease progression are based on known biological roles, which can be context-dependent. The study lacks patient follow-up data or validation in independent cohorts, which would be crucial for establishing prognostic or predictive biomarkers and therapeutic efficacy.
23. Query List
- Show and save UMAPs for condition, sample, major cell type, minor cell type, ploidy_dec, and celltype_subset in two columns and save the result.
- Show major cell type scores on UMAP and save the result.
- Show and save a marker expression dot plot for celltype_subset. SET target_cell = None and var_group_rotation = 45. Leave all other arguments at their default values.
- Select Intestinal Epithelial cells, show a CNV heatmap grouped by sample together with a summary of regions with significantly amplified copy numbers, and save the results.
- Show and save UMAPs of CNV patterns colored by major cell type, minor cell type, ploidy results, condition, and sample in two columns.
- Show and save a population bar plot of minor cell types.
- Show and save a population bar plot of T cell subsets.
- Show and save box plots of T cell subset populations with statistically significant differences between conditions, if any. Choose ncols based on the total number of panels.
- Show and save a population bar plot of macrophage subsets.
- Show and save box plots of macrophage subset populations with statistically significant differences between conditions, if any. Choose ncols based on the total number of panels.
- Select Intestinal Epithelial cells, show their ploidy populations as a bar plot, and save the result.
- Show and save cell-cell interaction patterns involving Intestinal Epithelial cells, fibroblasts, macrophages, T cells, and other relevant cell types. Select at most 80 cell-cell interactions per group.
- Select only genes associated with immune checkpoint and cell cycle pathways, show cell-cell interactions for these genes, and save the result.
- Find cell-cell interactions involving major immune and stromal cells that differ significantly between conditions, show them as a dot plot, and save the result. Set max_n_items_per_group to 60. For each interaction identified under each condition, using the provided dataset context, describe the associated signaling pathways and mechanisms, its potential as a therapeutic target, and relevant therapeutic agents.
- Show marker expressions for Intestinal Epithelial cells in a dot plot, and save the result. Use only surfaceome markers, with at most 60 markers per condition. For the markers identified under each condition, distinguish between established therapeutic targets and less well-characterized markers with potential as therapeutic targets. For each marker, using the provided dataset context, describe the associated signaling pathways and mechanisms, relevant therapeutic agents, and supporting evidence.
- Show marker expressions for Macrophage cells in a dot plot, and save the result. Use only surfaceome markers, with at most 40 markers per condition. For each marker identified under each condition, using the provided dataset context, describe the associated signaling pathways, the role of the corresponding cell type in the tumor microenvironment, the marker’s potential as a therapeutic target, relevant therapeutic agents, and other pertinent information.
- Show marker expressions for Fibroblast cells in a dot plot, and save the result. Use only surfaceome markers, with at most 40 markers per condition. For each marker identified under each condition, using the provided dataset context, describe the associated signaling pathways, the role of the corresponding cell type in the tumor microenvironment, the marker’s potential as a therapeutic target, relevant therapeutic agents, and other pertinent information.
- Show marker expressions for T cell CD4+ cells in a dot plot, and save the result. Use only surfaceome markers, with at most 40 markers per condition. For each marker identified under each condition, using the provided dataset context, describe the associated signaling pathways, the role of the corresponding cell type in the tumor microenvironment, the marker’s potential as a therapeutic target, relevant therapeutic agents, and other pertinent information.
- Among cell cycle pathway genes, select those with statistically significant expression differences between conditions in Intestinal Epithelial cells, show box plots, and save the result. Set max_n_items_to_plot to 24 and choose ncols based on the total number of panels for an overall width-to-height ratio of approximately 2:3.
- Show and save Gene Ontology (GSA) analysis results for Intestinal Epithelial cells as a bar plot.
- Show Gene Set Enrichment Analysis results as a dot plot, and save it. Set the color map to RdBu_r, n_pws_to_show to 120, and target_cells to None.