Single-Cell Transcriptomic and Genomic Landscape of Colorectal Cancer Progression and Tumor Microenvironment Rewiring
This report details a comprehensive single-cell RNA sequencing analysis of human colon tissue, comparing colorectal tumor samples with adjacent normal tissue. We identify malignant intestinal epithelial cells through their high aneuploidy and marked expansion within tumors. Our findings highlight significant shifts in the tumor microenvironment, including a strong immunosuppressive T cell profile and a pro-tumorigenic macrophage and fibroblast landscape, alongside widespread dysregulation of cell cycle and oncogenic pathways in cancer cells.
Contents
- Dataset overview
- UMAP Visualization of Single-Cell RNA-seq Data by Condition, Sample, Cell Type, and Ploidy
- Major Cell Type Score and Ploidy Distribution on UMAP
- Celltype Subset Marker Expression for Annotation Validation
- Copy Number Variation Analysis in Diploid Intestinal Epithelial Cells from Colon Tumor and Adjacent Normal Samples
- UMAP Visualization of Cell Populations with CNV Patterns
- Cell Type Population Analysis in Colon Tumor vs. Adjacent Normal Tissue
- Colon Cancer Immune Landscape: T Cell Subtype Shifts in Tumor Microenvironment
- Colon Cancer Immune Landscape: Shifts in T cell and ILC Subpopulations
- Macrophage Cell Population Check
- Macrophage Subset Population Shifts in Colon Tumor Microenvironment
- Ploidy Analysis of Intestinal Epithelial Cells in Colon Cancer
- Colon Cancer Cell-Cell Interaction Patterns by Condition
- Tumor Microenvironment Cell-Cell Interaction Analysis
- Colon Cancer Microenvironment: Immune Checkpoint and Cell Cycle Gene-Mediated Cell-Cell Interactions
- Condition-Specific Cell-Cell Interaction Patterns in Colon Cancer
- Intestinal Epithelial Cell Condition-Specific Surfaceome Markers in Colon Cancer
- Macrophage Condition-Specific Surfaceome Markers in Colon Tissue
- Fibroblast Condition-Specific Surfaceome Markers in Colon Tissue
- T cell CD4+ Condition-Specific Surfaceome Markers in Colon Tissue
- Dysregulation of Cell Cycle Genes in Intestinal Epithelial Cells from Colon Cancer
- Gene Ontology (GSA) Analysis of Intestinal Epithelial Cells Across Conditions
- GSEA for Colon Cancer Cell Types: Pathway Enrichment in Tumor Microenvironment and Aneuploidy
- Discussion
- Query List
0. Dataset overview
Dataset Summary
- Data Type: Single-cell RNA-seq data processed by SCODA, stored as an AnnData object.
- Dimensions: Contains 63,689 cells and 23,387 genes.
- Species & Tissue: Human, from Colon tissue.
- Conditions: The dataset includes two primary conditions: 'Tumor' and 'Adj_normal'.
- Cell Type Annotations: Cells are annotated at multiple hierarchical levels:
- celltype_major: Intestinal Epithelial cell, Stromal cell, Endothelial cell, B cell, Myeloid cell, T cell, Mast cell.
- celltype_minor: Intestinal Epithelial cell, Fibroblast, Endothelial cell, Smooth muscle cell, Plasma cell, Macrophage, Dendritic cell, T cell CD4+, T cell CD8+, ILC, NK cell, B cell, Mast cell.
- celltype_subset: Provides more granular cell type annotations like Goblet cell, Crypt cell, Macrophage (M1), T cell (Th1), etc.
- Tumor Origin Cell Type: Intestinal Epithelial cell is identified as the tumor origin cell type.
- Ploidy Information: Includes ploidy_dec with labels 'Aneuploid' and 'Diploid'.
- Reference Condition: 'Adj_normal' is used as the reference condition for differential expression (DEG), GSEA, and GSA (GO) analyses.
- Precomputed Results: The dataset comes with several precomputed analysis results:
- Cell-Cell Interaction (CCI): Stored in uns['CCI'] (per condition) and uns['CCI_sample'] (per sample).
- Differential Expression Genes (DEG): Results for each celltype_minor comparing one condition vs. the rest, stored in uns['DEG'].
- Gene Set Enrichment Analysis (GSEA): Results for each celltype_minor comparing one condition vs. the rest, stored in uns['GSEA'].
- Gene Ontology (GO/GSA): Results for each celltype_minor comparing one condition vs. the rest, stored in uns['GSA_up'].
- Copy Number Variation (CNV): Estimates are stored in obsm['X_cnv'].
1. UMAP Visualization of Single-Cell RNA-seq Data by Condition, Sample, Cell Type, and Ploidy
[Analysis Visualization Results]...
Analysis Overview
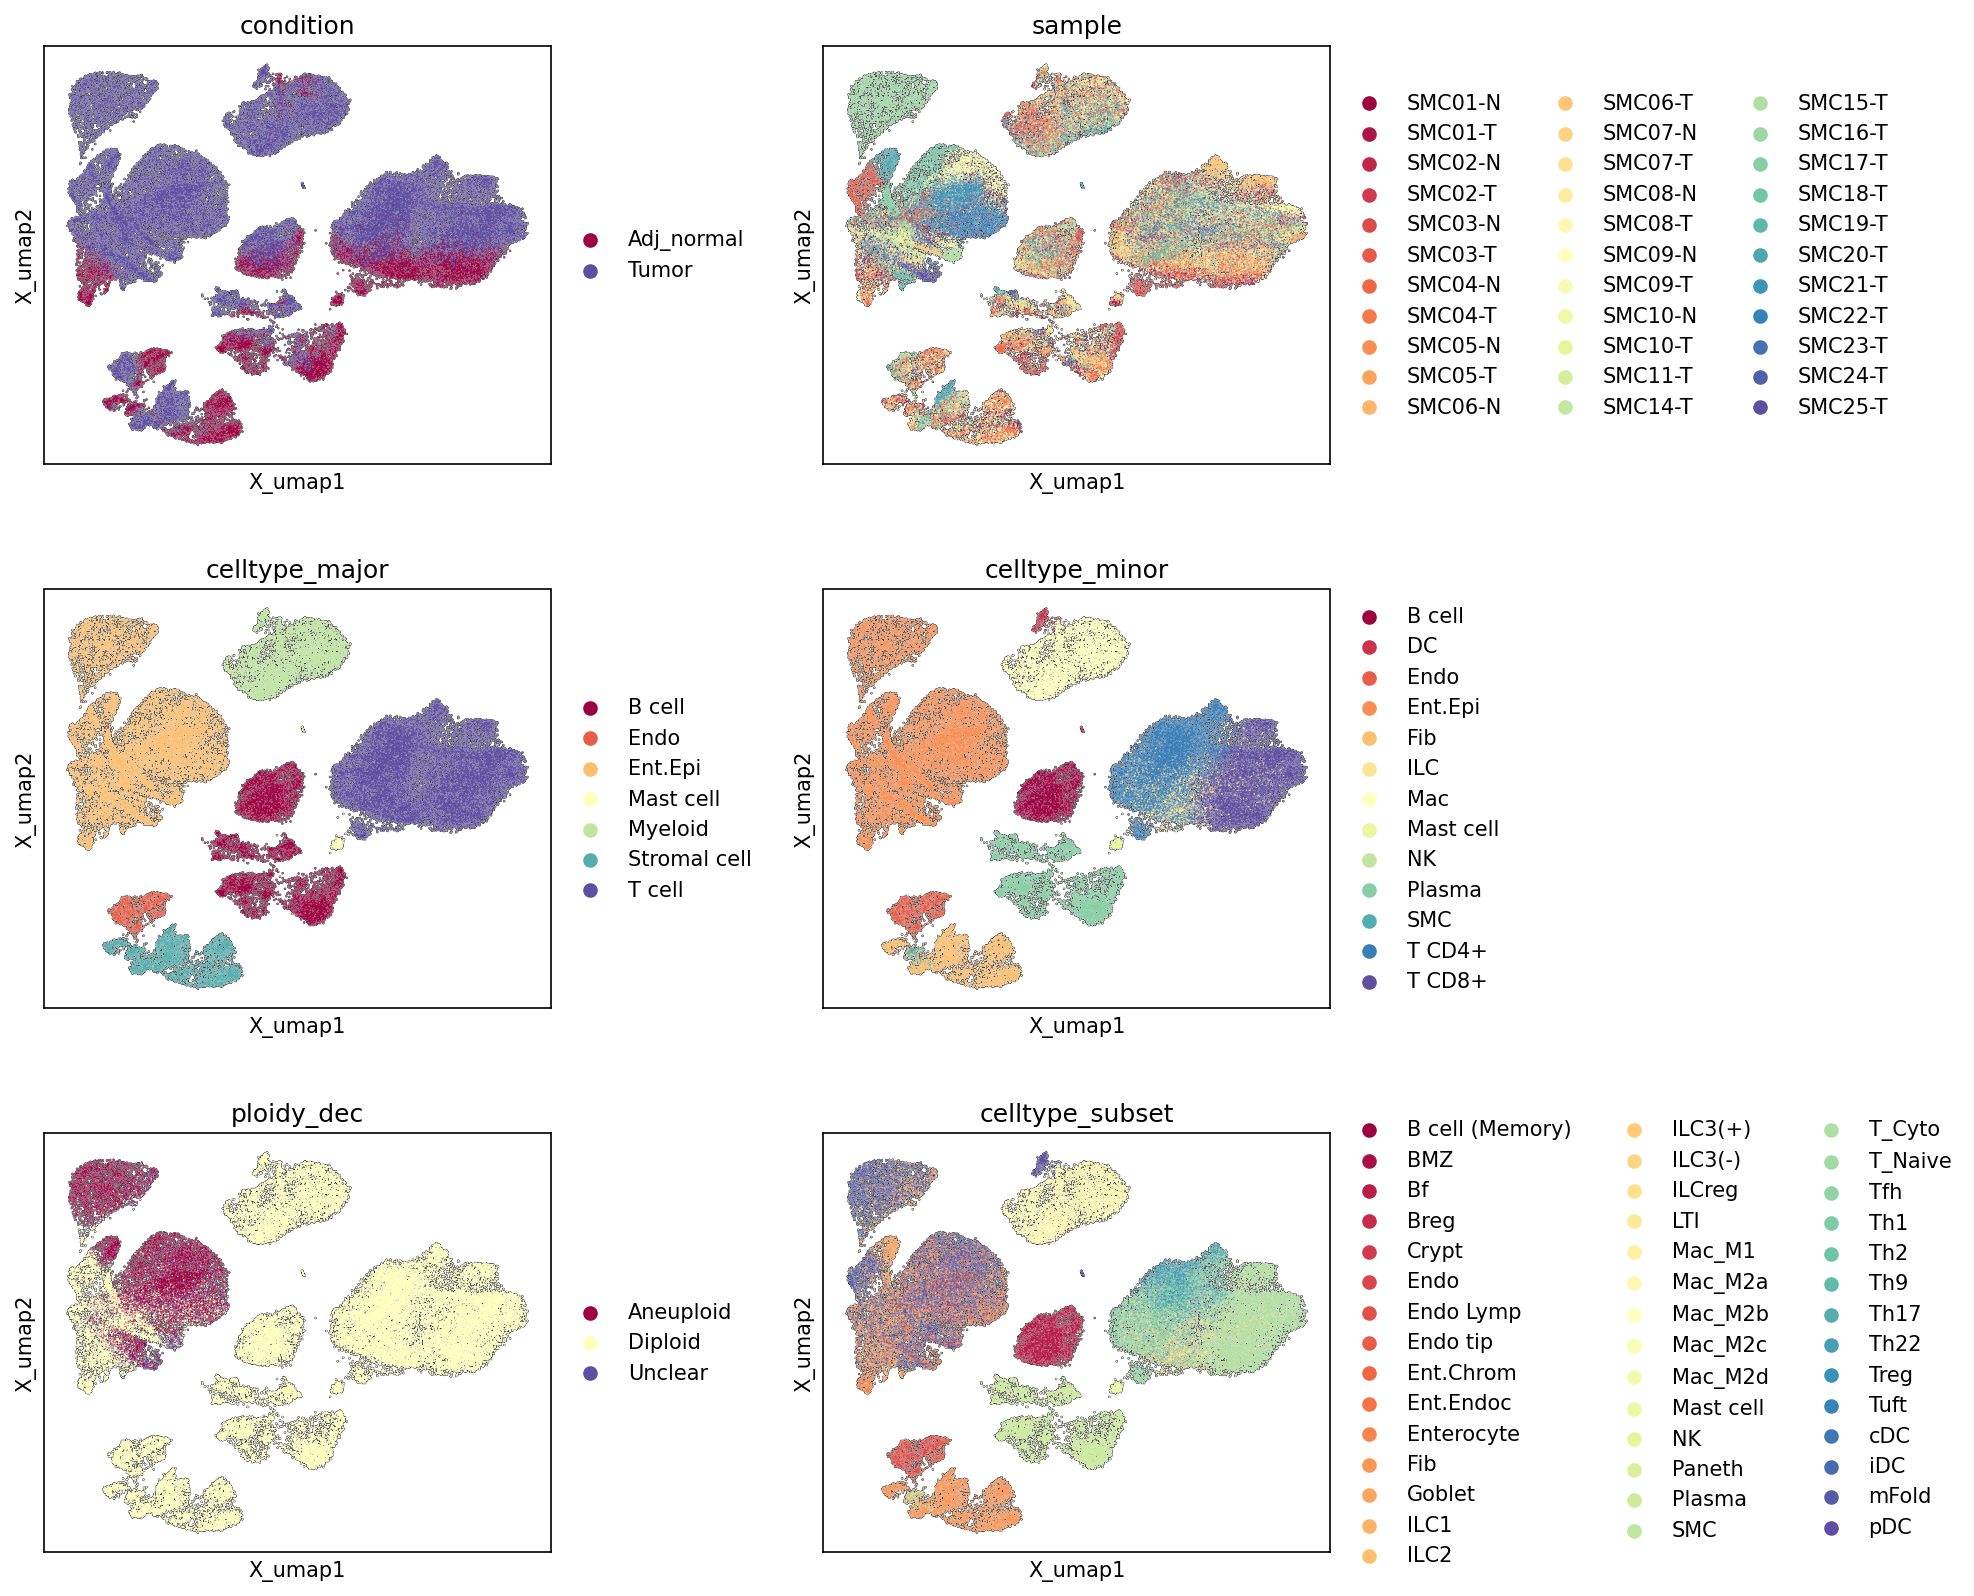
This analysis presents UMAP (Uniform Manifold Approximation and Projection) visualizations of single-cell RNA-seq data from human Colon tissue. The purpose is to explore the overall structure of the dataset, assess cell type annotation quality, visualize the distribution of cells from different conditions (Tumor vs. Adj_normal) and samples, and identify populations based on ploidy inference. The UMAPs are colored by condition, sample, celltype_major, celltype_minor, ploidy_dec, and celltype_subset to provide comprehensive insights into the cellular landscape.
Visual Summary
- Condition UMAP: The UMAP colored by condition (Adj_normal vs. Tumor) shows that while many cell populations are mixed between the two conditions, indicating shared cell types, there are also distinct regions predominantly occupied by either 'Tumor' or 'Adj_normal' cells. Notably, a large, diffuse cluster on the right-hand side and top-middle appears to be heavily enriched with 'Tumor' cells, whereas several smaller clusters, particularly on the left and bottom, contain a higher proportion of 'Adj_normal' cells.
- Sample UMAP: The sample UMAP displays a highly intermixed distribution of cells from various samples across the embedding. This indicates that the UMAP clustering is driven primarily by biological variation (cell types, conditions) rather than by batch-specific technical effects, suggesting successful integration and normalization of the data.
- Major Cell Type UMAP (celltype_major): This plot demonstrates clear segregation of major cell types into distinct clusters.
- 'Intestinal Epithelial cell' (light orange) forms a dominant cluster, particularly in the top-middle and right.
- 'T cell' (dark blue) forms another large, well-separated cluster on the right.
- 'Myeloid cell' (light green) populates several smaller, distinct clusters.
- 'Stromal cell' (cyan), 'B cell' (maroon), 'Endothelial cell' (red), and 'Mast cell' (light yellow) each occupy well-defined, smaller regions of the UMAP.
- Minor Cell Type UMAP (celltype_minor): This refined view of cell types further resolves the major clusters.
- Within the 'Intestinal Epithelial cell' compartment, it remains largely cohesive.
- The 'T cell' cluster is clearly differentiated into 'T cell CD4+' and 'T cell CD8+'.
- 'Macrophage' and 'Dendritic cell' (DC) populations are distinguished from the broader 'Myeloid cell' group.
- 'Fibroblast' and 'Smooth muscle cell' (SMC) emerge from 'Stromal cell' populations. Other distinct minor types include 'Plasma cell', 'NK cell', and 'ILC'.
- Ploidy Decision UMAP (ploidy_dec): The ploidy_dec plot highlights a strong pattern:
- 'Aneuploid' cells (maroon) are predominantly localized within the large cluster identified as 'Intestinal Epithelial cell' and largely co-localize with the 'Tumor' condition enrichment seen in the first UMAP.
- 'Diploid' cells (light yellow) are widely distributed across the entire UMAP, occupying most cell type clusters, which is expected for normal, non-malignant cells.
- 'Unclear' cells (purple) are sparse and scattered.
- Cell Type Subset UMAP (celltype_subset): This plot provides the highest resolution of cell types, revealing fine-grained populations.
- Specific subsets of epithelial cells like 'Goblet cell', 'Crypt cell', 'Enterocyte', and 'Paneth cell' are distinctly clustered within the overall epithelial compartment.
- Diverse immune cell subsets such as 'T cell (Th1)', 'T cell (Treg)', 'T cell (Cytotoxic)', 'Macrophage (M1)', and various M2 subtypes (M2A, M2B, M2C, M2D) show distinct spatial separation.
- Other specialized cells like 'Endothelial tip cell', 'Lymphatic Endothelial cell', 'Plasma cell', and different B cell and ILC subsets are also clearly resolved.
Biological Interpretation
The UMAP visualizations collectively provide a robust overview of the cellular heterogeneity in colon tissue, specifically highlighting differences between tumor and adjacent normal conditions.
- Tissue Microenvironment Complexity: The dataset captures the intricate cellular composition of the colon, resolving major immune, stromal, and epithelial compartments. The subsequent minor and subset annotations further dissect these into functionally distinct populations, such as specific T cell help populations (Th1, Th17, Treg) or macrophage polarization states (M1, M2 subtypes), which are crucial for understanding immune responses in health and disease.
- Tumor-Specific Cellular Landscape: The 'condition' UMAP, in conjunction with the 'ploidy_dec' UMAP, strongly indicates that the large 'Intestinal Epithelial cell' cluster on the right side contains the primary tumor cell population. The marked enrichment of 'Aneuploid' cells within this specific epithelial cluster, which also overlaps heavily with 'Tumor' condition cells, is a hallmark of malignancy, consistent with the Tumor origin celltype being 'Intestinal Epithelial cell' GeneCards: Aneuploidy. This finding validates the identification of cancerous cells based on their genomic instability.
- Immune and Stromal Cell Dynamics: The distinct clustering of various immune cells (T cells, B cells, Myeloid cells, ILCs, Mast cells) and stromal cells (Fibroblasts, Endothelial cells, Smooth muscle cells) across conditions implies their differential involvement in normal tissue homeostasis versus the tumor microenvironment. For instance, specific immune cell subsets might be preferentially recruited to or expanded within the tumor, contributing to anti-tumor immunity or immunosuppression. The resolution of different macrophage subtypes (M1, M2A-D) is particularly relevant, as M1 macrophages are typically pro-inflammatory and anti-tumorigenic, while M2 macrophages are often associated with immune suppression and tumor progression PubMed search: Macrophage polarization cancer.
- Epithelial Cell Heterogeneity: The fine-grained resolution of intestinal epithelial cell subsets (Goblet, Crypt, Enterocyte, Paneth, Tuft, Enteroendocrine, Enterochromaffin) within the celltype_subset UMAP underscores the normal functional zonation and differentiation pathways within the intestinal crypts. In the context of tumor, understanding how these normal epithelial states are altered or hijacked by cancerous epithelial cells is critical.
Annotation Notes
The UMAPs demonstrate high quality and consistency in cell type annotation across different levels of granularity (major, minor, subset). The clear separation of distinct cell populations in the embedding space, coupled with the biologically plausible distribution of condition and ploidy_dec labels, provides strong confidence in the cell identity assignments. The absence of significant batch effects, as evidenced by the mixed distribution of sample origins, further strengthens the reliability of the observed biological distinctions.
2. Major Cell Type Score and Ploidy Distribution on UMAP
[Analysis Visualization Results]...
Analysis Overview
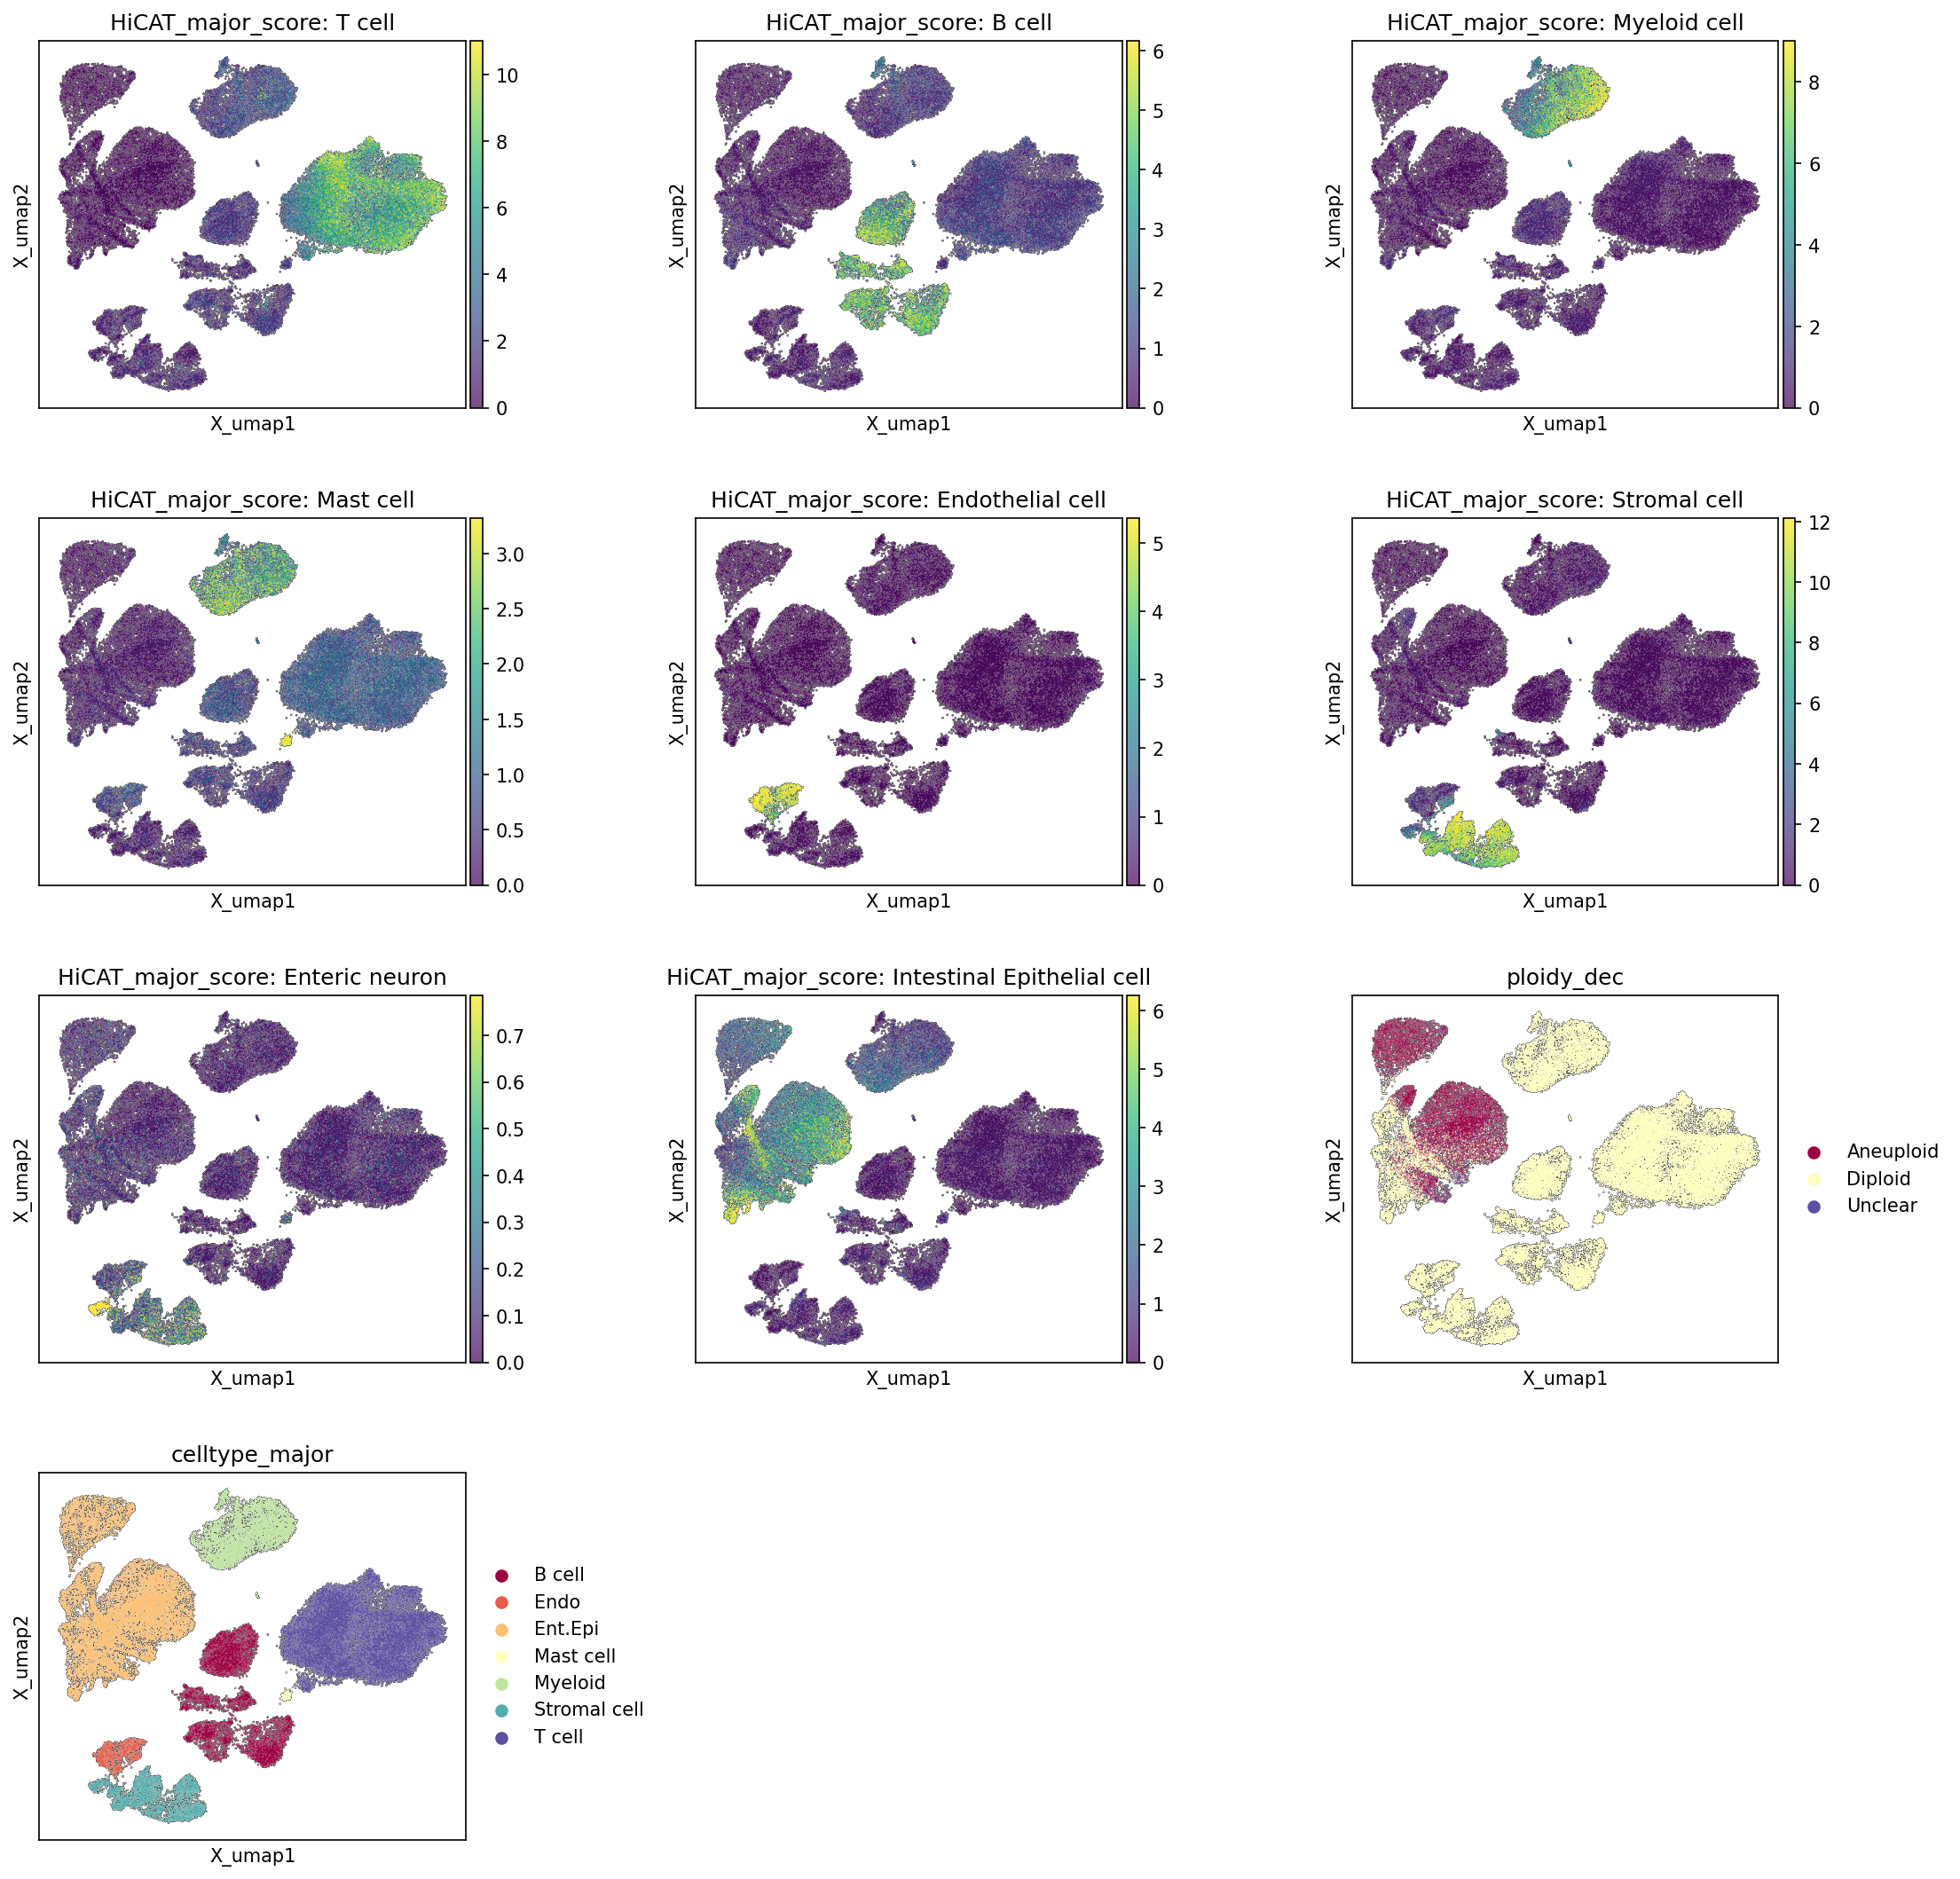
This analysis visualizes the distribution of major cell type scores (derived from HiCAT), ploidy status, and final celltype_major annotations on a Uniform Manifold Approximation and Projection (UMAP) embedding of single-cell RNA-seq data from colon tissue. The purpose is to assess the quality of cell type assignments, the distinctness of different cell populations in the embedding space, and the spatial relationship between ploidy status and cell identity.
Visual Summary
The UMAP projection displays several distinct clusters representing different cell populations.
- Cell Type Score Distribution: Each HiCAT_major_score plot shows the quantitative score for a specific major cell type across the UMAP.
- T cell: High T cell scores are concentrated in a large, well-defined cluster on the right side of the UMAP.
- B cell: High B cell scores are found in a smaller, distinct cluster towards the bottom-center and upper-left, separate from T cells.
- Myeloid cell: Myeloid cell scores are highest in a cluster in the upper-right region, overlapping somewhat with T cells but also forming a distinct sub-region.
- Mast cell: Mast cells show a very localized, small cluster with high scores, primarily at the bottom-center of the UMAP.
- Endothelial cell: High endothelial cell scores are concentrated in a cluster on the bottom-left, distinct from immune and epithelial cells.
- Stromal cell: High stromal cell scores form a large, distinct cluster on the upper-left side of the UMAP.
- Intestinal Epithelial cell: High Intestinal Epithelial cell scores are predominantly found in the central-left and bottom-left large clusters.
- Enteric neuron: Enteric neurons show very low scores across most of the UMAP, with very few cells showing high scores, indicating either a rare population or less distinct transcriptional profile with the current gene set. This population seems to be a minor component, with high scores showing up in a very small cluster near the center-left.
Ploidy Status (ploidy_dec): The ploidy_dec plot shows a clear separation
- Aneuploid cells (dark red) are predominantly found in the large, central-left cluster, which largely overlaps with areas of high Intestinal Epithelial cell scores.
- Diploid cells (light yellow) are widely distributed across the remaining clusters, representing immune cells, stromal cells, and other non-malignant cell types. "Unclear" (purple) cells are very few.
- Final Cell Type Annotation (celltype_major): The celltype_major plot shows the assigned major cell types, confirming that the high score regions for each cell type generally correspond to the assigned clusters.
- The T cell cluster (purple) matches the high T cell score region.
- The B cell cluster (maroon) matches the high B cell score region.
- The Myeloid cell cluster (light green) matches the high Myeloid cell score region.
- The Stromal cell cluster (dark green) matches the high Stromal cell score region.
- The Intestinal Epithelial cell cluster (light orange) corresponds to the large central-left cluster and bottom-left, aligning well with high Intestinal Epithelial cell scores and the majority of aneuploid cells.
- Endothelial cells (dark orange) are also found in distinct clusters, aligning with their score map.
- Mast cells (yellow) occupy a small, distinct area.
Biological Interpretation
The UMAP visualizations demonstrate a robust separation of major cell types based on their transcriptional profiles, as indicated by the distinct clustering of HiCAT scores and final cell type assignments. This suggests that the cell type annotation process has successfully identified and demarcated biologically meaningful cell populations.
The observation that Aneuploid cells predominantly co-localize with Intestinal Epithelial cell clusters is highly significant given the Tumor origin celltype: Intestinal Epithelial cell context. This pattern strongly suggests that the aneuploid cells represent the malignant epithelial cells, which is a hallmark of many solid tumors, including colorectal cancer. The spatial segregation of aneuploid cells from the largely diploid stromal and immune cell populations further supports their malignant nature and the tumor's clonal origin from epithelial cells.
- Aneuploidy is a common feature of cancer cells, resulting from chromosomal instability, and is often associated with tumor progression and genomic heterogeneity PubMed Search: aneuploidy cancer biology.
- The clear separation between epithelial and immune/stromal cells reflects the distinct biological functions and gene expression programs of these different cellular compartments within the colon tissue.
The clustering of immune cells (T cells, B cells, Myeloid cells) and stromal cells (Stromal cells, Endothelial cells) into distinct groups, along with their low or absent aneuploidy, indicates that these are likely host cells participating in the tumor microenvironment or adjacent normal tissue. The relative paucity and distinct localization of Enteric neurons suggest they are a minor, specialized population within the colon.
Annotation Notes
The strong concordance between the HiCAT_major_score plots and the final celltype_major annotation UMAP provides high confidence in the quality of the cell type assignments. The distinct, non-overlapping high-score regions for most major cell types indicate that the clustering and annotation accurately reflect underlying biological distinctions in gene expression. The UMAP embedding effectively separates major cell populations, allowing for clear visual assessment of their distribution and associated features like ploidy. This robust annotation serves as a solid foundation for further downstream analyses, such as differential gene expression or cell-cell interaction studies, within specific cell populations and disease contexts.
3. Celltype Subset Marker Expression for Annotation Validation
[Analysis Visualization Results]...
Analysis Overview
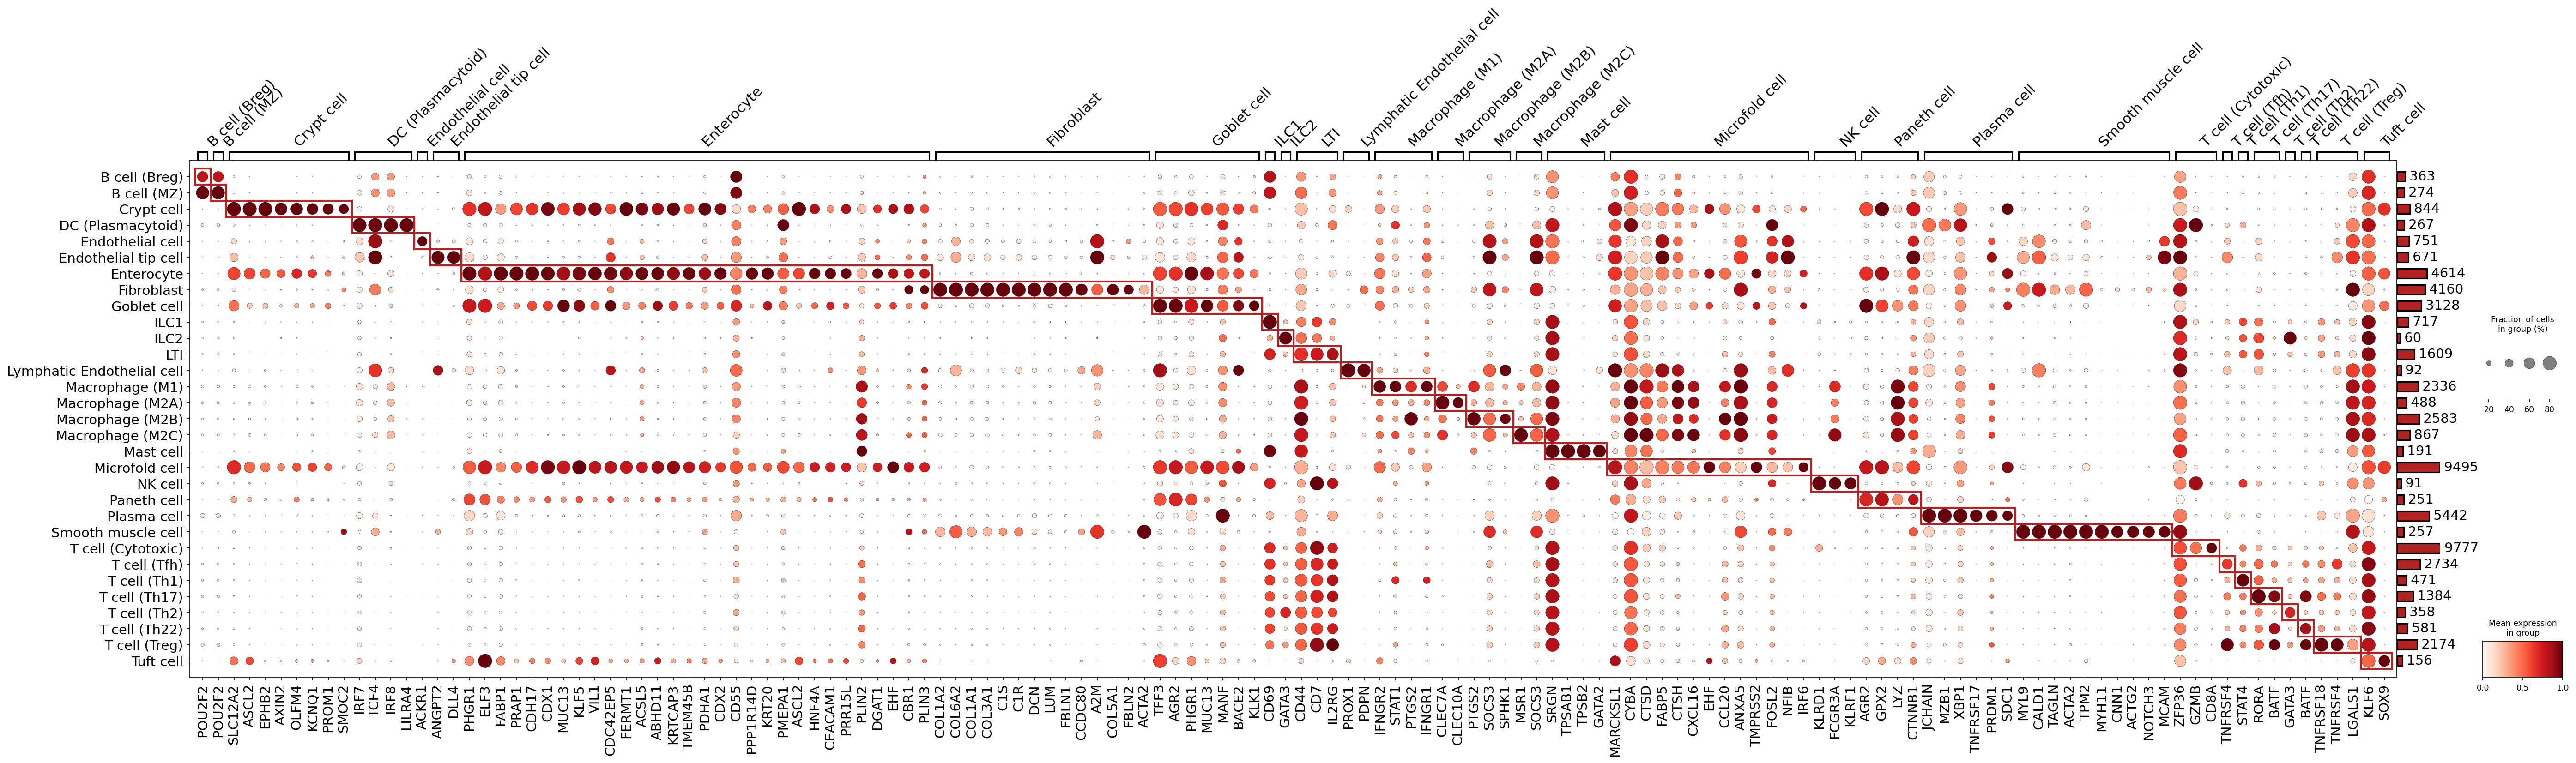
This analysis presents a dot plot visualizing the expression patterns of marker genes across different celltype_subset populations derived from single-cell RNA-seq data of colon tissue. The primary goal is to assess and validate the quality of the celltype_subset annotations by examining the specificity and expression levels of automatically identified surfaceome markers for each cell type. The plot_markers_and_expression_dot tool was used, configured to find up to 30 surface-expressed markers per cell group with specific fold change and percentage expression cutoffs, ensuring the focus is on biologically relevant, surface-accessible proteins.
Visual Summary
The dot plot effectively displays the expression landscape of selected marker genes across 43 distinct celltype_subset populations. Each row represents a celltype_subset, and each column represents a marker gene.
- Dot Size: Corresponds to the fraction of cells within a given celltype_subset that express the marker gene (ranging from 0% to over 80%). Larger dots indicate higher prevalence of expression.
- Dot Color Intensity: Indicates the mean expression level of the marker gene within that celltype_subset (on a scale from 0.0 to 1.0, with darker red indicating higher mean expression).
- Red Boxes: These boxes highlight the specific markers identified by the algorithm as most characteristic for each corresponding celltype_subset (row). The strong diagonal pattern of these highlighted markers indicates a high degree of specificity.
- Cell Counts: A bar chart on the right displays the total number of cells assigned to each celltype_subset, providing context for the robustness of expression profiles (e.g., Goblet cells, Enterocytes, Fibroblasts, and various T cell subtypes represent large populations).
Overall, the plot reveals a clear and distinct marker signature for the majority of celltype_subset populations. Most cell types exhibit a unique set of highly expressed and broadly detected surface markers, supporting their distinct identities. Some closely related cell types (e.g., within B cell, Endothelial cell, Macrophage, or T cell subtypes) show shared markers, but still retain unique distinguishing features.
Biological Interpretation
The observed marker gene expression patterns provide strong biological evidence supporting the current celltype_subset annotations:
Intestinal Epithelial Cells
- Crypt cells are clearly identified by markers such as EPHB2, AXIN2, PROM1 (CD133), and OLFM4, which are canonical intestinal stem cell and crypt base columnar cell markers [PubMed: 22687157].
- Enterocytes show strong expression of differentiation markers like FABP1, CDH17, CDX1, VIL1, KRT20, and CEACAM1, consistent with their role in absorption and epithelial integrity [GeneCards: CDH17].
- Goblet cells are characterized by MUC2 and TFF3, which are essential for mucus production and protection of the intestinal epithelium [GeneCards: MUC2].
- Microfold cells (M cells) specifically express GP2, a critical marker involved in antigen transcytosis across the gut barrier [PubMed: 25167571].
- Paneth cells show high expression of LYZ (Lysozyme), an antimicrobial peptide key to their function in innate immunity [GeneCards: LYZ].
- Tuft cells are marked by POU2F3, a transcription factor crucial for their development and chemosensory functions [PubMed: 28723652].
Stromal and Endothelial Cells
- Fibroblasts are well-defined by classic markers such as DCN, COL1A1, COL3A1, and LUM, alongside myofibroblast markers like ACTA2, TAGLN, MYH11, and CNN1, reflecting their diverse roles in tissue structure and remodeling [GeneCards: DCN].
- Endothelial cells (general, tip, lymphatic) express CDH5 (VE-cadherin) and ANGPT2. Lymphatic endothelial cells are further distinguished by PROX1, a master regulator of lymphatic development [GeneCards: PROX1].
Immune Cells
- B cells (Breg, MZ, Follicular, Memory) are identified by canonical markers like POU2F2, MS4A1 (CD20), CD79A, CD79B, and plasma cells by SDC1 (CD138), TNFRSF17 (BCMA), MZB1, and XBP1, which are critical for antibody secretion [GeneCards: MS4A1].
- Dendritic cells (pDC, Classical, Inflammatory) express specific markers such as LILRA4 and IRF7 for plasmacytoid DCs [GeneCards: LILRA4].
- Macrophages (M1, M2 subtypes) show expression of CD68 (a pan-macrophage marker) and subtype-specific markers like SPP1 (Osteopontin), MSR1 (CD204, M2 marker), and lysosomal enzymes CTSD and CTSH, reflecting their diverse functional states [PubMed: 25821035].
- Mast cells are clearly demarcated by TPSAB1 (tryptase) and SRGN (serglycin), central to their role in allergic and inflammatory responses [GeneCards: TPSAB1].
- Natural Killer (NK) cells show characteristic cytotoxic markers like NKG7, GZMB, and KLRD1 (CD94) [GeneCards: NKG7].
- T cells (CD4+, CD8+ and their various subtypes like Cytotoxic, Th1, Th2, Th17, Treg, Tfh) express key lineage markers CD4 and CD8A (not all shown but implied by the presence of T cell subtypes), and functional markers. For instance, GZMB for Cytotoxic T cells, TNFRSF18 (GITR) for regulatory T cells (Tregs), STAT4 for Th1 cells, GATA3 for Th2 cells, and RORA/BATF for Th17 cells, highlighting their specialized roles in adaptive immunity [PubMed: 30140730].
The selection of surfaceome-only markers enhances the biological relevance for cell identification and potential future experimental validation using techniques like flow cytometry or imaging.
Annotation Notes
The comprehensive marker expression dot plot strongly validates the current celltype_subset annotations within the AnnData object. The algorithm successfully identified distinct sets of surfaceome markers for almost all cell types, characterized by high mean expression and high fraction of cells expressing within their respective groups. This robust specificity of markers, aligning with known biological functions, indicates that the cell clusters are well-separated and accurately identified. The plot serves as an excellent identity check, confirming the biological plausibility and reliability of the celltype_subset assignments, which is crucial for downstream analyses. There are no immediate ambiguities or significant mis-assignments evident, suggesting high quality in the initial cell clustering and annotation process.
4. Copy Number Variation Analysis in Diploid Intestinal Epithelial Cells from Colon Tumor and Adjacent Normal Samples
[Analysis Visualization Results]...
Analysis Overview
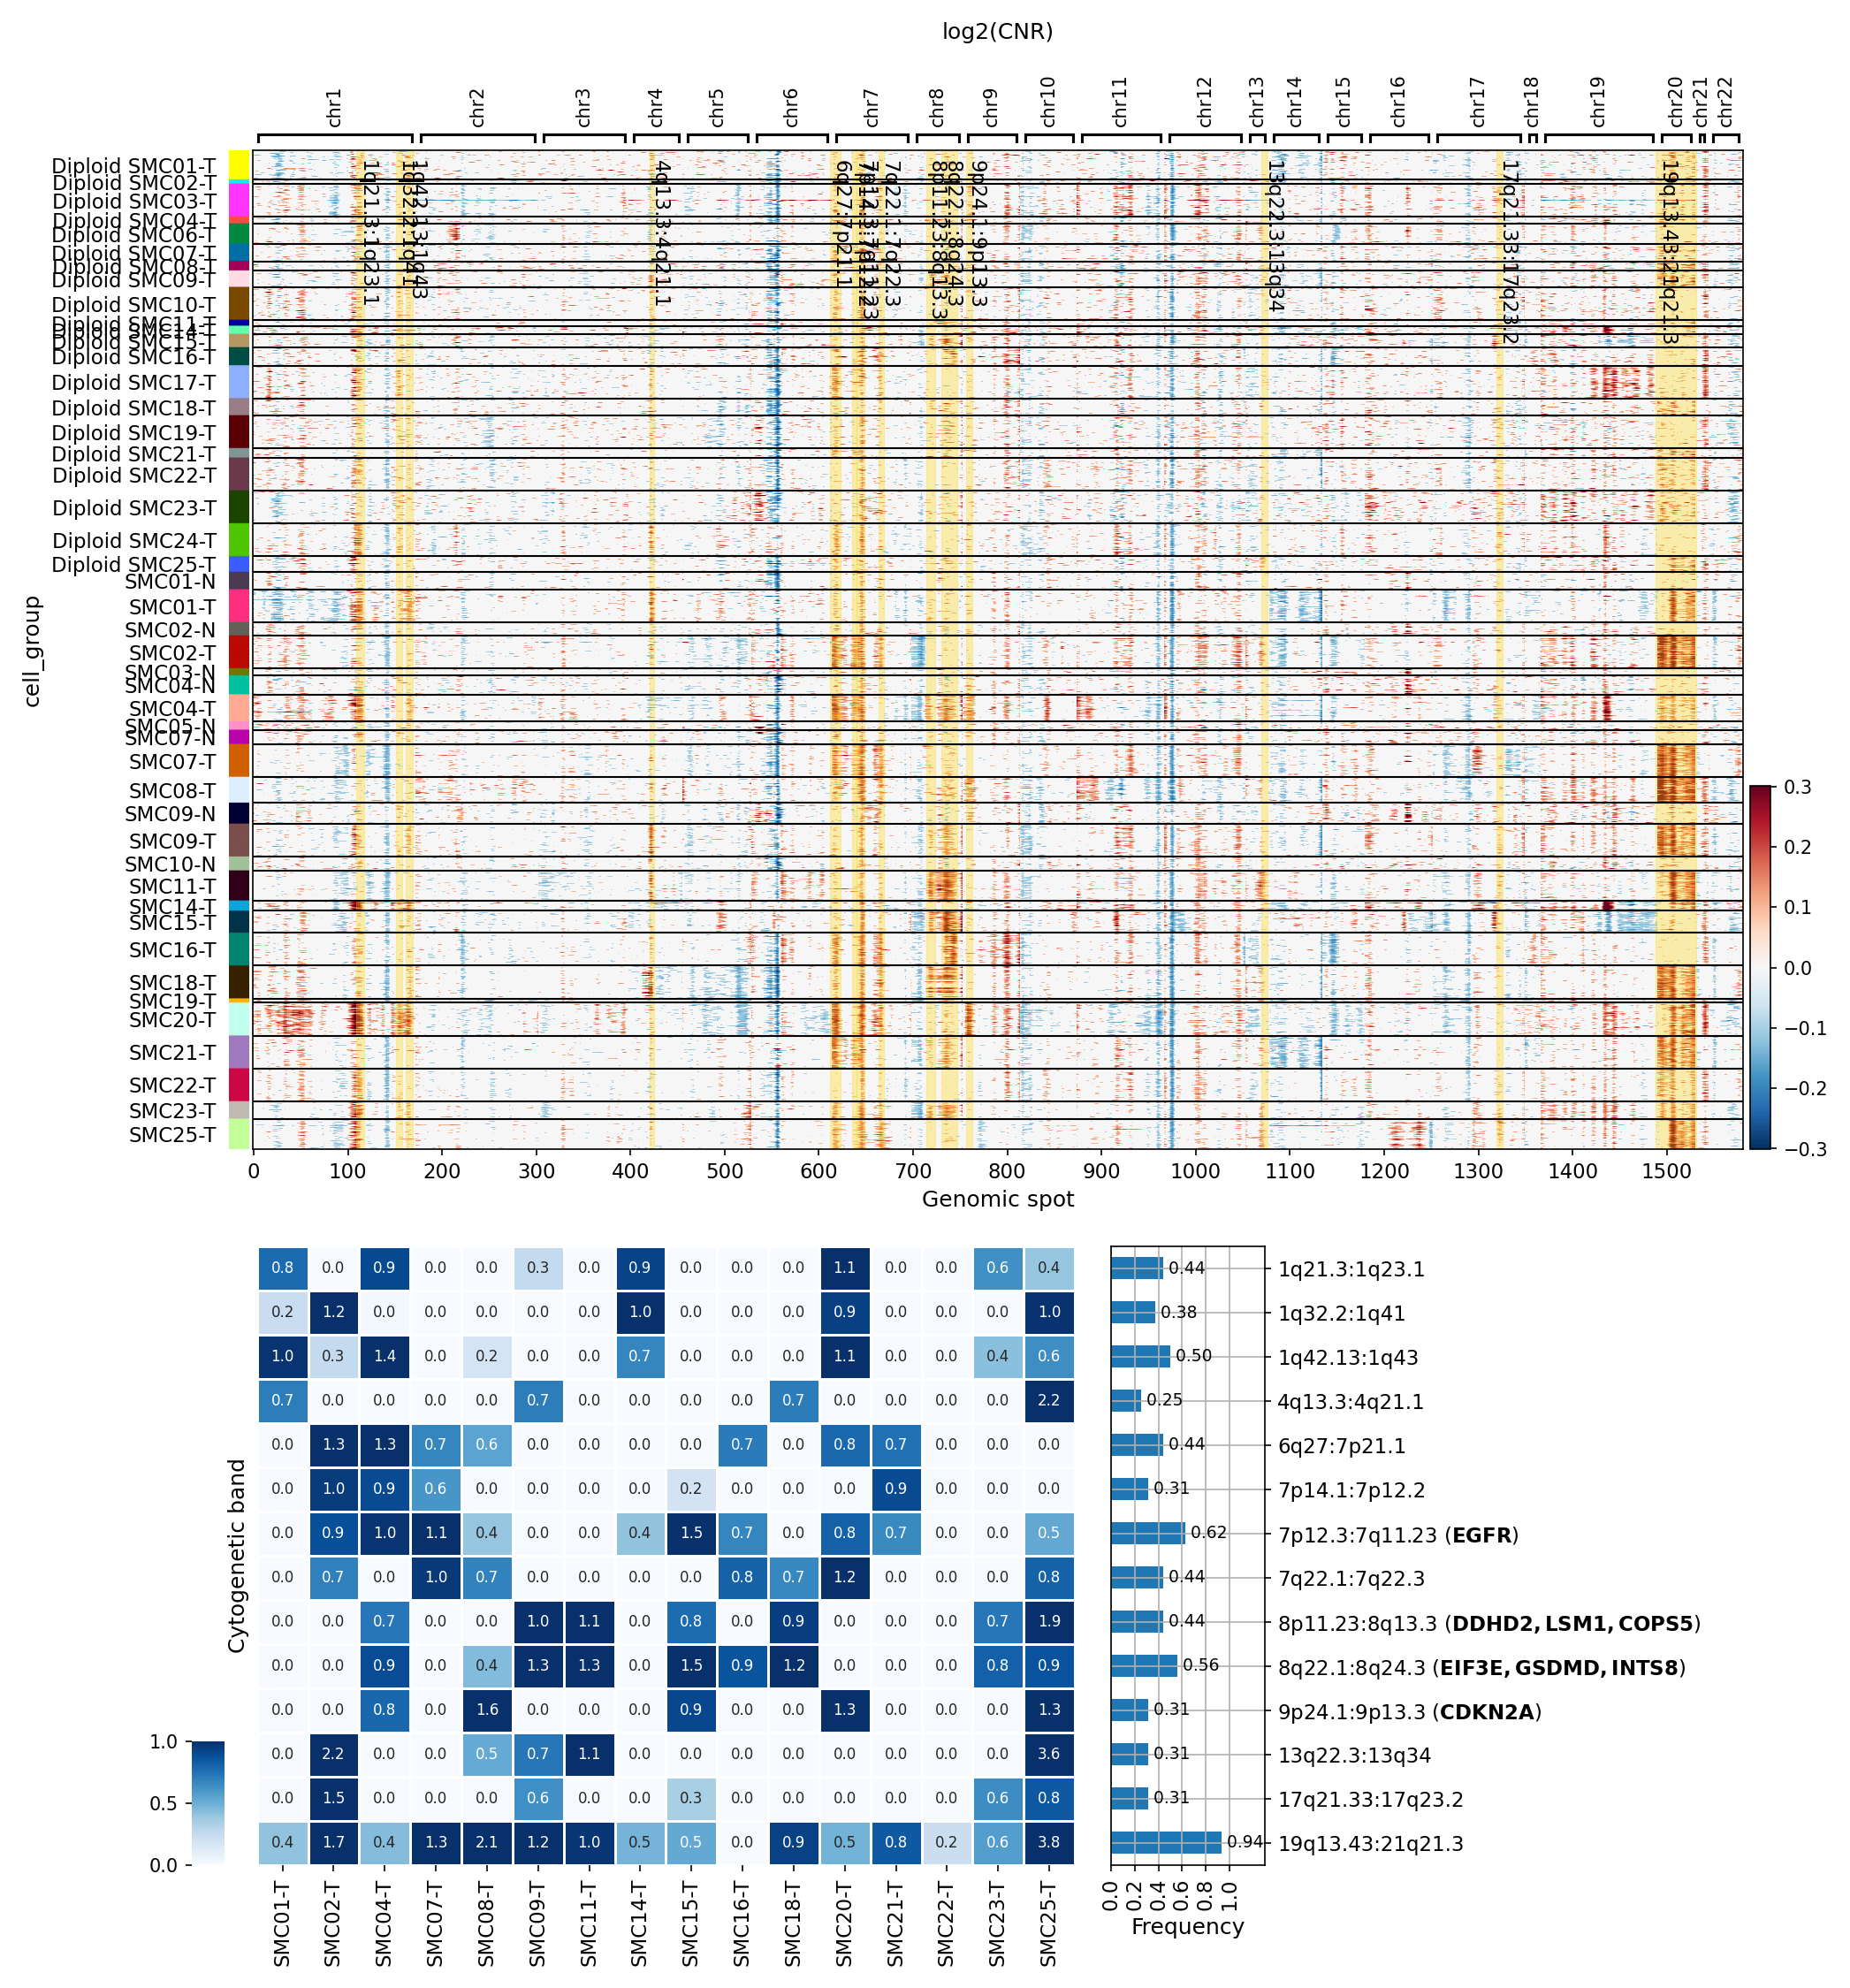
This analysis investigates copy number variations (CNVs) within Intestinal Epithelial cells, identified as the tumor-origin cell type, across various colon tumor (T) and adjacent normal (N) samples. The cells analyzed were inferred to be diploid based on the ploidy_dec annotation. The plot_cnv_heatmap tool was used to visualize log2 copy number ratios (log2(CNR)) across genomic spots, grouped by sample, and to summarize significantly altered cytogenetic regions.
Visual Summary
CNV Heatmap (log2(CNR))
The heatmap displays the log2(CNR) values for Intestinal Epithelial cells, grouped by individual samples (e.g., SMC01-T, SMC01-N).
- Distinct Patterns in Tumor vs. Normal: Adjacent normal samples (labeled with '-N', e.g., SMC01-N, SMC02-N) consistently exhibit a predominantly neutral (white/yellow) copy number profile, indicating a stable diploid state with minimal detectable CNVs. In contrast, tumor samples (labeled with '-T') display varying degrees of copy number alterations.
- Sample-Specific Heterogeneity: Within tumor samples, there is considerable heterogeneity in CNV patterns. Some tumor samples (e.g., SMC01-T, SMC04-T) show relatively few or minor CNVs, similar to normal samples, while others, notably SMC08-T and SMC25-T, exhibit a higher burden of both amplifications (red) and deletions (blue) across multiple genomic regions. This suggests diverse genomic instability profiles even among diploid tumor-origin cells.
- Diploid Classification: It is critical to note that all cells displayed in this heatmap are prefixed with "Diploid," indicating that despite the observed amplifications and deletions, these cells were classified as having an overall diploid karyotype. This suggests the visualization highlights sub-chromosomal copy number alterations rather than whole-chromosome aneuploidy.
- Recurrent Alterations: Specific genomic regions show recurrent alterations across several tumor samples. For instance, amplifications are visible on parts of chromosome 7 and 8, while deletions are observed on chromosomes 9 and 19.
Significant Amplified Copy Number Regions Summary
The summary heatmap and bar plot provide a quantitative overview of the frequency of CNAs in specific cytogenetic bands across the tumor samples.
- Most Frequent Alterations: The bar plot on the right highlights several cytogenetic bands with high frequencies of alteration:
- A deletion in 19q13.43:q21.3 is the most frequent event, observed in approximately 94% of the tumor samples.
- Amplifications in 7p12.3:7q11.23, which includes the *EGFR* gene, and 8p11.23:q13.3 (including *DDHD2, LSM1, COPS5*) are highly recurrent, affecting about 62% of the samples.
- An amplification in 8q22.1:8q24.3 (including *EIF3E, GSDMD, INTS8*) is also frequent, found in 56% of samples.
- A deletion in 9p24.1:9p13.3 (containing *CDKN2A*) is observed in 31% of the samples.
- Sample-Specific CNA Burden: Consistent with the main heatmap, samples like SMC08-T and SMC25-T show higher proportions of cells with CNAs across a broader range of cytogenetic bands in the summary heatmap. Other samples, such as SMC04-T, SMC09-T, and SMC15-T, show fewer recurrent alterations.
- Key Oncogenes/Tumor Suppressors: The summary explicitly links several altered regions to known genes, such as *EGFR* (7p12.3:7q11.23) and *CDKN2A* (9p24.1:9p13.3), which are critical in cancer.
Biological Interpretation
The analysis focuses on Intestinal Epithelial cells, the identified tumor-origin cell type in colon tissue. The observation that even cells classified as "Diploid" exhibit numerous sub-chromosomal CNVs is highly significant. This suggests that genomic instability can manifest as focal amplifications and deletions without necessarily leading to overt aneuploidy, representing a crucial early step in carcinogenesis or a mechanism for clonal evolution within a seemingly diploid population.
- Role of EGFR Amplification: The recurrent amplification of the 7p12.3:7q11.23 region, harboring the *EGFR* gene, is a well-established oncogenic driver in various cancers, including colorectal cancer. EGFR signaling promotes cell proliferation, survival, and metastasis GeneCards: EGFR. Its amplification in a significant proportion of diploid tumor epithelial cells suggests its potential as an early or concurrent driver event.
- CDKN2A Deletion: The deletion of 9p24.1:9p13.3, which contains the tumor suppressor gene *CDKN2A* (encoding p16INK4a and p14ARF), is another critical finding. Loss of *CDKN2A* typically leads to uncontrolled cell cycle progression by disrupting cell cycle checkpoints and promoting cellular proliferation GeneCards: CDKN2A. Its recurrent deletion in diploid tumor cells underscores its importance in colon cancer pathogenesis.
- Novel or Less-Studied CNAs: The frequent deletion in 19q13.43:q21.3 and amplifications in 8p11.23:q13.3 (*DDHD2, LSM1, COPS5*) and 8q22.1:8q24.3 (*EIF3E, GSDMD, INTS8*) warrant further investigation. While *DDHD2*, *LSM1*, and *COPS5* have been implicated in various cellular processes, their specific roles in colon cancer CNVs, especially within a diploid context, could reveal novel oncogenic mechanisms. *GSDMD* (Gasdermin D) is involved in pyroptosis, a programmed cell death, and its amplification could have complex implications for tumor immunity and survival.
- Heterogeneity and Clonal Evolution: The observed inter-sample heterogeneity, with some tumors exhibiting a high CNV burden (e.g., SMC08-T, SMC25-T) and others showing fewer changes within their diploid epithelial cells, highlights the diverse genomic landscapes of colon cancer. This variability may reflect different stages of tumor progression, different molecular subtypes, or distinct evolutionary paths where specific sub-clones with advantageous CNVs emerge.
Clinical or Translational Implications
- Biomarker Potential: The recurrent amplification of *EGFR* and deletion of *CDKN2A* in diploid Intestinal Epithelial cells could serve as early diagnostic or prognostic biomarkers for colon cancer. Detecting these specific CNVs, even in cells not classified as overtly aneuploid, might indicate genomic instability and malignant transformation.
- Therapeutic Targeting: *EGFR* amplification is a well-established target for tyrosine kinase inhibitors and monoclonal antibodies in various cancers. Identifying *EGFR* amplification in this specific cell population could guide targeted therapeutic strategies, especially in tumors that maintain a diploid state but harbor specific driver CNAs.
- Understanding Tumor Progression: The presence of significant CNVs in diploid tumor-origin cells suggests that these alterations are crucial events that precede or coexist with whole-genome aneuploidy. Studying these sub-chromosomal changes can provide insights into the early genetic events driving tumor development and progression in colon cancer.
Annotation Notes
The analysis specifically targeted Intestinal Epithelial cells, which are the stated tumor origin cells. The ploidy_dec inference classified all plotted cells as "Diploid". If aneuploid cells were present in the initial dataset, they were not included in this specific target_cells selection or were filtered out by the ploidy_dec classification. Therefore, the interpretation is confined to CNVs within cells maintaining an overall diploid genomic content, and not cells with gross aneuploidy.
5. UMAP Visualization of Cell Populations with CNV Patterns
[Analysis Visualization Results]...
Analysis Overview
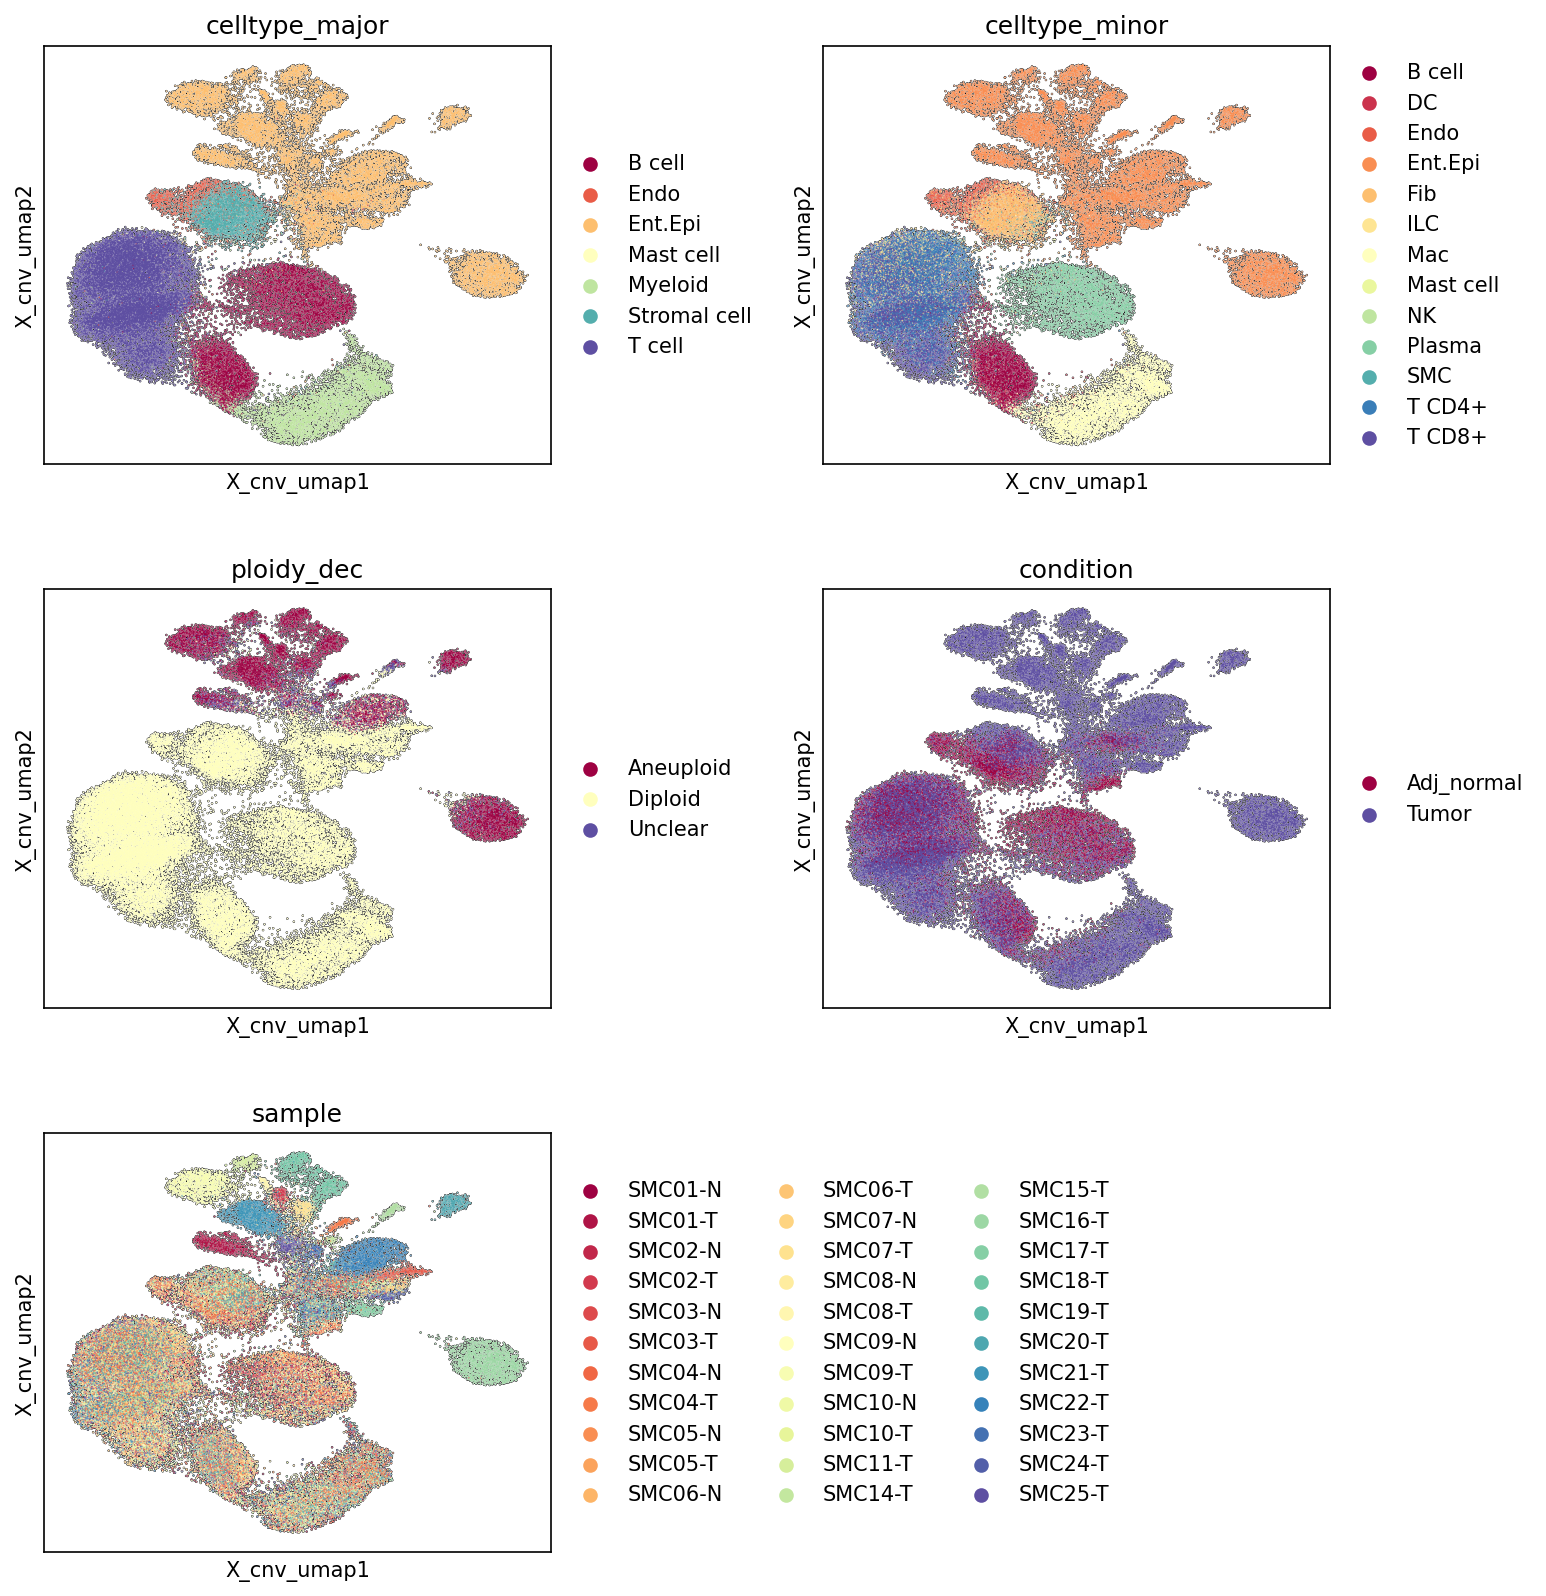
This analysis presents UMAP (Uniform Manifold Approximation and Projection) plots, where the dimensionality reduction was performed considering Copy Number Variation (CNV) estimates (as indicated by embed_cfg={'cnv': True}). The plots visualize the global cellular landscape of the single-cell RNA-seq data, colored by various metadata attributes: celltype_major, celltype_minor, ploidy_dec (ploidy inference label), condition (Tumor vs. Adj_normal), and sample. The goal is to understand how cells cluster based on their CNV-aware transcriptomic profiles and how these clusters relate to cell identity, ploidy status, disease condition, and sample origin.
Visual Summary
- Cell Type Clustering (celltype_major and celltype_minor): The UMAP clearly resolves distinct cellular populations. Major cell types such as T cells, Intestinal Epithelial cells, Stromal cells, and Myeloid cells form well-separated clusters. The celltype_minor plot further refines these distinctions, showing sub-populations like T cell CD4+, T cell CD8+, Macrophages, and Fibroblasts occupying specific regions within the broader major cell type clusters. This indicates that the UMAP embedding, even with CNV integration, effectively captures the underlying cellular heterogeneity.
- Ploidy Status (ploidy_dec): A striking pattern emerges with ploidy_dec. A significant portion of cells, particularly those forming distinct clusters on the bottom-left and some smaller clusters elsewhere, are labeled 'Aneuploid' (maroon). The majority of the remaining cells are labeled 'Diploid' (yellow). This clear spatial separation of aneuploid and diploid cells strongly suggests that the CNV estimates have a dominant influence on the UMAP projection and successfully differentiate cells based on their ploidy.
- Condition (condition): The distribution of cells by condition shows a strong correlation with the ploidy_dec plot. Cells from the 'Tumor' condition (dark blue/purple) predominantly overlap with the 'Aneuploid' regions of the UMAP, particularly the large bottom-left cluster. Conversely, cells from the 'Adj_normal' condition (maroon) primarily populate the 'Diploid' regions. This indicates a clear separation of tumor and adjacent normal tissue cells, largely driven by the presence of aneuploid cells in the tumor samples.
- Sample Origin (sample): While distinct clusters corresponding to tumor populations show some sample-specific contributions (e.g., various "SMCxx-T" samples contributing to the aneuploid clusters), there is also a general mixing of samples across the non-tumor cell populations. This suggests that the UMAP embedding has largely mitigated strong sample-specific batch effects, allowing for the comparison of similar cell types across different patients.
Biological Interpretation
The integration of CNV estimates (obsm['X_cnv']) into the UMAP dimensionality reduction has been highly effective in identifying and separating cell populations based on their genomic integrity.
- Tumor Cell Identification: The strong overlap between aneuploid cells and cells derived from tumor samples is a critical finding. Given that the Tumor origin celltype is specified as 'Intestinal Epithelial cell', it is highly probable that the aneuploid clusters prominently represent malignant intestinal epithelial cells. Aneuploidy is a well-established hallmark of cancer, reflecting chromosomal instability and abnormal chromosome numbers commonly found in tumor cells.
- Immune and Stromal Cell Context: Diploid cells from both 'Tumor' and 'Adj_normal' conditions form distinct clusters for various immune and stromal cell types. This indicates that even within the tumor microenvironment, the non-malignant cells largely maintain a diploid state, as expected for healthy somatic cells. The UMAP's ability to separate these non-malignant cell types suggests that their unique transcriptional profiles, independent of CNV, are still well-captured.
- Heterogeneity of Tumor Microenvironment: The presence of both tumor-derived and adjacent normal-derived cells (including immune cells, stromal cells, and endothelial cells) in the overall dataset highlights the complex cellular composition of the tumor microenvironment. The clear separation of conditions and ploidy states on the UMAP provides a robust basis for further investigating cell-type-specific responses and interactions in both tumor and adjacent normal tissues.
Annotation Notes
- The consistent spatial separation of cell populations based on celltype_major, celltype_minor, ploidy_dec, and condition demonstrates high confidence in the cell type annotations and the reliability of the ploidy inference for distinguishing malignant from non-malignant cells.
- The UMAP embedding, generated using CNV information, effectively delineates the primary cancer cell population (aneuploid, intestinal epithelial cells from tumor samples) from the diploid stromal and immune cells present in both tumor and adjacent normal tissues. This robust separation provides a strong foundation for downstream differential expression, pathway analysis, and cell-cell interaction studies, especially when focusing on tumor-specific alterations.
- The relatively good mixing of samples for non-malignant cell types suggests that technical batch effects related to individual samples have been adequately handled, allowing for meaningful comparisons across patients.
6. Cell Type Population Analysis in Colon Tumor vs. Adjacent Normal Tissue
[Analysis Visualization Results]...
Analysis Overview
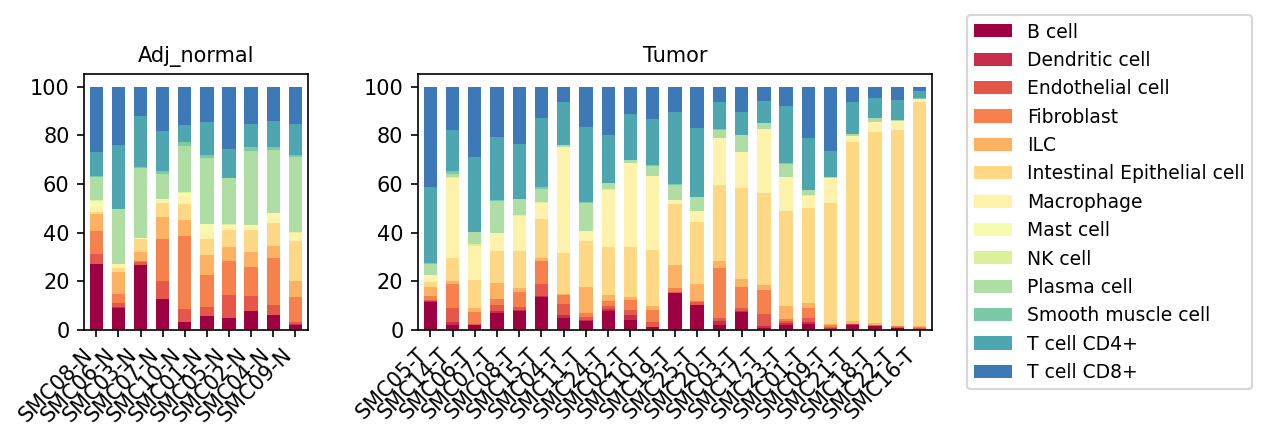
This analysis presents a stacked bar plot showing the relative proportions of minor cell types in single-cell RNA sequencing data from human colon tissue. The data is stratified by condition: 'Adj_normal' (adjacent normal tissue) and 'Tumor' (tumor tissue), with individual bars representing different samples. This visualization allows for a direct comparison of cellular composition shifts between healthy and cancerous states.
Visual Summary
The stacked bar plot reveals distinct differences in cell type composition between adjacent normal colon tissue and colon tumor tissue.
- Adjacent Normal (Adj_normal) Samples: These samples exhibit a relatively diverse cellular landscape. Major contributing cell types include Intestinal Epithelial cells (light yellow/beige), Fibroblasts (orange), Endothelial cells (red), and various immune cells such as T cells (CD4+ in light teal, CD8+ in dark blue), Plasma cells (light green), and Macrophages (light yellow). The proportions of these cell types show some variability across different normal samples, reflecting normal tissue heterogeneity.
- Tumor Samples: In stark contrast, tumor samples are characterized by a pronounced dominance of Intestinal Epithelial cells. In many tumor samples, this cell type constitutes a significantly larger proportion, often exceeding 70-80% of the total cellularity, compared to adjacent normal samples. This expansion of Intestinal Epithelial cells in tumor tissue is accompanied by a marked relative reduction in the proportions of most other cell types, including:
- T cells (CD4+ and CD8+): Their relative contribution is notably diminished in many tumor samples.
- B cells, Plasma cells, NK cells, ILCs: These immune cell populations also appear to represent a smaller fraction of the total cells.
- Stromal cells (Fibroblasts, Endothelial cells, Smooth muscle cells): While still present, their relative proportions are generally lower in tumor samples compared to normal tissue.
There is some inter-sample variability within the tumor group, with a few tumor samples retaining a slightly more diverse immune presence, although generally less than in normal tissue.
Biological Interpretation
The observed shifts in cell type proportions offer critical biological insights into the colon tumor microenvironment.
- Malignant Cell Expansion: The most striking feature is the overwhelming dominance of Intestinal Epithelial cells in tumor samples. Given that the Tumor origin celltype is specified as 'Intestinal Epithelial cell', this observation strongly indicates the successful proliferation and expansion of malignant epithelial cells, which are the primary component of colorectal adenocarcinoma. This expansion leads to a "dilution effect" where other cell types, even if their absolute numbers remain stable or increase, appear proportionally reduced in the single-cell dataset.
- Immune Landscape Alteration: The relative decrease in T cells (CD4+ and CD8+), B cells, Plasma cells, NK cells, and other immune cells in tumor samples suggests significant alterations in the tumor immune microenvironment (TIME). This can be attributed to several factors:
- Immune Exclusion/Evasion: Tumor cells often develop mechanisms to exclude immune cells from the tumor core or induce their anergy/exhaustion, thereby hindering effective anti-tumor immunity [PubMed Search].
- Dilution Effect: The massive expansion of tumor epithelial cells can also proportionally reduce the observed immune infiltrate, even if the absolute number of some immune cells (e.g., certain macrophage subsets) might increase.
- Immunosuppression: The TIME is often characterized by an immunosuppressive environment, promoted by regulatory T cells (Tregs), myeloid-derived suppressor cells (MDSCs), and M2-like macrophages, which can limit the infiltration and function of effector immune cells [PubMed Search].
- Stromal Remodeling: The relative decrease in fibroblasts, endothelial cells, and smooth muscle cells, while potentially influenced by the dilution effect, also reflects the complex stromal remodeling that occurs in cancer. While tumor growth often involves extensive angiogenesis and desmoplasia (fibrosis), the relative contribution of these stromal elements to the total cellularity might be overshadowed by the expanding tumor cells in scRNA-seq sampling strategies.
Clinical or Translational Implications
These findings have several important clinical and translational implications for colon cancer:
- Understanding Tumor Heterogeneity: The variability in cell type composition, particularly among tumor samples, highlights the heterogeneity of colon cancers. Tumors with higher immune cell infiltration might respond differently to immunotherapies compared to those with lower infiltration (immune desert or excluded phenotypes).
- Biomarker Identification: The dramatic shift in epithelial cell proportions can serve as a simple metric reflecting tumor burden. The relative depletion of specific immune subsets could be developed as prognostic biomarkers for disease progression or response to treatment.
- Therapeutic Targets: The observed immune cell depletion underscores the importance of targeting immune evasion mechanisms in colon cancer. Strategies aimed at increasing T cell infiltration and activation, such as immune checkpoint inhibitors or adoptive cell therapies, may be particularly relevant for patients with "immune-desert" tumors identified by such compositional analyses [PubMed Search].
- Clinical Relevance of the Tumor Microenvironment: The altered cellular composition emphasizes that colon cancer is not just a disease of malignant epithelial cells but a complex ecosystem involving intricate interactions between cancer cells, immune cells, and stromal cells. Understanding these interactions is crucial for developing holistic therapeutic approaches.
7. Colon Cancer Immune Landscape: T Cell Subtype Shifts in Tumor Microenvironment
[Analysis Visualization Results]...
Analysis Overview
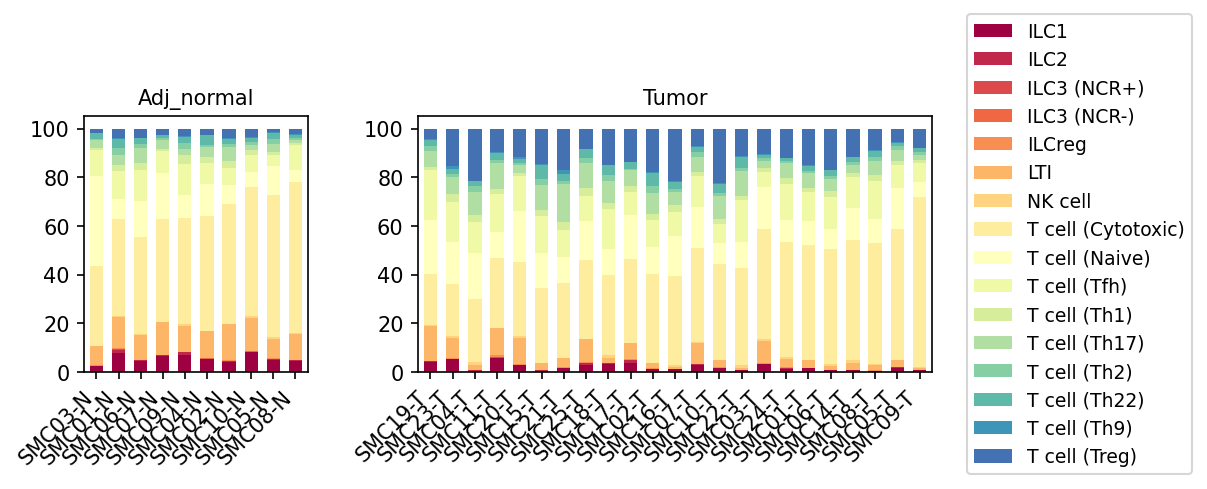
This analysis visualizes the relative proportions of T cell subsets, including Innate Lymphoid Cells (ILCs) and NK cells, within the broader 'T cell' major cell type across individual samples from both 'Adj_normal' (adjacent normal colon tissue) and 'Tumor' (colon tumor tissue) conditions. The aim is to identify shifts in immune cell composition that might be associated with the tumor microenvironment.
Visual Summary
The stacked bar plots effectively illustrate the composition of the T cell compartment for each sample.
- Adjacent Normal Tissue (Adj_normal): The T cell compartment in adjacent normal tissue generally shows a relatively higher proportion of Cytotoxic T cells (T cell (Cytotoxic)) and Naive T cells (T cell (Naive)), along with consistent but smaller contributions from NK cells, T follicular helper cells (T cell (Tfh)), and various other T helper subsets (Th1, Th17, Th2, Th22, Th9), as well as ILCs. T regulatory cells (T cell (Treg)) are present but typically constitute a minor fraction.
- Tumor Tissue (Tumor): A prominent and consistent pattern observed across nearly all tumor samples is a substantial increase in the proportion of T regulatory cells (T cell (Treg)) relative to the total T cell compartment. Concomitantly, the relative proportions of effector cells such as Cytotoxic T cells (T cell (Cytotoxic)) appear to be reduced in many tumor samples compared to their levels in adjacent normal tissue. While other T cell subsets and ILCs are present, the most striking shift is the expansion of Tregs and the relative contraction of cytotoxic T cells within the immune cell population. There is some inter-sample variability in the exact proportions within the tumor group, but the enrichment of Tregs is a consistent trend.
Biological Interpretation
The observed shift in T cell subsets provides critical insights into the immune microenvironment of colon cancer:
- Treg Enrichment in Tumor Microenvironment (TME): The significant increase in the proportion of T regulatory cells (Tregs) within the tumor samples is a hallmark of an immunosuppressive TME. Tregs are known to suppress anti-tumor immune responses, including the activity of cytotoxic T cells and NK cells, thereby promoting tumor immune evasion and progression PubMed search: regulatory T cells in colon cancer microenvironment. Their accumulation in the Colon tumor context suggests active immune dampening.
- Imbalance of Effector and Suppressor Cells: The relative decrease in the proportion of Cytotoxic T cells (CTLs), which are crucial for direct tumor cell killing, coupled with the expansion of Tregs, indicates an unfavorable balance between anti-tumor effector immunity and immunosuppression. This imbalance is critical for tumor growth and metastasis.
- Role of ILCs and NK cells: While less dramatic than the Treg expansion, the presence and slight variations in ILC populations (e.g., ILC3s) in the tumor context may reflect their involvement in shaping inflammation, tissue remodeling, or direct anti-tumor responses, which can be context-dependent in colorectal cancer PubMed search: ILC3 colorectal cancer immunology. NK cells, known for their innate anti-tumor activity, appear to maintain a proportion that is similar to or slightly reduced compared to normal tissue, suggesting potential suppression or alteration of their function within the TME.
Clinical or Translational Implications
- Prognostic Biomarker: High infiltration or proportion of Tregs in colorectal cancer has frequently been correlated with poorer prognosis, disease progression, and reduced response to conventional therapies. This observation aligns with existing literature, reinforcing Tregs as a potential prognostic biomarker GeneCards: FOXP3 (a key Treg marker).
- Therapeutic Targeting: The predominant role of Tregs in creating an immunosuppressive environment highlights them as attractive targets for cancer immunotherapy. Strategies aimed at depleting Tregs, inhibiting their suppressive function, or reprogramming them could be crucial for restoring effective anti-tumor immunity in colon cancer patients. This could involve combination therapies with checkpoint inhibitors or novel agents.
- Patient Stratification: The inter-sample variability within the tumor group, even with the general trend of Treg enrichment, suggests that the precise immune composition of the TME might differ among patients. This heterogeneity could be important for stratifying patients for specific immunotherapeutic approaches.
8. Colon Cancer Immune Landscape: Shifts in T cell and ILC Subpopulations
[Analysis Visualization Results]...
Analysis Overview
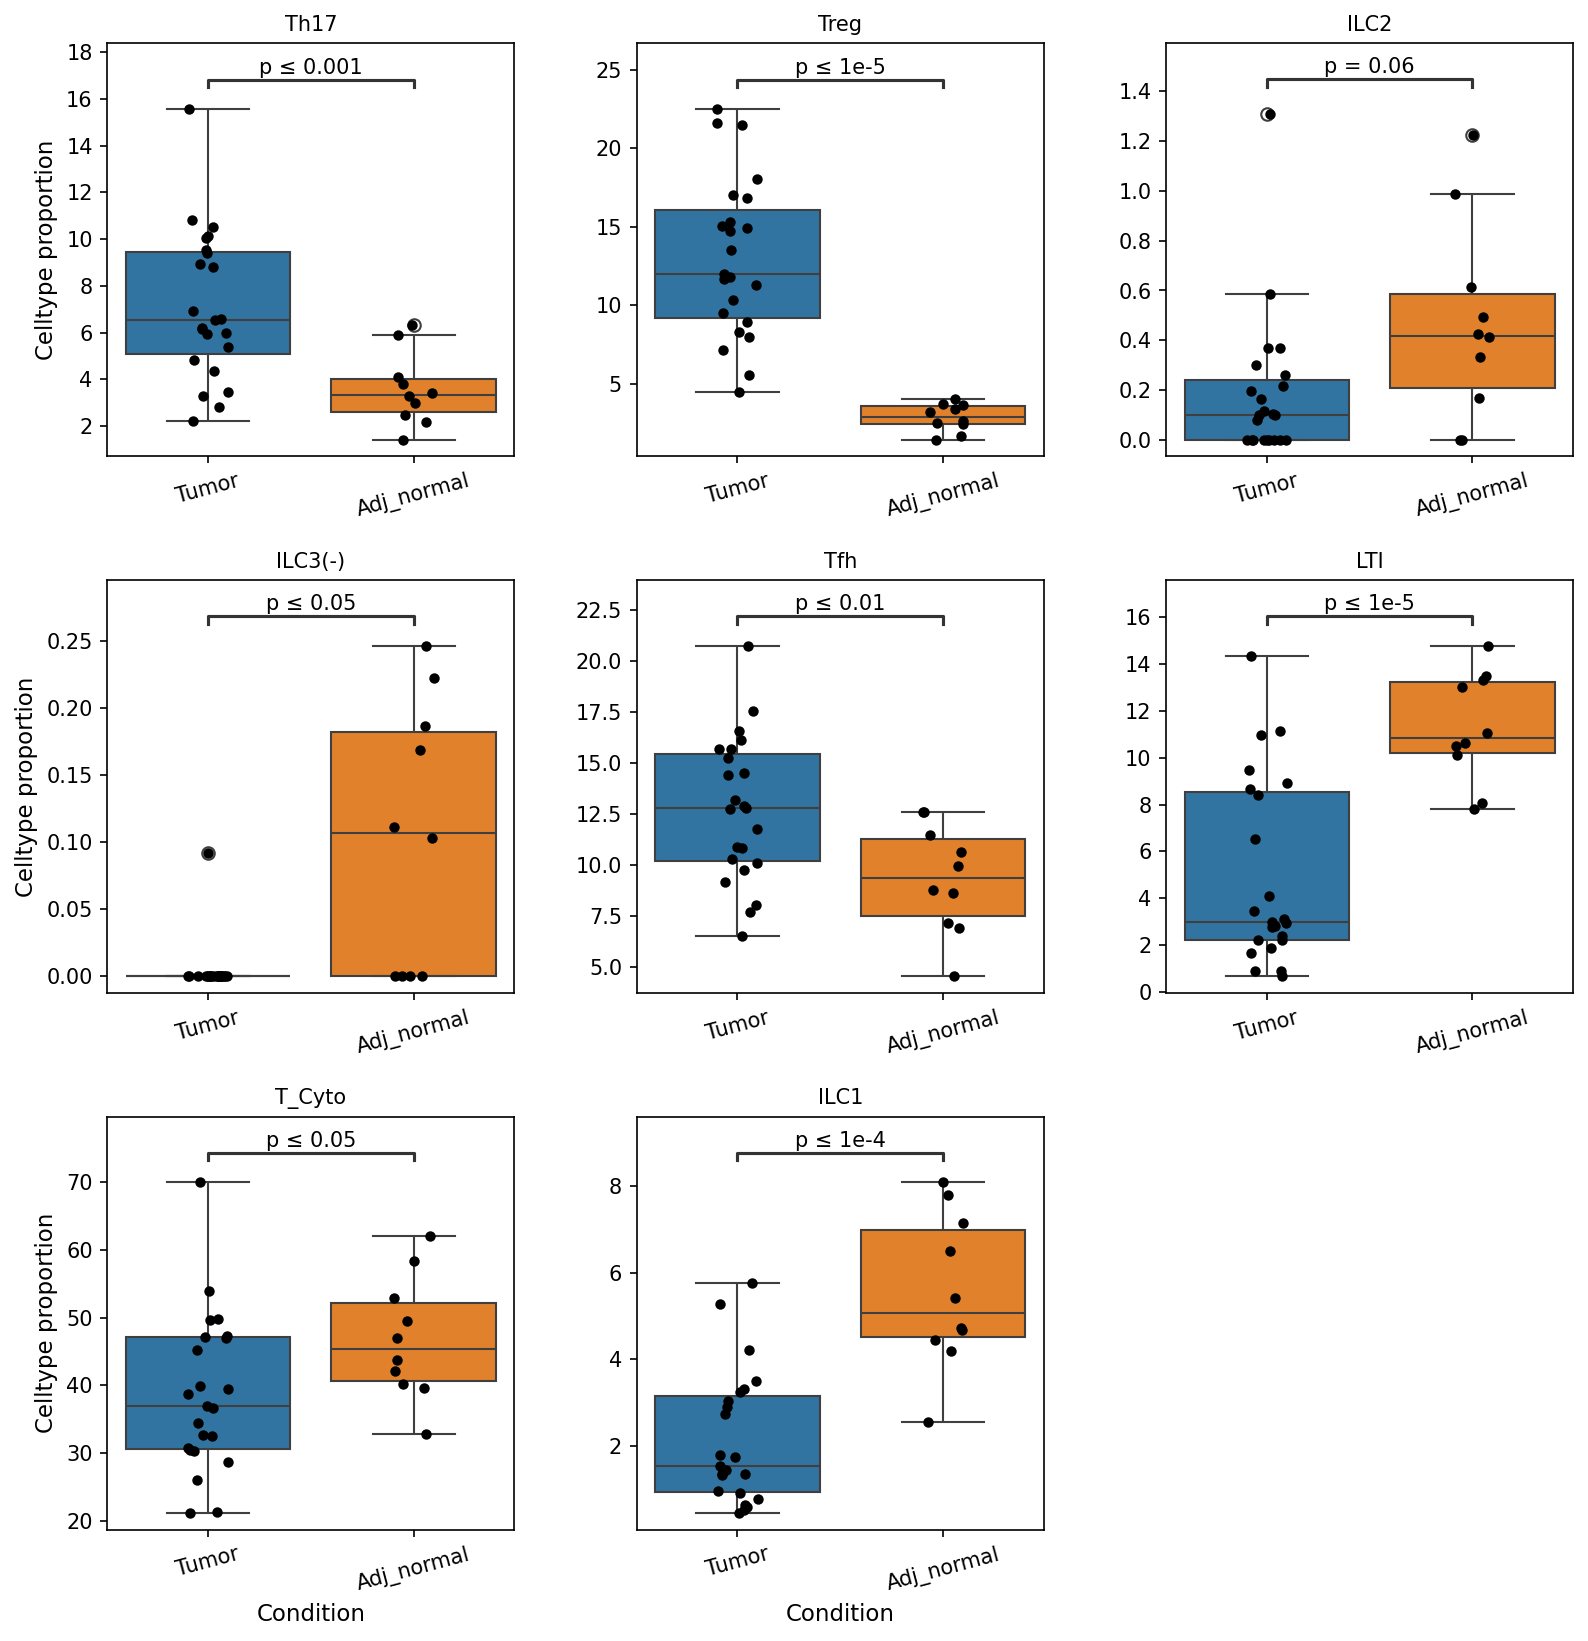
This analysis presents box plots illustrating the proportional representation of various T cell and Innate Lymphoid Cell (ILC) subsets within colon tissue, comparing tumor samples ('Tumor') to adjacent normal tissue samples ('Adj_normal'). The goal is to identify significant changes in the immune cell composition of the tumor microenvironment, providing insights into the immune response dynamics in colon cancer. The Adj_normal group serves as the reference for statistical comparisons.
Visual Summary
The box plots display the celltype proportion for eight distinct T cell and ILC subsets, with individual data points overlaid as a stripplot, enabling visualization of distributions and outliers. Significance levels (p-values) are indicated for differences between the 'Tumor' and 'Adj_normal' conditions.
Key observations:
Enriched in Tumor:
- Th17 cells: Significantly higher proportion in 'Tumor' compared to 'Adj_normal' (p ≤ 0.001).
- Treg cells: Markedly enriched in 'Tumor' tissue (p ≤ 1e-5), showing one of the most substantial increases.
- Tfh (T follicular helper) cells: Also significantly elevated in 'Tumor' samples (p ≤ 0.01).
Depleted in Tumor (Enriched in Adjacent Normal):
- ILC3(-): Show a significantly lower proportion in 'Tumor' tissue (p ≤ 0.05).
- LTI (Lymphoid Tissue inducer) cells: Significantly decreased in 'Tumor' tissue (p ≤ 1e-5), similar to Treg cells in magnitude of difference.
- T_Cyto (Cytotoxic T cells): Display a significantly lower proportion in 'Tumor' compared to 'Adj_normal' (p ≤ 0.05).
- ILC1 cells: Significantly reduced in 'Tumor' samples (p ≤ 1e-4).
- ILC2 cells: Show a trend towards lower proportions in 'Tumor' (p = 0.06), nearing significance.
Biological Interpretation
The observed shifts in T cell and ILC populations highlight a profound remodeling of the immune microenvironment in colon cancer.
- Immunosuppressive and Pro-tumorigenic Environment:
- Treg (Regulatory T cell) enrichment in tumor tissue is a classic hallmark of immune evasion in cancer [PubMed search: Regulatory T cells cancer immunity]. Tregs suppress anti-tumor immune responses, contributing to tumor growth and progression by inhibiting cytotoxic T cells and other effector cells. The substantial increase observed here (p ≤ 1e-5) strongly suggests an active immunosuppressive mechanism within the colon tumor microenvironment.
- Th17 cell enrichment (p ≤ 0.001) in colon tumors is complex. While Th17 cells can sometimes exert anti-tumor effects, in many solid tumors, including colorectal cancer, they are often associated with chronic inflammation that promotes tumor growth, angiogenesis, and metastasis [PubMed search: Th17 cells colorectal cancer]. Their increased presence might reflect a pro-inflammatory, pro-tumorigenic milieu.
- Tfh cell enrichment (p ≤ 0.01) could indicate altered B cell responses within the tumor. Tfh cells are crucial for germinal center reactions and B cell maturation. While B cells can have anti-tumor functions, their roles can be context-dependent, and an increase in Tfh might support B regulatory cells or contribute to specific humoral responses that do not effectively clear the tumor.
- Impaired Anti-tumor Immunity:
- Cytotoxic T cell (T_Cyto) depletion (p ≤ 0.05) in tumor tissue is a critical finding. Cytotoxic T cells, primarily CD8+ T cells, are the main effectors of anti-tumor immunity, directly killing cancer cells [GeneCards: CD8A]. Their reduced proportion in the tumor microenvironment suggests a weakened host anti-tumor response and potentially immune evasion by cancer cells.
- ILC1 cell depletion (p ≤ 1e-4) is also indicative of diminished anti-tumor immunity. ILC1s are innate counterparts of Th1 cells, producing IFN-$\gamma$ and contributing to cytotoxic responses against tumors and infected cells [PubMed search: ILC1 cancer immunity]. Their decrease further points to a less robust anti-tumor immune landscape.
- ILC3(-) and LTI cell depletion (p ≤ 0.05 and p ≤ 1e-5, respectively) in tumor tissue suggests a disruption of normal tissue homeostasis and lymphoid organization. ILC3s are important for gut homeostasis and defense against extracellular bacteria, and LTI cells are essential for the formation of organized lymphoid structures, including tertiary lymphoid structures (TLS) that can foster anti-tumor immunity in some contexts [PubMed search: LTI cells tumor immunity]. Their reduction might indicate a loss of normal immune architectural support in the tumor.
- ILC2 cell depletion (p = 0.06) is also notable. ILC2s are involved in type 2 immunity and tissue repair. While their role in cancer is diverse, a reduction might reflect a shift away from tissue repair mechanisms or specific anti-tumor responses that ILC2s might mediate.
Clinical or Translational Implications
These findings have significant clinical and translational implications for colon cancer:
- Prognostic Marker: The observed immune cell shifts, particularly the increased Treg and decreased Cytotoxic T cell populations, are often associated with poorer prognosis and reduced response to conventional therapies in various cancers, including colorectal cancer.
- Immunotherapy Target Identification: The enrichment of immunosuppressive cells like Tregs highlights these populations as potential targets for immunotherapy. Strategies aimed at depleting Tregs or inhibiting their function could enhance anti-tumor immunity [PubMed search: Treg depletion cancer therapy]. Similarly, modulating Th17 responses might be considered.
- Restoring Anti-tumor Immunity: The deficit in cytotoxic T cells and ILC1s suggests a need for therapeutic approaches that can promote the infiltration, activation, and persistence of these effector cells within the tumor microenvironment. This could involve checkpoint blockade, adoptive cell therapies, or novel vaccine strategies.
- Understanding Immune Evasion: The data illustrate how colon tumors actively shape their immune environment to favor immune evasion, providing a blueprint for understanding disease progression and resistance mechanisms.
9. Macrophage Cell Population Check
[Analysis Visualization Results]...
Analysis Overview
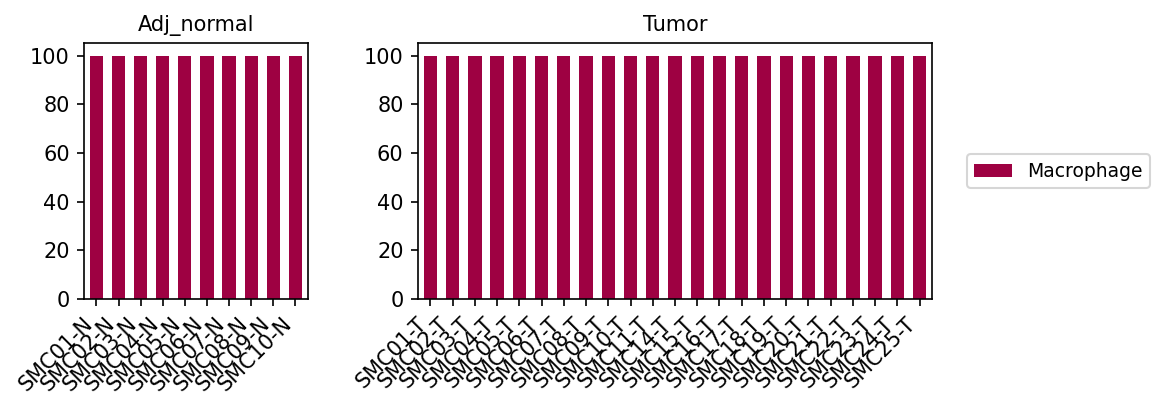
This analysis aimed to visualize the population of 'Macrophage' cells from the celltype_minor annotation level across different samples and conditions. The plot_celltype_population tool was utilized with parameters specifically set to target cells annotated as 'Macrophage' and display their proportions.
Visual Summary
The provided bar plot is divided into two panels, representing the 'Adj_normal' and 'Tumor' conditions, respectively. Each panel displays bars for individual samples within that condition (e.g., SMC01-N to SMC10-N for Adj_normal, and SMC01-T to SMC25-T for Tumor). All bars, colored dark red and labeled 'Macrophage' in the legend, extend to the 100% mark on the y-axis, which represents the percentage of cells.
Biological Interpretation
This visualization serves primarily as a confirmation of the successful filtering and consistent annotation of 'Macrophage' cells across all analyzed samples and conditions. Since the plot_celltype_population tool was directed to target cells specifically classified as 'Macrophage' from the celltype_minor annotation, the plot inherently shows that within this already filtered group, 100% of the cells are indeed 'Macrophage'.
This result indicates that:
- The cell type annotation for 'Macrophage' at the celltype_minor level is clear and consistent throughout the dataset.
- The filtering process successfully isolated the intended cell population.
It is important to understand what this plot does *not* convey:
- Relative Abundance: This plot does not show the overall proportion of macrophages relative to all other cell types within the colon tissue samples. Therefore, it cannot be used to infer whether macrophage numbers are increased or decreased in tumor versus adjacent normal tissue.
- Macrophage Subtypes: The plot does not differentiate between various macrophage subtypes (e.g., Macrophage (M1), Macrophage (M2A, M2B, M2C, M2D) which are available under celltype_subset). Changes in the polarization or composition of macrophage subtypes are critical in diseases like colorectal cancer. For instance, M1 macrophages are typically pro-inflammatory and anti-tumorigenic, while M2 macrophages often promote tumor growth and metastasis PubMed Search: M1 M2 macrophages colorectal cancer.
- Condition-specific changes in macrophage composition: As all bars are at 100%, no shifts in macrophage population composition are observed *within the context of this specific visualization*.
To gain deeper biological insight into macrophages in colon cancer, future analyses would need to focus on comparing the overall proportion of macrophages (relative to other cell types) between conditions, or by breaking down the 'Macrophage' population into its celltype_subset components (M1/M2 subtypes) to assess their distribution and potential shifts in the tumor microenvironment.
Annotation Notes
The consistent 100% value across all samples and conditions for the 'Macrophage' population within itself is a positive indicator for the quality and reliability of the celltype_minor annotation for this specific cell type. It confirms that the 'Macrophage' cell identity is well-defined and accurately captured within the dataset.
10. Macrophage Subset Population Shifts in Colon Tumor Microenvironment
[Analysis Visualization Results]...
Analysis Overview
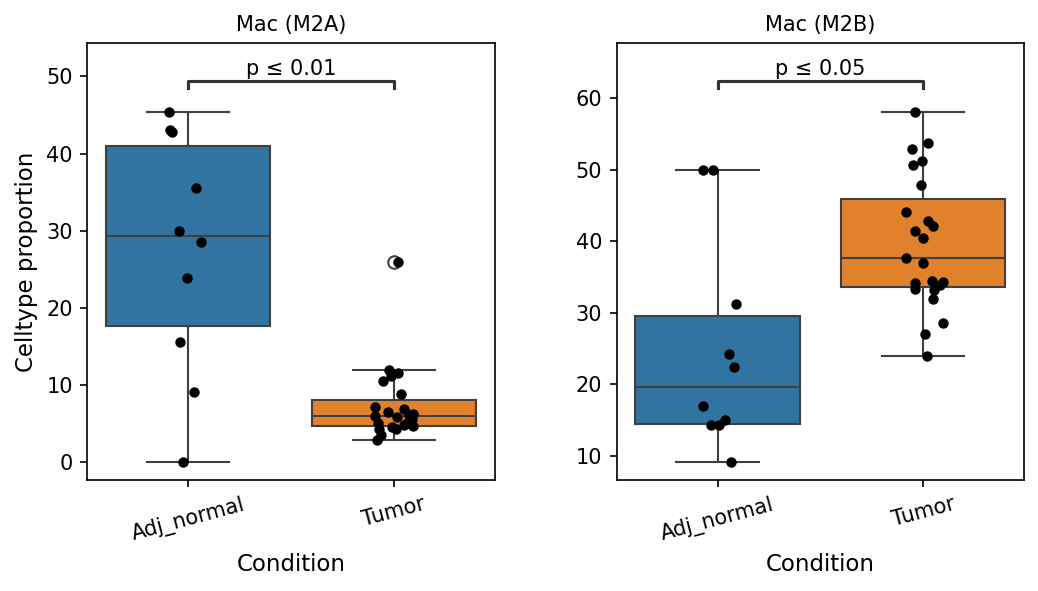
This analysis investigates the proportions of various macrophage subset populations (specifically M2A and M2B) within the colon tissue, comparing Tumor and Adjacent Normal conditions using single-cell RNA sequencing data. The goal is to identify significant shifts in these immune cell populations that may contribute to the tumor microenvironment. The plot_box_for_celltype_population_with_signif_difference tool was used to visualize these differences and assess their statistical significance.
Visual Summary
The box plots illustrate the celltype proportion of Macrophage (M2A) and Macrophage (M2B) subsets across 'Adj_normal' and 'Tumor' conditions.
- Mac (M2A) Population: The proportion of Macrophage (M2A) cells is significantly decreased in the 'Tumor' condition compared to the 'Adj_normal' condition (p ≤ 0.01). In 'Adj_normal' tissue, the median M2A proportion is around 30%, whereas in 'Tumor' tissue, it drops to approximately 7-8%.
- Mac (M2B) Population: Conversely, the proportion of Macrophage (M2B) cells is significantly increased in the 'Tumor' condition compared to the 'Adj_normal' condition (p ≤ 0.05). The median M2B proportion is around 20% in 'Adj_normal' tissue, rising to approximately 38% in 'Tumor' tissue.
Biological Interpretation
Macrophages are key components of the tumor microenvironment (TME) in colorectal cancer, and their polarization into different functional subsets, such as M1 (pro-inflammatory) and M2 (anti-inflammatory/pro-tumorigenic), is critical for disease progression. However, the M2 classification itself is heterogeneous, encompassing subsets like M2A, M2B, M2C, and M2D, each with distinct activation pathways and functional profiles.
- Reduced M2A Macrophages in Tumor: M2A macrophages are typically activated by Th2 cytokines like IL-4 and IL-13 and are involved in allergic responses, parasitic infections, and tissue repair. Their significant decrease in colon tumors suggests a potential shift away from this specific "wound-healing" phenotype or a reduced recruitment/survival of M2A-polarized macrophages in the chronic inflammatory and immunosuppressive milieu of the tumor. This finding might indicate that the tumor microenvironment does not favor M2A polarization, or that other macrophage subsets become more dominant.
- Increased M2B Macrophages in Tumor: M2B macrophages are uniquely activated by immune complexes (e.g., IgG) in conjunction with TLR or IL-1R agonists. They produce a mixed cytokine profile, including both pro-inflammatory (e.g., IL-1β, TNF-α) and anti-inflammatory (e.g., IL-10) mediators. The significant increase of M2B macrophages in colon tumors indicates their enhanced presence and potential contribution to the unique inflammatory and immunosuppressive landscape of the colon TME. This suggests that immune complexes and TLR/IL-1R signaling might be particularly active in driving macrophage polarization within colon cancer, potentially contributing to tumor growth, angiogenesis, and immune evasion [1]. The precise role of M2B macrophages in colorectal cancer is complex and can be context-dependent, sometimes exhibiting dual functions.
Overall, these findings highlight a dynamic reprogramming of macrophage populations within the colon tumor microenvironment, with a specific decrease in M2A and a notable increase in M2B subsets. This indicates that colon tumors specifically recruit or induce the differentiation of certain macrophage populations over others, tailoring the immune landscape to support tumor growth and progression.
Clinical or Translational Implications
The observed shifts in specific macrophage subsets in colon cancer carry important clinical and translational implications:
- Biomarker Potential: The distinct changes in M2A and M2B proportions could serve as potential biomarkers for colon cancer progression or as indicators of the immunological state of the TME. Monitoring these populations might aid in patient stratification.
- Therapeutic Targeting: The significant increase in M2B macrophages suggests they may represent a promising therapeutic target. Strategies aimed at blocking M2B recruitment, inhibiting their activation pathways (e.g., TLR or IL-1R signaling in combination with immune complexes), or re-educating these cells towards an anti-tumorigenic phenotype could be explored to enhance anti-cancer immunity in colon cancer [2].
- Understanding Immune Evasion: The differential regulation of macrophage subsets contributes to the complex mechanisms of immune evasion in colon cancer. Further characterization of the functional roles and molecular signatures of these specific macrophage subsets in colon tumors (e.g., through DEG and GSEA analyses) could reveal novel pathways to counteract tumor-promoting inflammation and immunosuppression.
References
- Review on Macrophage polarization in cancer: https://www.ncbi.nlm.nih.gov/pmc/articles/PMC6199427/ (A comprehensive review covering M2 macrophage subsets and their roles in cancer.)
- Macrophage targeting in cancer therapy: https://www.ncbi.nlm.nih.gov/pmc/articles/PMC8909280/ (Review discussing therapeutic strategies to target macrophages in the tumor microenvironment.)
11. Ploidy Analysis of Intestinal Epithelial Cells in Colon Cancer
[Analysis Visualization Results]...
Analysis Overview
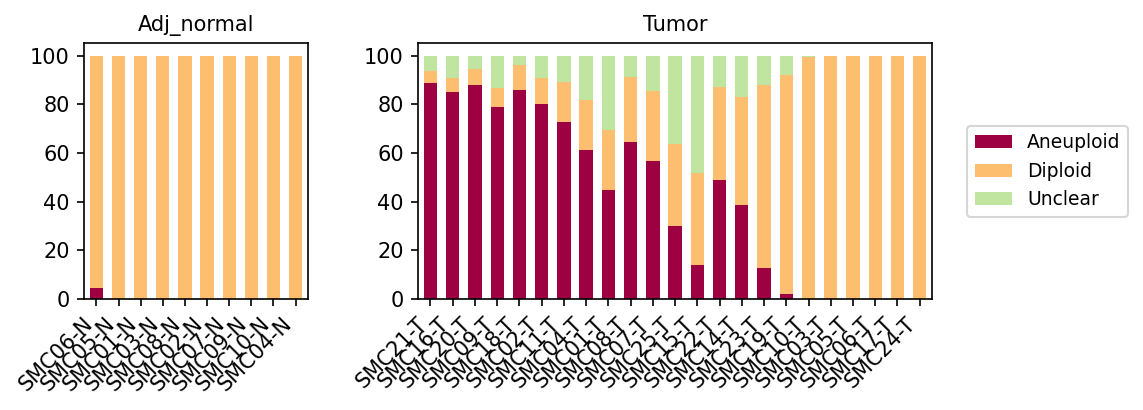
This analysis investigates the ploidy status (Aneuploid, Diploid, or Unclear) of Intestinal Epithelial cells across various samples from both 'Adj_normal' (adjacent normal) and 'Tumor' conditions. Intestinal Epithelial cells are identified as the tumor origin cell type in this dataset, making their ploidy status a critical indicator of genomic stability and malignancy. The ploidy inference is derived from CNV estimates.
Visual Summary
The bar plots display the proportional distribution of aneuploid, diploid, and unclear cells within the Intestinal Epithelial cell population for each individual sample, grouped by 'Adj_normal' and 'Tumor' conditions.
- Adjacent Normal Samples (Adj_normal): The majority of Intestinal Epithelial cells in adjacent normal samples (e.g., SMC06-N, SMC05-N, etc.) are almost exclusively classified as Diploid (orange bars). Only one sample (SMC06-N) shows a very minor fraction of Aneuploid cells. The 'Unclear' category is virtually absent. This pattern is consistent with healthy, non-malignant epithelial tissue.
- Tumor Samples (Tumor): In stark contrast, Intestinal Epithelial cells from tumor samples exhibit substantial heterogeneity in ploidy.
- A significant proportion of tumor samples (ee.g., SMC21-T, SMC16-T, SMC20-T, SMC09-T, SMC18-T, SMC02-T, SMC11-T, SMC04-T) show a high prevalence of Aneuploid cells (maroon bars), often exceeding 70-80% of the population within those samples.
- Other tumor samples (e.g., SMC01-T, SMC08-T, SMC07-T, SMC25-T, SMC15-T, SMC22-T, SMC14-T, SMC23-T, SMC19-T, SMC10-T, SMC03-T, SMC05-T, SMC06-T, SMC17-T, SMC24-T) show a lower proportion of Aneuploid cells, with some being predominantly Diploid.
- The 'Unclear' category (light green bars) is present in several tumor samples, indicating cases where ploidy could not be definitively assigned.
Biological Interpretation
The observed ploidy patterns strongly support the distinction between normal and tumor-derived Intestinal Epithelial cells.
- Genomic Stability in Normal Tissue: The near-complete diploidy in Intestinal Epithelial cells from 'Adj_normal' samples reflects the expected genomic stability of healthy somatic cells. This serves as a critical baseline, confirming the fidelity of the ploidy inference method in a non-malignant context.
- Aneuploidy as a Hallmark of Cancer: The high frequency of aneuploidy in a significant subset of Intestinal Epithelial cells from 'Tumor' samples is a classic hallmark of cancer. Aneuploidy, or an abnormal number of chromosomes, is a major driver of genomic instability and plays a critical role in tumor initiation, progression, and heterogeneity [1]. Given that Intestinal Epithelial cells are the tumor origin cell type, these aneuploid cells are highly likely to represent the malignant population.
- Tumor Heterogeneity: The variability in aneuploidy levels among different tumor samples (some highly aneuploid, others largely diploid) highlights the inherent genomic heterogeneity within colon cancer. This could reflect different stages of tumor evolution, varying degrees of genomic instability, or the presence of subclones with different ploidy states within the same tumor. In samples predominantly diploid, it is possible that these cells represent early-stage tumors with less pronounced aneuploidy, or that the specific sample composition has a higher proportion of non-malignant epithelial cells (e.g., tumor microenvironment contamination, or non-tumorigenic epithelial cells within the tumor bulk). The 'Unclear' calls could also contribute to this complexity, potentially indicating challenging cases for ploidy assignment or intermediate genomic states.
Clinical or Translational Implications
The ploidy analysis provides important insights for both diagnostic and therapeutic considerations in colon cancer.
- Biomarker for Malignancy: High levels of aneuploidy in Intestinal Epithelial cells can serve as a robust indicator of malignancy, differentiating cancerous cells from healthy ones, particularly in the context of single-cell resolution.
- Prognostic Value: The extent of aneuploidy is often correlated with tumor aggressiveness and patient prognosis in various cancers [2]. Further investigation into the specific copy number alterations contributing to aneuploidy could reveal insights into tumor behavior and potential therapeutic vulnerabilities.
- Therapeutic Targeting: Tumors with high aneuploidy often exhibit vulnerabilities related to their perturbed cell cycle and chromosomal segregation machinery. Understanding the ploidy status can guide the development or selection of therapies that specifically target aneuploid cells, potentially leading to more effective treatment strategies.
- Monitoring Tumor Evolution: Tracking changes in ploidy status over time or in response to treatment could offer a valuable way to monitor tumor evolution, detect recurrence, or assess treatment efficacy.
References
- Aneuploidy as a hallmark of cancer: PubMed search for "aneuploidy cancer hallmark" https://pubmed.ncbi.nlm.nih.gov/?term=aneuploidy+cancer+hallmark
- Aneuploidy and prognosis: PubMed search for "aneuploidy cancer prognosis" https://pubmed.ncbi.nlm.nih.gov/?term=aneuploidy+cancer+prognosis
12. Colon Cancer Cell-Cell Interaction Patterns by Condition
[Analysis Visualization Results]...
Analysis Overview
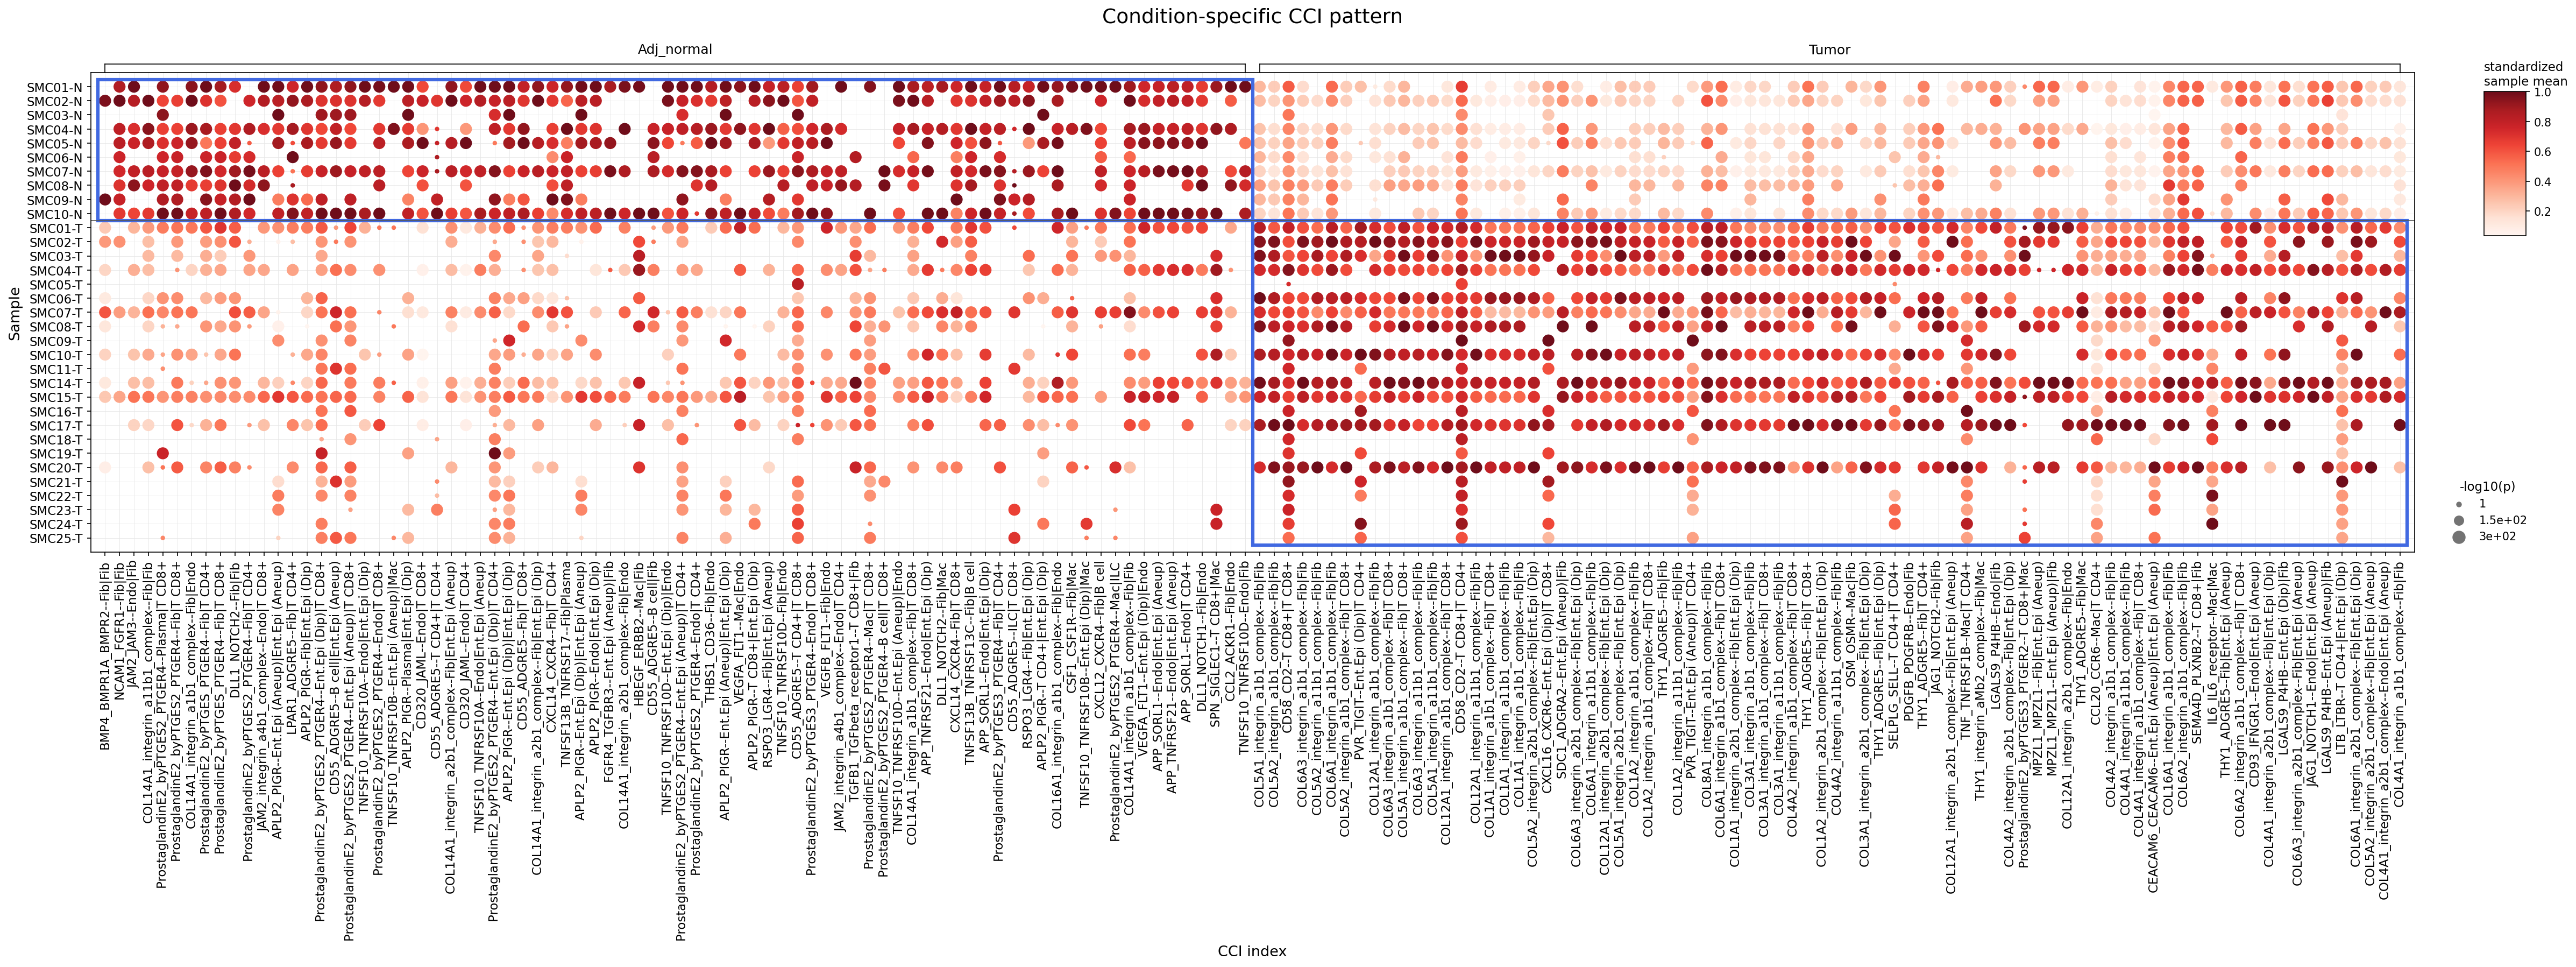
This analysis investigates condition-specific cell-cell interaction (CCI) patterns between tumor-origin cells (Intestinal Epithelial cells), fibroblasts, macrophages, and T cells (CD4+, CD8+) in Colon tissue. Using single-cell RNA sequencing data, CellPhoneDB was employed to identify ligand-receptor interactions, and the results were visualized to compare interaction strength and significance between 'Adj_normal' (adjacent normal tissue) and 'Tumor' conditions across multiple samples. The plot highlights the top 80 interactions with the lowest p-values for each condition, allowing for a focused comparison of intercellular communication dynamics in healthy versus cancerous colon microenvironments.
Visual Summary
The dot plot visualizes the standardized mean interaction strength (color intensity, redder indicates stronger) and significance (-log10(p-value), larger dot indicates more significant) for selected cell-cell interactions across individual samples, grouped by 'Adj_normal' and 'Tumor' conditions.
- Distinct Condition-Specific Patterns: There is a clear visual distinction between the 'Adj_normal' and 'Tumor' conditions. The 'Adj_normal' samples (SMC01-N to SMC10-N) generally display a highly consistent and robust pattern of strong and significant interactions across a broad range of ligand-receptor pairs. This is evident from the dense block of dark red, large dots in the left blue-boxed region.
- Attenuation in Tumor: In contrast, many of the interactions that are strong and consistent in 'Adj_normal' samples appear significantly attenuated or absent in the 'Tumor' samples. For example, a large cluster of collagen-integrin interactions (e.g., COL12A1_integrin_a2b1_complex-Fib|Ent.Epi (Dip)) that are prominent in normal tissue are much weaker or sporadic in tumor samples.
- Emergence of Tumor-Associated Interactions: While some homeostatic interactions diminish, new or upregulated interaction patterns emerge in the 'Tumor' samples. These interactions often involve Intestinal Epithelial cell (Aneuploid), which represents the tumor cells, as an interaction partner. The right blue-boxed region, though less uniformly dense than the normal tissue, shows specific clusters of strong interactions relevant to the tumor microenvironment.
- Key Interaction Categories:
- Collagen-Integrin Interactions: A large number of interactions involve various collagen types (e.g., COL1A1, COL3A1, COL4A1, COL5A1, COL6A1, COL11A1, COL12A1) binding to integrin complexes. These are highly prevalent in normal tissue, often between Fibroblasts and Diploid Intestinal Epithelial cells, or between Fibroblasts themselves. In tumor, some of these persist, but often involving Aneuploid Intestinal Epithelial cells.
- Prostaglandin E2 Signaling: Interactions involving ProstaglandinE2_by_PTGES2 with receptors PTGER2 or PTGER4 are frequently observed in both conditions, interacting with T cells (CD4+, CD8+), Macrophages, and Epithelial cells (both Diploid and Aneuploid).
- Immune/Inflammatory Signaling: Interactions such as TNFSF10 (TRAIL) with TNFRSF receptors, CD55 with ADGRE5, and chemokine signaling like CXCL12-CXCR4 are also present, showing differential activity between conditions.
Biological Interpretation
The observed shifts in cell-cell interaction patterns underscore profound changes in the colon tissue microenvironment during tumor development.
- Remodeling of the Extracellular Matrix (ECM) and Epithelial-Stromal Crosstalk: The robust and diverse collagen-integrin interactions in adjacent normal tissue highlight a stable and organized ECM, crucial for maintaining tissue architecture and epithelial cell homeostasis. Integrins are key receptors mediating cell-ECM adhesion and signaling. In the tumor context, the attenuation of many of these 'normal' collagen-integrin interactions suggests significant ECM remodeling. However, the emergence of specific collagen-integrin interactions involving Intestinal Epithelial cell (Aneuploid) (e.g., COL1A1_integrin_a1b1_complex-Fib|Ent.Epi (Aneup)) indicates a switch to interactions that may facilitate tumor cell invasion, proliferation, and survival within a desmoplastic stroma characteristic of colorectal cancer. [Reference: Role of Integrins in Cancer: A Systematic Review, PubMed search: Integrin cancer review]
- Immune Landscape Alterations via Prostaglandin E2: Prostaglandin E2 (PGE2) signaling, mediated by PTGES2 and PTGER receptors, is a central regulator of inflammation and immunity. Its altered interactions with T cells (CD4+, CD8+), Macrophages, and Intestinal Epithelial cells (Aneuploid) in the tumor microenvironment are critical. PGE2 can be immunosuppressive, promoting tumor growth by inhibiting T cell function, promoting Treg cells, and shaping macrophage polarization towards a pro-tumor (M2-like) phenotype. Its strong presence in interactions with aneuploid epithelial cells suggests a direct pro-tumorigenic role for PGE2 signaling originating from or influencing tumor cells. [Reference: Prostaglandin E2 in cancer: The role of inflammation and immunity, PubMed search: PGE2 cancer immunity]
- Emergence of Tumor-Promoting Interactions:
- APLP2-PIGR Axis: Interactions like APLP2_PIGR-Ent.Epi (Aneup) with fibroblasts, macrophages, and endothelial cells are prominent in tumor. PIGR, typically associated with mucosal immunity and transport of secretory IgA, might be hijacked by tumor cells. APLP2 has been implicated in cell adhesion and signaling, and its altered interactions could contribute to tumor progression.
- CXCL12-CXCR4 Signaling: The presence of CXCL12-CXCR4 interactions (e.g., between Fibroblasts and B cells, or Macrophages and Fibroblasts) is notable. This chemokine axis is a well-known driver of tumor cell migration, invasion, angiogenesis, and immune cell recruitment, often leading to an immunosuppressive tumor microenvironment. [Reference: The CXCL12-CXCR4 axis in cancer: from basic science to therapeutic targeting, PubMed search: CXCL12 CXCR4 cancer]
- Immune Checkpoint and Complement Evasion: The CD55_ADGRE5 interaction with Intestinal Epithelial cell (Aneuploid) could reflect mechanisms of immune evasion. CD55 (Decay Accelerating Factor, DAF) is a complement regulatory protein frequently overexpressed in cancer cells, protecting them from complement-mediated lysis. This suggests that tumor cells are actively engaging mechanisms to evade host immune surveillance.
In summary, the transition from 'Adj_normal' to 'Tumor' involves a re-orchestration of intercellular communication. The organized homeostatic interactions are disrupted and replaced by new or dysregulated pathways that favor tumor growth, immune escape, and ECM remodeling, particularly involving the aneuploid tumor epithelial cells and their stromal partners.
Clinical or Translational Implications
The identified condition-specific cell-cell interactions offer potential avenues for therapeutic intervention and biomarker discovery in colon cancer:
- Targeting ECM Remodeling: The shift in collagen-integrin interactions, especially those involving aneuploid epithelial cells and fibroblasts, suggests that interfering with specific integrin-mediated signaling or the enzymes responsible for ECM remodeling (e.g., MMPs, not directly shown but implied by ECM changes) could disrupt tumor cell invasion and metastasis.
- Immunomodulation via PGE2: The prominent role of Prostaglandin E2 signaling in the tumor microenvironment, particularly with T cells and macrophages, points to COX inhibitors or specific PTGER receptor antagonists as potential adjunctive therapies to enhance anti-tumor immunity.
- Disrupting Pro-tumorigenic Axes: Inhibitors targeting the CXCL12-CXCR4 axis are already under investigation in various cancers for their potential to reduce metastasis and improve immune cell infiltration. The strong presence of this interaction in colon tumor samples further supports its therapeutic relevance.
- Overcoming Immune Evasion: The involvement of complement regulatory proteins like CD55 in interactions with tumor epithelial cells highlights a potential mechanism of immune evasion. Developing strategies to counteract this protection could enhance the efficacy of immunotherapies.
13. Tumor Microenvironment Cell-Cell Interaction Analysis
[Analysis Visualization Results]...
Analysis Overview
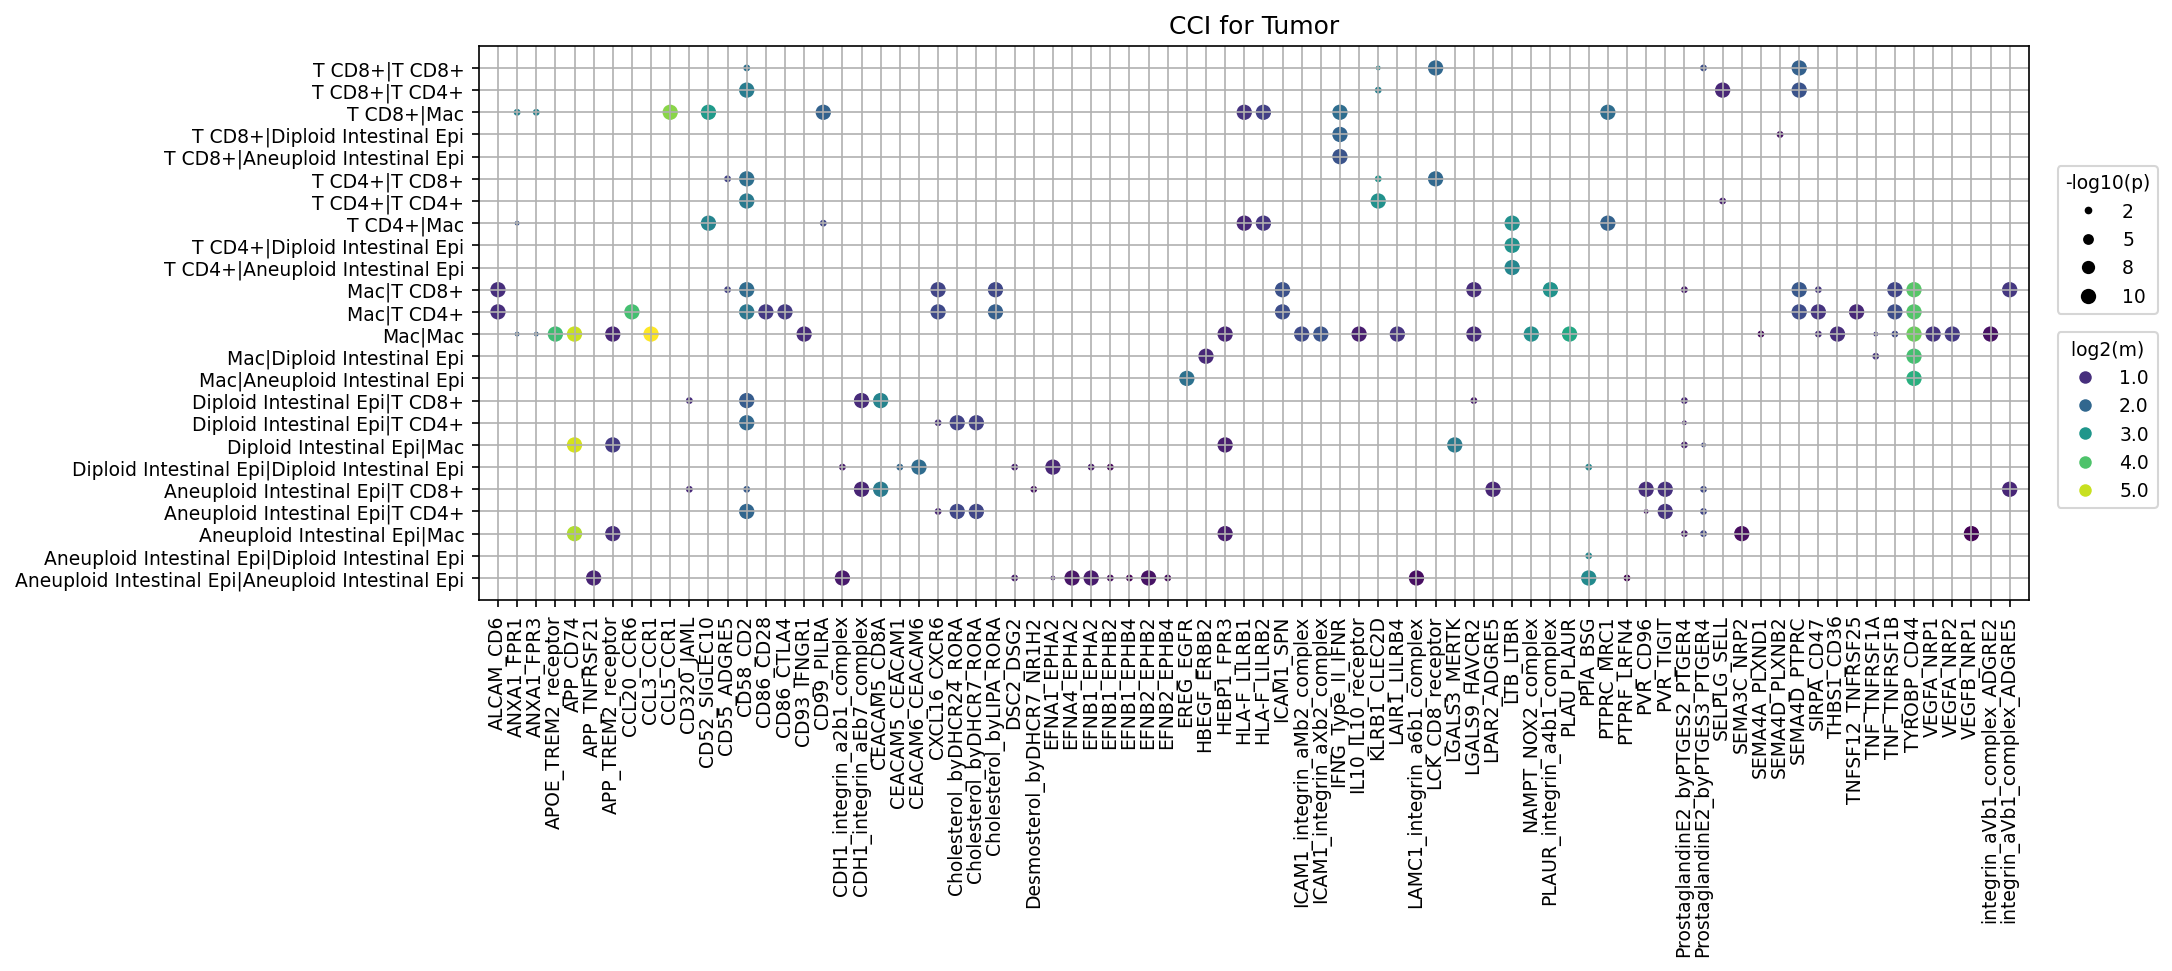
This analysis investigates the most significant and strong cell-cell interactions (CCIs) within the tumor microenvironment (TME) of human colon tissue, specifically focusing on the "Tumor" condition. Using CellPhoneDB, ligand-receptor pairs mediating communications between different cell types, including distinct ploidy states of Intestinal Epithelial cells (Diploid and Aneuploid), T cells (CD4+, CD8+), and Macrophages, were identified and visualized. The analysis highlights the top 80 interactions based on statistical significance (p-value) and interaction strength (mean expression level).
Visual Summary
The dot plot displays cell-cell communication pairs on the y-axis and specific ligand-receptor interactions on the x-axis. The size of each dot correlates with the negative logarithm of the p-value (-log10(p)), indicating the statistical significance of the interaction. Larger dots represent more significant interactions. The color intensity of the dots represents the logarithm of the mean expression level (log2(m)) of the ligand-receptor pair, indicating the strength of the interaction; brighter (yellow/green) colors denote stronger interactions.
Key observations from the plot for the "Tumor" condition include:
- Aneuploid Intestinal Epithelial Cell Interactions: Aneuploid Intestinal Epithelial cells, likely representing the malignant component, show numerous and often very strong interactions (large, bright dots) both among themselves and with immune cells, particularly Macrophages.
- Self-interactions (Aneuploid Intestinal Epi|Aneuploid Intestinal Epi) are prominently strong for Integrin alphaV beta1 complex (integrin_avB1_complex, integrin_avB1_complex_ADGRES), suggesting crucial roles in tumor cell cohesion and extracellular matrix (ECM) interactions.
- Interactions between Aneuploid Intestinal Epi and Mac (Macrophages) are also highly significant and strong, notably involving CCL20-CCR6, APP-CD74, and APP-TNFRSF21.
- Macrophage Interactions: Macrophages (Mac) display robust self-interactions (Mac|Mac) and strong interactions with both Diploid and Aneuploid Intestinal Epithelial cells. The CCL20-CCR6, APP-CD74, and APP-TNFRSF21 ligand-receptor pairs are consistently highlighted in these interactions, suggesting a central role for macrophages in shaping the tumor microenvironment.
- T Cell Interactions: T cells (both CD4+ and CD8+) exhibit several interactions with Macrophages and Intestinal Epithelial cells. While generally less strong or significant than macrophage-epithelial interactions, notable pairs include ICAM1-integrin_aXb2_complex (T CD4+|Mac), CD86-CD28 (T CD8+|Mac), and LAIR1-LILRB4 (T CD8+|Mac), which are critical for T cell adhesion, activation, and inhibition.
Prominent Ligand-Receptor Pathways
- Integrin complexes: Appear frequently and strongly, especially in epithelial-epithelial interactions, indicating their importance in cell adhesion, migration, and matrix remodeling.
- Chemokines: CCL20-CCR6 and CXCL16-CXCR6 are significant, implying active recruitment and trafficking of immune cells.
- Ephrin-Eph receptors: Interactions such as EFNA1-EPHA2 and EFNB1-EPHA2 are observed, involved in cell-cell contact, migration, and angiogenesis.
- TNF Superfamily: APP-TNFRSF21 and TNF-TNFRSF1A/B interactions suggest roles in inflammation, cell survival, and immune regulation.
Biological Interpretation
The observed cell-cell interactions in the colon tumor environment provide insights into the complex interplay driving tumor progression and immune modulation.
- Malignant Epithelial Cell Adhesion and Invasion: The strong self-interactions of Aneuploid Intestinal Epi cells via integrin_avB1_complex and integrin_avB1_complex_ADGRES underscore the importance of cell-cell and cell-extracellular matrix adhesion for tumor growth and potentially metastasis. Integrins are well-known mediators of tumor cell survival, proliferation, and invasion [1].
- Macrophage-Mediated Immune Evasion and Tumor Promotion: The prominent interactions between Macrophages and Aneuploid Intestinal Epi via CCL20-CCR6 and APP-CD74 are highly relevant.
- CCL20-CCR6: This axis is frequently implicated in recruiting regulatory T cells (Tregs) and myeloid-derived suppressor cells (MDSCs) into the TME, contributing to immune suppression and fostering tumor growth [2]. Macrophages themselves can express both CCL20 and CCR6, indicating potential autocrine loops that perpetuate pro-tumorigenic macrophage polarization.
- APP-CD74: CD74 is a receptor for Macrophage Migration Inhibitory Factor (MIF), a cytokine often overexpressed in cancer and associated with inflammation and tumor progression. Interactions involving APP and CD74 could signify a pathway for macrophage activation and signaling within the TME, contributing to tumor-promoting inflammation [3].
- Immune Cell Regulation: While less dominant, interactions involving T cells provide crucial context.
- CD86-CD28: This co-stimulatory pathway for T cell activation is observed between T CD8+ and Mac, suggesting active communication for immune responses, although the overall tumor environment could be immunosuppressive.
- LAIR1-LILRB4: The interaction between T CD8+ and Mac involving LAIR1 (Leukocyte-associated immunoglobulin-like receptor 1) and LILRB4 (Leukocyte immunoglobulin-like receptor B4) are known inhibitory receptors. This could signify a mechanism of immune checkpoint inhibition, dampening anti-tumor T cell responses [4].
- Developmental and Angiogenic Pathways: The presence of Ephrin-Eph receptor interactions (e.g., EFNA1-EPHA2, EFNB1-EPHA2) points to the involvement of pathways critical for cell migration, angiogenesis, and cell-cell repulsion, all of which are important for tumor invasion and vascularization [5].
Clinical or Translational Implications
The identified significant cell-cell interactions within the colon tumor microenvironment offer several potential avenues for clinical and translational applications:
- Therapeutic Target Prioritization:
- Integrin alphaV beta1 complex: Given its strong role in aneuploid epithelial cell self-interaction, targeting this integrin could disrupt tumor cell cohesion, migration, and survival. Integrin inhibitors are already explored in oncology, and this specific complex could be a relevant target in colon cancer [1].
- CCL20-CCR6 axis: Inhibition of CCR6 or CCL20 could impede the recruitment of pro-tumorigenic immune cells (Tregs, MDSCs) and potentially re-sensitize the TME to immunotherapy. This axis represents a promising target to modulate the immune landscape.
- APP-CD74 pathway: Given the role of CD74 in MIF signaling, targeting this interaction could disrupt pro-inflammatory and pro-tumorigenic pathways driven by macrophages in the TME.
- LAIR1-LILRB4: As potential immune checkpoints, blocking LAIR1 or LILRB4 could release the brakes on anti-tumor T cell responses, offering a novel immune-oncology strategy, potentially in combination with existing checkpoint inhibitors [4].
- Biomarker Development: Highly active ligand-receptor pairs, particularly those associated with Aneuploid Intestinal Epithelial cells and their interactions with the immune milieu, could serve as prognostic or predictive biomarkers for disease progression, response to therapy, or recurrence. For instance, high expression of CCL20 or CCR6 could indicate a more immunosuppressive TME.
- Experimental Validation: The identified strong interactions warrant further experimental validation. In vitro co-culture experiments using colon cancer cell lines and immune cells, or in vivo studies using patient-derived xenografts (PDX) or organoid models, could confirm the functional relevance of these ligand-receptor pairs in driving specific tumor behaviors (e.g., proliferation, invasion, immune evasion).
References:
[1] Integrins in cancer. *GeneCards: The Human Gene Database*. https://www.genecards.org/Search/Keyword?query=integrin%20cancer
[2] The CCL20-CCR6 axis in cancer. *PubMed Search*. https://pubmed.ncbi.nlm.nih.gov/?term=CCL20+CCR6+cancer
[3] CD74 in cancer. *PubMed Search*. https://pubmed.ncbi.nlm.nih.gov/?term=CD74+cancer
[4] LAIR1 and LILRB4 in cancer immunology. *PubMed Search*. https://pubmed.ncbi.nlm.nih.gov/?term=LAIR1+LILRB4+cancer+immunology
[5] Ephrin-Eph receptors in cancer. *PubMed Search*. https://pubmed.ncbi.nlm.nih.gov/?term=Ephrin+Eph+receptor+cancer
14. Colon Cancer Microenvironment: Immune Checkpoint and Cell Cycle Gene-Mediated Cell-Cell Interactions
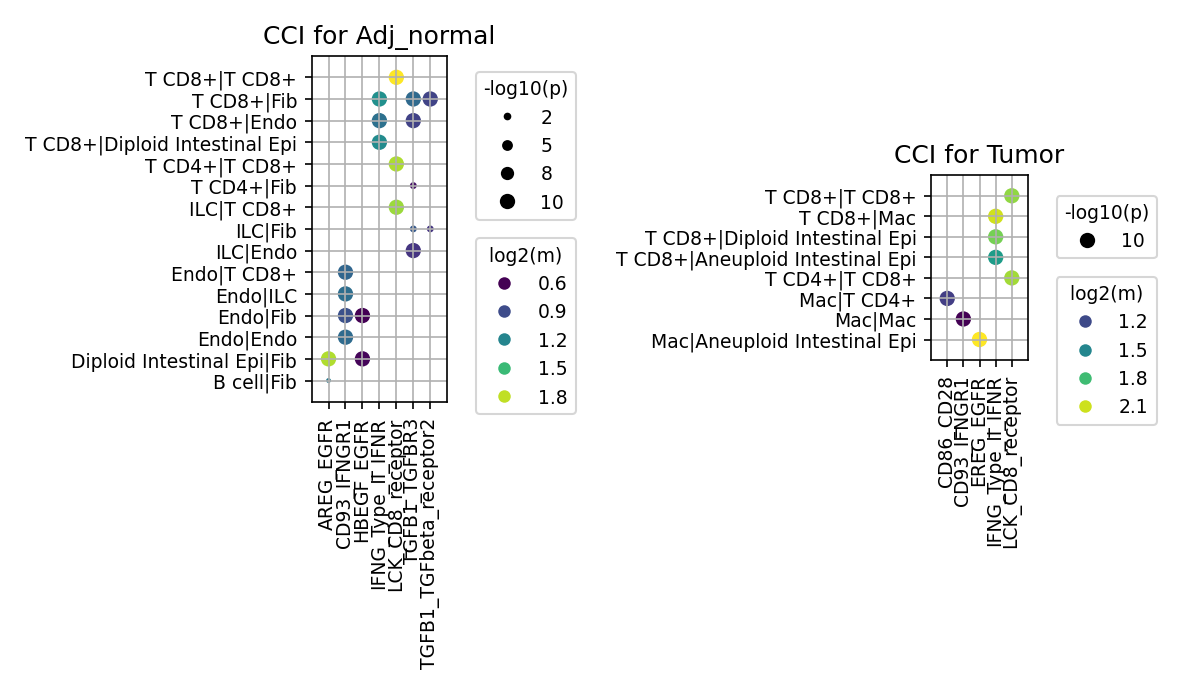
[Analysis Visualization Results]...
Analysis Overview
This analysis investigates cell-cell interactions (CCI) mediated by a curated set of genes related to immune checkpoints and cell cycle pathways in human colon tissue, comparing Tumor and Adjacent Normal (Adj_normal) conditions. Using single-cell RNA sequencing data, the plot_cci_dots tool was employed to visualize statistically significant ligand-receptor pairs and their interaction strengths between various cell types, with results aggregated by condition. The focus is on understanding how these critical pathways influence the cellular crosstalk within the colon microenvironment, particularly in the context of cancer progression.
Visual Summary
Adjacent Normal Condition
The dot plot for the Adj_normal condition reveals a diverse set of cell-cell interactions involving Intestinal Epithelial cells (specifically, Diploid Intestinal Epi), T cells (CD8+, CD4+), Endothelial cells (Endo), Fibroblasts (Fib), ILCs, and B cells. Key interaction pairs observed include:
- EGFR Signaling: AREG_EGFR and HBEGF_EGFR interactions are prominent, particularly between Endothelial cells, Fibroblasts, and Diploid Intestinal Epithelial cells.
- IFN-gamma Signaling: IFNG_Type_II_IFNR shows widespread interactions, notably between T CD8+ cells, Endothelial cells, ILCs, and Diploid Intestinal Epithelial cells.
- TGF-beta Signaling: TGFBI_TGFbeta_receptor2 interactions are observed between T CD8+ cells, Endothelial cells, ILCs, and Diploid Intestinal Epithelial cells/Fibroblasts.
- T Cell-related Signaling: LCK_CD8_receptor interactions are notable within T CD8+ populations and with Endothelial cells and ILCs, reflecting CD8+ T cell engagement.
- Other Interactions: CD93_IFNGR1 is present across various cell types, including ILCs, Endothelial cells, and B cells with Fibroblasts.
Tumor Condition
In contrast, the Tumor condition plot shows a more focused and distinct set of interactions, primarily involving T cells (CD8+, CD4+), Macrophages (Mac), and Aneuploid Intestinal Epithelial cells (Aneuploid Intestinal Epi), which are indicative of tumor cells. Key observations include:
- Immune Co-stimulation: CD86_CD28 interaction is highly significant, specifically between Macrophages and T CD4+ cells, indicating active immune engagement. [PubMed: CD28 signalling and T-cell activation: PubMed Search]
- EGFR Signaling: EREG_EGFR emerges as a prominent interaction between Macrophages and Aneuploid Intestinal Epithelial cells.
- IFN-gamma Signaling: IFNG_Type_II_IFNR remains highly active, particularly from T CD8+ cells to Macrophages and Aneuploid Intestinal Epithelial cells.
- T Cell-related Signaling: LCK_CD8_receptor interactions are highly significant and broad, involving T CD8+ cells with themselves, Macrophages, and Aneuploid Intestinal Epithelial cells.
Biological Interpretation
The comparison between Adj_normal and Tumor conditions highlights a significant rewiring of cell-cell communication networks, driven by genes involved in immune checkpoints and cell cycle regulation.
- Shift in Epithelial Cell Interactions: In the Adj_normal tissue, Diploid Intestinal Epithelial cells primarily engage with Fibroblasts and Endothelial cells via AREG_EGFR and TGFBI_TGFbeta_receptor2 signaling. This suggests mechanisms for tissue maintenance, growth, and homeostasis. In the Tumor microenvironment, Aneuploid Intestinal Epithelial cells (representing tumor cells) show strong interactions with immune cells. This critical shift underscores the distinct communication landscape of cancerous epithelial cells, which often co-opt immune and stromal components.
- Macrophage-T Cell Crosstalk in Tumor: The strong CD86_CD28 interaction between Macrophages and T CD4+ cells in the Tumor condition indicates active co-stimulation crucial for T cell activation. While this can signify an anti-tumor immune response, macrophages in tumors (TAMs) are highly plastic and can also adopt pro-tumor functions. [PubMed search: Tumor-associated macrophages function: PubMed Search]
- Emergence of EREG-EGFR Signaling in Tumor: The EREG_EGFR interaction, prominent between Macrophages and Aneuploid Intestinal Epithelial cells in the Tumor condition, is particularly notable. Epiregulin (EREG) is a known ligand for EGFR, often overexpressed in various cancers, promoting tumor cell proliferation, survival, and angiogenesis. Macrophage-derived EREG can directly stimulate tumor cell growth, indicating a pro-tumorigenic role for macrophages in this context. [GeneCards EREG: GeneCards]
- Persistent IFN-gamma Signaling: IFNG_Type_II_IFNR signaling remains robust in both conditions, but its cellular context changes. In Adj_normal, it involves a broader range of immune and stromal cells. In Tumor, it's strongly mediated by T CD8+ cells interacting with Macrophages and Aneuploid Intestinal Epithelial cells. This suggests an ongoing cytotoxic T cell response; however, tumor cells can develop mechanisms to evade IFN-gamma mediated killing or even utilize IFN-gamma for immune evasion.
- Role of LCK_CD8_receptor in T Cell Activity: The prominent LCK_CD8_receptor interactions (reflecting CD8+ T cell receptor signaling) in the Tumor microenvironment, especially with Aneuploid Intestinal Epithelial cells, points towards active engagement of cytotoxic T lymphocytes with tumor cells. This is a critical aspect of anti-tumor immunity.
- Immune Checkpoint & Cell Cycle Gene Presence: While specific immune checkpoint *ligand-receptor pairs* like PD-1/PD-L1 (PDCD1_CD274) are not highlighted in the top interactions shown, their constituent genes were part of the input. The observed CD86_CD28 interaction represents an important co-stimulatory pathway. The dominance of growth factor signaling (EGFR ligands) and IFN-gamma pathway genes among the most significant interactions underscores their central role in the colon tumor microenvironment.
Clinical or Translational Implications
The identified cell-cell interactions offer potential avenues for therapeutic intervention and further research in colon cancer:
- Targeting EREG-EGFR Axis: The EREG_EGFR interaction between Macrophages and Aneuploid Intestinal Epithelial cells in the tumor is a strong candidate for therapeutic targeting. Inhibiting EREG or EGFR signaling in the tumor microenvironment could disrupt pro-tumorigenic crosstalk and inhibit tumor growth. This could involve small molecule inhibitors or blocking antibodies, potentially in combination with other therapies.
- Modulating Macrophage Function: Given the dual role of macrophages (activating T cells via CD86-CD28, but potentially promoting tumor growth via EREG-EGFR), strategies to repolarize tumor-associated macrophages (TAMs) from a pro-tumorigenic to an anti-tumorigenic phenotype could be beneficial. This might involve targeting specific signaling pathways within macrophages that drive EREG expression.
- Enhancing Anti-tumor T Cell Responses: The strong IFNG_Type_II_IFNR and LCK_CD8_receptor interactions involving T CD8+ cells with Aneuploid Intestinal Epithelial cells indicate an existing anti-tumor immune response. Therapies aimed at boosting the efficacy or persistence of these cytotoxic T cells (e.g., adoptive cell transfer, vaccines, or overcoming T cell exhaustion) could be highly effective.
- Investigating Context-Dependent Immune Checkpoint Inhibition: While PD-1/PD-L1 were not top hits in this specific visualization, their known importance in colon cancer suggests further investigation into their less dominant, but potentially critical, interactions or context-specific roles is warranted. The dominance of CD86-CD28 suggests a potentially "hot" tumor with active immune responses, where combination therapies might be particularly relevant.
- Biomarker Identification: The strength and specificity of interactions like EREG_EGFR in the tumor could serve as prognostic or predictive biomarkers for patient response to specific treatments (e.g., EGFR inhibitors). Experimental validation, potentially using organoid models or in vivo studies, would be crucial to confirm these functional implications.
15. Condition-Specific Cell-Cell Interaction Patterns in Colon Cancer
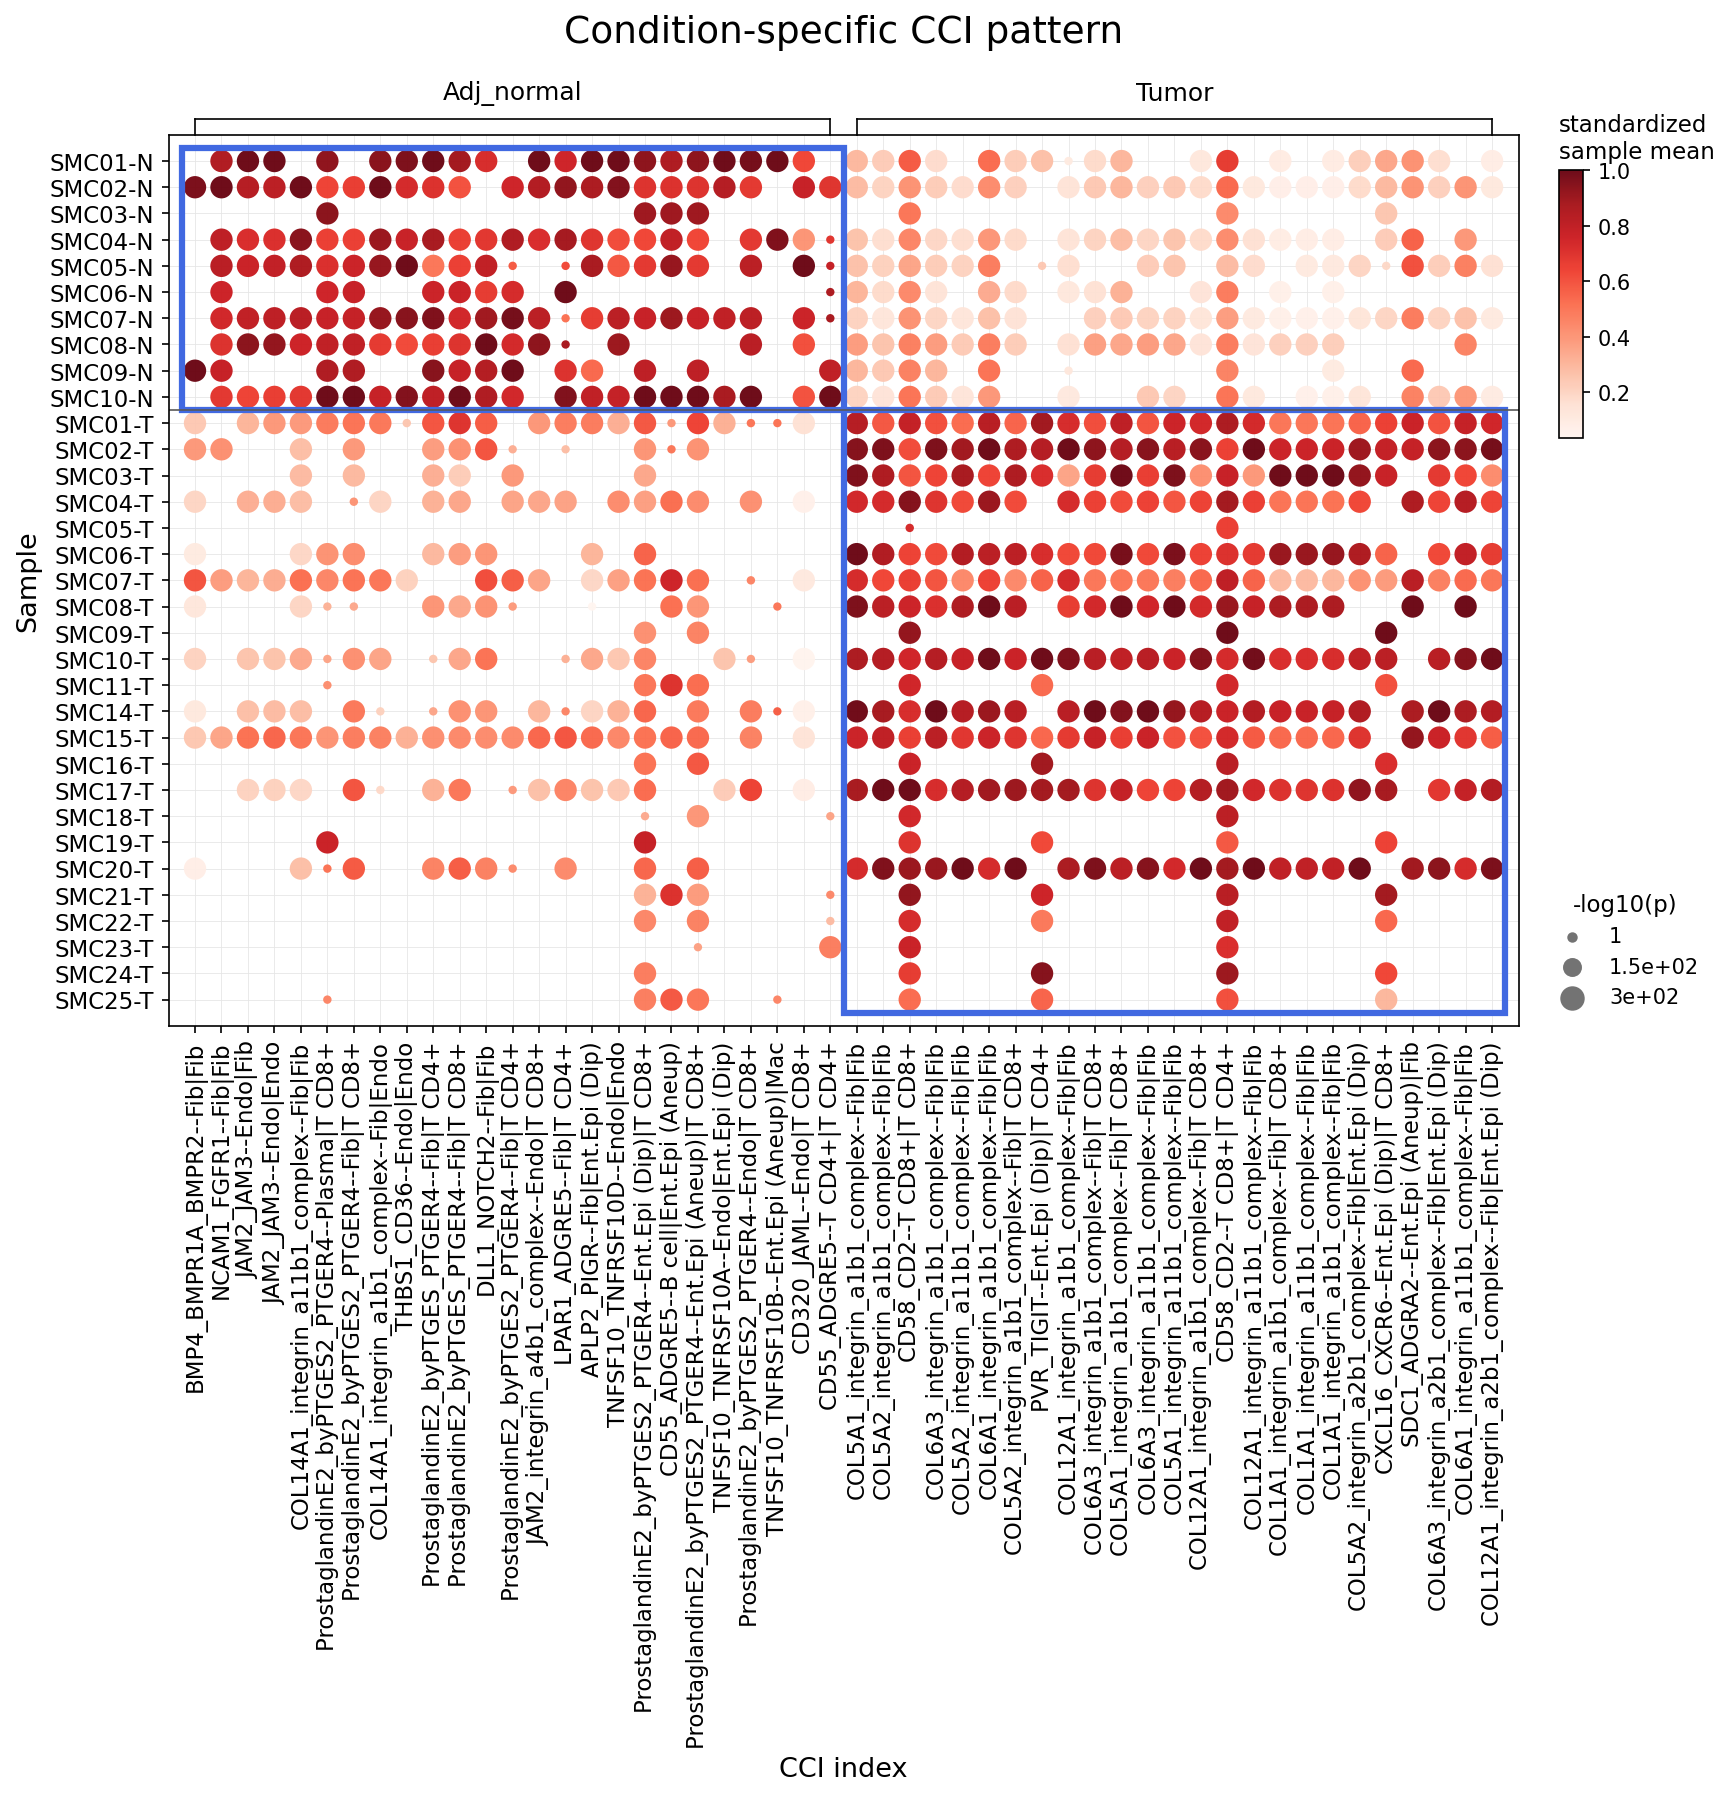
[Analysis Visualization Results]...
Analysis Overview
This analysis investigates statistically significant differences in cell-cell interactions (CCIs) between adjacent normal colon tissue and tumor tissue, focusing on major immune cells (B cell, Myeloid cell, T cell, Mast cell) and stromal cells (Stromal cell, Endothelial cell). The plot_dot_for_cci_with_signif_difference tool was used to identify the top 25 most significant differential CCIs for each condition, displaying their interaction strength (standardized mean) and statistical significance (-log10(p-value)) across individual samples. The primary goal is to uncover how cell communication networks are rewired in the tumor microenvironment.
Visual Summary
The dot plot clearly segregates cell-cell interaction patterns based on the tissue condition.
- Adjacent Normal-Specific Interactions (Left Panel): A cluster of interactions (left half of the x-axis) shows high mean interaction scores (dark red dots) and strong statistical significance (large dots) predominantly in the 'Adj_normal' samples (SMC01-N to SMC10-N). These interactions are largely absent or very low in the 'Tumor' samples. Key interactions include those between Fibroblasts and T cells involving Prostaglandin E2 signaling (e.g., ProstaglandinE2_byPTGES2_PTGER4--Fib|T CD8+), and various interactions within Fibroblast and Endothelial cell populations (e.g., BMP4_BMPR2--Fib|Fib, JAM2_JAM3--Endo|Endo). Some epithelial-immune cell interactions are also noted (e.g., ProstaglandinE2_byPTGES2_PTGER4--Ent.Epi (Aneuploid)|Macrophage).
- Tumor-Specific Interactions (Right Panel): A distinct cluster of interactions (right half of the x-axis) is highly enriched in 'Tumor' samples (SMC01-T to SMC25-T), characterized by intense dark red and large dots. Conversely, these interactions are largely absent in the 'Adj_normal' samples. A prominent pattern within this cluster involves numerous collagen-integrin interactions (e.g., COL5A1_integrin_a1b1_complex--Fib|Fib, COL6A3_integrin_a1b1_complex--Fib|Fib, COL12A1_integrin_a1b1_complex--Fib|Fib, COL1A1_integrin_a1b1_complex--Fib|Fib), involving fibroblasts, T cells (CD8+), and Intestinal Epithelial cells (both diploid and aneuploid). Other notable tumor-specific interactions include PVR_TIGIT--Ent.Epi (Dip)|T CD8+, CD58_CD2--T CD8+|T CD8+, and CXCL16_CXCR6--Ent.Epi (Dip)|T CD8+.
Overall, the visualization demonstrates a profound and distinct shift in the most significant cell-cell communication pathways when comparing normal colon tissue to tumor tissue, highlighting a clear re-orchestration of the cellular microenvironment in cancer.
Biological Interpretation
The observed shifts in CCI patterns provide critical insights into the biological processes altered in colon cancer:
- Remodeling of the Extracellular Matrix (ECM) and Stromal-Tumor Interactions: The most striking feature in the tumor microenvironment is the widespread increase in collagen-integrin interactions, particularly involving the integrin_a1b1_complex (alpha1beta1 integrin) with various collagen types (COL1A1, COL5A1, COL5A2, COL6A3, COL12A1). These interactions are predominantly seen between Fibroblasts, T cells, and Intestinal Epithelial cells.
- Integrin alpha1beta1 is a collagen-binding integrin, and its upregulation, along with specific collagen types, suggests extensive ECM remodeling orchestrated by cancer-associated fibroblasts (CAFs). This altered ECM composition and stiffness can influence tumor cell proliferation, migration, invasion, and drug resistance. GeneCards: ITGA1 (alpha1 integrin subunit), GeneCards: ITGB1 (beta1 integrin subunit)
- The involvement of epithelial cells (both diploid and aneuploid) in these new collagen-integrin axes indicates their active participation in or response to the remodeled tumor stroma.
- Immune Evasion and T-cell Modulation within the Tumor:
- The increased interaction PVR_TIGIT--Ent.Epi (Dip)|T CD8+ in tumor samples is highly significant. PVR (CD155) is a ligand expressed on various cells, including tumor cells, that binds to TIGIT, an inhibitory receptor on T cells. This interaction is a known immune checkpoint pathway that suppresses anti-tumor T cell responses, allowing cancer cells to evade immune surveillance. Its upregulation suggests active immune suppression mediated by tumor epithelial cells against CD8+ T cells in the colon TME. PubMed Search: PVR TIGIT cancer immune evasion
- CXCL16_CXCR6--Ent.Epi (Dip)|T CD8+ also shows enrichment in tumor. CXCL16 is a chemokine that can act as both a scavenger receptor and a ligand for CXCR6. This axis often plays a role in recruiting immune cells, and its presence here could suggest specific subsets of CD8+ T cells are recruited or retained by epithelial cells in the TME, potentially influencing their functionality.
- The CD58_CD2--T CD8+|T CD8+ interaction in tumors suggests altered T cell-T cell communication or self-aggregation, potentially linked to T cell activation states or exhaustion.
- Loss of Homeostatic Interactions: In adjacent normal tissue, interactions like ProstaglandinE2_byPTGES2_PTGER4--Fib|T CD8+ and ProstaglandinE2_byPTGES2_PTGER4--Fib|T CD4+ are prominent. Prostaglandin E2 (PGE2) is involved in complex immune regulation, and its differential interaction via PTGER4 in normal tissue might reflect homeostatic immune regulation that is disrupted in the tumor context. Furthermore, interactions between Endothelial cells (e.g., JAM2_JAM3--Endo|Endo, FRSF10D--Endo|Endo) important for endothelial integrity and normal vascular function are more pronounced in normal tissue, indicating disruption of these networks in the tumor environment.
Clinical or Translational Implications
The distinct and condition-specific cell-cell interaction patterns identified hold significant clinical and translational potential:
- Biomarker Discovery: The specific sets of CCIs highly enriched in tumor tissue, especially the collagen-integrin interactions and immune checkpoint interactions, could serve as robust diagnostic or prognostic biomarkers for colon cancer. Monitoring the expression levels of these ligand-receptor pairs in patient samples could provide insights into disease status, aggressiveness, and potential response to therapy.
- Targeted Therapeutic Strategies:
- ECM Targeting: The widespread upregulation of collagen-integrin interactions presents a strong rationale for targeting the ECM and CAFs in colon cancer. Inhibiting the integrin_a1b1_complex or pathways involved in collagen synthesis/cross-linking could disrupt tumor growth, invasion, and metastatic potential by normalizing the tumor microenvironment.
- Immune Checkpoint Blockade: The prominent PVR_TIGIT interaction identifies a potential immune evasion mechanism. TIGIT blockade, possibly in combination with other immune checkpoint inhibitors (e.g., PD-1/PD-L1), could be a promising therapeutic strategy to reactivate anti-tumor CD8+ T cell responses in colon cancer patients. PubMed Search: TIGIT blockade cancer therapy
- Modulating Chemokine Axes: The CXCL16_CXCR6 axis could be explored to therapeutically modulate the infiltration and function of CD8+ T cells in the TME, potentially enhancing anti-tumor immunity.
- Understanding Tumor Heterogeneity and Progression: The distinction between diploid and aneuploid epithelial cells in some interactions provides a foundation for understanding how genetically normal versus transformed cells interact differently within the tumor microenvironment. This could lead to more nuanced therapeutic approaches that target specific cell populations based on their genetic state and their contribution to tumor-promoting interactions.
16. Intestinal Epithelial Cell Condition-Specific Surfaceome Markers in Colon Cancer
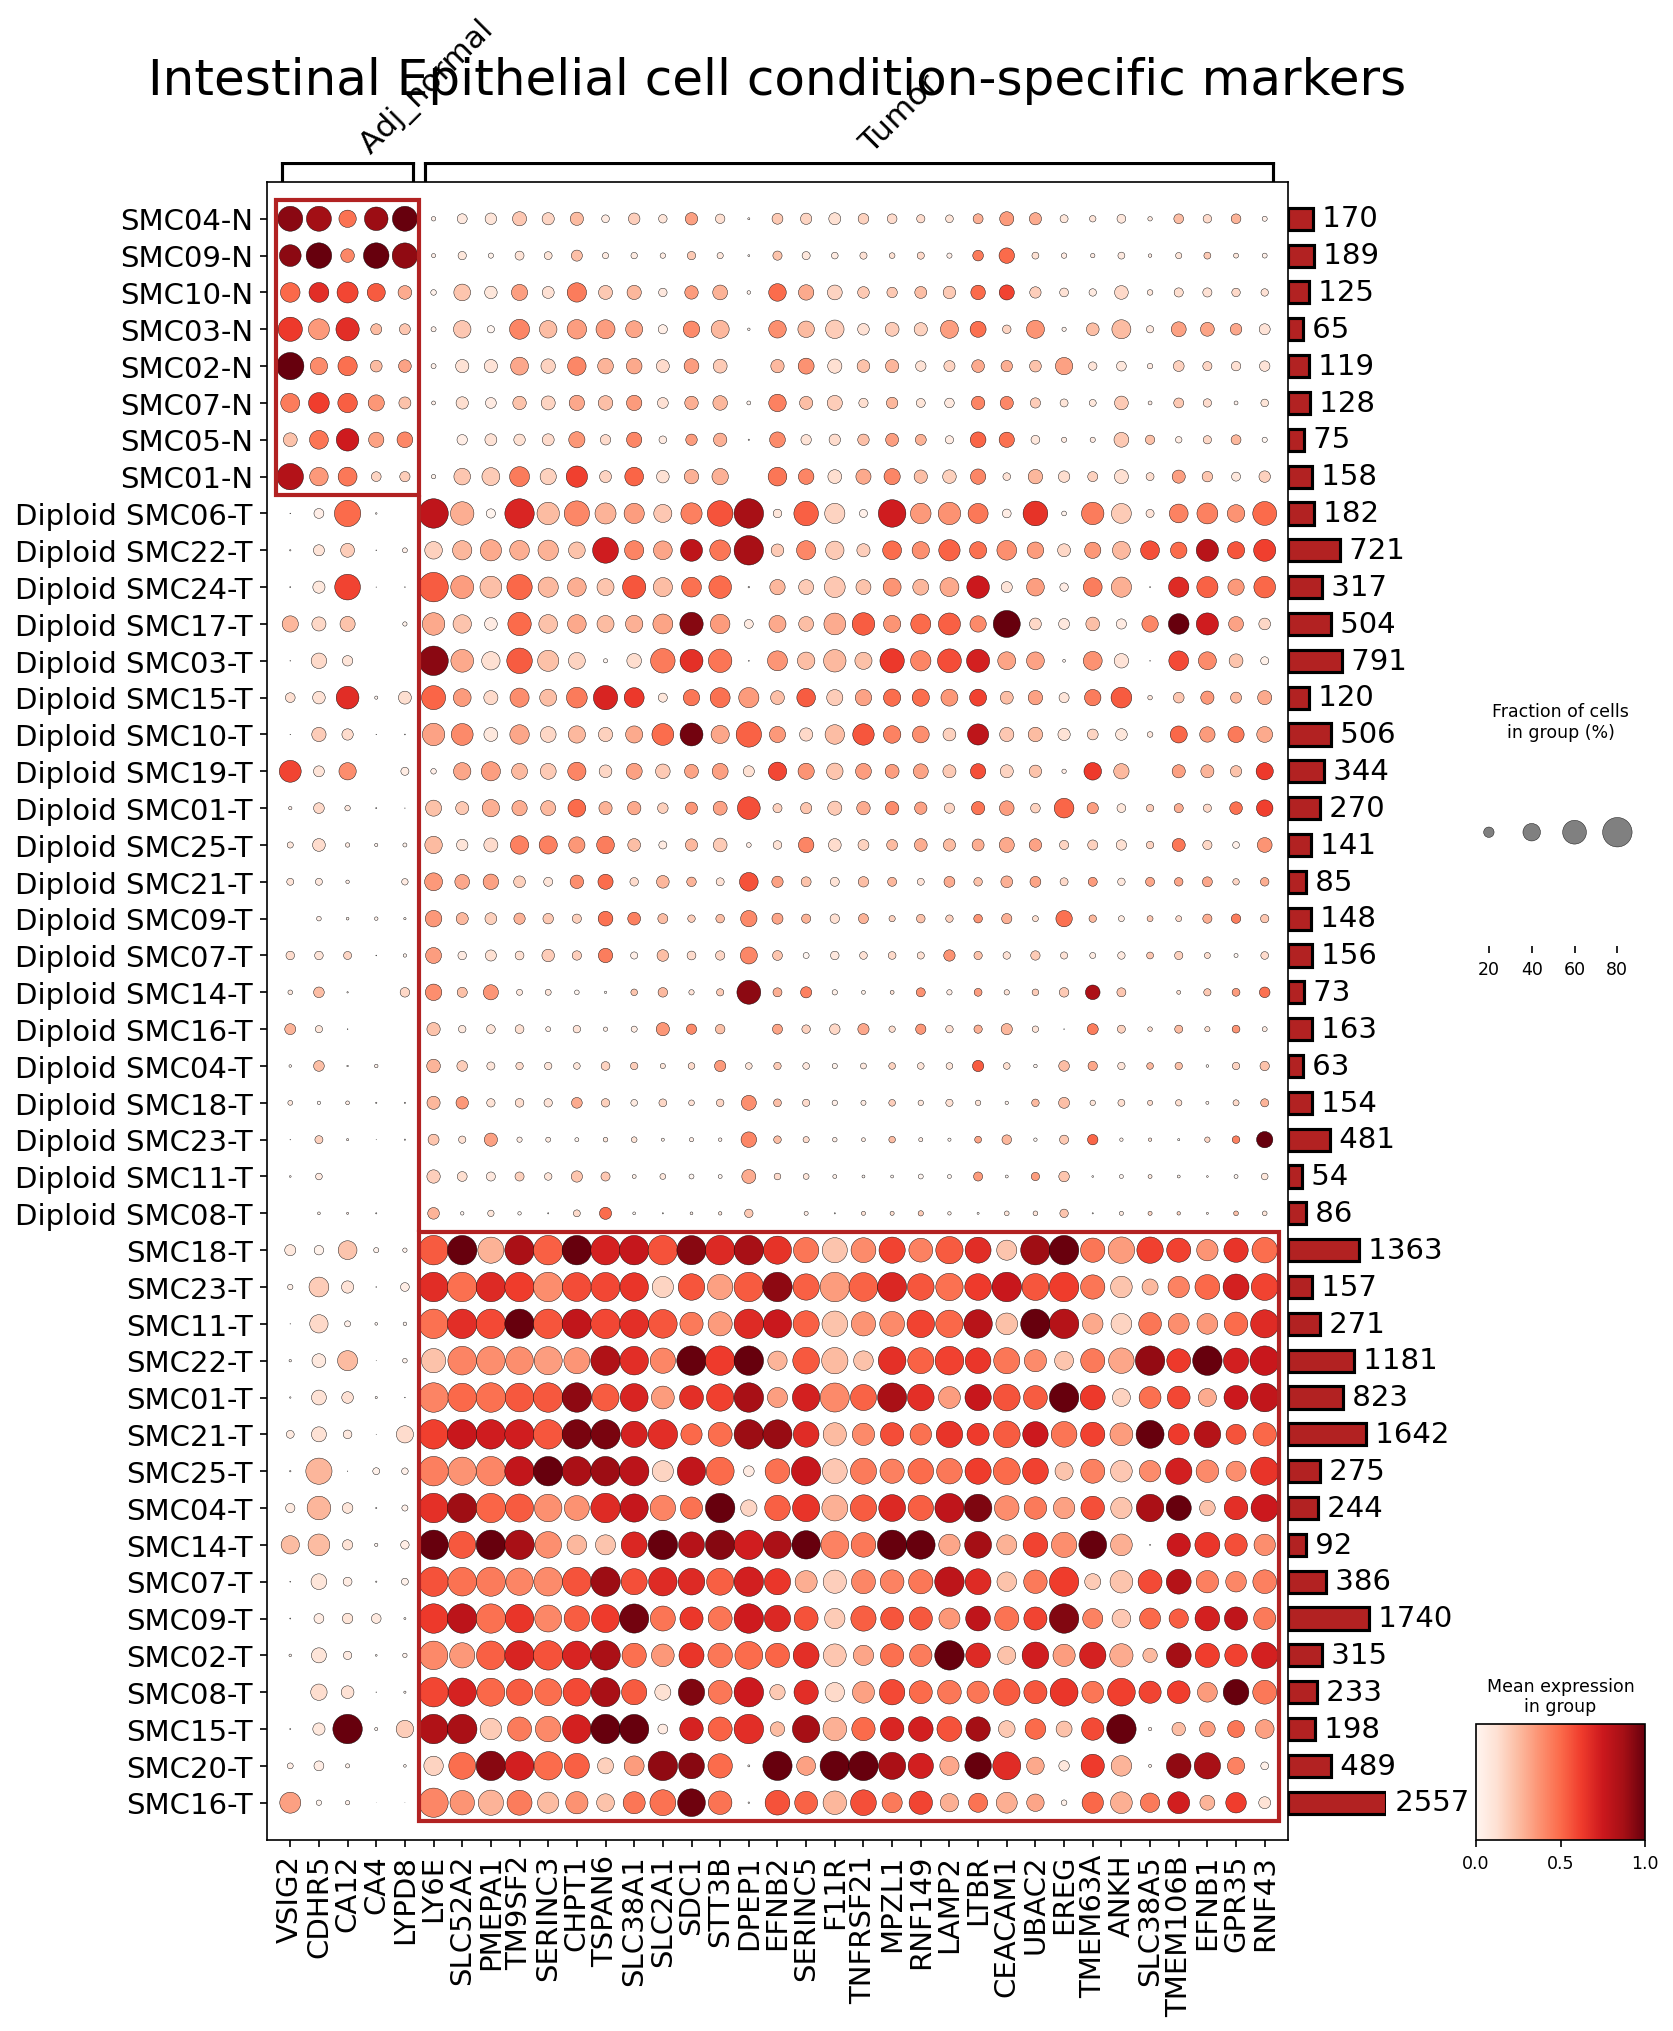
[Analysis Visualization Results]...
Analysis Overview
This analysis identifies condition-specific surfaceome markers for Intestinal Epithelial cells, the presumed tumor-origin cell type, by comparing gene expression between Tumor and Adjacent normal (Adj_normal) samples. The results are visualized as a dot plot, where dot size represents the fraction of cells expressing a gene in a given sample, and color intensity reflects the mean expression level. Only surfaceome markers, up to 50 per condition, were considered.
Visual Summary
The dot plot clearly differentiates Intestinal Epithelial cells from Adj_normal tissues from those in Tumor tissues based on their surfaceome marker expression profiles.
- Adj_normal Samples: These samples (e.g., SMC04-N, SMC09-N) form a distinct cluster characterized by high expression and prevalence of a specific set of markers, including VSIG2, CDHR5, CA12, and LYPD8. These genes show minimal to no expression in tumor samples.
- Tumor Samples: The tumor samples exhibit considerable heterogeneity in their marker expression patterns. They can be broadly categorized into two major groups:
- Diploid Tumor Samples (e.g., Diploid SMC06-T, Diploid SMC22-T): These samples show a transitional or intermediate expression profile for many tumor-associated markers. While they generally show upregulation of tumor markers compared to Adj_normal, their expression levels and prevalence are often lower than in the other tumor group.
- Likely Aneuploid Tumor Samples (e.g., SMC18-T, SMC23-T): This larger cluster of tumor samples (indicated by the lack of "Diploid" prefix) displays a robust and widespread upregulation of a broad panel of surfaceome markers. Key markers highly expressed and prevalent in this group include PMEPA1, TSPAN6, SDC1, SLC2A1, DPEP1, F11R, TNFRSF21, CEACAM1, EREG, TMEM63A, ANKH, and TMEM106B, among others. These markers are largely absent or expressed at very low levels in Adj_normal samples and often show higher expression than in the Diploid tumor group.
Overall, the plot reveals a clear shift in surfaceome marker expression from normal to tumor Intestinal Epithelial cells, with significant heterogeneity within the tumor microenvironment, possibly linked to ploidy status.
Biological Interpretation
The distinct surfaceome marker profiles observed in Intestinal Epithelial cells reflect profound biological changes occurring during colon tumorigenesis.
- Markers of Normal Epithelial Homeostasis: The high expression of VSIG2 (V-set immunoglobulin domain containing 2), CDHR5 (Cadherin-related family member 5), CA12 (Carbonic Anhydrase 12), and LYPD8 (LY6/PLAUR Domain Containing 8) in Adj_normal cells suggests their roles in maintaining normal intestinal epithelial cell structure, function, and cell-cell interactions. Their downregulation in tumor cells indicates a loss of normal epithelial differentiation and organization, a hallmark of cancer progression.
- CDHR5, for instance, is a protocadherin crucial for epithelial cell adhesion and barrier integrity. GeneCards: CDHR5
- Tumor-Associated Surfaceome Reprogramming: The extensive upregulation of a diverse set of surfaceome markers in tumor Intestinal Epithelial cells points to cellular reprogramming that supports tumor growth, survival, and interaction with the microenvironment.
- PMEPA1 (Prostate transmembrane protein, androgen induced 1) is frequently overexpressed in various cancers and has been implicated in promoting epithelial-mesenchymal transition (EMT) and TGF-beta signaling, contributing to tumor progression. GeneCards: PMEPA1
- SDC1 (Syndecan-1) is a proteoglycan involved in cell adhesion and growth factor signaling, often highly expressed in aggressive cancers where it facilitates cell proliferation, survival, and metastasis. GeneCards: SDC1
- SLC2A1 (Glucose Transporter 1, also known as GLUT1) is a key mediator of the Warburg effect, where cancer cells increase glucose uptake and glycolysis to fuel their rapid growth, making it a common metabolic hallmark of cancer. GeneCards: SLC2A1
- EREG (Epiregulin) is a ligand for the Epidermal Growth Factor Receptor (EGFR), promoting cell proliferation and survival, and its overexpression is frequently observed in colorectal cancer with prognostic implications. GeneCards: EREG
- CEACAM1 (Carcinoembryonic antigen-related cell adhesion molecule 1) has complex roles in cancer, modulating cell adhesion and immune responses, and is frequently dysregulated in colorectal cancer. GeneCards: CEACAM1
- Ploidy-Associated Heterogeneity: The observed distinction between "Diploid" and likely "Aneuploid" tumor Intestinal Epithelial cells highlights significant intratumoral heterogeneity. Aneuploidy, a hallmark of genomic instability, is often associated with more aggressive tumor phenotypes and may drive distinct transcriptional programs, leading to different surface marker repertoires. This suggests that distinct molecular subtypes exist within colon tumors, which could impact disease behavior and therapeutic responses.
Clinical or Translational Implications
The identified condition-specific surfaceome markers in Intestinal Epithelial cells offer significant clinical and translational potential in colon cancer.
Diagnostic and Prognostic Biomarkers:
- The loss of normal epithelial markers (e.g., VSIG2, CDHR5) could serve as indicators for early neoplastic transformation or loss of differentiation.
- Highly expressed tumor-specific surfaceome markers (e.g., PMEPA1, SDC1, SLC2A1, EREG, CEACAM1) could be developed as novel biomarkers for early diagnosis, monitoring disease progression, recurrence, or predicting treatment response in colon cancer patients. Their presence on the cell surface makes them readily detectable in biopsies or liquid biopsies.
Therapeutic Targets:
- Given that these are surfaceome markers, they are highly accessible for targeted therapies. This opens avenues for the development of antibody-drug conjugates (ADCs), chimeric antigen receptor (CAR) T-cell therapies, or small molecule inhibitors that specifically target cancer cells while sparing normal tissues.
- For example, the EREG/EGFR axis is already a validated therapeutic target in colorectal cancer. High expression of EREG might indicate sensitivity to EGFR-targeted therapies. PubMed Search: EREG EGFR colorectal cancer therapy
- SDC1 is also under investigation as a therapeutic target in various cancers due to its role in promoting tumor growth and metastasis. PubMed Search: SDC1 therapeutic target cancer
- Targeting SLC2A1 (GLUT1) could disrupt the metabolic advantages of cancer cells.
- Patient Stratification and Personalized Medicine: The distinct surfaceome profiles linked to ploidy status (diploid vs. likely aneuploid) suggest that patients could be stratified based on the expression of these markers. This could lead to more personalized treatment strategies, where specific therapies are chosen for subgroups of patients who are more likely to respond due to their tumor's unique surfaceome signature. Further research is needed to validate these markers and their therapeutic implications in diverse patient cohorts.
17. Macrophage Condition-Specific Surfaceome Markers in Colon Tissue
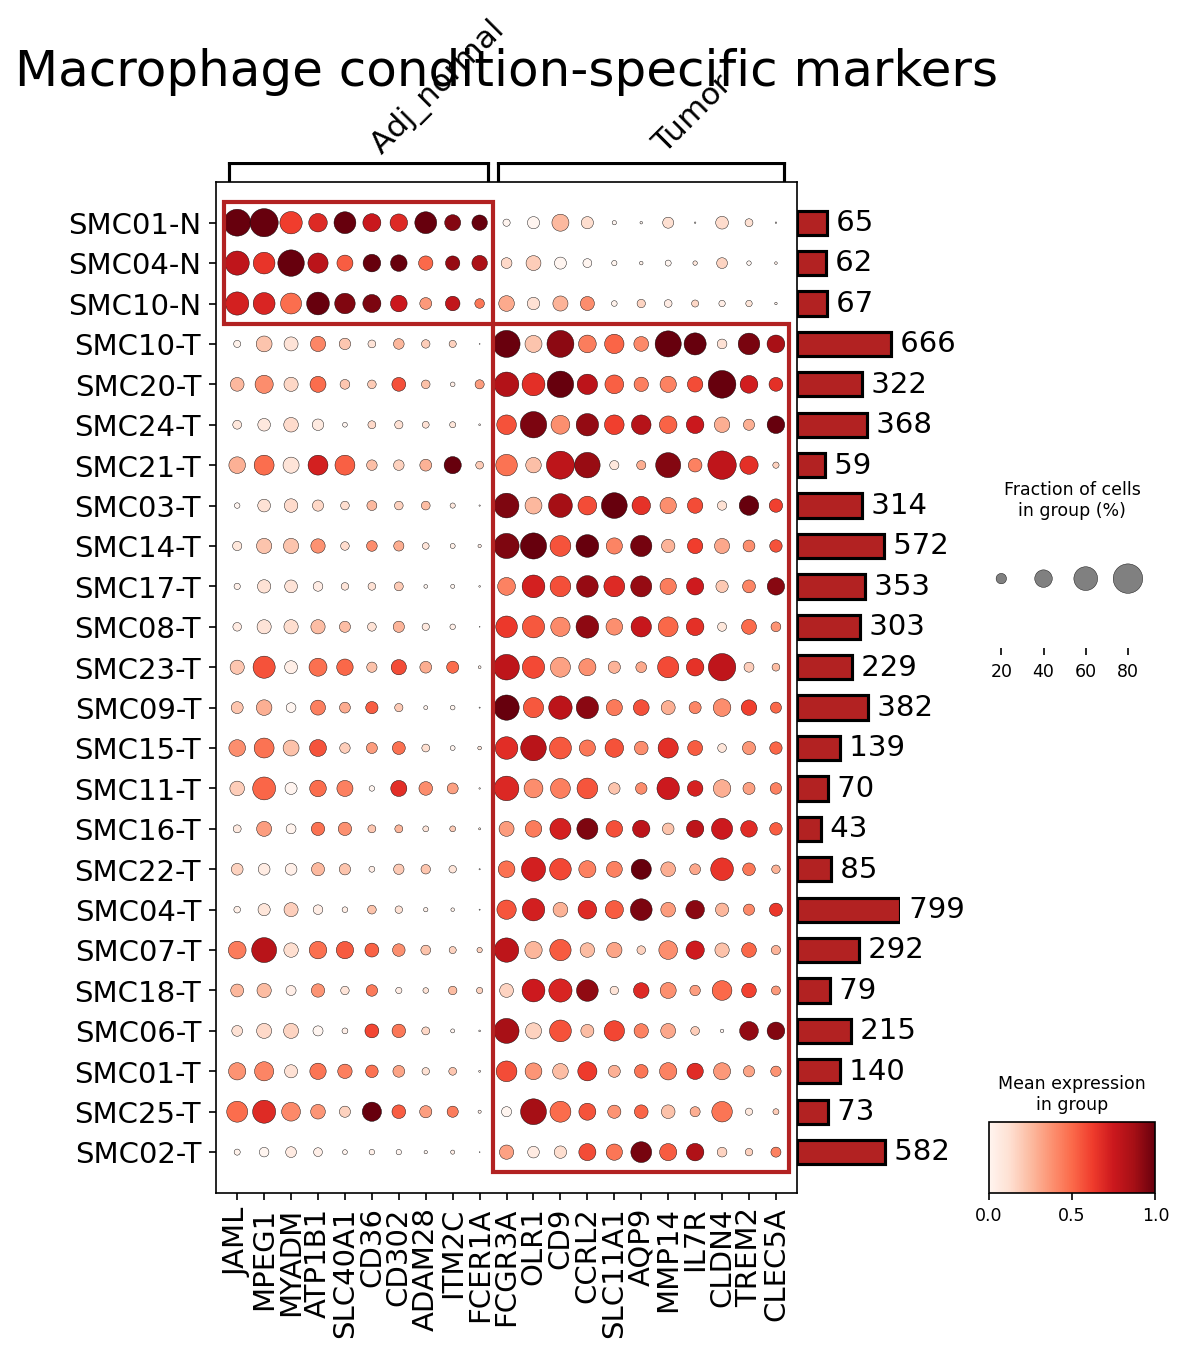
[Analysis Visualization Results]...
Analysis Overview
This analysis identifies and visualizes condition-specific surfaceome markers in Macrophage cells derived from single-cell RNA-seq data of human colon tissue, comparing Tumor and Adjacent Normal (Adj_normal) conditions. The aim is to highlight cell surface proteins that are differentially expressed between macrophages in healthy and cancerous microenvironments, which could serve as potential diagnostic biomarkers or therapeutic targets. The plot_markers_and_expression_dot tool was used, specifically filtering for surfaceome genes and selecting up to 50 markers per condition, then plotting a subset of these.
Visual Summary
The dot plot displays the expression patterns of selected surfaceome markers across individual samples, grouped by condition (Adj_normal and Tumor).
- Distinct Condition-Specific Clusters: Macrophages from 'Adj_normal' samples (SMC01-N, SMC04-N, SMC10-N) exhibit a clear expression profile for a set of markers (e.g., JAML, MPEG1, MYADM, ATP1B1, SLC40A1, CD36, CD302, ADAM28, ITM2C) that are largely absent or expressed at very low levels in 'Tumor' samples. Conversely, macrophages from 'Tumor' samples show high expression of a different set of markers (e.g., FCGR1A, OLR1, CD9, CCRL2, SLC11A1, AQP9, MMP14, IL7R, CLDN4, TREM2, CLEC5A), which are barely detectable in 'Adj_normal' samples.
- Marker Expression Level and Prevalence: The color intensity (mean expression) and dot size (fraction of expressing cells) consistently indicate higher expression and broader prevalence for the condition-specific markers within their respective groups. For instance, in 'Adj_normal' samples, genes like JAML and MPEG1 are highly expressed in a large fraction of cells. In 'Tumor' samples, markers such as FCGR1A and MMP14 show strong expression across many cells.
- Inter-Sample Heterogeneity: While distinct patterns emerge, some heterogeneity is observed within the 'Tumor' group. For example, some tumor samples (e.g., SMC07-T, SMC01-T, SMC25-T, SMC02-T) exhibit somewhat weaker or less consistent expression of certain 'Tumor-specific' markers compared to others. Conversely, SMC07-T shows some residual expression of ADAM28, a marker predominantly found in 'Adj_normal' macrophages.
- Cell Counts per Sample: The bar plot on the right indicates the number of Macrophage cells contributing to each sample's profile, with most tumor samples having a considerably higher cell count than adjacent normal samples, ensuring robust representation of the tumor macrophage population.
Biological Interpretation
The analysis clearly distinguishes macrophage populations based on their tissue microenvironment, revealing distinct surfaceome signatures in 'Adj_normal' versus 'Tumor' colon tissue.
- Adjacent Normal Macrophage Signature: Macrophages in the adjacent normal colon tissue show high expression of markers such as:
- JAML (Junctional Adhesion Molecule Like): Involved in leukocyte adhesion and transmigration, suggesting a role in immune surveillance and maintaining tissue homeostasis.
- MPEG1 (Macrophage Expressed Gene 1): A proposed specific marker for macrophages, potentially involved in host defense.
- SLC40A1 (Ferroportin): The sole known iron exporter, crucial for iron homeostasis. Its expression in normal tissue macrophages might reflect their role in iron recycling. Reference: GeneCards SLC40A1
- CD36: A scavenger receptor involved in lipid uptake, angiogenesis, and inflammation, indicating a role in metabolic regulation and efferocytosis in healthy tissue. Reference: UniProt CD36
These markers suggest a macrophage phenotype adapted to tissue maintenance, immune surveillance, and specific metabolic functions in a non-pathological state.
- Tumor-Associated Macrophage (TAM) Signature: Macrophages within the colon tumor microenvironment exhibit a distinct profile, characterized by prominent expression of genes such as:
- FCGR1A (CD64): A high-affinity Fc-gamma receptor, often upregulated on activated macrophages, particularly those in inflammatory or M1-like states, though it can also be found on some M2-like TAMs depending on context. Reference: PubMed search for FCGR1A macrophage activation
- CD9: A tetraspanin involved in cell migration, adhesion, and signaling, frequently associated with cancer progression and metastasis.
- MMP14 (Matrix Metalloproteinase 14): A crucial enzyme for extracellular matrix (ECM) degradation, facilitating tumor invasion and metastasis. Its high expression in TAMs highlights their pro-tumorigenic role. Reference: GeneCards MMP14
- TREM2 (Triggering Receptor Expressed on Myeloid Cells 2): Often expressed on TAMs and associated with lipid metabolism, efferocytosis, and immunosuppression within the tumor microenvironment. Reference: PubMed search for TREM2 tumor associated macrophages
- OLR1 (Oxidized Low-Density Lipoprotein Receptor 1): Involved in lipid metabolism and inflammation, potentially linking TAMs to altered lipid environments prevalent in tumors.
This signature suggests that colon TAMs undergo significant reprogramming, adopting phenotypes that often contribute to tumor growth, angiogenesis, immune evasion, and metastasis. The presence of genes like MMP14 and TREM2 specifically points to roles in tissue remodeling and immunosuppression.
Clinical or Translational Implications
The identification of distinct condition-specific surfaceome markers on macrophages holds significant clinical and translational potential:
- Biomarker Discovery: The tumor-specific macrophage surface markers (e.g., FCGR1A, CD9, MMP14, TREM2) could serve as novel diagnostic or prognostic biomarkers for colon cancer progression, potentially detectable in tissue biopsies or even circulating cells.
- Therapeutic Targeting: As surfaceome markers, these genes are excellent candidates for targeted therapies. Antibodies or antibody-drug conjugates (ADCs) against proteins like FCGR1A, CD9, MMP14, or TREM2 could selectively deplete or reprogram pro-tumorigenic macrophages.
- Targeting MMP14 could inhibit ECM degradation, thereby impeding tumor invasion and metastasis.
- Modulating TREM2 signaling in TAMs is an active area of research for reversing immunosuppression within the tumor microenvironment and enhancing anti-tumor immunity. Reference: PubMed search for TREM2 cancer therapy
- Immunomodulation Strategies: Understanding the unique surface landscape of TAMs provides insights into their functional states. This knowledge can guide strategies to reprogram TAMs from pro-tumorigenic (M2-like) phenotypes to anti-tumorigenic (M1-like) states, or to enhance the efficacy of existing immunotherapies.
- Experimental Validation: The identified markers warrant further experimental validation using techniques like flow cytometry or immunohistochemistry on clinical colon cancer samples to confirm their utility as diagnostic tools or therapeutic targets. Functional studies, such as gene knockdown or antibody blockade, could further elucidate their specific roles in macrophage function within the tumor microenvironment.
18. Fibroblast Condition-Specific Surfaceome Markers in Colon Tissue
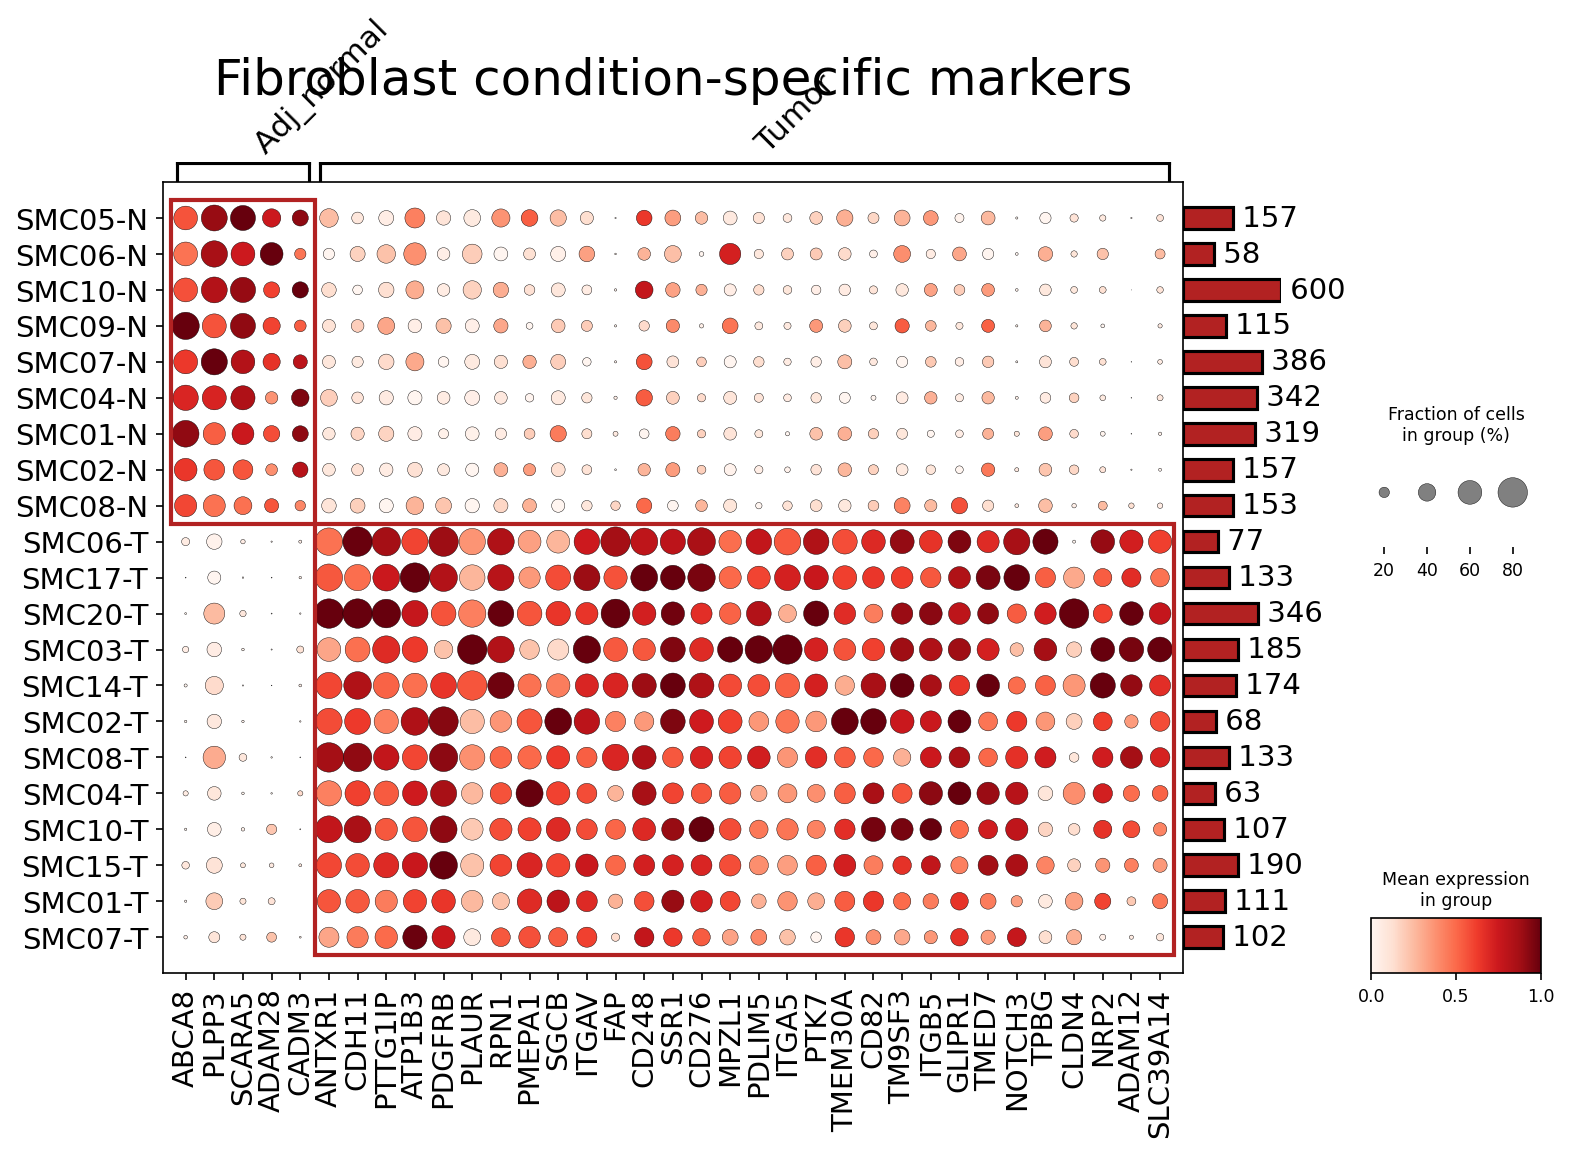
[Analysis Visualization Results]...
Analysis Overview
This analysis identifies condition-specific surfaceome markers in Fibroblast cells derived from single-cell RNA-seq data of human Colon tissue, comparing Tumor and Adjacent Normal (Adj_normal) conditions. The plot_markers_and_expression_dot tool was used to visualize the expression patterns of up to 50 surfaceome markers per condition, highlighting genes that are differentially expressed and prevalent in either the normal or tumor microenvironment.
Visual Summary
The dot plot effectively illustrates distinct surfaceome marker profiles between Fibroblasts from Adjacent Normal (Adj_normal) and Tumor conditions across various samples.
- Adjacent Normal Fibroblast Markers: A cluster of genes, including ABCA8, PLPP3, SCARA5, ADAM28, CADM3, ANTXR1, shows prominent expression (darker red color) and high prevalence (larger dot size) specifically in fibroblasts from Adj_normal samples (e.g., SMC05-N, SMC06-N). These genes are largely absent or expressed at very low levels in tumor fibroblasts.
- Tumor Fibroblast Markers: Conversely, a substantial set of genes exhibits strong and widespread expression in fibroblasts from Tumor samples (e.g., SMC06-T, SMC17-T). These include well-known Cancer-Associated Fibroblast (CAF) markers such as FAP, CD248, CD276 (B7-H3), PDGFRB, PLAUR (uPAR), RPN1, PMEPA1, ITGAV (Integrin alpha V), ITGA5 (Integrin alpha 5), ITGB5 (Integrin beta 5), NRP2 (Neuropilin 2), NOTCH3, ADAM12. These markers are either minimally expressed or entirely absent in Adj_normal fibroblasts.
- Expression Patterns: The dot plot clearly segregates samples based on condition, indicating a robust shift in the surfaceome landscape of fibroblasts when transitioning from a normal to a tumor microenvironment. The intensity of the red color signifies the mean expression level, while the size of the dot indicates the fraction of cells within that group expressing the gene, both showing strong differential patterns.
Biological Interpretation
The identified surfaceome markers provide critical insights into the functional roles and phenotypic plasticity of fibroblasts in colon cancer.
- Normal Fibroblast Markers: Genes like CADM3 (Cell Adhesion Molecule 3) and ANTXR1 (Anthrax Toxin Receptor 1) typically function in cell-cell adhesion and cell migration, respectively, contributing to normal tissue architecture and homeostasis. ABCA8 (ATP Binding Cassette Subfamily A Member 8) is involved in lipid transport. The specific expression of these markers suggests a state of quiescent or homeostatic fibroblasts supporting normal colon physiology. GeneCards: ANTXR1, GeneCards: CADM3
- Tumor-Associated Fibroblast (CAF) Signature: The profound upregulation of numerous surfaceome markers in tumor fibroblasts points to their transformation into CAFs, which are key components of the tumor microenvironment (TME) and play crucial roles in cancer progression.
- ECM Remodeling and Invasion: FAP (Fibroblast Activation Protein), PLAUR (Plasminogen Activator, Urokinase Receptor), and ADAM12 (ADAM Metallopeptidase Domain 12) are strongly associated with extracellular matrix (ECM) remodeling, degradation, and cell invasion, facilitating tumor growth and metastasis. FAP is a canonical CAF marker. PubMed search: FAP cancer-associated fibroblast
- Cell Adhesion and Migration: Multiple integrins, including ITGAV, ITGA5, and ITGB5, are highly expressed. Integrins mediate cell-ECM and cell-cell interactions, critical for CAF migration, invasion, and mechanosensing within the rigid tumor stroma. GeneCards: ITGAV
- Growth Factor Signaling: PDGFRB (Platelet-Derived Growth Factor Receptor Beta) is a key receptor involved in fibroblast activation, proliferation, and differentiation, often implicated in CAF development and function. GeneCards: PDGFRB
- Immune Modulation: CD276 (B7-H3) is an immune checkpoint molecule, commonly overexpressed in various cancers and contributing to immune evasion by suppressing anti-tumor T cell responses. Its presence on CAFs suggests a role in shaping the immunosuppressive TME. PubMed search: B7-H3 cancer immunity
- Angiogenesis and Lymphangiogenesis: NRP2 (Neuropilin 2) is a co-receptor for various growth factors and semaphorins, playing roles in angiogenesis, lymphatic development, and tumor progression. GeneCards: NRP2
- Other Noteworthy Markers: CD248 (Endosialin/TEM1) is another recognized CAF marker involved in stromal remodeling and angiogenesis. PMEPA1 (Prostate Transmembrane Protein, Androgen Induced 1) is involved in TGF-beta signaling, a critical pathway in CAF activation. NOTCH3 signaling is known to be involved in cell proliferation, survival, and epithelial-mesenchymal transition, often dysregulated in cancer. GeneCards: CD248
- CDH1 in Fibroblasts: While CDH1 (E-cadherin) is primarily known as an epithelial cell adhesion molecule, its detection as a surfaceome marker in tumor fibroblasts is interesting. In some contexts, fibroblasts can express cadherins, or it could potentially indicate a specific subtype of CAFs, or a complex interaction at the epithelial-stromal interface. Further investigation would be needed to clarify its specific role in these fibroblasts.
Clinical or Translational Implications
The identification of condition-specific surfaceome markers in fibroblasts has significant clinical and translational implications for colon cancer.
- Biomarker Potential: The distinct normal vs. tumor fibroblast surfaceome signatures could serve as valuable diagnostic or prognostic biomarkers. For instance, high expression of FAP, CD248, CD276, PDGFRB, or NRP2 on tumor fibroblasts could indicate tumor presence, progression, or resistance to therapy. These surface markers are amenable to detection via techniques like immunohistochemistry or flow cytometry on biopsy samples.
- Therapeutic Targets: Surface markers are excellent candidates for targeted therapies due to their accessibility.
- FAP and CD248: These are well-established targets for CAF-directed therapies, including antibody-drug conjugates (ADCs) or small molecule inhibitors, aimed at depleting CAFs or reprogramming their pro-tumorigenic functions.
- CD276 (B7-H3): As an immune checkpoint molecule, CD276 is a promising target for immunotherapies, potentially enhancing anti-tumor immunity by blocking its immunosuppressive activity on CAFs.
- PDGFRB: Targeting PDGFRB with tyrosine kinase inhibitors could reduce CAF proliferation and activation, impacting stromal support for tumor growth.
- Integrins (ITGAV, ITGA5, ITGB5): Modulating integrin activity could interfere with CAF-ECM interactions, reducing tumor cell invasion and metastasis.
- NRP2: Given its role in angiogenesis and lymphangiogenesis, NRP2 could be targeted to inhibit tumor vascularization and lymphatic spread.
Such targeted approaches could potentially overcome limitations of direct tumor cell targeting by disrupting critical components of the TME that support tumor growth and immune evasion.
19. T cell CD4+ Condition-Specific Surfaceome Markers in Colon Tissue
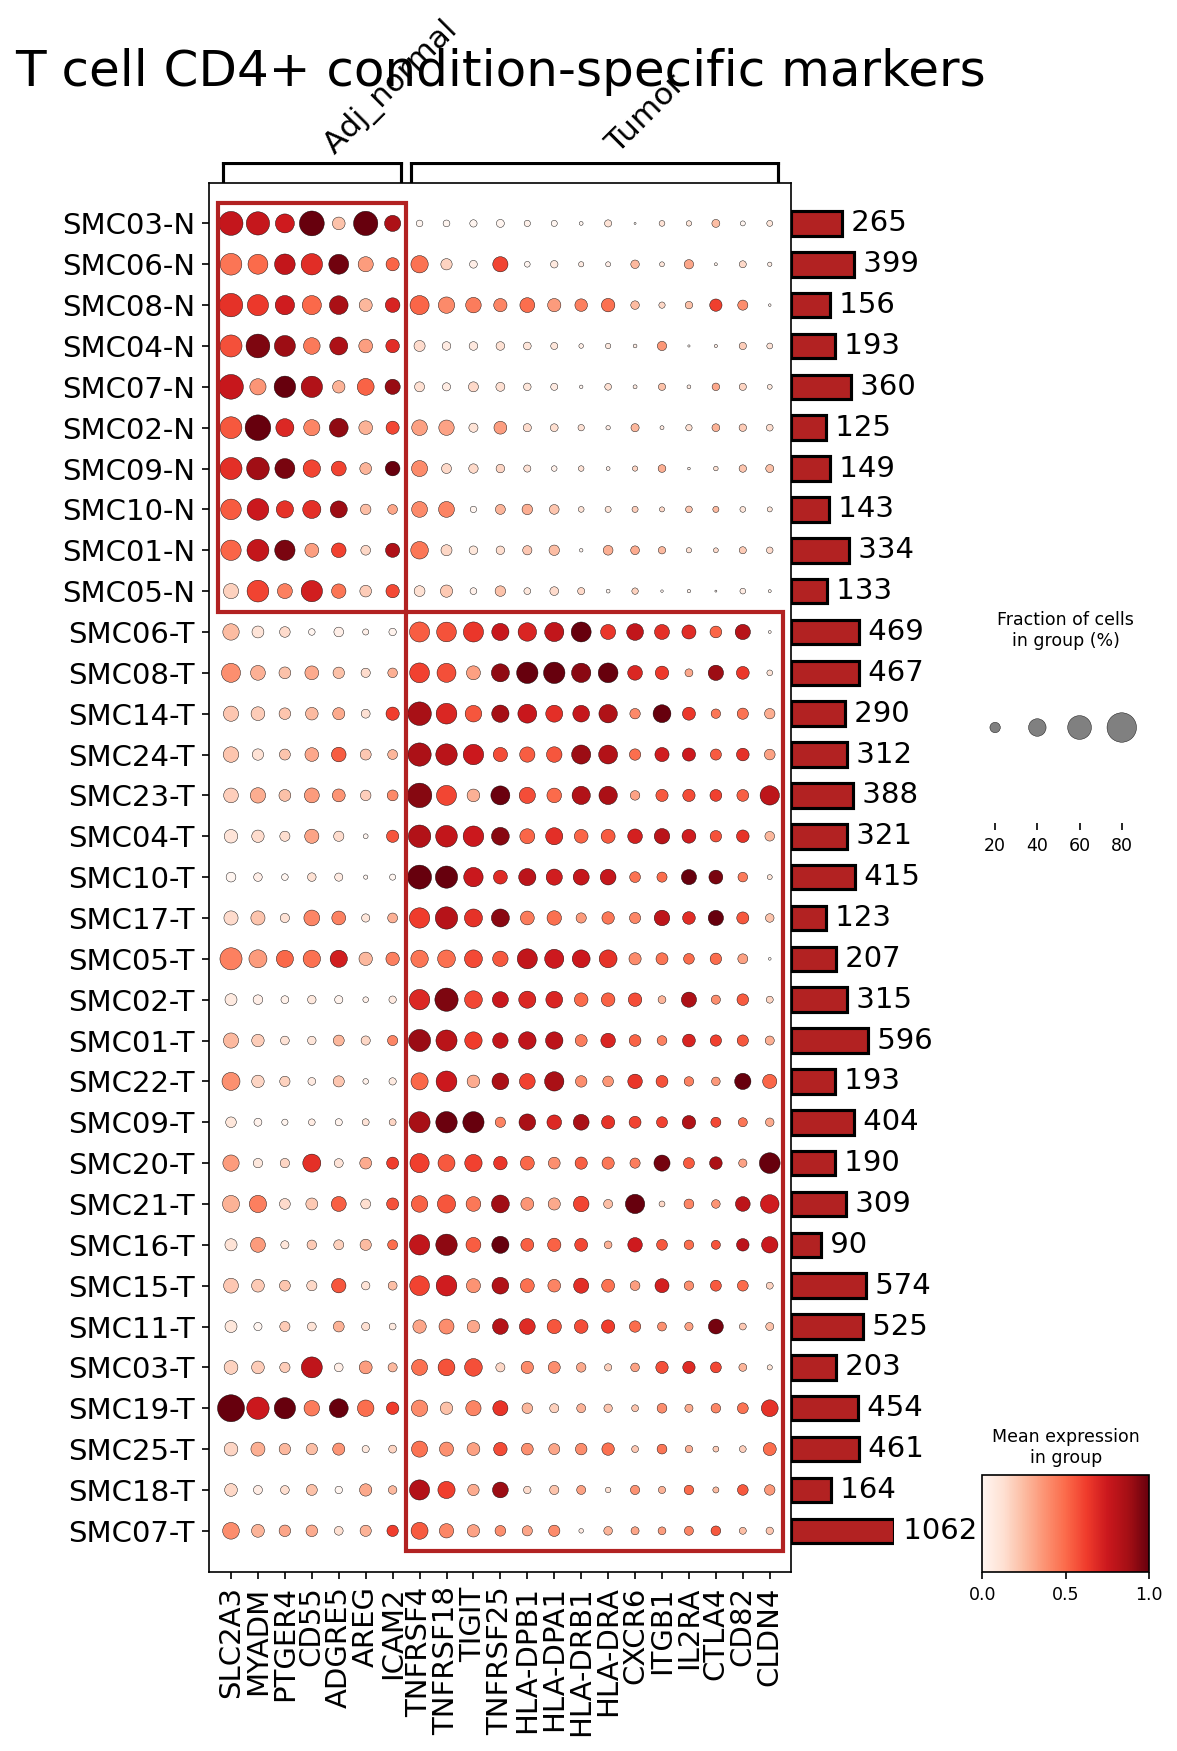
[Analysis Visualization Results]...
Analysis Overview
This analysis identifies condition-specific surfaceome markers within the CD4+ T cell population, comparing cells derived from 'Tumor' versus 'Adj_normal' (Adjacent Normal) colon tissue. The dot plot visualizes the mean expression level (color intensity) and the fraction of cells expressing (dot size) for the top 50 highly expressed surfaceome genes in CD4+ T cells across individual samples. This approach helps in understanding the phenotypic adaptations of CD4+ T cells in the context of the tumor microenvironment.
Visual Summary
The dot plot clearly differentiates two distinct clusters of surface markers, corresponding to CD4+ T cells from 'Adj_normal' samples and 'Tumor' samples, respectively.
- Adj_normal Specific Markers: A cluster of genes on the left side of the plot (*SLC2A3, MYADM, PTGER4, CD55, ADGRE5, AREG*) shows high mean expression and high prevalence (large, dark red dots) exclusively in CD4+ T cells from 'Adj_normal' samples (SMC01-N to SMC10-N). These markers are largely absent or expressed at very low levels in 'Tumor' samples.
- Tumor Specific Markers: A prominent cluster of genes on the right side of the plot (*ICAM2, TNFRSF4, TNFRSF18, TIGIT, TNFRSF25, HLA-DPA1, HLA-DPB1, HLA-DRA, HLA-DRB1, CXCR6, ITGB1, IL2RA, CTLA4, CD82, CLDN4*) exhibits high mean expression and high prevalence specifically in CD4+ T cells from 'Tumor' samples (SMC01-T to SMC25-T). These markers are minimally expressed in 'Adj_normal' samples.
- Sample-Level Consistency: Within each condition, the expression patterns are largely consistent across different individual samples, indicating a robust condition-specific gene signature for CD4+ T cells. The number of cells per group, as indicated by the bar chart on the right, shows variable but generally sufficient cell numbers per sample group for robust marker detection.
Biological Interpretation
The differential expression of surfaceome markers highlights significant phenotypic shifts in CD4+ T cells in the tumor microenvironment compared to adjacent normal tissue.
Markers Enriched in Adj_normal CD4+ T Cells
The genes enriched in CD4+ T cells from adjacent normal tissue suggest a homeostatic or non-inflammatory T cell state, potentially involved in tissue maintenance or early immune surveillance:
- SLC2A3 (GLUT3): A glucose transporter, its expression can be associated with metabolically active cells.
- PTGER4 (EP4): A receptor for prostaglandin E2 (PGE2), involved in immune modulation, often playing immunosuppressive roles in chronic inflammation or cancer, but can also have pro-inflammatory roles depending on context. Its presence here might reflect a baseline immune regulatory activity. GeneCards: PTGER4
- CD55 (DAF): Protects cells from complement-mediated lysis, suggesting a protective role for T cells in normal tissue.
- ADGRE5 (CD97): An adhesion G protein-coupled receptor involved in cell-cell interactions and tissue organization.
- AREG (Amphiregulin): An EGFR ligand known to promote tissue repair and epithelial proliferation. Its expression on CD4+ T cells in normal tissue might reflect T cell contributions to tissue homeostasis. GeneCards: AREG
Markers Enriched in Tumor CD4+ T Cells
The robust upregulation of a specific set of surface markers in tumor-infiltrating CD4+ T cells points towards significant activation, regulatory, and exhaustion phenotypes that characterize the tumor immune microenvironment:
Immune Checkpoints and Co-stimulatory Molecules:
- TNFRSF4 (OX40) and TNFRSF18 (GITR): These are co-stimulatory receptors belonging to the TNF receptor superfamily. Their upregulation indicates T cell activation and potential for sustained immune responses within the tumor, although their function can be context-dependent. GeneCards: TNFRSF4, GeneCards: TNFRSF18
- TIGIT and CTLA4: These are well-known inhibitory immune checkpoints. Their high expression on tumor-infiltrating CD4+ T cells is a strong indicator of T cell exhaustion or a regulatory phenotype (e.g., Treg cells), which suppresses anti-tumor immunity. GeneCards: TIGIT, GeneCards: CTLA4
- MHC Class II Molecules (HLA-DPA1, HLA-DPB1, HLA-DRA, HLA-DRB1): While MHC-II molecules are primarily expressed by professional antigen-presenting cells (APCs), their expression on CD4+ T cells in the tumor microenvironment is notable. This can occur on activated T cells, particularly regulatory T cells (Tregs), or T helper cells in chronic inflammation, suggesting they may acquire antigen-presenting capabilities or are in a highly activated state.
Adhesion and Migration Molecules:
- ICAM2: An intercellular adhesion molecule, facilitates T cell adhesion to endothelial cells and other immune cells, crucial for T cell trafficking and immune synapse formation.
- CXCR6: A chemokine receptor involved in T cell homing to specific inflammatory sites or tertiary lymphoid structures within tumors.
- ITGB1 (CD29): Integrin beta-1 subunit, forms heterodimers with alpha subunits to mediate cell adhesion to extracellular matrix components and other cells, critical for T cell migration and retention.
Activation Marker:
- IL2RA (CD25): The alpha chain of the IL-2 receptor, a classic marker for activated T cells and a key marker for regulatory T cells (Tregs).
Other notable markers:
- CD82: A tetraspanin involved in cell migration, adhesion, and signal transduction, potentially modulating T cell function.
- CLDN4 (Claudin-4): A tight junction protein, its expression on T cells is less conventional but could suggest specific interactions with epithelial cells or a unique activation state.
Clinical or Translational Implications
The identified condition-specific surface markers hold significant potential for clinical applications, particularly in diagnostics, prognostics, and therapeutic targeting for colon cancer.
- Biomarker Discovery: The distinct panels of surface markers (e.g., *SLC2A3/AREG* for normal vs. *TIGIT/CTLA4/MHC-II* for tumor-infiltrating CD4+ T cells) could serve as diagnostic or prognostic biomarkers. For instance, the ratio or absolute expression levels of exhaustion markers like TIGIT and CTLA4 on CD4+ T cells could indicate disease progression or response to therapy. These can be readily assessed via flow cytometry or immunohistochemistry on tissue biopsies.
- Therapeutic Targets: The upregulation of inhibitory immune checkpoints such as TIGIT and CTLA4 in tumor-infiltrating CD4+ T cells strongly suggests these pathways contribute to immune suppression in the colon tumor microenvironment. Therapies targeting these checkpoints (e.g., anti-TIGIT or anti-CTLA4 antibodies) could potentially reverse T cell exhaustion and enhance anti-tumor immunity. PubMed search: TIGIT cancer immunotherapy
- Immune Modulation Strategies: Co-stimulatory receptors like OX40 (TNFRSF4) and GITR (TNFRSF18) are also highly expressed. Agonistic antibodies targeting these receptors could provide additional co-stimulation to CD4+ T cells, potentially boosting anti-tumor responses when combined with checkpoint blockade or other immunotherapies. PubMed search: OX40 cancer therapy
- Phenotypic Characterization and Patient Stratification: The distinct surfaceome profiles could allow for a more precise classification of CD4+ T cell states in cancer patients, potentially aiding in patient stratification for specific immunotherapies or predicting treatment response. For example, patients with high expression of TIGIT/CTLA4 on tumor-infiltrating CD4+ T cells might be more responsive to therapies blocking these pathways.
- Experimental Validation: The identified markers provide concrete targets for further experimental validation using techniques like multicolor flow cytometry, mass cytometry, or spatial proteomics on patient samples to confirm their cell-type specificity and functional relevance in the colon tumor microenvironment.
20. Dysregulation of Cell Cycle Genes in Intestinal Epithelial Cells from Colon Cancer
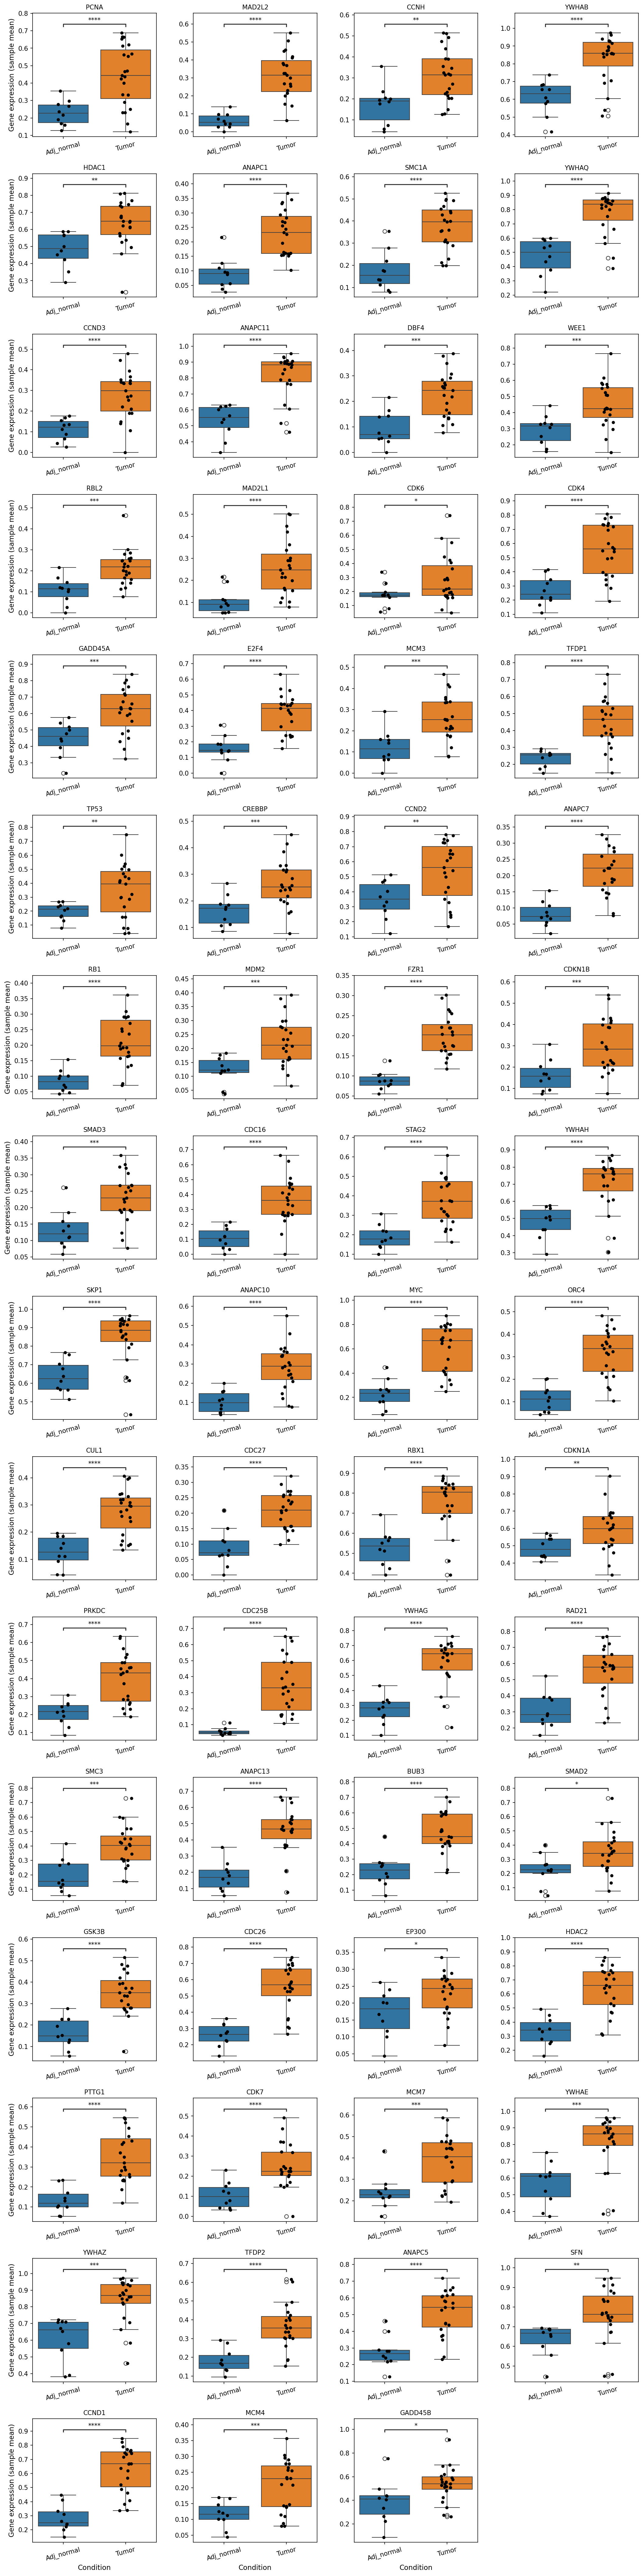
[Analysis Visualization Results]...
Analysis Overview
This analysis investigates the expression of a predefined set of cell cycle pathway-related genes in Intestinal Epithelial cells, comparing cells from "Tumor" tissue with those from "Adj_normal" (adjacent normal) tissue. Intestinal Epithelial cells are identified as the tumor origin celltype in this dataset, making them critically relevant to understanding the molecular basis of colon cancer. The analysis identifies genes with statistically significant expression differences between these two conditions and visualizes their expression levels using box plots.
Visual Summary
The box plots prominently display the gene expression distributions for 24 selected cell cycle-related genes across "Adj_normal" and "Tumor" conditions within Intestinal Epithelial cells. A consistent and striking pattern is observed:
- Widespread Upregulation: The majority of the plotted genes show significantly higher expression in the "Tumor" condition compared to the "Adj_normal" condition. This is evident from the upward shift of the orange boxes (Tumor) relative to the blue boxes (Adj_normal), with minimal overlap in distribution for many genes.
- High Statistical Significance: Most of the observed differences are highly statistically significant, indicated by multiple asterisks (e.g., "" for p < 0.0001, "*" for p < 0.001, "" for p < 0.01, "*" for p < 0.05). This suggests that the observed changes are robust and unlikely due to random variation.
- Examples of Highly Upregulated Genes: Prominent examples of genes with substantially higher expression in tumor cells include *PCNA*, *MAD2L2*, *ANAPC1*, *CCND3*, *ANAPC11*, *CCNH*, *YWHAQ*, *SMC1A*, *DBF4*, *WEE1*, *RBL2*, *MAD2L1*, *E2F4*, *MCM3*, *TFDP1*, *CDC16*, *FZR1*, *STAG2*, *SKP1*, *CUL1*, *CDC27*, *PRKDC*, *MYC*, *RBX1*, *RAD21*, *SMC3*, *GSK3B*, *CDK7*, *BUB3*, *HDAC2*, *YWHAZ*, *TFDP2*, *CCND1*, *MCM4*, *ANAPC5*, and *SFN*.
- Variability within Groups: While expression differences between conditions are clear, some genes (e.g., GADD45B) show wider individual variations within both "Adj_normal" and "Tumor" groups, although the overall trend of upregulation in tumor remains.
Biological Interpretation
The observed widespread upregulation of cell cycle-related genes in Intestinal Epithelial cells from tumor tissue is a critical biological finding that aligns strongly with the hallmarks of cancer, particularly uncontrolled cell proliferation.
- Promotion of Cell Proliferation: Genes such as *PCNA* (Proliferating Cell Nuclear Antigen), *MCM3*, *MCM4*, *MCM7* (Minichromosome Maintenance complex components), and *CDC45* (not explicitly plotted but typically co-regulated with MCMs for DNA replication initiation) are essential for DNA replication. Their elevated expression in tumor Intestinal Epithelial cells strongly indicates increased proliferative activity, a fundamental characteristic of cancerous growth [1].
- Dysregulation of Cell Cycle Progression:
- Cyclins and Cyclin-Dependent Kinases (CDKs): Genes like *CCND1*, *CCND2*, *CCND3*, *CCNH* (Cyclins) and *CDK4*, *CDK6*, *CDK7* (Cyclin-Dependent Kinases) are crucial regulators of cell cycle progression, driving cells through different phases (e.g., G1 to S phase transition). Their upregulation suggests an acceleration of the cell cycle, leading to rapid and unchecked cell division [2].
- E2F Transcription Factors: *E2F4* and *TFDP1/TFDP2* (transcription factor DPs) form complexes that regulate the transcription of genes necessary for S-phase entry and DNA synthesis. Their increased expression contributes to the sustained activation of proliferation programs.
- Anaphase-Promoting Complex (APC/C) Components: Genes like *ANAPC1*, *ANAPC5*, *ANAPC7*, *ANAPC10*, *ANAPC11*, *ANAPC13*, *CDC16*, *CDC27*, *FZR1*, *RBX1*, *SKP1*, and *CUL1* (which are components or regulators of the Anaphase-Promoting Complex/Cyclosome or other ubiquitin ligases like SCF complex) are involved in targeting cyclins and other cell cycle regulators for degradation, thus regulating cell cycle exit and anaphase onset. Their coordinated upregulation might reflect a highly active and potentially deregulated machinery for cell cycle progression and turnover, attempting to maintain rapid division while perhaps also contributing to genomic instability.
- Spindle Assembly Checkpoint (SAC): Upregulation of *MAD2L1*, *MAD2L2*, and *BUB3* suggests activation or compensatory upregulation of the spindle assembly checkpoint, which ensures proper chromosome segregation. In cancer, these checkpoints can be either overridden or become hyperactive due to underlying genomic instability.
- DNA Damage Response and Checkpoint Pathways:
- TP53 pathway: Genes like *TP53* (tumor suppressor p53) and its negative regulator *MDM2*, as well as *GADD45A* and *GADD45B* (which are p53 target genes involved in growth arrest and DNA repair), are all found to be upregulated. The upregulation of *TP53* and *GADD45A/B* could be a cellular response to increased replication stress and DNA damage inherent in rapidly dividing tumor cells. However, the co-upregulation of *MDM2* indicates potential mechanisms by which tumor cells might attempt to inactivate p53's tumor suppressive functions despite its increased expression [3].
- DNA Repair and Replication Stress: *PRKDC* (DNA-PK catalytic subunit) is involved in DNA repair, particularly non-homologous end joining (NHEJ). Its upregulation could reflect increased DNA damage in tumor cells requiring enhanced repair mechanisms. *WEE1* is a checkpoint kinase that inhibits CDK activity, arresting the cell cycle in response to DNA damage. Its upregulation further suggests active DNA damage responses in these tumor cells.
- Epigenetic Regulation: *HDAC1* and *HDAC2* (Histone Deacetylases) are upregulated. HDACs play a crucial role in epigenetic regulation by modifying chromatin structure, which can impact gene expression, including that of cell cycle genes and oncogenes. Their overexpression is common in cancer and can promote proliferation by altering the expression of key regulatory genes.
In summary, the Intestinal Epithelial cells within the tumor microenvironment exhibit a profound dysregulation of cell cycle control, characterized by the upregulation of numerous genes involved in DNA replication, cell cycle progression, and checkpoint responses. This molecular signature strongly supports the highly proliferative nature of colon cancer.
Clinical or Translational Implications
The consistent and significant upregulation of cell cycle-related genes in Intestinal Epithelial cells within tumor tissue has several important clinical and translational implications:
- Biomarkers for Proliferation and Prognosis: Genes like *PCNA*, *CCND1*, *CDK4*, and *MYC* are well-established markers of cell proliferation. Their increased expression in tumor cells could serve as diagnostic or prognostic biomarkers for colon cancer progression and aggressiveness.
- Therapeutic Targets: The identified upregulated cell cycle regulators represent potential therapeutic targets. Inhibitors of CDKs (e.g., palbociclib, ribociclib for CDK4/6), MDM2 inhibitors, or HDAC inhibitors are already in clinical use or under investigation for various cancers. Targeting these pathways specifically in colon cancer cells could help halt uncontrolled proliferation [4, 5].
- Understanding Treatment Resistance: The complex interplay of upregulated cell cycle genes and DNA damage response elements (like *TP53*, *MDM2*, *PRKDC*, *WEE1*) could shed light on mechanisms of resistance to conventional chemotherapies that often target rapidly dividing cells or induce DNA damage.
- Precision Medicine: Further investigation into the specific roles and dependencies created by the differential expression of these genes could lead to more personalized treatment strategies for colon cancer patients, particularly those with tumors originating from Intestinal Epithelial cells exhibiting these specific molecular signatures.
---
References:
[1] GeneCards: PCNA (search query: "PCNA gene in cancer")
[2] PubMed search for "cyclin dependent kinase cancer cell cycle"
[3] GeneCards: TP53 (search query: "TP53 MDM2 interaction cancer")
[4] PubMed search for "CDK inhibitors cancer therapy"
[5] PubMed search for "HDAC inhibitors cancer therapy"
21. Gene Ontology (GSA) Analysis of Intestinal Epithelial Cells Across Conditions
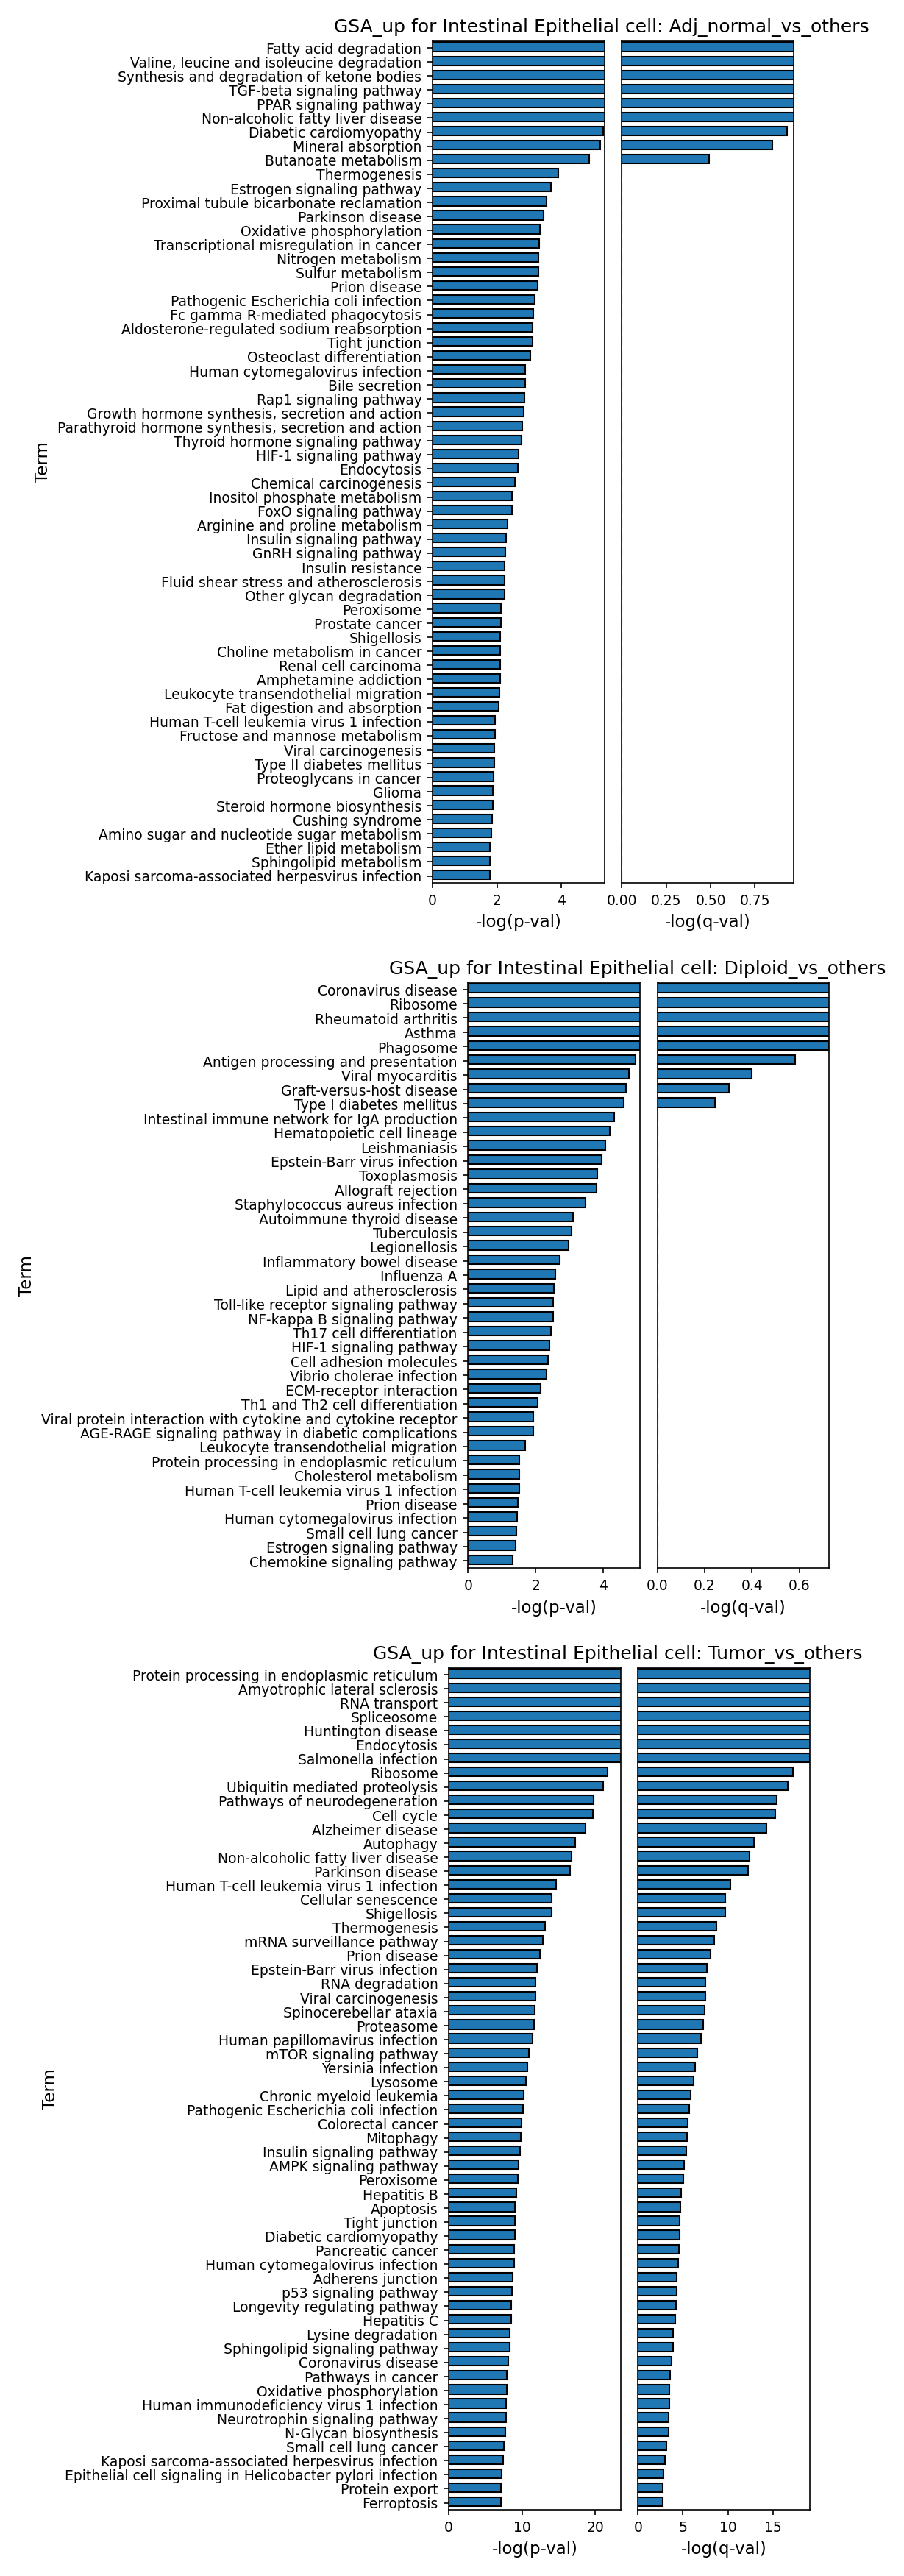
[Analysis Visualization Results]...
Analysis Overview
This analysis presents Gene Ontology (GO) enrichment results (GSA_up) for Intestinal Epithelial cells. The bar plots display pathways and biological processes that are significantly upregulated in Intestinal Epithelial cells when comparing specific conditions ('Adj_normal', 'Diploid', or 'Tumor') against all other cells in the dataset. The significance is represented by -log(p-val) and -log(q-val), where higher values indicate stronger enrichment. This approach helps identify the distinct functional characteristics of Intestinal Epithelial cells under different physiological or pathological states within the colon tissue.
Visual Summary
Intestinal Epithelial cell: Adj_normal_vs_others
The first plot highlights pathways upregulated in Intestinal Epithelial cells from adjacent normal tissue.
- Dominant themes: The most significantly enriched terms are predominantly related to metabolism, including "Fatty acid degradation", "Valine, leucine and isoleucine degradation", "Synthesis and degradation of ketone bodies", and "Butanoate metabolism".
- Key signaling: "TGF-beta signaling pathway" and "PPAR signaling pathway" are also highly enriched, indicating active regulatory mechanisms.
- Specific functions: "Mineral absorption" directly reflects a primary physiological function of intestinal epithelial cells.
- Disease associations: Terms like "Non-alcoholic fatty liver disease" and "Diabetic cardiomyopathy" appear, likely reflecting the strong metabolic component shared with these conditions.
- Significance: Many terms show strong statistical significance, with -log(p-val) exceeding 4 and -log(q-val) above 0.5, indicating robust enrichment of these metabolic and regulatory processes in healthy intestinal epithelium.
Intestinal Epithelial cell: Diploid_vs_others
The second plot shows pathways upregulated in Intestinal Epithelial cells classified as Diploid (i.e., having a normal chromosome number).
- Immune and infection response: A striking number of top enriched terms are associated with immune processes and responses to infection, such as "Coronavirus disease", "Phagosome", "Antigen processing and presentation", "Intestinal immune network for IgA production", and various viral/bacterial/parasitic infection terms (e.g., "Epstein-Barr virus infection", "Staphylococcus aureus infection", "Leishmaniasis").
- Inflammation and autoimmunity: Terms related to inflammatory and autoimmune diseases are prominent, including "Rheumatoid arthritis", "Asthma", "Graft-versus-host disease", "Type I diabetes mellitus", and "Inflammatory bowel disease".
- Basic cellular machinery: "Ribosome" is highly enriched, indicating active protein synthesis.
- Signaling and adhesion: "Toll-like receptor signaling pathway", "NF-kappa B signaling pathway", "Th1 and Th2 cell differentiation", "ECM-receptor interaction", and "Cell adhesion molecules" suggest robust immune signaling and structural integrity maintenance.
- Significance: These terms also demonstrate strong statistical significance, with -log(p-val) mostly above 2 and -log(q-val) above 0.25, highlighting the active immune-related functions of genetically stable epithelial cells.
Intestinal Epithelial cell: Tumor_vs_others
The third plot details pathways upregulated in Intestinal Epithelial cells originating from tumor tissue.
- Cancer hallmarks: Pathways characteristic of cancer are highly enriched, including "Protein processing in endoplasmic reticulum", "RNA transport", "Spliceosome", "Ribosome", "Ubiquitin mediated proteolysis", "Cell cycle", and "Autophagy". These indicate heightened metabolic demands, increased protein synthesis/degradation, and dysregulated cell division.
- Oncogenic signaling: Key signaling pathways like "mTOR signaling pathway", "p53 signaling pathway", and "HIF-1 signaling pathway" are significantly upregulated, reflecting altered growth, proliferation, and stress responses in tumor cells.
- Direct disease associations: "Colorectal cancer" is directly listed as a highly enriched term, strongly validating the relevance of these findings to the tumor context. Other cancer-related terms (e.g., "Pancreatic cancer", "Viral carcinogenesis") are also present, suggesting shared molecular mechanisms.
- Cell fate and stress: Terms like "Cellular senescence", "Apoptosis", and "Ferroptosis" indicate complex cell death and survival mechanisms at play.
- Neurodegenerative/Infectious disease links: Several neurodegenerative diseases (e.g., "Amyotrophic lateral sclerosis", "Alzheimer disease") and infectious diseases (e.g., "Human papillomavirus infection", "Salmonella infection") appear, which often share underlying cellular stress, protein misfolding, or immune evasion mechanisms with cancer.
- Significance: This plot shows the highest level of significance, with numerous terms having -log(p-val) well over 10 and -log(q-val) above 5, underscoring the profound biological shifts in tumor epithelial cells.
Biological Interpretation
The GSA results provide a clear distinction between the functional roles of Intestinal Epithelial cells in normal (Adj_normal, Diploid) versus tumor conditions.
- Healthy Epithelial Homeostasis and Metabolism (Adj_normal): Intestinal Epithelial cells from adjacent normal tissue are characterized by active lipid and amino acid metabolism. This aligns with their critical role in nutrient absorption and energy production for maintaining the gut barrier and rapid cell turnover. The enrichment of "Mineral absorption" directly confirms their physiological function. "TGF-beta signaling" further supports their role in maintaining tissue homeostasis, differentiation, and growth control in a healthy state.
- Immune Surveillance and Barrier Function (Diploid): Diploid Intestinal Epithelial cells exhibit a strong upregulation of immune response pathways and defense mechanisms against various pathogens. This highlights their essential role as a primary physical and immunological barrier in the gut, actively sensing and responding to the microbiota and potential threats. The enrichment for terms like "Antigen processing and presentation" and "Intestinal immune network for IgA production" underscores their involvement in shaping mucosal immunity. The presence of autoimmune disease terms suggests these cells are integral to the pathways that, when dysregulated, lead to inflammatory conditions like Inflammatory Bowel Disease [1].
- Oncogenic Transformation and Proliferation (Tumor): In contrast, Intestinal Epithelial cells from tumor regions display a profound shift towards processes that support uncontrolled growth, survival, and cellular stress. Upregulation of protein processing, RNA metabolism, and cell cycle pathways indicates a state of high biosynthetic activity and rapid proliferation, characteristic hallmarks of cancer cells. The strong enrichment of mTOR signaling, a central regulator of cell growth, and HIF-1 signaling, critical for adapting to hypoxic tumor microenvironments, confirms key drivers of tumorigenesis [2, 3]. The direct identification of "Colorectal cancer" as an enriched pathway provides strong evidence for the relevance of these molecular changes to the disease itself. The co-occurrence of various cellular stress and cell death pathways (e.g., "Autophagy", "Cellular senescence", "Apoptosis", "Ferroptosis") points to the complex struggle between pro-survival mechanisms and potential cellular demise within the tumor microenvironment.
Clinical or Translational Implications
The distinct Gene Ontology profiles reveal significant biological differences that can have clinical implications for colorectal cancer.
- Biomarker Discovery: The pathways uniquely enriched in tumor Intestinal Epithelial cells, such as those related to mTOR signaling, HIF-1 signaling, and specific protein/RNA processing, could serve as potential diagnostic or prognostic biomarkers for colorectal cancer progression.
- Therapeutic Targets: The identified upregulated pathways in tumor cells represent promising therapeutic targets. For instance, inhibitors of the mTOR pathway are already being investigated in various cancers, and their specific enrichment here suggests a potential role in colorectal cancer [2]. Targeting pathways involved in protein processing (e.g., proteasome inhibitors) or stress response could also be explored.
- Understanding Disease Mechanisms: The GSA provides a mechanistic understanding of how Intestinal Epithelial cells contribute to tumor initiation and progression, by highlighting their metabolic rewiring and active engagement in processes like cellular senescence and altered cell cycle regulation. This insight could guide the development of novel therapeutic strategies aimed at reversing these oncogenic shifts.
- Immune Modulation: The strong immune signature in diploid epithelial cells, which is less prominent in tumor cells, suggests that restoring the healthy immune function of the epithelium could be a valuable strategy for cancer prevention or therapy.
---
References:
- Intestinal epithelial barrier in inflammatory bowel disease: https://pubmed.ncbi.nlm.nih.gov/?term=intestinal+epithelial+barrier+inflammatory+bowel+disease
- mTOR signaling pathway in cancer: https://pubmed.ncbi.nlm.nih.gov/?term=mTOR+signaling+cancer
- HIF-1 signaling pathway in cancer: https://pubmed.ncbi.nlm.nih.gov/?term=HIF-1+signaling+cancer
22. GSEA for Colon Cancer Cell Types: Pathway Enrichment in Tumor Microenvironment and Aneuploidy
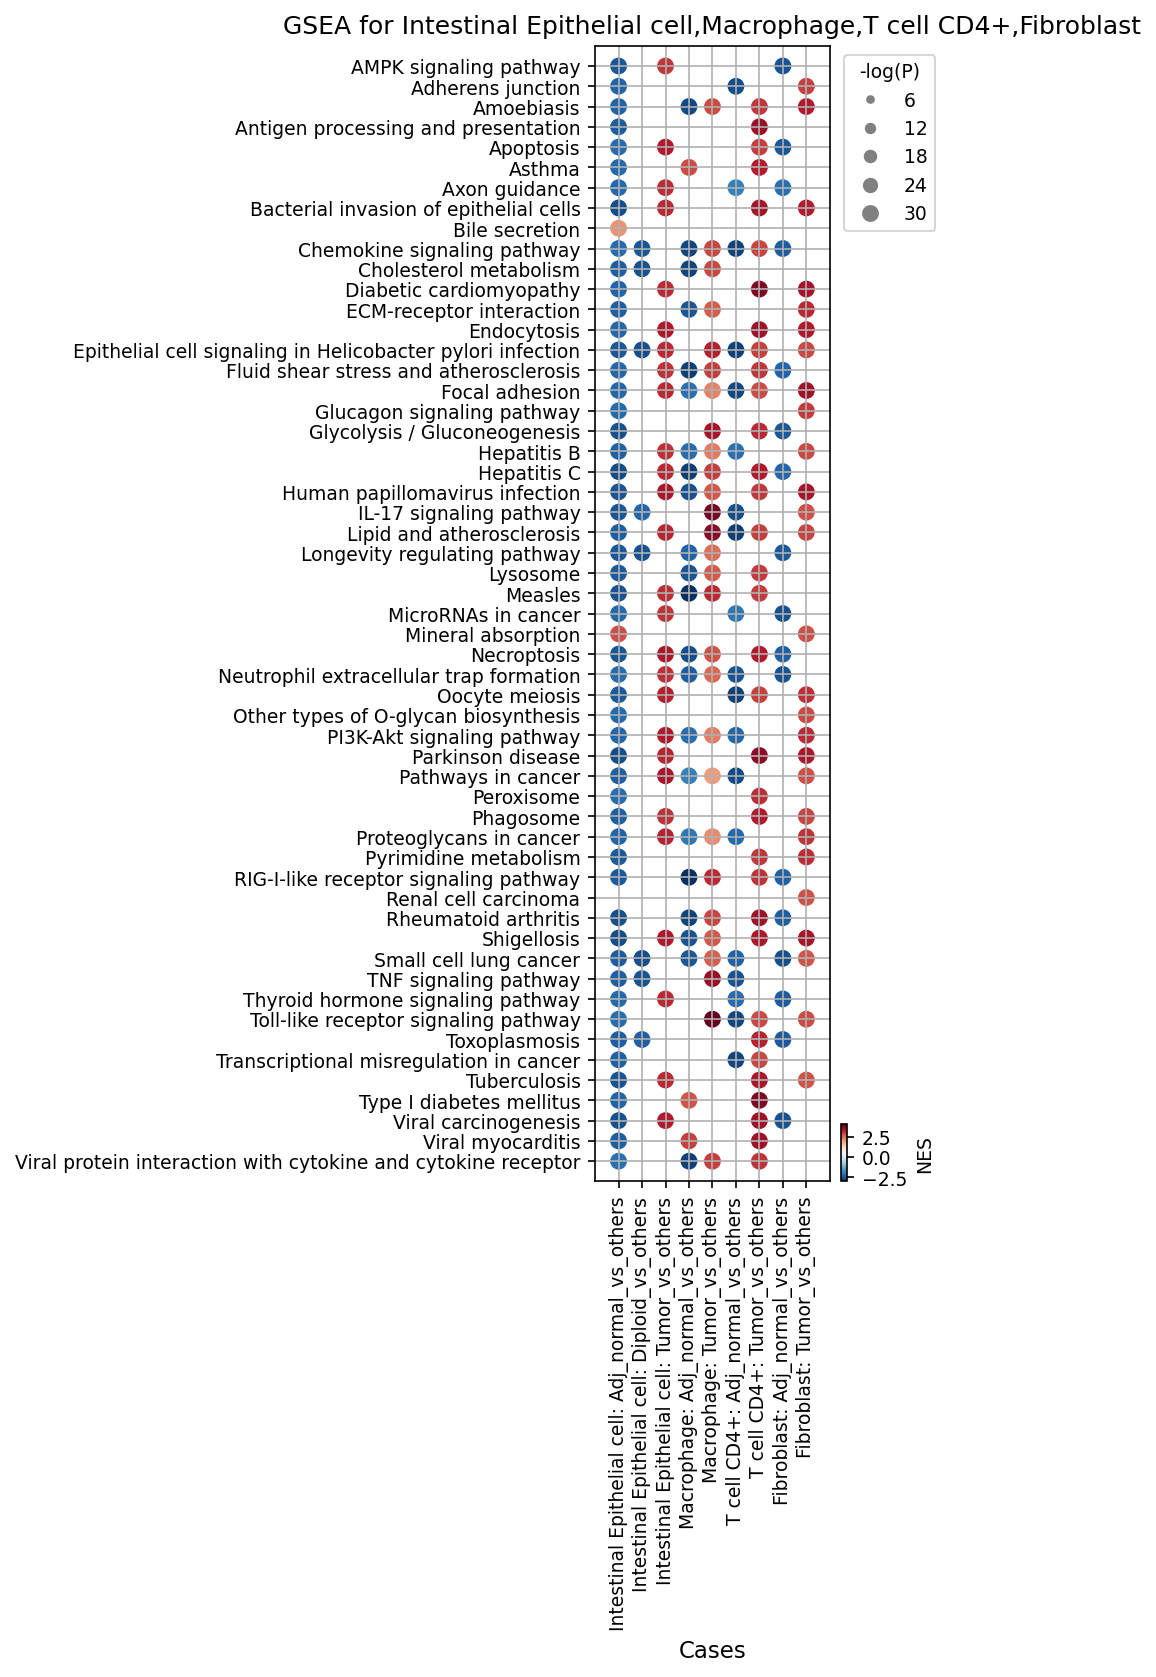
[Analysis Visualization Results]...
Analysis Overview
This analysis utilizes Gene Set Enrichment Analysis (GSEA) to explore pathway activity across key cellular components of colon tissue: Intestinal Epithelial cells, Macrophages, CD4+ T cells, and Fibroblasts. The presented dot plot visualizes the results, highlighting pathways that are either enriched (activated) or suppressed (downregulated) within a specific cell type and condition (e.g., Intestinal Epithelial cells from Adjacent Normal tissue) when compared against all other cells in the dataset. This comparison strategy is designed to identify the unique molecular signatures that characterize each distinct cell state. The size of each dot reflects the statistical significance of the enrichment (-log(p-value)), with larger dots indicating higher significance. The dot's color represents the Normalized Enrichment Score (NES), where red signifies an activated or upregulated pathway (positive NES), and blue indicates a suppressed or downregulated pathway (negative NES). The analysis includes conditions for Adjacent Normal and Tumor tissues, and for Intestinal Epithelial cells, also considers diploid status.
Visual Summary
The dot plot reveals striking differences in pathway activities, reflecting profound cellular reprogramming in the colon tumor microenvironment compared to adjacent normal tissue.
Intestinal Epithelial Cells (IECs):
- In Adjacent Normal and Diploid IECs, pathways associated with cell structure, adhesion (e.g., Adherens junction, Focal adhesion), and metabolic regulation (AMPK signaling pathway, Lysosome) are notably enriched.
- Tumor IECs, in contrast, display a dramatic shift towards proliferative and oncogenic pathways. There is strong enrichment for "Pathways in cancer," "PI3K-Akt signaling pathway," "Glycolysis / Gluconeogenesis" (suggesting altered metabolism), "Transcriptional misregulation in cancer," and "Viral carcinogenesis." Concurrently, "Antigen processing and presentation" and "Apoptosis" pathways show significant suppression.
Macrophages:
- Adjacent Normal macrophages exhibit enrichment in core immune functions such as "Phagosome," "Antigen processing and presentation," and "Toll-like receptor signaling pathway," indicating their role in immune surveillance.
- Tumor macrophages, however, show a marked suppression of "Antigen processing and presentation." Instead, pro-inflammatory and potentially pro-tumorigenic pathways like "PI3K-Akt signaling pathway," "TNF signaling pathway," and "Chemokine signaling pathway" are activated, consistent with a Tumor-Associated Macrophage (TAM) phenotype.
T cell CD4+:
- Adjacent Normal CD4+ T cells show activated "T cell receptor signaling pathway" and "IL-17 signaling pathway," indicative of their role in adaptive immunity.
- In the Tumor microenvironment, CD4+ T cells exhibit widespread suppression of critical immune activation pathways, including "T cell receptor signaling pathway," "Antigen processing and presentation," "Th1 and Th2 cell differentiation," "Rheumatoid arthritis," "Toll-like receptor signaling pathway," and "TNF signaling pathway." Conversely, "Viral protein interaction with cytokine and cytokine receptor" is activated. This pattern strongly suggests immune dysfunction or exhaustion.
Fibroblasts:
- Adjacent Normal fibroblasts show enrichment in pathways related to extracellular matrix (ECM) and cell adhesion (e.g., "ECM-receptor interaction," "Focal adhesion").
- Tumor fibroblasts (likely Cancer-Associated Fibroblasts or CAFs) show a pronounced activation of pathways involved in ECM remodeling and tumorigenesis, including "ECM-receptor interaction," "Focal adhesion," "Pathways in cancer," "PI3K-Akt signaling pathway," "Transcriptional misregulation in cancer," and "Viral carcinogenesis."
- Overall Trends: A consistent pattern emerges where pathways supporting normal tissue function and immune surveillance in adjacent normal cells are suppressed in the tumor context. Instead, tumor-associated IECs, macrophages, and fibroblasts collectively activate pathways central to cancer progression, metabolic reprogramming, and immune evasion. "Pathways in cancer" and "PI3K-Akt signaling pathway" are recurrently activated across these tumor-associated cell types.
Biological Interpretation
- Intestinal Epithelial Cell Oncogenic Reprogramming: The transition from normal to tumor IECs is marked by a clear shift from maintaining tissue integrity and basic metabolism to active oncogenesis. The robust activation of "Pathways in cancer" GeneCards: Pathways in Cancer, "PI3K-Akt signaling pathway" PubMed: PI3K/AKT Pathway in Cancer, and "Transcriptional misregulation in cancer" reflects aggressive growth, uncontrolled proliferation, and altered gene expression programs. The enrichment of "Glycolysis / Gluconeogenesis" indicates a metabolic shift (the Warburg effect) commonly observed in cancer cells, favoring aerobic glycolysis even in the presence of oxygen. The suppression of "Antigen processing and presentation" suggests a mechanism for tumor cells to escape immune detection.
- Macrophage Polarization towards a Pro-Tumorigenic Role: In the healthy colon, macrophages act as immune sentinels. However, within the tumor microenvironment, they appear to be reprogrammed. The suppression of "Antigen processing and presentation" in tumor macrophages points to an impaired ability to initiate adaptive immune responses. Concurrently, the activation of "PI3K-Akt signaling pathway" PubMed: PI3K Signaling Macrophages, "TNF signaling pathway" GeneCards: TNF Signaling Pathway, and "Chemokine signaling pathway" indicates that these macrophages likely adopt a Tumor-Associated Macrophage (TAM) phenotype, contributing to chronic inflammation, angiogenesis, and immune suppression, thereby fostering tumor growth.
- CD4+ T Cell Exhaustion in the Tumor Microenvironment: The most concerning finding for CD4+ T cells is the widespread suppression of pathways critical for their activation and differentiation, including "T cell receptor signaling pathway" and "Th1 and Th2 cell differentiation." This pattern is characteristic of T cell exhaustion or anergy, where T cells lose their effector functions despite persistent antigen exposure in the tumor microenvironment. This functional impairment is a major mechanism of immune evasion by tumors. The activation of "Viral protein interaction with cytokine and cytokine receptor" might reflect a dysfunctional or altered immune signaling state, potentially induced by the tumor.
- Fibroblast Activation and Formation of Cancer-Associated Fibroblasts (CAFs): Fibroblasts transition from their quiescent, supportive role in normal tissue to highly activated CAFs in the tumor. The strong enrichment of "ECM-receptor interaction" GeneCards: ECM-receptor interaction and "Focal adhesion" PubMed: Focal Adhesion Cancer highlights their active role in remodeling the extracellular matrix, which facilitates tumor invasion and metastasis. Furthermore, the activation of "Pathways in cancer," "PI3K-Akt signaling pathway," and "Transcriptional misregulation in cancer" in CAFs underscores their direct involvement in driving tumor progression through growth factor secretion, immune modulation, and metabolic support for cancer cells.
- Coordinated Tumor Microenvironment Dysregulation: The consistent activation of oncogenic pathways like "PI3K-Akt signaling" and "Pathways in cancer" across tumor IECs, macrophages, and fibroblasts indicates a highly integrated and dysregulated tumor ecosystem. This orchestrated cellular crosstalk promotes tumor survival, growth, and metastasis while simultaneously suppressing effective anti-tumor immune responses.
Clinical or Translational Implications
The comprehensive pathway analysis reveals several critical targets and mechanisms relevant to colon cancer diagnosis and therapy.
- Broad-Spectrum Oncogenic Pathway Targeting: The recurring activation of the PI3K-Akt signaling pathway across multiple tumor-associated cell types suggests that inhibitors targeting this pathway could offer broad therapeutic benefits, affecting not only cancer cells but also their supportive stromal and immune components within the tumor microenvironment.
- Immune Checkpoint Blockade and T Cell Reinvigoration: The observed T cell exhaustion and suppression of antigen presentation pathways are strong indicators for the potential efficacy of immunotherapies, such as immune checkpoint inhibitors (e.g., PD-1/PD-L1 blockade) or strategies to reverse T cell anergy, aiming to reactivate a robust anti-tumor immune response.
- Targeting the Tumor Stroma: The prominent role of CAFs in ECM remodeling and their active contribution to cancer pathways suggest that therapeutic interventions aimed at modulating CAF activity or disrupting ECM-receptor interactions could impede tumor growth, invasion, and metastasis, potentially enhancing the efficacy of conventional therapies.
- Biomarker Identification: The unique pathway signatures associated with tumor-specific cell states (e.g., suppressed antigen presentation in tumor IECs/macrophages, activated PI3K-Akt in CAFs) could serve as novel biomarkers for early detection, monitoring disease progression, or predicting response to targeted therapies in colon cancer patients.
- Investigating Viral Associations: The activation of "Viral carcinogenesis" and "Viral protein interaction with cytokine and cytokine receptor" pathways, while potentially reflecting general oncogenic processes, warrants further investigation into the presence or influence of specific viral agents, or viral mimicry, in colon cancer pathogenesis, which could inform the development of novel antiviral or immunotherapeutic strategies.
23. Discussion
The single-cell analysis of human colon tissue provides a granular view into the profound molecular and cellular reprogramming that defines colorectal cancer (CRC). A central finding is the clear distinction of malignant intestinal epithelial cells (IECs) within the tumor microenvironment (TME). These cells not only exhibit a striking expansion in tumor samples but are also predominantly aneuploid, a classic hallmark of cancer, which fundamentally alters their transcriptional programs. Notably, even diploid tumor epithelial cells harbor significant focal copy number variations (CNVs), such as EGFR amplification and CDKN2A deletion, suggesting diverse genetic routes to malignancy that may precede gross aneuploidy or represent specific clonal evolution events. The malignant IECs further undergo extensive surfaceome reprogramming, upregulating critical markers like PMEPA1, SDC1, SLC2A1 (GLUT1), EREG, and CEACAM1, while shedding normal epithelial markers, indicating a phenotypic adaptation for aggressive growth and interaction within the TME. Gene Ontology and GSEA consistently underscore this oncogenic shift, revealing robust activation of PI3K-Akt, mTOR, HIF-1, and glycolytic pathways, alongside suppression of antigen processing and apoptosis, driving uncontrolled proliferation and metabolic rewiring.
Simultaneously, the immune microenvironment undergoes a dramatic transformation towards an immunosuppressive state. Within the T cell compartment, there is a marked increase in T regulatory (Treg) and Th17 cells, coupled with a significant decrease in cytotoxic T cells (T_Cyto) and ILC1s, profoundly impairing anti-tumor immunity. Tumor-infiltrating CD4+ T cells specifically upregulate inhibitory immune checkpoints such as TIGIT and CTLA4, alongside MHC Class II molecules, indicative of T cell exhaustion or a regulatory phenotype that actively dampens effector responses. Macrophages, critical mediators of the immune response, are extensively reprogrammed. In the tumor, they show a significant shift from M2A (tissue repair-associated) to M2B (mixed inflammatory/immunosuppressive) subsets, suppressing antigen presentation pathways while activating pro-tumorigenic signaling like PI3K-Akt, TNF, and chemokine pathways. This re-education results in a distinct tumor-associated macrophage (TAM) surfaceome, characterized by FCGR1A, CD9, MMP14, and TREM2, further supporting tumor progression. Cell-cell interaction analysis highlights how this TME is orchestrated, revealing a strong PVR-TIGIT interaction between tumor epithelial cells and CD8+ T cells, an active mechanism of immune evasion. Furthermore, interactions like CCL20-CCR6 and APP-CD74 between macrophages and aneuploid epithelial cells, and the EREG-EGFR axis, suggest a potent pro-tumorigenic crosstalk.
The stromal compartment, particularly fibroblasts, also undergoes significant activation and reprogramming, transitioning into cancer-associated fibroblasts (CAFs). These CAFs acquire a distinct surfaceome, including canonical markers like FAP, CD248, and CD276 (B7-H3), along with various integrins (ITGAV, ITGA5, ITGB5). CAFs actively remodel the extracellular matrix through extensive collagen-integrin interactions and contribute to tumorigenesis by activating pathways like PI3K-Akt and ECM-receptor interaction. The overall picture is one of a highly integrated and dysregulated ecosystem where malignant cells, immunosuppressive immune cells, and activated stromal cells conspire to promote tumor growth and evade host immunity. These findings offer a mechanistic understanding of CRC progression and identify numerous potential targets for therapeutic intervention.
Hypotheses:
- Aneuploidy and specific sub-chromosomal CNVs (e.g., EGFR amplification, CDKN2A deletion) drive early malignant transformation and clonal evolution of intestinal epithelial cells in colorectal cancer, preceding gross chromosomal instability.
- The colorectal tumor microenvironment actively promotes an immunosuppressive state, characterized by an increased proportion of Tregs, a shift to M2B-like macrophages, and exhaustion/dysfunction of cytotoxic T cells, critically hindering effective anti-tumor immunity.
- Cancer-associated fibroblasts (CAFs) and tumor-associated macrophages (TAMs) are reprogrammed in colorectal cancer to extensively remodel the extracellular matrix and engage in pro-tumorigenic crosstalk (e.g., EREG-EGFR, CCL20-CCR6), directly contributing to tumor growth, invasion, and immune evasion.
- The widespread upregulation of cell cycle genes and activation of oncogenic pathways (PI3K-Akt, mTOR, HIF-1) in tumor intestinal epithelial cells reflects metabolic rewiring and uncontrolled proliferation, central to colorectal cancer pathogenesis.
Potential therapeutic targets:
- EGFR: EGFR is frequently amplified in tumor epithelial cells and its ligand EREG, secreted by macrophages, promotes tumor cell proliferation via EREG-EGFR interaction. High EREG expression is also observed in tumor epithelial cells. Evidence: Recurrent EGFR amplification in diploid tumor intestinal epithelial cells (Section 4). Strong EREG-EGFR interaction between macrophages and aneuploid intestinal epithelial cells (Section 14). High EREG expression on tumor intestinal epithelial cells (Section 16). Validation: Evaluate EGFR inhibitors (e.g., cetuximab, panitumumab) in patient-derived colorectal cancer organoid models or xenografts with confirmed EGFR amplification or high EREG expression.
- TIGIT: TIGIT is an inhibitory immune checkpoint receptor highly expressed on tumor-infiltrating CD4+ T cells. Its interaction with PVR on tumor epithelial cells actively suppresses anti-tumor T cell responses, contributing to immune evasion. Evidence: High expression of TIGIT on tumor CD4+ T cells (Section 19). PVR-TIGIT interaction enriched in tumor samples, mediating suppression of CD8+ T cells (Section 15). Validation: Test anti-TIGIT antibodies, alone or in combination with other immune checkpoint inhibitors (e.g., anti-PD-1/PD-L1), in preclinical colorectal cancer models and clinical trials to reverse T cell exhaustion.
- CTLA4: CTLA4 is a well-established inhibitory immune checkpoint receptor, significantly upregulated on tumor-infiltrating CD4+ T cells, contributing to T cell exhaustion and dampened anti-tumor immunity. Evidence: High expression of CTLA4 on tumor CD4+ T cells (Section 19). GSEA indicates widespread suppression of T cell receptor signaling pathways in tumor CD4+ T cells, characteristic of exhaustion (Section 22). Validation: Evaluate anti-CTLA4 antibodies (e.g., ipilimumab) in preclinical models and clinical trials for colorectal cancer, potentially as part of combination immunotherapies.
- FAP / CD248 (Cancer-Associated Fibroblasts): FAP and CD248 are canonical surface markers for Cancer-Associated Fibroblasts (CAFs), which are abundant in the colorectal TME, extensively remodel the extracellular matrix, and promote tumor growth, invasion, and immunosuppression. Evidence: High expression of FAP and CD248 on tumor fibroblasts (Section 18). Tumor fibroblasts show extensive collagen-integrin interactions, indicating active ECM remodeling (Sections 12, 15), and activation of pro-tumorigenic pathways (Section 22). Validation: Develop and test FAP- or CD248-targeted therapies, such as antibody-drug conjugates (ADCs) or small molecule inhibitors, to deplete or reprogram CAFs in preclinical colorectal cancer models.
- MMP14 / TREM2 (Tumor-Associated Macrophages): MMP14 is a critical matrix metalloproteinase on tumor-associated macrophages (TAMs) that promotes ECM degradation and tumor invasion. TREM2 is a receptor on TAMs associated with immunosuppression and lipid metabolism in the TME. Evidence: High expression of MMP14 and TREM2 on tumor macrophages (Section 17). Tumor macrophages exhibit suppressed antigen presentation and activated pro-tumorigenic pathways (Section 22). Validation: Investigate antibodies or small molecule inhibitors targeting MMP14 to impede tumor invasion. Explore strategies to modulate TREM2 signaling in TAMs to reverse immunosuppression and re-educate them towards an anti-tumorigenic phenotype.
- PI3K-Akt signaling pathway: This pathway is recurrently and strongly activated across multiple tumor-associated cell types, including tumor intestinal epithelial cells, macrophages, and fibroblasts, highlighting its central role in driving tumor progression, metabolic rewiring, and microenvironment dysregulation. Evidence: Strong enrichment of the 'PI3K-Akt signaling pathway' in tumor intestinal epithelial cells, tumor macrophages, and tumor fibroblasts (Section 22). Validation: Evaluate PI3K/Akt inhibitors, potentially in combination with other targeted agents or immunotherapies, across different cellular components of the TME in preclinical and clinical settings for colorectal cancer.
Follow-up validation ideas:
- Perform FISH or array CGH on sorted Intestinal Epithelial cells (Diploid vs. Aneuploid from tumor) to orthogonally validate specific CNVs like EGFR amplification and CDKN2A deletion identified by scRNA-seq-based CNV inference.
- Conduct multi-color flow cytometry or mass cytometry on fresh colorectal tumor and adjacent normal tissues to precisely quantify T cell and macrophage subset proportions and validate the expression of key surface markers (e.g., TIGIT, CTLA4, FOXP3, FCGR1A, MMP14, TREM2).
- Utilize multiplex immunofluorescence, immunohistochemistry, or spatial transcriptomics to visualize the spatial localization of identified cell populations (Tregs, M2B macrophages, CAFs) and their unique surface markers (FAP, CD276, TIGIT) within the tumor tissue architecture, and to confirm inferred cell-cell interaction proximity.
- Execute in vitro co-culture assays using patient-derived tumor organoids/cell lines, CAFs, and immune cells to functionally validate key ligand-receptor interactions (e.g., EREG-EGFR, PVR-TIGIT, CCL20-CCR6) in promoting tumor proliferation, invasion, or immune suppression.
- Test the impact of targeting identified pathways (e.g., PI3K-Akt inhibitors, anti-TIGIT antibodies) on tumor growth, metastasis, and immune responses using in vivo preclinical models such as patient-derived xenografts (PDX) or syngeneic mouse models, potentially in combination with CRISPR-based genetic perturbations.
- Perform targeted metabolomics on sorted tumor vs. normal intestinal epithelial cells to confirm the metabolic shift towards glycolysis (Warburg effect) and alterations in other metabolic pathways identified by GSEA.
Limitations:
This single-cell RNA sequencing analysis provides valuable insights into the colorectal tumor microenvironment, but certain limitations should be acknowledged. The study offers a correlative snapshot of cellular states and interactions, which does not inherently establish causality. The dynamic processes of disease progression and response to therapy cannot be fully captured without longitudinal studies. While cell-cell interactions are inferred based on ligand-receptor expression, direct physical contact and functional consequences require orthogonal spatial biology methods or in vitro/in vivo functional validation. Ploidy inference, derived from scRNA-seq CNV estimates, may not achieve the same resolution as dedicated genomic assays. Furthermore, findings are from a specific patient cohort, and broader generalizability across diverse colorectal cancer subtypes or stages necessitates further validation. The scope of surfaceome marker identification relies on existing databases, which may not be exhaustive.
24. Query List
- Show UMAPs including condition, sample, major cell type, minor cell type, ploidy_dec, and celltype_subset in 2 columns and save it.
- Show major celltype scores on UMAP and save it.
- Show the overall Celltype_subset marker expression dot plot and save it. Keep target_cell as None and keep the other arguments at their default values.
- Show CNV heatmap for tumor origin cells and unassigned cells, grouped by sample, along with a summary of significantly amplified copy number regions, and save it.
- Show CNV patterns on UMAP. Include major cell type, minor cell type, ploidy results, condition, and sample, in 2 columns, and save it.
- Show a population bar plot of minor cell types and save it.
- Show a subset population bar plot for T cells and save it.
- Show box plots for T cell subset populations if there are significant differences between conditions and save it. Set ncols appropriately based on the total number of panels.
- Show a subset population bar plot for macrophages and save it.
- Show box plots for macrophage subset populations if there are significant differences between conditions and save it. Set ncols appropriately based on the total number of panels.
- Select tumor origin cells and unassigned cells, and show a bar plot of their ploidy population and save it.
- Show cell-cell interaction patterns by condition including tumor origin cells, fibroblasts, macrophages, T cells, etc., and save it. Select up to 80 cell-cell interactions for each condition.
- Show cell-cell interactions by condition and save the result. Select at most 80 cell-cell interactions for each condition.
- Select only genes related to immune checkpoint and cell cycle pathways, and show cell-cell interactions for these genes and save it.
- Find statistically significant differences in cell-cell interactions between conditions for major immune cells and stromal cells and show them as a dot plot, and save it. Set max_n_items_per_group = 25.
- Show the condition-specific markers for tumor-origin cells (Intestinal Epithelial cell) as a dot plot and save the result. Use only surfaceome markers, up to 50 markers per condition.
- Extract condition-specific markers for Macrophage and show them as a dot plot, and save it. Filter for surfaceome markers only, up to 50 per condition.
- Extract condition-specific markers for Fibroblast and show them as a dot plot, and save it. Filter for surfaceome markers only, up to 50 per condition.
- Extract condition-specific markers for T cell CD4+ and show them as a dot plot, and save it. Filter for surfaceome markers only, up to 50 per condition.
- For Cell cycle pathway-related genes, select those with statistically significant expression differences between conditions in Intestinal Epithelial cells (major disease-related cells), show them as a box plot, and save it. Set max_n_items_to_plot = 24, and ncols appropriately so that the aspect ratio is approximately 2x3.
- Show Gene Ontology (GSA) analysis results for epithelial cells as bar plots and save the result.
- Show a dot plot of Gene set enrichment analysis results for Intestinal Epithelial cell, Macrophage, T cell CD4+, and Fibroblast and save it. Set color map to RdBu_r and n_pws_to_show = 80.