Single-Cell Transcriptomic and Genomic Profiling of Human Colon Cancer Reveals Tumor Microenvironment Remodeling and Novel Therapeutic Targets
This report details a comprehensive single-cell analysis of human colon tissue, comparing normal and tumor conditions. Key findings include the identification of Intestinal Epithelial cells as the tumor-origin cell type, exhibiting widespread aneuploidy and dysregulated cell cycle activity. The tumor microenvironment is significantly remodeled, characterized by shifts in immune cell populations such as an increase in immunosuppressive regulatory T cells and pro-tumorigenic M2 macrophages, alongside the activation of cancer-associated fibroblasts. Cell-cell communication patterns are drastically altered, with a loss of beneficial immune crosstalk and emergence of new immune checkpoint interactions. These insights illuminate disease mechanisms and pinpoint promising therapeutic targets within both tumor cells and the surrounding microenvironment.
Contents
- Dataset overview
- UMAP Visualization of Cellular Composition and Ploidy Status in Colon Tissue
- Major Cell Type Score and Ploidy Visualization on UMAP
- Marker Expression Dot Plot for Cell Subsets
- Copy Number Variation (CNV) Analysis of Intestinal Epithelial Cells in Colon Cancer
- CNV-based UMAPs for Cell Type, Ploidy, Condition, and Sample Distribution
- Minor Cell Type Population Analysis Across Normal and Tumor Colon Samples
- T Cell Subset Population Analysis in Normal and Colon Tumor Samples
- Differential Abundance of T cell and Immune Cell Subsets in Colon Cancer
- Macrophage Subset Population Analysis in Colon Normal and Tumor Tissues
- Differential Abundance of Macrophage Subsets in Colon Cancer
- Ploidy Status of Intestinal Epithelial Cells in Normal and Tumor Conditions
- Cell-Cell Interaction Landscape Alterations in Colon Cancer
- Immune Checkpoint and Cell Cycle Pathway Cell-Cell Interactions in Colon Tissue
- Condition-Specific Cell-Cell Interaction Patterns in Colon Tissue
- Intestinal Epithelial Cell Condition-Specific Surfaceome Markers
- Fibroblast Condition-Specific Surfaceome Markers in Colon Tissue
- T cell CD4+ Condition-Specific Surfaceome Markers in Colon Tissue
- Differential Expression of Cell Cycle Genes in Intestinal Epithelial Cells in Colon Cancer
- Gene Ontology (GSA) Analysis for Intestinal Epithelial Cells
- Gene Set Enrichment Analysis of Colon Cancer Cell Types
- Discussion
- Query List
0. Dataset overview
Dataset Summary
- AnnData Dimensions: The dataset contains 48,033 cells and 20,683 genes.
- Species & Tissue: Data is from human colon tissue.
- Conditions: Includes 'normal' and 'tumor' conditions, with 'normal' set as the reference for differential analyses.
- Observed Ploidy: Cells are categorized as Diploid (93.7%), Aneuploid (6.1%), or Unclear (0.1%).
- Resolved Tumor-Origin Cell Type: 'Intestinal Epithelial cell' has been identified as the tumor-origin cell type.
Available Annotations (obs columns):
- Sample & Condition Metadata: 'samples', 'Condition', 'Location', 'MSI_Status', 'bulk_prediction', 'prediction', 'sample', 'condition', 'accession', 'tissue', 'sample_ext'.
- Cell Type Hierarchy: 'celltype_major', 'celltype_minor', 'celltype_subset'.
- Ploidy & CNV Information: 'cnv_ref_ind', 'ploidy_score', 'ploidy_dec', 'ploidy_init_group', 'ploidy_dec_original', 'ploidy_marker_gsa_score', 'ploidy_marker_gsa_condition', 'ploidy_marker_gsa_fdr', 'aneuploid_gsa_candidate', 'diploid_gsa_candidate', 'ploidy_gsa_change', 'ploidy_refinement_louvain', 'ploidy_graph_louvain', 'ploidy_graph_group', 'ploidy_graph_max_other_connectivity', 'ploidy_graph_changed', 'cnv_cluster', 'cnv_sample_diversity_index'. CNV estimates are available.
- Other Metadata: 'cluster', 'sample_diversity_index'.
- Gene Metadata (var columns): Includes 'variable_genes', 'chr', 'spot_no', 'cytogenetic_band'.
Precomputed Results:
- Cell-Cell Interactions (CCI): Stored in uns['CCI'] (per condition) and uns['CCI_sample'] (per sample), with columns like 'gene_pair', 'cell_pair', 'pval', 'mean'.
- Differential Expression Genes (DEG): Stored in uns['DEG'] for each celltype_minor comparing one condition vs. the rest, with columns like 'log2_FC', 'pval', 'gene', 'Rp'.
- Gene Set Enrichment Analysis (GSEA): Stored in uns['GSEA'] for each celltype_minor comparing one condition vs. the rest, with columns like 'Name', 'ES', 'NES', 'FDR q-val', 'Lead_genes'.
- Gene Ontology (GO/GSA): Stored in uns['GSA_up'] for each celltype_minor comparing one condition vs. the rest, with columns like 'pval', 'pval_adj', 'genes', 'Term'.
- Target Cell Types for DEG/GSEA/GSA: Specific celltype_minor groups available for these analyses include B cell, Fibroblast, ILC, Intestinal Epithelial cell, Plasma cell, T cell CD4+, T cell CD8+.
Inferred Disease/Biological Context
- Inference: The dataset is inferred to be related to Colon cancer.
- Basis: This inference is based on the dataset originating from 'Colon' tissue, containing 'tumor' conditions, observing 'Aneuploid' cells (a malignancy indicator), and identifying 'Intestinal Epithelial cell' as the tumor-origin cell type, consistent with common colon cancer types.
- Uncertainty: Specific histological subtype or cancer stage cannot be determined from the data.
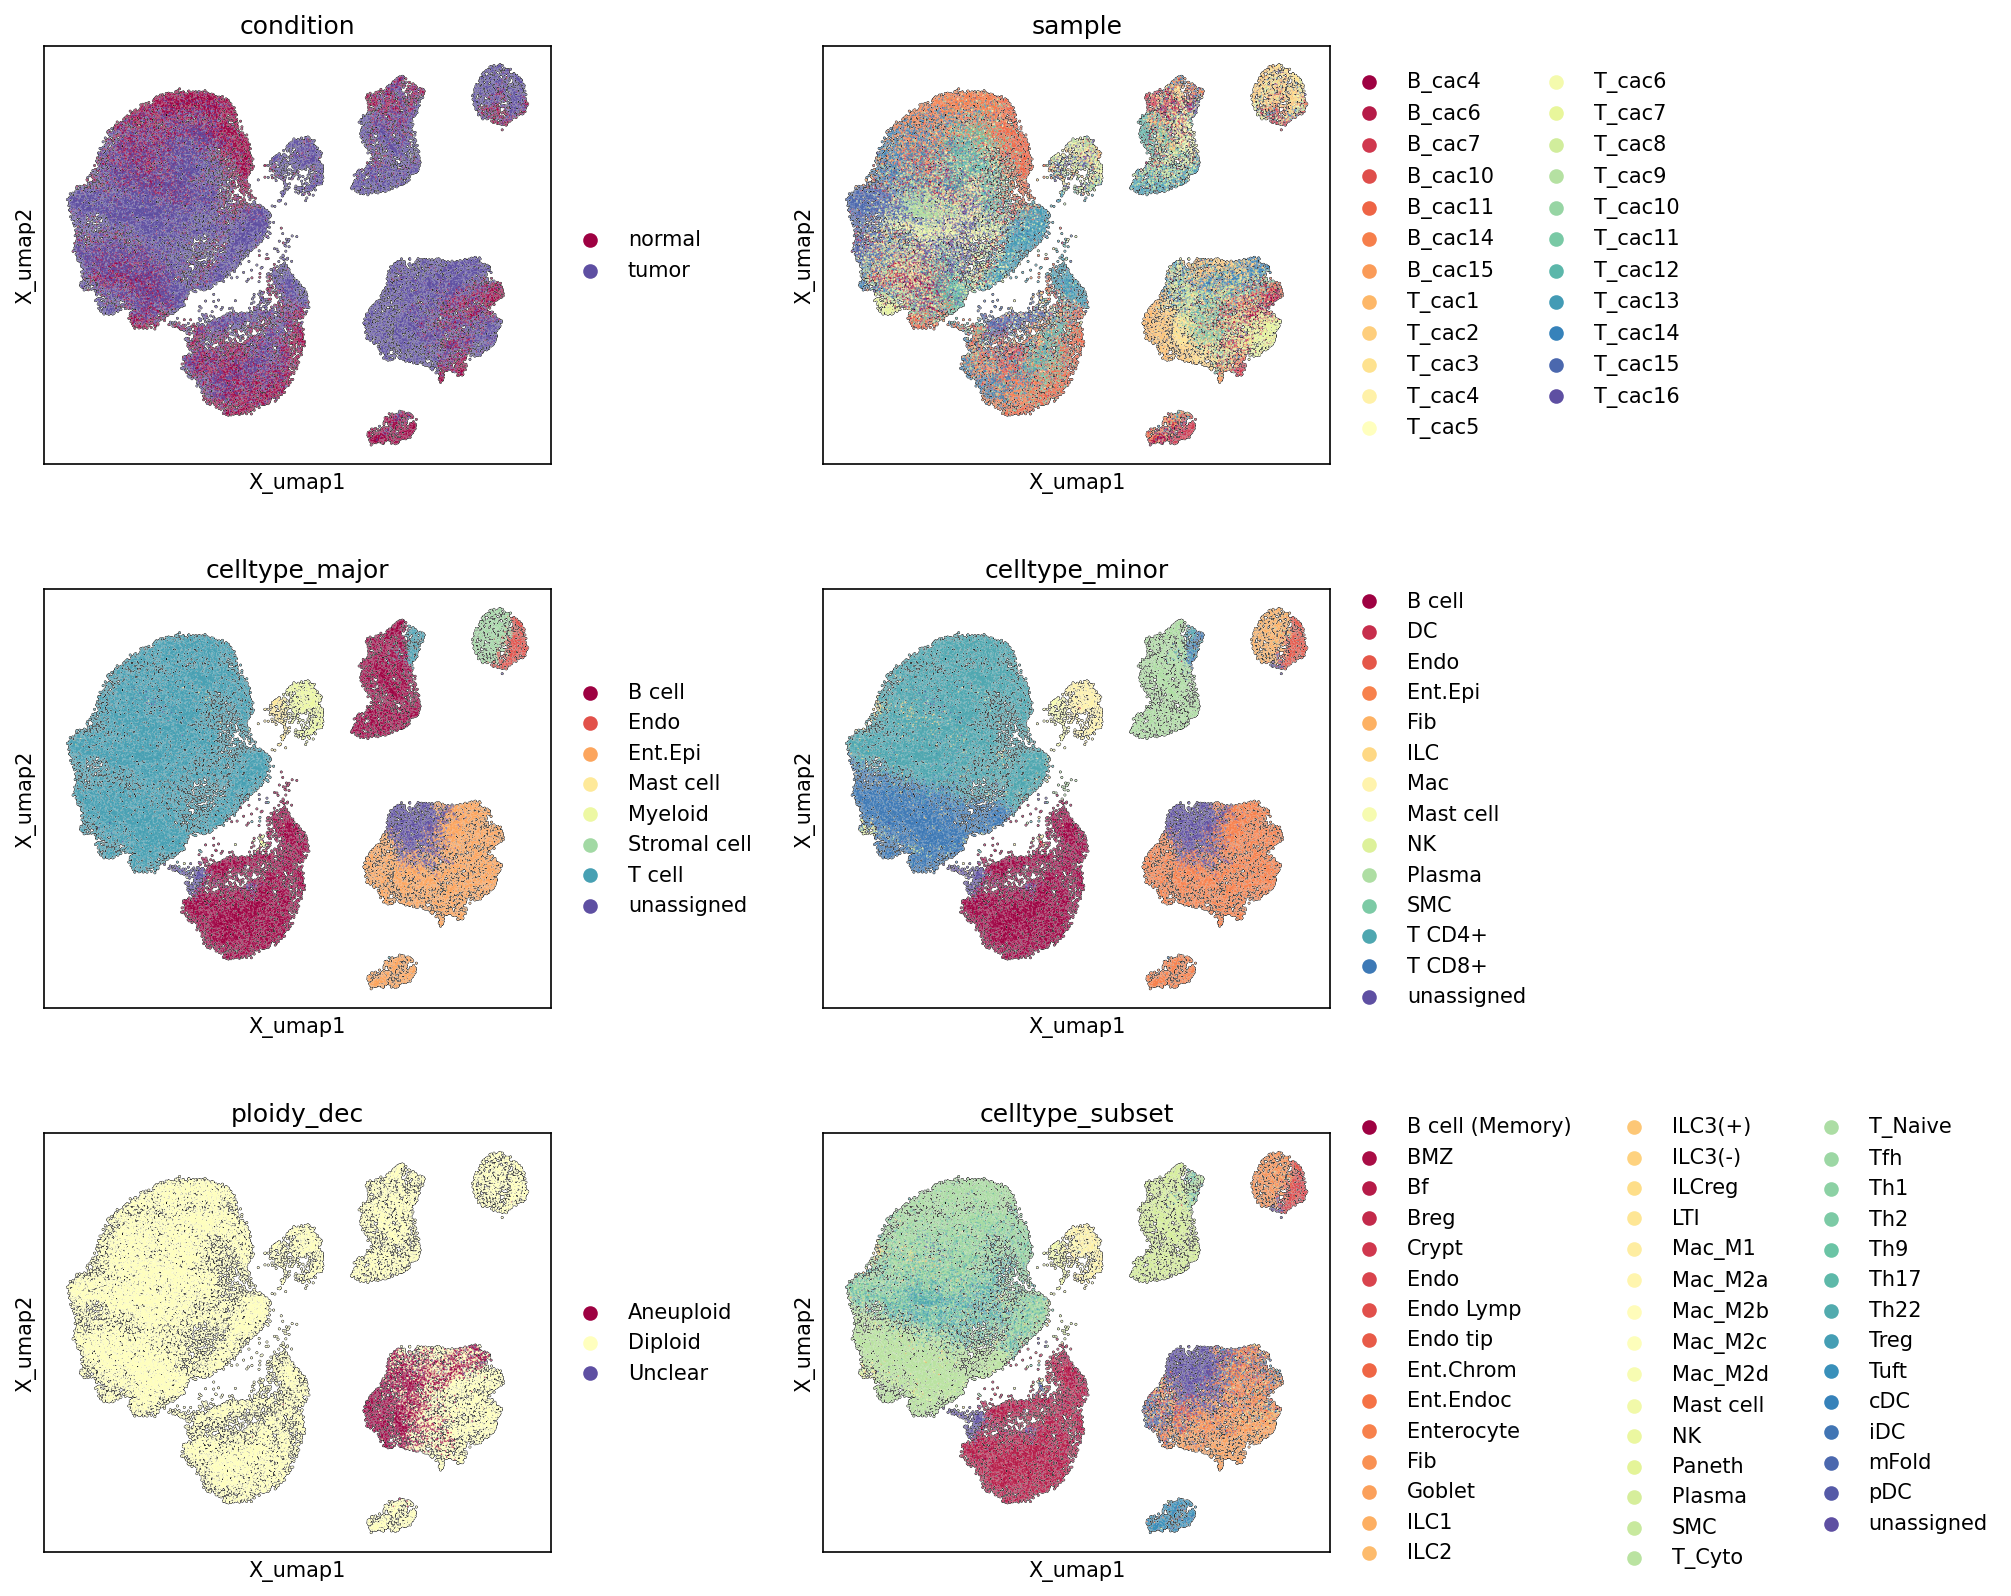
1. UMAP Visualization of Cellular Composition and Ploidy Status in Colon Tissue
[Analysis Visualization Results]...
Analysis Overview
This analysis presents Uniform Manifold Approximation and Projection (UMAP) plots generated from single-cell RNA-seq data, visualizing the distribution of cells based on various metadata annotations: condition (normal vs. tumor), sample origin, major cell type, minor cell type, ploidy status, and cell type subset. The primary goal is to provide an overview of the dataset's structure, cell type identities, and how conditions and ploidy status relate to the overall cellular landscape. Given the data context of colon tissue with normal and tumor conditions and identified aneuploidy, this visualization is crucial for understanding the cellular heterogeneity and identifying potential malignant populations.
Visual Summary
The UMAP plots reveal several distinct clusters and gradients, indicating diverse cell populations within the dataset.
- Condition: The UMAP colored by 'condition' shows a clear separation of cells, with one prominent cluster (bottom right) almost exclusively composed of 'tumor' cells. Other clusters, particularly the large one on the top-left, show a mixed population of 'normal' and 'tumor' cells, suggesting shared cellular components or infiltrating cells in the tumor microenvironment.
- Sample: The 'sample' UMAP indicates generally good integration of cells across different samples (B_cac and T_cac series). While there might be some minor sample-specific enrichments in smaller clusters, the major cell populations appear to be composed of cells from multiple samples, minimizing strong batch effects.
- Celltype_major: Distinct regions of the UMAP are occupied by different major cell types. The large tumor-enriched cluster (bottom right) is predominantly 'Intestinal Epithelial cell' (Ent.Epi). The largest cluster (top left) is primarily composed of 'T cell' populations, with 'Stromal cell' and 'Myeloid cell' forming other notable clusters. 'B cell' forms a relatively compact, distinct cluster.
- Celltype_minor: This view refines the major cell type assignments. For instance, the 'T cell' cluster is further resolved into 'T cell CD4+' and 'T cell CD8+'. 'Fibroblast' and 'Macrophage' populations are clearly visible as distinct clusters, further detailing the stromal and myeloid compartments.
- Ploidy_dec: This UMAP provides a critical insight. 'Aneuploid' cells (dark red) are almost entirely confined to the distinct cluster in the bottom right. Conversely, 'Diploid' cells (light yellow) are broadly distributed across all other clusters. This segregation strongly links aneuploidy to a specific cell population.
- Celltype_subset: This provides the most granular view of cell types. The aneuploid/tumor-enriched epithelial cluster contains various intestinal epithelial subsets such as 'Enterocyte', 'Goblet cell', 'Crypt cell', and 'Paneth cell'. The T cell cluster is resolved into subsets like 'T cell (Naive)', 'T cell (Th17)', 'T cell (Treg)', and 'T cell (Cytotoxic)'.
Biological Interpretation
The UMAP visualizations provide robust evidence for the cellular composition and structural organization of the colon single-cell RNA-seq dataset, particularly in the context of colon cancer.
- Identification of Malignant Epithelial Cells: The most striking finding is the clear spatial separation of 'Aneuploid' cells within the UMAP. These cells are almost exclusively found in a single, large cluster that also consists predominantly of 'Intestinal Epithelial cells' and is highly enriched for cells from 'tumor' conditions. This observation strongly supports the resolution of 'Intestinal Epithelial cell' as the tumor-origin cell type and confirms the presence of a distinct malignant epithelial cell population characterized by aneuploidy, a hallmark of cancer progression PubMed search: aneuploidy in colon cancer.
- Tumor Microenvironment Heterogeneity: While the malignant epithelial cells form a distinct cluster, other cell types, including various immune cells (T cells, B cells, Myeloid cells) and stromal cells (Fibroblasts, Endothelial cells), are observed in both 'normal' and 'tumor' conditions. Their mixed distribution in several UMAP clusters suggests the presence of an active tumor microenvironment (TME) PubMed search: tumor microenvironment colon cancer where immune and stromal cells interact with tumor cells. The distribution of these diploid cells across both normal and tumor areas highlights their potential roles in tumor progression or immune response.
- Comprehensive Cell Type Annotation: The hierarchical cell type annotations (major, minor, subset) are well-resolved across the UMAP, demonstrating the successful identification of diverse cell populations within the colon tissue. This detailed annotation forms a solid foundation for subsequent in-depth analyses, such as cell-cell interaction studies or differential gene expression.
Annotation Notes
The UMAP plots effectively visualize the underlying structure of the single-cell dataset and the quality of the cell type and ploidy annotations. The clear segregation of distinct cell populations, especially the highly specific clustering of aneuploid cells with tumor-derived epithelial cells, indicates a robust and biologically meaningful partitioning of the data. The presence of 'unassigned' cells is minimal and they do not form large, distinct clusters, suggesting good overall coverage and quality of the cell type annotations. The consistent clustering across multiple annotation levels (major, minor, subset) further supports the reliability of the cell type assignments.
2. Major Cell Type Score and Ploidy Visualization on UMAP
[Analysis Visualization Results]...
Analysis Overview
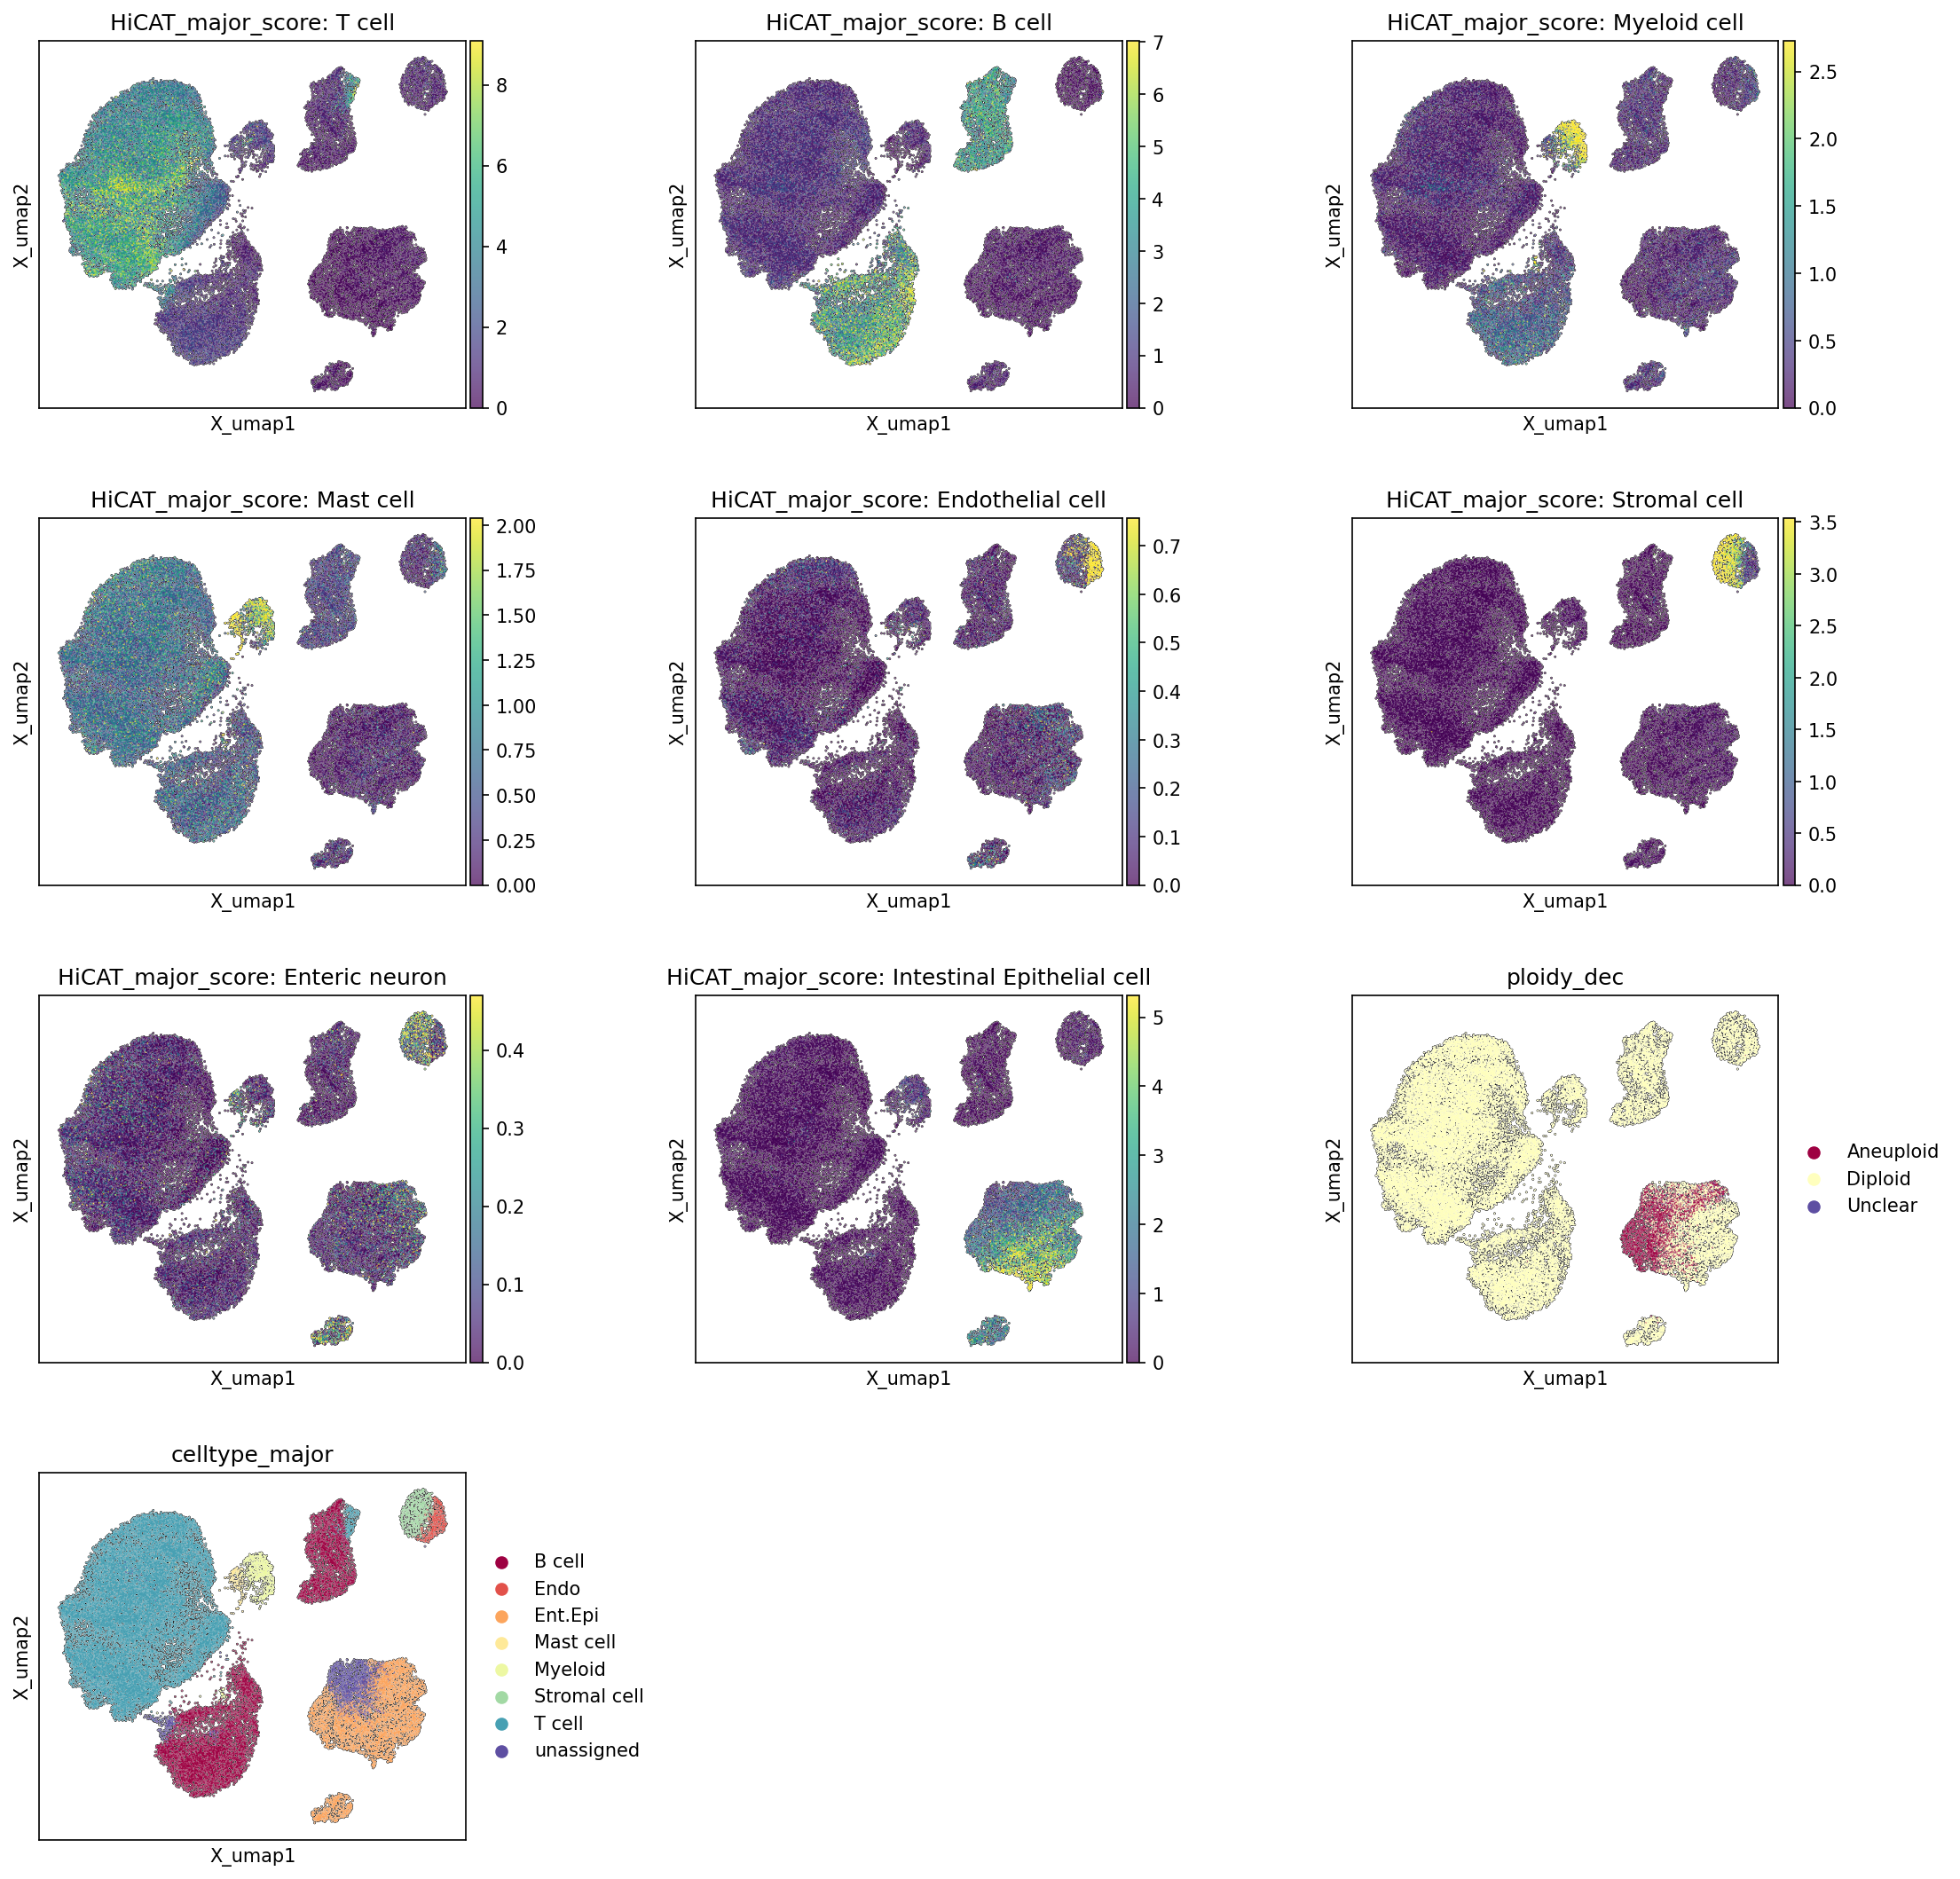
This analysis presents Uniform Manifold Approximation and Projection (UMAP) plots, visualizing the distribution of major cell types based on calculated scores (HiCAT_major_score) and pre-assigned categorical labels (celltype_major). Additionally, the ploidy status (ploidy_dec) of individual cells is overlaid on the UMAP embedding. This allows for a comprehensive assessment of cell type annotation consistency, the overall structure of the single-cell dataset, and the spatial relationship between different cell populations and ploidy states.
Visual Summary
The UMAP embedding displays multiple distinct clusters of cells, reflecting the heterogeneity of the colon tissue.
- HiCAT_major_score Plots: Each plot illustrates the enrichment score for a specific major cell type across the UMAP.
- T cell: High scores are concentrated in a large central-left cluster and a smaller cluster at the top-right, indicating distinct T cell populations.
- B cell: Strong signal is observed in a cluster at the top-middle and another smaller region on the right side of the embedding.
- Myeloid cell: High scores delineate a cluster in the top-right region of the UMAP.
- Mast cell: A discrete, small cluster at the very top of the UMAP shows high Mast cell scores.
- Endothelial cell: A well-defined cluster on the top-right side exhibits elevated Endothelial cell scores.
- Stromal cell: High scores are localized to a cluster on the far right of the UMAP.
- Enteric neuron: The scores for Enteric neurons are notably low across the entire UMAP (max score ~0.4), suggesting either a very sparse population or lack of a distinct, large cluster for this cell type at the major level in this dataset.
- Intestinal Epithelial cell: High scores are concentrated in a large cluster towards the bottom-right of the UMAP and another smaller cluster in the top-right.
- ploidy_dec Plot: This plot highlights the ploidy status of cells.
- The vast majority of cells are colored pale yellow, indicating a "Diploid" status.
- A significant population of "Aneuploid" cells (red) is clearly visible, primarily co-localizing with the large Intestinal Epithelial cell cluster in the bottom-right region of the UMAP. Scattered smaller groups of aneuploid cells are also observed.
- "Unclear" cells (dark blue) are very rare, consistent with the reported 0.1% for this category.
- celltype_major Plot: This plot displays the categorical major cell type annotations, confirming the distinct clustering of populations:
- The clusters for T cell, B cell, Myeloid cell, Mast cell, Endothelial cell (Endo), Stromal cell, and Intestinal Epithelial cell (Ent.Epi) align remarkably well with the regions of high scores observed in their respective HiCAT_major_score plots.
- The large bottom-right cluster primarily consists of Intestinal Epithelial cells, and the central-left cluster is predominantly T cells.
Biological Interpretation
The strong concordance between the HiCAT_major_score visualizations and the celltype_major categorical labels on the UMAP provides high confidence in the accuracy and robustness of the major cell type annotations within this single-cell RNA-seq dataset. Each major cell type forms distinct, well-separated clusters, indicating successful dimensionality reduction and cell type identification.
Crucially, the ploidy_dec plot reveals a striking co-localization of aneuploid cells predominantly within the large cluster identified as "Intestinal Epithelial cell." Given the data context indicating 'Colon' tissue, 'tumor' condition, and the resolution of 'Intestinal Epithelial cell' as the tumor-origin cell type, this finding strongly supports the identification of malignant epithelial cells. Aneuploidy is a hallmark of cancer, and its specific enrichment within the presumed tumor cell population (Intestinal Epithelial cells) confirms their cancerous nature. The remaining cell types, largely immune and stromal components of the tumor microenvironment, are predominantly diploid, as expected for non-transformed cells supporting the tumor. The minor populations of aneuploid cells outside the main Intestinal Epithelial cell cluster might warrant further investigation but appear to be a small fraction.
Annotation Notes
The consistency between the calculated major cell type scores and the assigned categorical cell type labels on the UMAP is excellent, validating the quality of the cell type annotations. The clear separation of cell populations in the embedding further reinforces the distinct biological identities captured by the single-cell data. The successful identification and localization of aneuploid cells to the inferred tumor cell population (Intestinal Epithelial cells) is a key strength of this annotation and analysis. The very low scores for "Enteric neuron" suggest that while these cells may be present in the colon, they do not form a major distinct cluster at the same hierarchical level as other immune and stromal cells in this dataset, or they are exceedingly rare.
3. Marker Expression Dot Plot for Cell Subsets
[Analysis Visualization Results]...
Analysis Overview
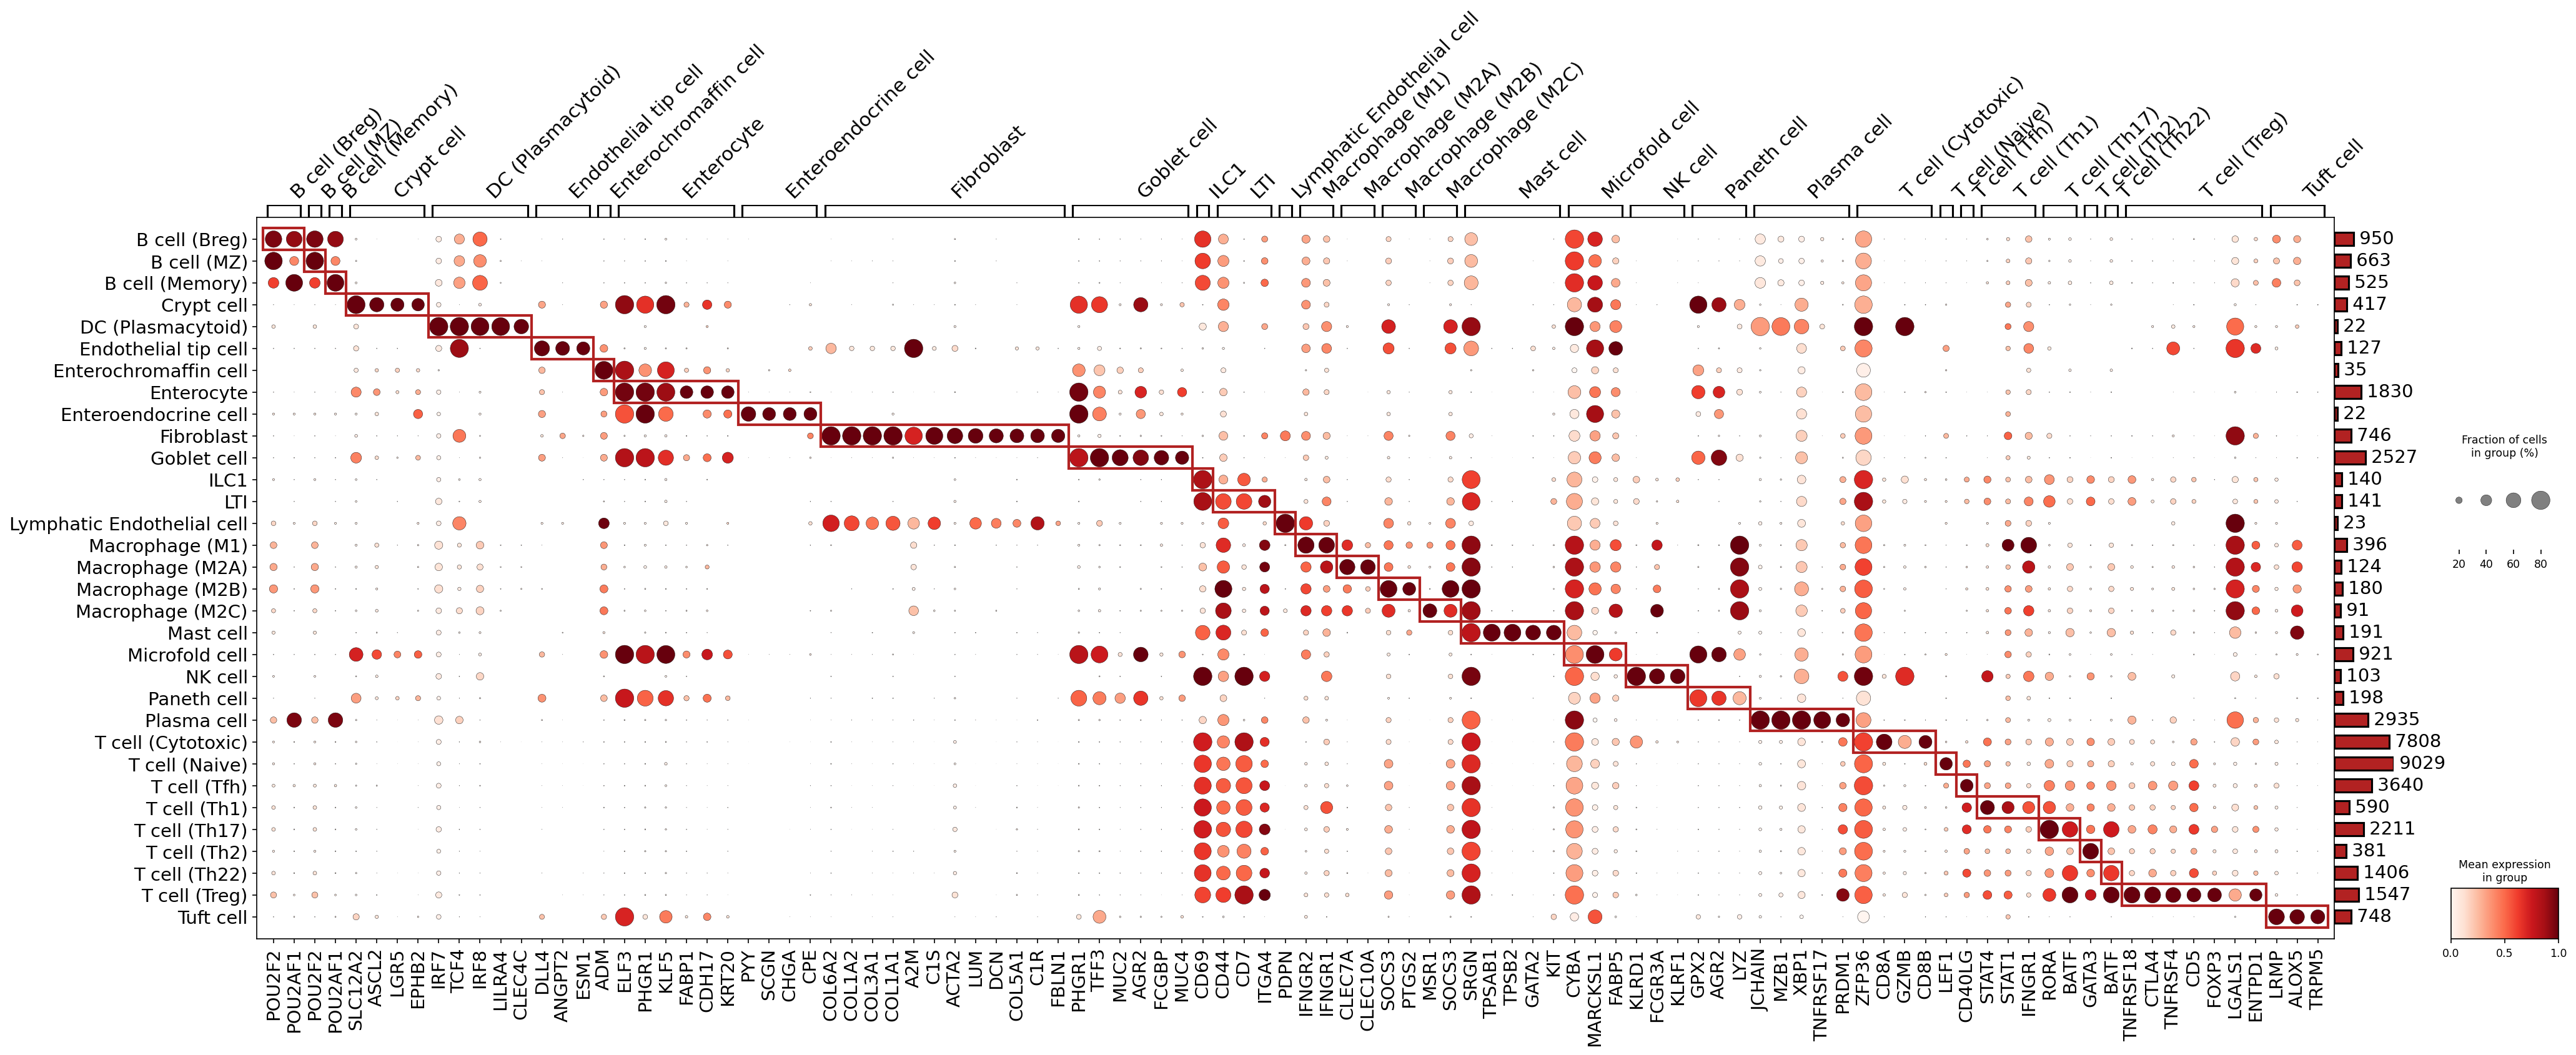
This analysis presents a dot plot illustrating the expression of selected marker genes across various celltype_subset populations identified within the single-cell RNA-seq dataset from Colon tissue. The primary goal of this visualization is to validate the assigned cell type annotations by examining the specificity and expression levels of known or computationally derived marker genes. The plot displays genes identified as surfaceome markers that are highly expressed and enriched within each cell type group.
Visual Summary
The dot plot effectively visualizes marker gene expression, with celltype_subset groups on the y-axis and marker genes on the x-axis. Each dot's size represents the fraction of cells within a group expressing the gene, while its color intensity indicates the mean expression level of that gene in the respective group.
- Specific Expression Patterns: A clear diagonal pattern is observed, with most celltype_subset groups showing strong and specific enrichment for a distinct set of marker genes (highlighted by red boxes). This indicates robust and well-defined transcriptional identities for many cell populations.
Key Cell Type Examples:
- B cell subsets (Breg, MZ, Memory) and Plasma cells: These groups exhibit clear B cell and plasma cell specific markers such as POU2AF2, POU2AF1 (B cells), and JCHAIN, MZB1, XBP1 (Plasma cells), confirming their identities.
- Intestinal Epithelial Cell Subsets: Specialized epithelial cells like Crypt cell (e.g., LGR5, EPHB2), Enterocyte (e.g., FABP1, KRT20), Goblet cell (e.g., MUC2, TFF3), Paneth cell (e.g., LYZ), Tuft cell (e.g., TRPM5, ALOX5), Enterochromaffin cell (e.g., CHGA, SCGN), and Enteroendocrine cell (e.g., PYY) show highly specific marker expression, supporting fine-grained annotation.
Immune Cell Subsets:
- T cell (Cytotoxic): Clearly marked by CD8A, CD8B, and GZMB.
- T cell (Treg): Defined by strong expression of FOXP3 and CTLA4.
- T cell (Naive): Characterized by LEF1 expression.
- T cell (Th1): Displays STAT1 and IFNGR1.
- T cell (Th17): Shows RORC expression.
- T cell (Th2): Marked by GATA3.
- NK cell: Expresses FCGR3A, KLRC1, KLRF1.
- Mast cell: Strong expression of KIT, TPSAB1, TPSB2.
- DC (Plasmacytoid): Shows specific IRF7 and IRF8 expression.
- Stromal and Endothelial Cells: Fibroblast cells are identified by collagen genes (COL3A1, COL1A1), DCN, and LUM. Endothelial tip cell and Lymphatic Endothelial cell are distinctly marked by ESM1.
- Minor Overlaps: While most markers are highly specific, some genes show expression in multiple related cell types, which is expected for genes involved in broader cellular processes or shared lineage markers. The rem_mkrs_common_in_N_groups_or_more=3 parameter ensures that highly ubiquitous markers are filtered out, contributing to the observed specificity.
Biological Interpretation
The strong diagonal pattern in the dot plot indicates that the celltype_subset annotations are well-supported by distinct marker gene expression. The identified markers are generally consistent with established biological knowledge of these cell types in the human colon:
- Intestinal Epithelial Lineage: The precise identification of Crypt cells, Enterocytes, Goblet cells, Paneth cells, Tuft cells, Enterochromaffin cells, and Enteroendocrine cells by specific markers reflects the complex cellular architecture and functional specialization of the intestinal epithelium. For example, LGR5 marks intestinal stem cells in crypts PubMed Search: LGR5 intestinal stem cells. MUC2 is a key mucin produced by goblet cells GeneCards: MUC2. LYZ (lysozyme) is a well-known antimicrobial peptide produced by Paneth cells GeneCards: LYZ. TRPM5 is a canonical marker for tuft cells GeneCards: TRPM5.
- Immune Cell Diversity: The distinct marker profiles for various T cell subsets (e.g., FOXP3 for Tregs GeneCards: FOXP3, GZMB for cytotoxic T cells GeneCards: GZMB), B cell populations, Mast cells (KIT GeneCards: KIT), and NK cells confirm the presence of a diverse immune microenvironment, crucial in both normal and tumor contexts.
- Stromal Compartment: Markers for Fibroblasts (e.g., collagens, DCN) and Endothelial cells (e.g., ESM1 GeneCards: ESM1) highlight the structural and vascular components of the colon tissue.
The surfaceome_only=True parameter in marker finding ensures that the identified markers are predominantly cell surface proteins, which are particularly valuable for cell identification, sorting, and potential therapeutic targeting.
Annotation Notes
Based on the marker expression dot plot, the celltype_subset annotations appear to be of high quality and resolution. The distinct and specific expression patterns for the vast majority of groups strongly support their assigned identities. The clear separation and consistent identification of both common and rare cell types using well-known marker genes indicate robust cell type clustering and annotation efforts. This robust annotation provides a strong foundation for subsequent analyses, especially in the context of Colon cancer where precise cell type identification is critical for understanding disease pathogenesis. No major discrepancies or highly ambiguous annotations are immediately apparent from this visualization.
4. Copy Number Variation (CNV) Analysis of Intestinal Epithelial Cells in Colon Cancer
[Analysis Visualization Results]...
Analysis Overview
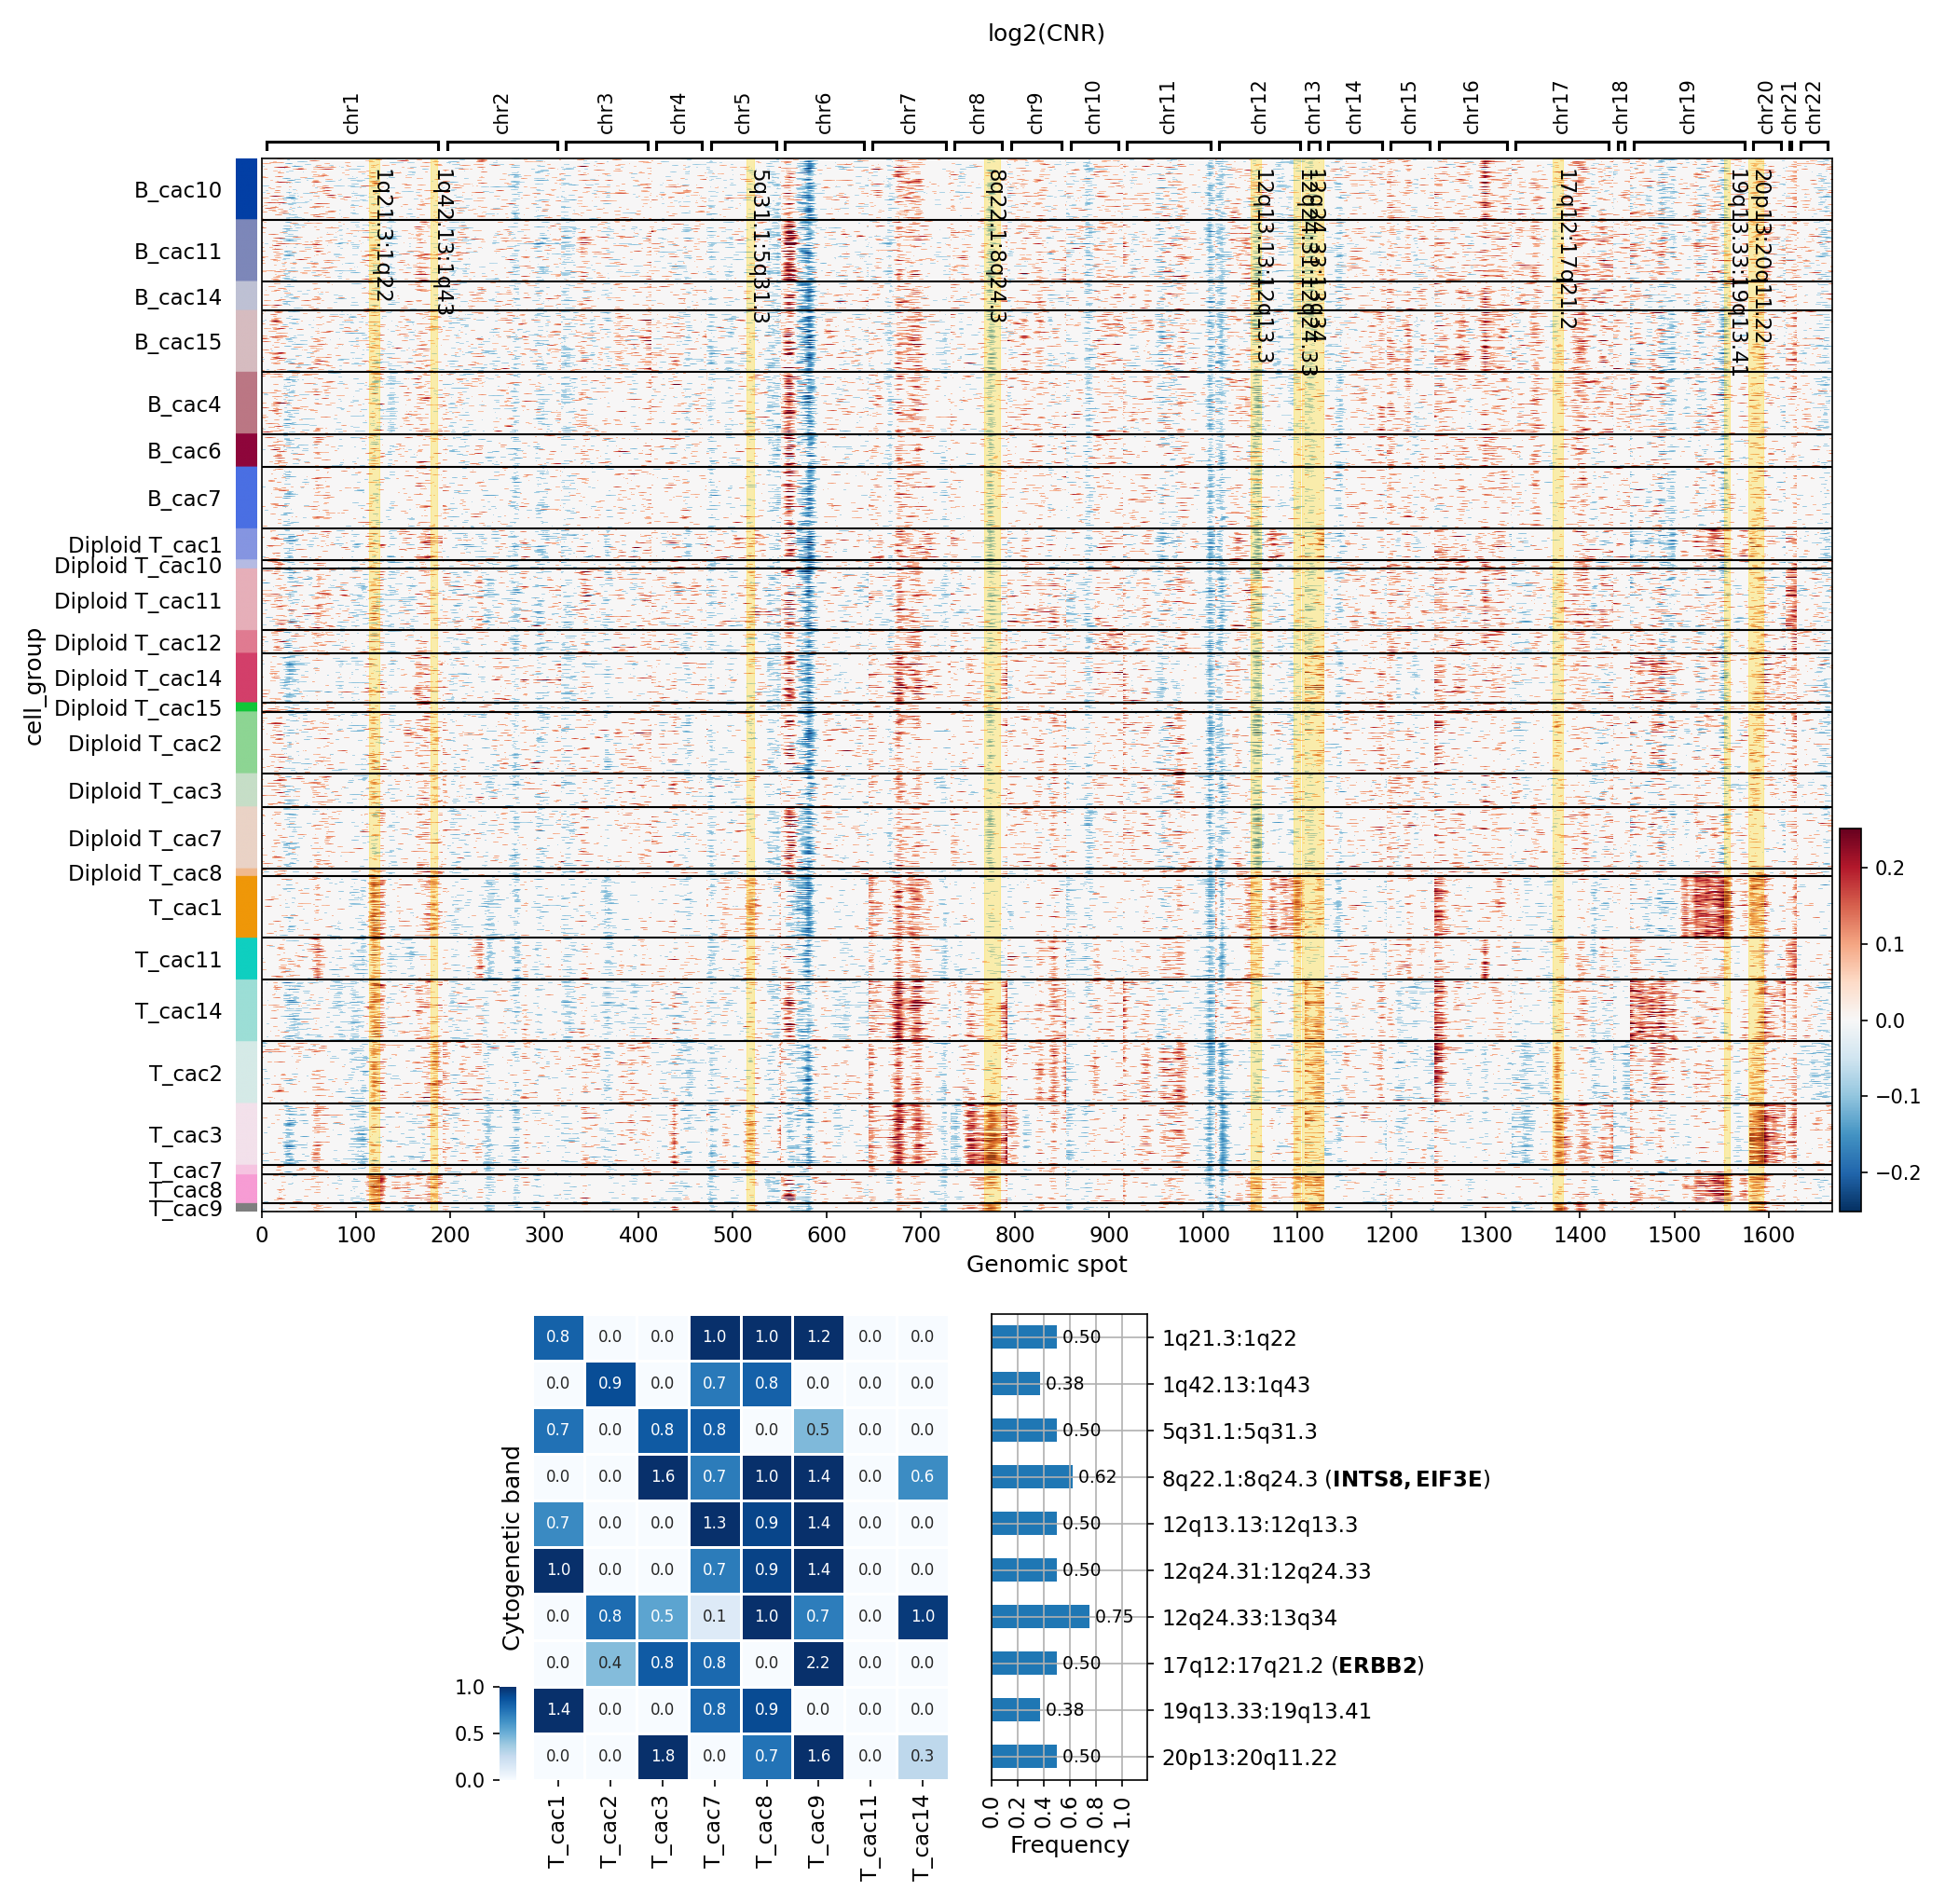
This analysis investigates copy number variations (CNVs) in Intestinal Epithelial cells, which have been identified as the tumor-origin cell type within the provided single-cell RNA-seq dataset from colon tissue. The plot_cnv_heatmap tool was used to visualize log2(CNR) values across genomic spots, grouped by sample, and to summarize recurrently amplified chromosomal regions. The aim is to identify genomic instability characteristic of cancer and specific amplified loci that may drive tumor progression in these cells.
Visual Summary
CNV Heatmap
The heatmap displays log2(CNR) values for Intestinal Epithelial cells, ordered by genomic spot on the x-axis and grouped by cell_group on the y-axis. Red indicates genomic amplification (gain), and blue indicates genomic deletion (loss).
- Differential CNV Patterns by Cell Group: A clear distinction in CNV patterns is observed across different cell_group types.
- The B_cac samples (top block) and Diploid T_cac samples (middle block) generally show a quiescent pattern, with log2(CNR) values close to zero, indicating minimal or no significant CNVs. This suggests that these cells, even if from tumor samples (Diploid T_cac), retain a diploid genomic state or are less affected by widespread genomic instability. B_cac samples likely represent normal or normal-adjacent epithelial cells.
- In contrast, the T_cac samples (bottom block, lacking the 'Diploid' prefix) exhibit extensive and pronounced CNV patterns, characterized by widespread amplifications (red) and deletions (blue). This strongly suggests that these T_cac groups represent the aneuploid, likely malignant, Intestinal Epithelial cell populations from the tumor samples.
- Recurrent Amplifications: Several regions across various chromosomes show consistent amplification (red signals) primarily within the T_cac cell groups. These include areas highlighted with cytogenetic bands such as 1q21.3:1q22, 1q42.13:1q43, 5q31.1:5q31.3, 8q22.1:8q24.3, 12q13.13:12q13.3, 12q24.31:12q24.33, 12q24.33:13q34, 17q12:17q21.2, 19p13.33:19q13.41, and 20p13:20q11.22.
Significantly Amplified Regions Summary
The accompanying summary plots provide a quantitative overview of significantly amplified regions:
- Per-Sample Gain Frequencies: The left subplot shows the frequency of gains for specific cytogenetic bands across individual T_cac samples. It highlights sample-specific heterogeneity, with T_cac1, T_cac3, T_cac8, and T_cac9 showing higher frequencies of gains across multiple bands compared to other T_cac samples (e.g., T_cac2, T_cac7). This indicates varying degrees of genomic instability or clonal evolution among different tumor samples.
- Overall Frequency of Amplification: The right subplot ranks the top 10 most frequently amplified cytogenetic bands across all Intestinal Epithelial cells within the analyzed groups. Key recurrent amplifications and their frequencies are:
12q24.33:13q34 (75% frequency)
- 8q22.1:8q24.3 (62% frequency), containing genes like INTS8 and EIF3E.
5q31.1:5q31.3 (50% frequency)
12q13.13:12q13.3 (50% frequency)
12q24.31:12q24.33 (50% frequency)
- 17q12:17q21.2 (50% frequency), notably harboring the ERBB2 gene.
20p13:20q11.22 (50% frequency)
1q21.3:1q22 (50% frequency)
1q42.13:1q43 (38% frequency)
19p13.33:19q13.41 (38% frequency)
Biological Interpretation
The CNV analysis confirms widespread genomic instability in a subset of Intestinal Epithelial cells from tumor samples (T_cac groups), consistent with their role as the resolved tumor-origin cell type in colon cancer. The Diploid T_cac groups, despite originating from tumor samples, exhibit minimal CNVs, suggesting they may represent non-malignant epithelial cells within the tumor microenvironment or a diploid subpopulation that has not yet undergone extensive genomic alterations. The distinct CNV patterns between Diploid T_cac and T_cac populations highlight the genomic heterogeneity often observed within tumors.
Several amplified regions are of particular biological interest:
- Amplification of 17q12:17q21.2 containing ERBB2: The ERBB2 gene (also known as HER2) is a well-established oncogene whose amplification and overexpression drive tumor growth in various cancers, including a subset of colorectal cancers. Its high frequency (50%) in the T_cac cells suggests it could be a significant driver in these colon cancer samples. GeneCards: ERBB2
Amplification of 8q22.1:8q24.3 containing INTS8 and EIF3E
- INTS8 (Integrator Complex Subunit 8) is a component of the Integrator complex, involved in RNA polymerase II-mediated transcription and small nuclear RNA (snRNA) processing. Emerging evidence suggests roles for Integrator complex components in cancer development and progression. GeneCards: INTS8
- EIF3E (Eukaryotic Translation Initiation Factor 3 Subunit E) is part of the eukaryotic translation initiation factor 3 complex, which plays a critical role in the initiation of protein synthesis. Dysregulation of protein synthesis machinery, including EIF3 subunits, is frequently observed in cancer and contributes to oncogenic transformation. GeneCards: EIF3E
- The high frequency of these amplifications, particularly 12q24.33:13q34 and 8q22.1:8q24.3, indicates recurrent genomic events that may confer selective advantages to tumor cells in colon cancer.
Clinical or Translational Implications
The identification of recurrent genomic amplifications, especially those involving known oncogenes like ERBB2, has significant clinical implications for colon cancer:
- Biomarker for Targeted Therapy: ERBB2 amplification is a predictive biomarker for targeted therapies (e.g., trastuzumab, pertuzumab) in other cancers (e.g., breast, gastric). While ERBB2-targeted therapies are not standard in all colon cancer settings, they are being investigated and show efficacy in a subset of ERBB2-amplified metastatic colorectal cancers. PubMed search: ERBB2 amplification colorectal cancer targeted therapy
- Prognostic Indicator: The presence and extent of these CNVs, particularly ERBB2 amplification, could serve as prognostic indicators for disease aggressiveness or patient outcomes.
- Drug Target Discovery: Genes within the frequently amplified regions (e.g., INTS8, EIF3E) warrant further investigation as potential novel therapeutic targets, especially if they are found to be functionally important for tumor cell survival and proliferation in colon cancer.
- Tumor Heterogeneity: The observed inter-sample heterogeneity in CNV patterns highlights the need for personalized diagnostic and therapeutic approaches. Not all tumors, even within the T_cac group, harbor the same driver amplifications.
5. CNV-based UMAPs for Cell Type, Ploidy, Condition, and Sample Distribution
[Analysis Visualization Results]...
Analysis Overview
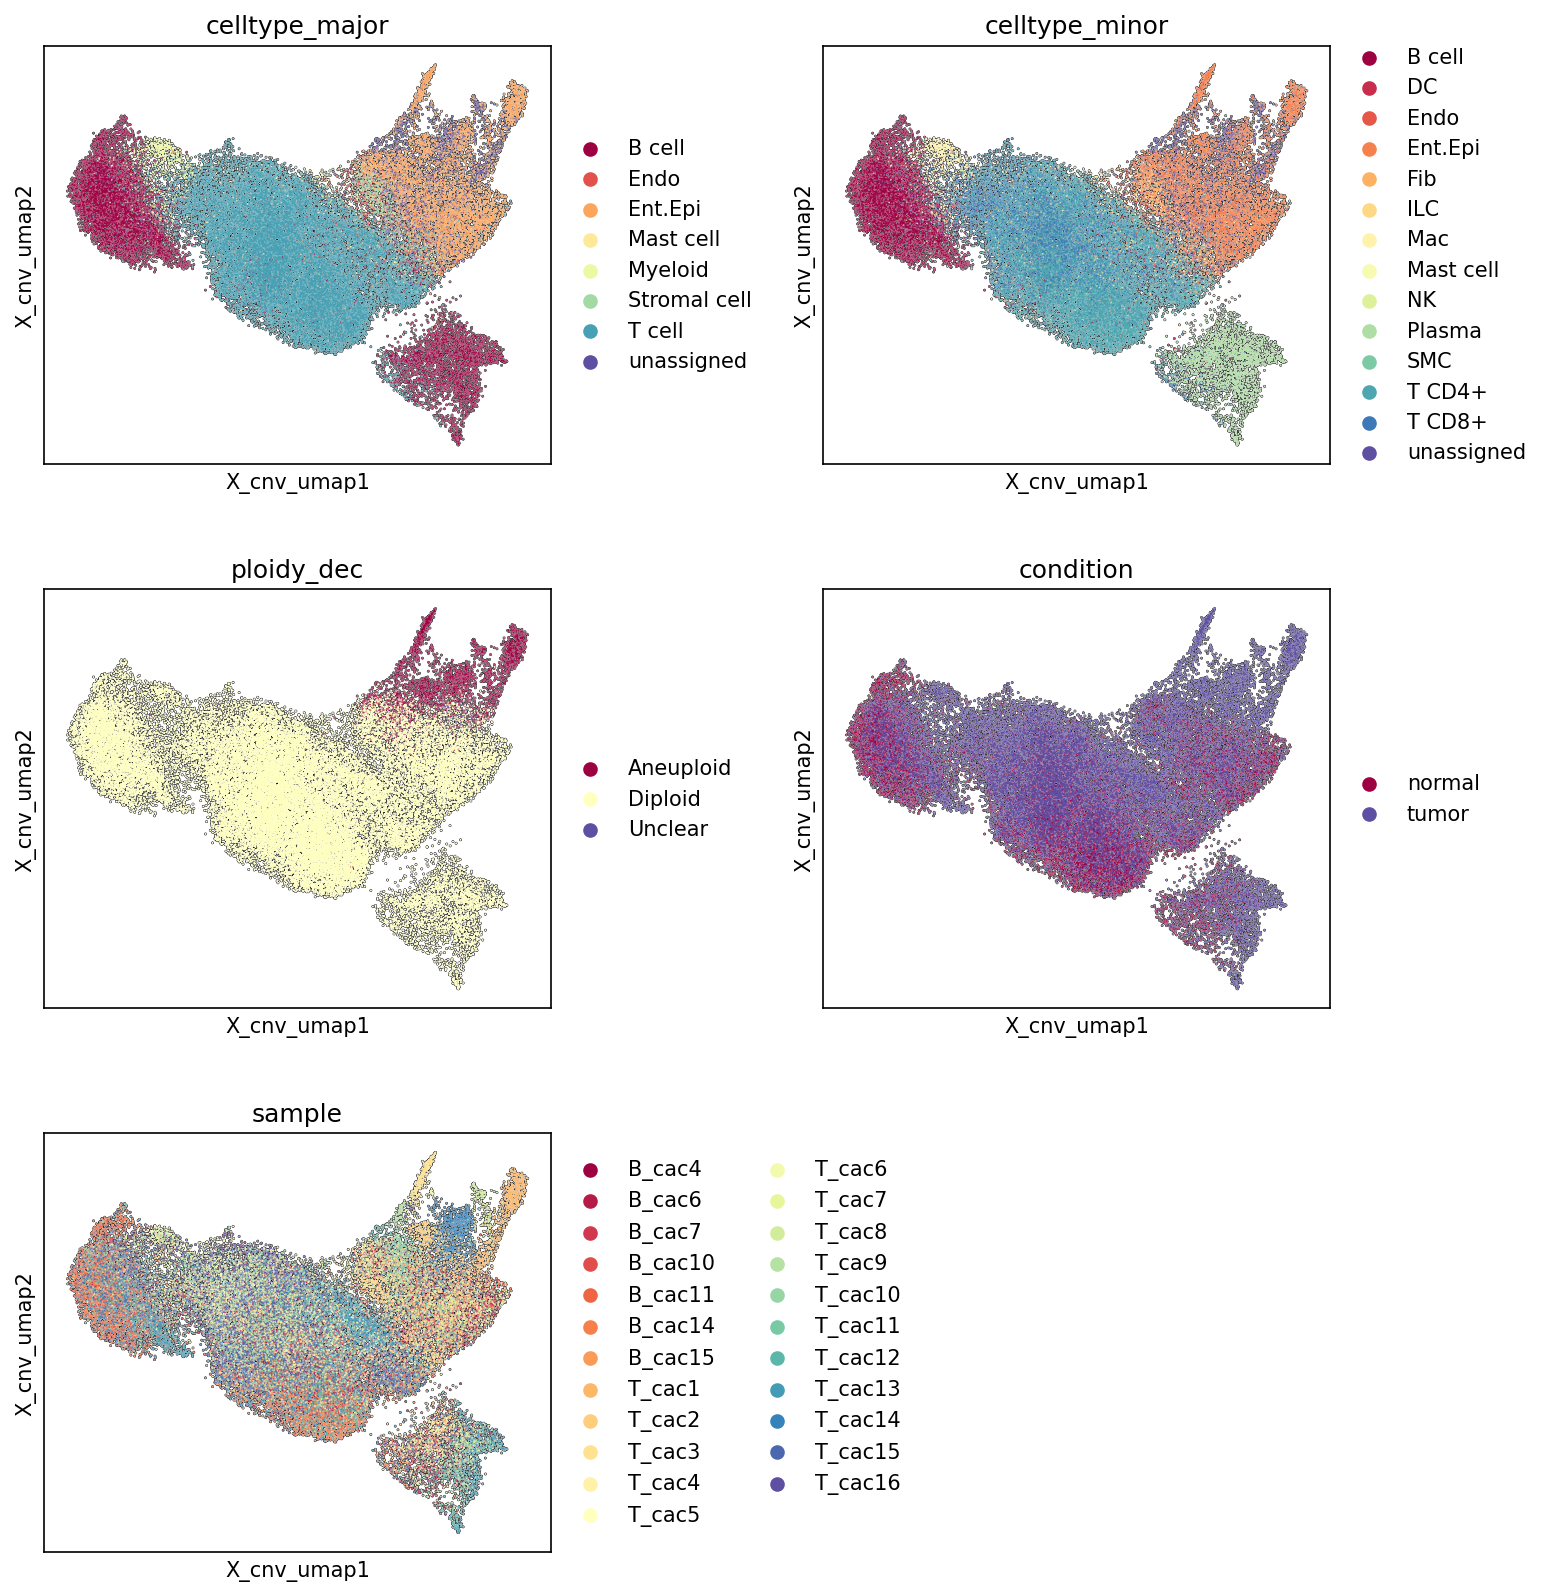
This analysis presents UMAP (Uniform Manifold Approximation and Projection) plots generated using copy number variation (CNV) patterns from single-cell RNA-seq data. The UMAPs visualize the cellular landscape colored by major cell type, minor cell type, ploidy status, experimental condition (normal vs. tumor), and individual sample. The primary goal is to assess the distribution and relationships of cell populations based on their underlying CNV profiles, particularly in the context of the inferred colon cancer.
Visual Summary
UMAP colored by celltype_major
The UMAP displays distinct clustering of major cell types based on their CNV profiles. Intestinal Epithelial cells (Ent.Epi) form a prominent, somewhat elongated cluster spanning the central and right-hand side of the embedding. T cells and B cells primarily occupy the left and upper-left regions, forming separate but adjacent clusters. Stromal cells and Myeloid cells also resolve into distinct, though somewhat more diffuse, areas within the embedding. Unassigned cells are broadly distributed.
UMAP colored by celltype_minor
At the minor cell type resolution, the overall structure largely aligns with the major cell types, demonstrating the robustness of the clustering. Intestinal Epithelial cells remain a cohesive group. T cell CD4+ and T cell CD8+ populations show clear separation while maintaining proximity. Similarly, distinct clusters are observed for B cells and Plasma cells. Macrophages and Dendritic cells, as minor myeloid subtypes, also exhibit their own specific distributions within the broader myeloid region.
UMAP colored by ploidy_dec
This UMAP reveals a striking and highly informative separation based on ploidy status. A distinct, dense cluster of Aneuploid cells (dark red) is clearly localized to the upper-right portion of the UMAP. The vast majority of cells are labeled Diploid (yellow) and occupy the remaining, more extensive regions of the embedding. A very small number of "Unclear" cells (purple) are scattered. This strong segregation indicates that CNV patterns are highly effective at distinguishing cells by their ploidy.
UMAP colored by condition
The UMAP colored by experimental condition shows a clear association with the ploidy status. Cells from the 'tumor' condition (dark purple) predominantly co-localize with the Aneuploid cluster in the upper-right region of the UMAP. Conversely, cells from the 'normal' condition (dark red) are mainly distributed across the regions dominated by Diploid cells. This strong correlation between 'tumor' condition and 'Aneuploid' status is a key observation.
UMAP colored by sample
The distribution across individual samples (B_cac4-15 and T_cac1-16) shows that both the diploid and aneuploid regions are populated by cells from multiple samples. While there is a general mixing, suggesting some shared underlying CNV patterns, some regional enrichments by specific samples are also visible. The distinct aneuploid cluster contains cells from various 'B_cac' and 'T_cac' samples, indicating shared malignant characteristics across different patients' tumor cells.
Biological Interpretation
The UMAPs provide critical insights into the cellular heterogeneity and the molecular basis of cell identity, particularly in the context of colon cancer.
- Identification of Malignant Cells: The most prominent finding is the clear separation of Aneuploid cells from Diploid cells based on CNV patterns. This aneuploid cluster strongly correlates with cells from the 'tumor' condition. Given that the 'tumor-origin cell type' was resolved as 'Intestinal Epithelial cell', and the inferred disease is colon cancer, it is highly probable that this distinct aneuploid cluster represents the malignant colon epithelial cell population. This demonstrates the power of CNV analysis in identifying tumor cells within a complex single-cell dataset.
- Tumor Microenvironment (TME) Composition: The diploid regions of the UMAP are populated by a diverse array of non-malignant cells, including various immune subsets (T cells, B cells, Myeloid cells, ILCs, Plasma cells, NK cells) and stromal components (Fibroblasts, Endothelial cells, Smooth muscle cells). These cells constitute the tumor microenvironment (TME) in tumor samples and healthy tissue components in normal samples. Their distribution relative to the malignant cluster on the CNV UMAP suggests that non-malignant cells, while generally diploid, maintain distinct CNV profiles that allow for their segregation into expected cell type clusters.
- Robustness of Annotations: The strong alignment between ploidy status and condition, along with the consistent clustering of major and minor cell types, validates the quality of the cell type annotations and the reliability of the ploidy and condition assignments. The CNV-based UMAP serves as a robust quality control and visualization tool for these critical metadata points.
- Inter-sample Consistency and Heterogeneity: The observation that aneuploid cells from different tumor samples co-cluster suggests a commonality in the gross CNV profiles driving the malignant phenotype across patients. However, the fine-grained distribution of individual samples within the UMAP also hints at inter-patient heterogeneity in more subtle CNV patterns or cellular composition.
Annotation Notes
The UMAP plots provide strong visual validation for the current cell type annotations, ploidy calls, and condition assignments. The clear distinction between aneuploid tumor cells and diploid non-malignant cells based purely on CNV features confirms the utility of CNV estimation for identifying tumor-derived cells. The consistency observed between major and minor cell type clustering further strengthens the confidence in the cell identity assignments.
6. Minor Cell Type Population Analysis Across Normal and Tumor Colon Samples
[Analysis Visualization Results]...
Analysis Overview
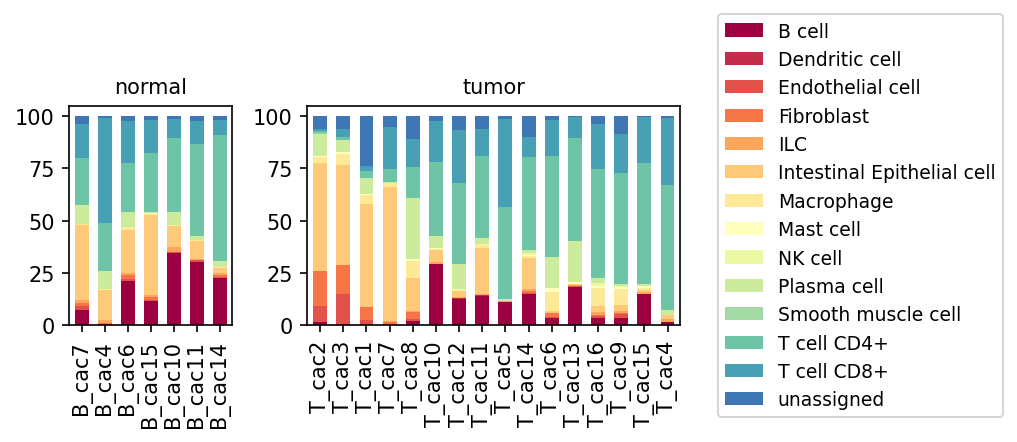
This analysis presents a population bar plot illustrating the relative proportions of different minor cell types within individual samples, grouped by physiological condition (normal vs. tumor). The plot was generated using the plot_celltype_population tool, with cell types classified at the 'minor' taxonomic level. This visualization provides an initial overview of cellular composition differences between healthy colon tissue and colon tumor tissue, offering insights into shifts in the tumor microenvironment.
Visual Summary
The bar plot displays the fractional composition of celltype_minor for each sample, normalized to 100%.
- Normal Samples: These samples generally show a relatively stable cellular composition. Intestinal Epithelial cell (light orange), T cell CD4+ (light teal), and T cell CD8+ (dark teal) are consistently dominant components, often accounting for a significant majority of cells. B cell (dark red) and Plasma cell (light green) are present in varying but generally smaller proportions. Other cell types such as Fibroblast, Endothelial cell, Macrophage, Dendritic cell, Mast cell, NK cell, Smooth muscle cell, and ILC are present at lower frequencies or are less uniformly distributed across normal samples.
- Tumor Samples: In contrast to normal samples, tumor samples exhibit considerably more variability and distinct shifts in cell type proportions:
- Increased Stromal and Myeloid Components: There is a notable and consistent increase in the proportion of Fibroblast (orange) and Endothelial cell (red-orange) populations across most tumor samples compared to normal. Macrophage (yellow) populations also appear to be generally elevated in tumor samples.
- Variable Epithelial and Immune Infiltration: The proportion of Intestinal Epithelial cell (light orange) is highly variable in tumor samples, ranging from dominant in some (e.g., T_cac2, T_cac3, T_cac7) to significantly reduced in others. Immune cell populations, including T cell CD4+ and T cell CD8+, show high inter-sample variability in tumor conditions; some tumors are rich in these T cells, while others have lower proportions. B cell and Plasma cell also show variable, but sometimes increased, presence.
- unassigned Cells: The proportion of unassigned cells (dark blue) remains relatively low but consistent across both normal and tumor conditions.
Biological Interpretation
The observed shifts in cell type populations strongly align with the inferred context of Colon cancer and the remodeling of the tumor microenvironment (TME).
- Tumor Cell Dominance and Variability: The Intestinal Epithelial cell is identified as the tumor-origin cell type. The high variability in its proportion in tumor samples can reflect several aspects:
- In some samples, a high proportion might represent a high density of malignant epithelial cells.
- In other samples, a reduced proportion could indicate extensive infiltration by stromal and immune cells, or a less epithelial-rich region of the tumor being sampled. The aneuploid status of 6.1% of cells in the dataset further supports the presence of malignant cells.
- Stromal Remodeling and Angiogenesis: The consistent increase in Fibroblast populations in tumor samples is a hallmark of cancer-associated fibroblasts (CAFs). CAFs play crucial roles in TME remodeling, promoting tumor growth, angiogenesis, and immune evasion [PubMed: 32327710]. Similarly, the increase in Endothelial cell populations is indicative of active angiogenesis, a process essential for tumor nutrient supply and growth [PubMed: 10660424].
- Immune Landscape in the TME: The changes in immune cell proportions suggest a complex immune response within the colon tumor microenvironment.
- The general increase in Macrophage populations is consistent with the recruitment and differentiation of tumor-associated macrophages (TAMs). TAMs are often polarized towards pro-tumorigenic phenotypes (e.g., M2-like), contributing to immune suppression, angiogenesis, and metastasis [PubMed: 29773784].
- The variable proportions of T cell CD4+ and T cell CD8+ highlight the heterogeneity of immune infiltration in colon cancer. Some tumors may be "immune-hot" with abundant T cell infiltration, while others are "immune-cold." CD8+ T cells are key anti-tumor effectors, but their function can be suppressed in the TME. CD4+ T cells encompass various subsets with pro- or anti-tumor roles [PubMed: 33262657].
- The variable presence of B cell and Plasma cell populations also suggests diverse humoral immune responses, which can have complex roles in anti-tumor immunity or contribute to immune suppression [PubMed: 32296068].
Clinical or Translational Implications
The distinct cellular composition differences between normal and tumor colon samples, particularly the expansion of Fibroblast, Endothelial cell, and Macrophage populations, provide potential clinical insights:
- Biomarkers for Diagnosis/Prognosis: The relative abundance of certain cell types (e.g., high CAF or TAM density) could serve as prognostic markers for disease progression or recurrence in colon cancer patients.
- Therapeutic Targets: The increased prevalence of CAFs and endothelial cells points to the importance of the stromal compartment and angiogenesis in colon cancer progression. Therapies targeting CAFs or anti-angiogenic agents could be relevant therapeutic strategies. Similarly, targeting TAMs to reprogram them from pro-tumorigenic to anti-tumorigenic states is an active area of research.
- Immunotherapy Considerations: The variability in T cell infiltration underscores the heterogeneous immune landscape of colon tumors. This heterogeneity likely influences responsiveness to immunotherapies (e.g., checkpoint inhibitors). Stratifying patients based on their immune cell composition could help predict treatment response.
7. T Cell Subset Population Analysis in Normal and Colon Tumor Samples
[Analysis Visualization Results]...
Analysis Overview
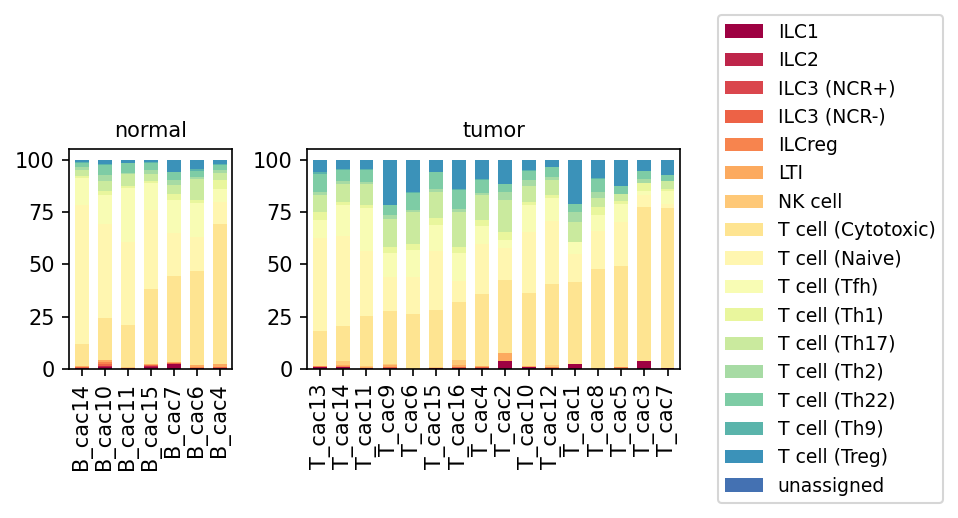
This analysis presents a population bar plot illustrating the relative proportions of various T cell and innate lymphoid cell (ILC) subsets within individual samples, comparing normal colon tissue to colon tumor tissue. The plot normalizes the cell subset counts to 100% within the major "T cell" population for each sample, providing a clear visual representation of compositional shifts between conditions. The goal is to identify differences in the immune cell landscape that may be associated with colon tumorigenesis.
Visual Summary
The stacked bar plots display the relative proportions of T cell and ILC subsets across individual normal (B_cac samples) and tumor (T_cac samples) samples.
- Dominant Subsets in Normal Samples: Normal samples are predominantly composed of T cell (Cytotoxic) and T cell (Naive) populations, which together constitute a large majority of the total T cell population. Other T helper subsets like T cell (Th1), T cell (Th17), and T cell (Tfh) are present in smaller proportions. T cell (Treg) populations are consistently present but make up a relatively minor fraction. ILCs (ILC1, ILC2, ILC3 (NCR+), ILC3 (NCR-), ILCreg, LTI) and NK cells are generally very sparse or absent.
- Shifts in Tumor Samples: Compared to normal samples, tumor samples exhibit notable alterations in T cell subset composition:
- Increased T cell (Treg) Proportions: A striking and consistent observation in tumor samples is the substantial increase in the relative proportion of T cell (Treg) cells (dark blue segments) across nearly all tumor samples. This subset becomes a much more prominent component compared to its representation in normal tissue.
- Reduced T cell (Naive) Proportions: There appears to be a general decrease in the relative proportion of T cell (Naive) cells (pale yellow segments) in tumor samples compared to normal samples.
- Variability in T cell (Cytotoxic) and T helper Subsets: While T cell (Cytotoxic) cells remain a significant component, their relative proportion appears more variable across tumor samples, and in some instances, visually reduced compared to their dominant presence in normal tissue. Other T helper subsets (Th1, Th17, Th2, Th22, Th9, Tfh) show variable representation, with no single consistent trend of increase or decrease across all tumor samples.
- Minor ILC/NK cell Presence: ILCs and NK cells largely remain minor components in tumor samples, similar to normal tissues, although slight increases in some samples are observed for ILC1/ILC2.
Biological Interpretation
The observed shifts in T cell subset populations provide significant biological insights into the immune microenvironment in colon cancer.
- Immune Evasion via Regulatory T Cells: The most prominent finding is the enrichment of T cell (Treg) populations in the tumor microenvironment (TME) of colon cancer. Tregs are crucial suppressors of immune responses, and their elevated presence in tumors is a well-established mechanism by which cancer cells evade anti-tumor immunity. These cells can inhibit the proliferation and function of effector T cells, such as cytotoxic T cells, thereby promoting tumor growth and progression [1].
- Impaired Anti-tumor Immunity: The relative reduction in T cell (Naive) populations in tumor samples suggests an active immune response or cell differentiation occurring, but potentially skewed towards immunosuppressive phenotypes. A relative decrease or variable presence of T cell (Cytotoxic) populations, coupled with an increase in Tregs, points towards an unfavorable effector-to-regulatory T cell balance, which is often associated with a suppressed anti-tumor immune response.
- Dynamics of Helper T Cells: The variable patterns observed for T helper subsets (Th1, Th17, Th2, Tfh) indicate a complex and heterogeneous adaptive immune response within the TME. While Th1 cells are generally associated with anti-tumor immunity, other subsets like Th17 can have context-dependent roles, either promoting or inhibiting tumor growth [2]. The lack of a consistent strong pattern for these subsets, in contrast to the clear Treg enrichment, suggests their contributions might be more heterogeneous across individual tumors.
- Role of ILCs and NK Cells: The relatively minor and stable proportions of ILCs and NK cells indicate that while they are present, their proportional shifts are not as pronounced as those of T cell subsets in this dataset. These innate immune cells contribute to early anti-tumor surveillance, but their overall contribution to the total 'T cell' major population in this specific analysis appears limited in terms of population change.
Clinical or Translational Implications
The findings have several important clinical and translational implications for colon cancer:
- Prognostic Biomarker: The high infiltration of Tregs in colon tumors is often correlated with poorer prognosis in various cancers, including colorectal cancer [3]. The observed increase in Tregs could serve as a potential prognostic biomarker, identifying patients who may have a more aggressive disease course.
- Immunotherapy Target: Given their role in immune suppression, Tregs are a key target for cancer immunotherapy. Strategies aimed at depleting Tregs, inhibiting their function, or altering their phenotype (e.g., using specific antibodies or small molecules) could potentially enhance the efficacy of other immunotherapeutic approaches, such as checkpoint blockade [4].
- Predictor of Immunotherapy Response: The immune cell composition, particularly the balance between effector and regulatory T cells, is a crucial determinant of response to immunotherapies. Tumors with a high Treg-to-effector T cell ratio might be less responsive to immunotherapies that primarily aim to boost effector T cell function, suggesting the need for combination therapies.
- Immune Microenvironment Characterization: This analysis highlights the importance of comprehensively characterizing the immune cell landscape within the tumor to understand disease progression and guide personalized treatment strategies. Monitoring these T cell subset shifts could be valuable in assessing treatment efficacy or disease recurrence.
---
References
- Treg function in cancer:
PubMed Search: "Tregs immune evasion cancer"
- Th17 cells in cancer:
PubMed Search: "Th17 cancer context dependent"
- Tregs as prognostic markers in CRC:
PubMed Search: "Tregs colorectal cancer prognosis"
- Treg targeting in cancer therapy:
PubMed Search: "Treg depletion cancer immunotherapy"
8. Differential Abundance of T cell and Immune Cell Subsets in Colon Cancer
[Analysis Visualization Results]...
Analysis Overview
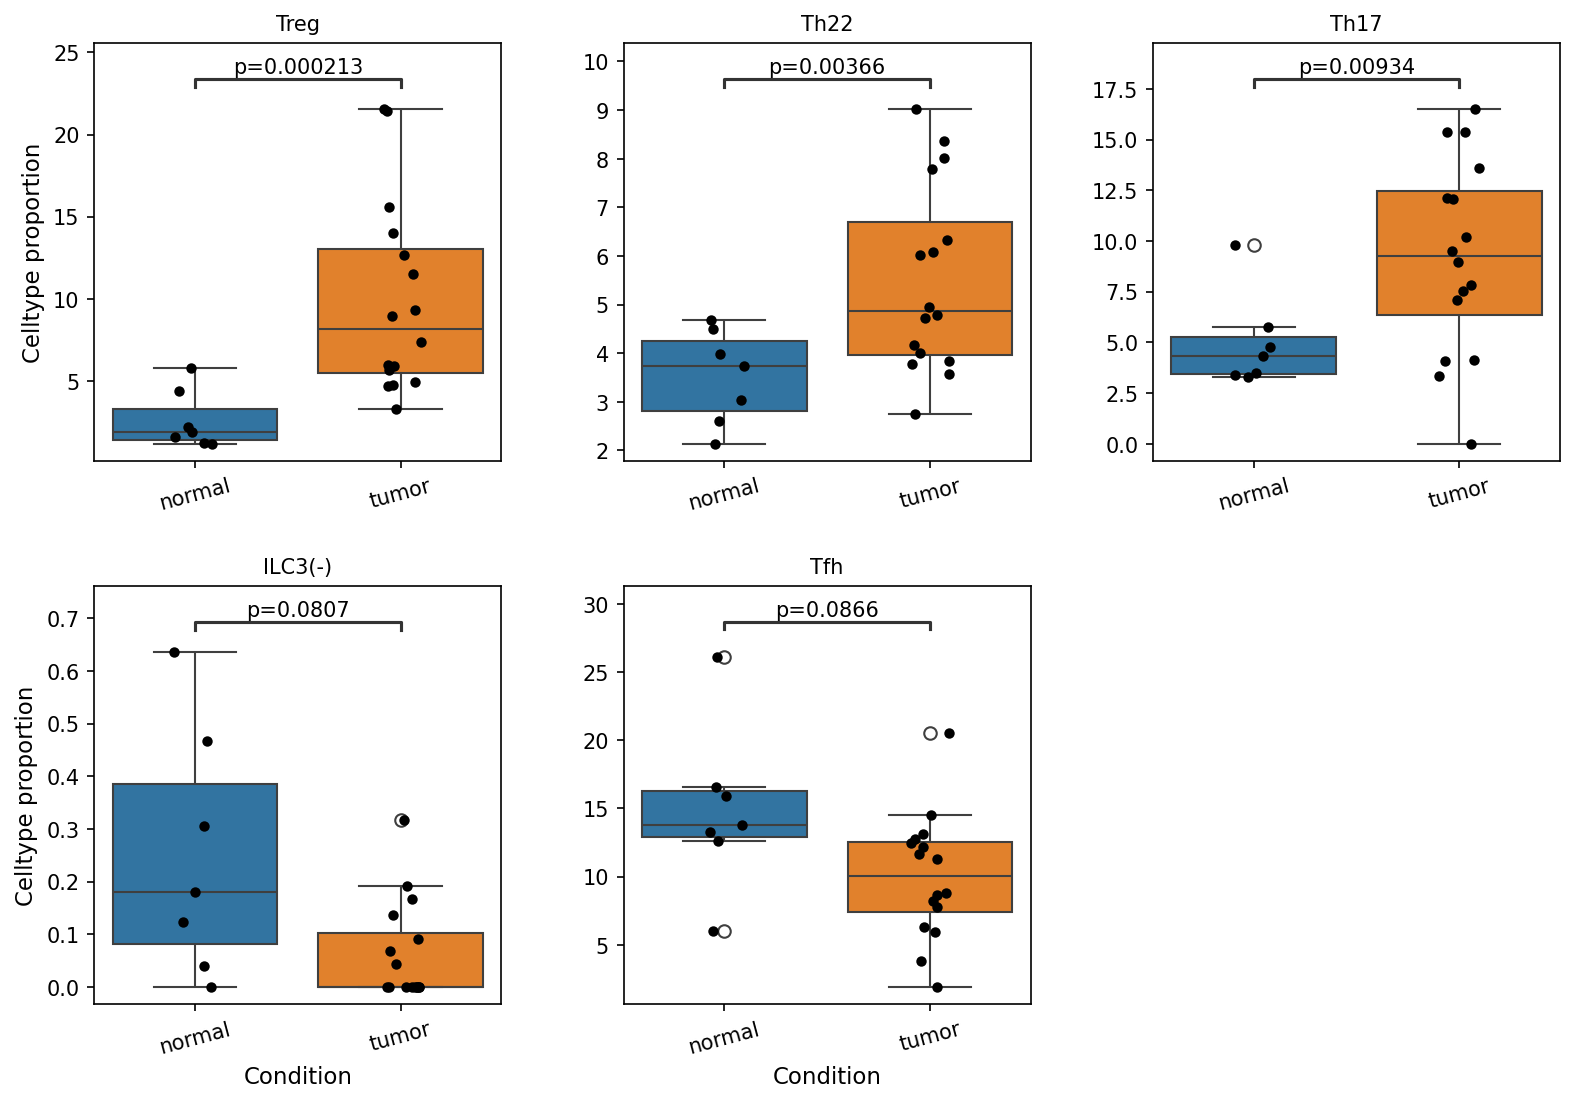
This analysis investigates the proportional changes of specific T cell and other immune cell subsets between normal and tumor conditions within the colon tissue, derived from single-cell RNA-seq data. The box plots display the distribution of cell type proportions for each subset in normal versus tumor samples, with p-values indicating statistical significance of the observed differences. The analysis aimed to identify immune cell populations that are significantly altered in the context of colon cancer, with a focus on T cell subsets as per the user query, and a p-value cutoff of 0.1 for statistical significance.
Visual Summary
The box plots reveal statistically significant differences in the proportions of five immune cell subsets between normal and tumor conditions in the colon:
- Treg (Regulatory T cells): A highly significant increase in the proportion of Treg cells is observed in the tumor samples compared to normal samples (p=0.000213). Tumor samples generally show Treg proportions between ~5% and ~15%, while normal samples are predominantly below 5%.
- Th22 (T helper 22 cells): The proportion of Th22 cells is significantly elevated in tumor samples (p=0.00366). Normal samples typically have Th22 proportions around 3-4%, whereas tumor samples show proportions ranging from approximately 4% to 7%.
- Th17 (T helper 17 cells): A significant increase in Th17 cell proportion is evident in the tumor condition (p=0.00934). Normal samples hover around 3-5%, while tumor samples exhibit a broader range, mostly between 7% and 12%, with some outliers reaching above 15%.
- ILC3(-) (Group 3 Innate Lymphoid Cells, NCR-): The proportion of ILC3(-) cells shows a marginally significant decrease in tumor samples compared to normal ones (p=0.0807). Normal samples have ILC3(-) proportions typically between 0.1 and 0.4, which drop to mostly below 0.15 in tumor samples. It is important to note that ILC3 are Innate Lymphoid Cells and not T cells, but are included in the results.
- Tfh (T follicular helper cells): A marginally significant decrease in Tfh cell proportion is observed in the tumor condition (p=0.0866). Normal samples show Tfh proportions between 13% and 16%, while tumor samples are generally lower, mostly between 8% and 12%.
Biological Interpretation
The observed shifts in immune cell proportions provide insights into the immune microenvironment in colon cancer:
Increased Immunosuppression and Inflammation:
- The significant increase in Treg cells in tumor samples is a classic hallmark of an immunosuppressive tumor microenvironment. Tregs are crucial for maintaining immune tolerance but, in cancer, they suppress anti-tumor immune responses, allowing cancer cells to evade immune surveillance and promoting tumor progression [GeneCards: FOXP3].
- The elevation of Th17 and Th22 cells also points towards a pro-inflammatory and potentially pro-tumorigenic environment. Th17 cells have complex roles, but in colorectal cancer, they are often associated with promoting tumor growth, angiogenesis, and metastasis through various inflammatory cytokines [PubMed: Th17 colorectal cancer role]. Th22 cells, while less studied in this context, have also been implicated in mediating chronic inflammation and contributing to cancer progression in some settings [PubMed: Th22 colorectal cancer].
Compromised Anti-tumor Immunity:
- The decrease in ILC3(-) cells, which are important for maintaining intestinal barrier integrity and immune homeostasis, could suggest a dysregulation of the local innate immune environment in the tumor. While their precise role in suppressing or promoting colon cancer is context-dependent, a reduction might indicate a loss of protective immune functions.
- The decline in Tfh cells, which are critical for optimal B cell activation and antibody production, might suggest a dampened humoral immune response within the tumor. This could potentially impair the generation of effective anti-tumor antibodies or B cell-mediated immune memory, further contributing to immune evasion.
Collectively, these findings suggest that the colon tumor microenvironment is characterized by an expansion of immune-suppressive and pro-inflammatory lymphocyte populations, coupled with a reduction in certain cells potentially involved in robust anti-tumor immunity or tissue homeostasis. This imbalance likely contributes to tumor survival and progression.
Clinical or Translational Implications
The distinct changes in immune cell subset proportions observed between normal and tumor colon tissue have several potential clinical and translational implications:
- Prognostic Biomarkers: The altered proportions of Treg, Th17, Th22, ILC3(-), and Tfh cells could serve as prognostic biomarkers for colon cancer. For instance, a higher proportion of Tregs, Th17, or Th22 cells within the tumor might correlate with more aggressive disease or poorer patient outcomes.
- Therapeutic Targets: The significant enrichment of immunosuppressive (Treg) and potentially pro-tumorigenic (Th17, Th22) populations highlights these cell types as potential therapeutic targets. Strategies aimed at depleting Tregs, inhibiting their function, or modulating the Th17/Th22 axis could enhance anti-tumor immunity and improve responses to existing therapies, such as checkpoint inhibitors.
- Immunotherapy Stratification: Understanding the immune landscape might help in stratifying patients for specific immunotherapeutic approaches. Patients with a highly immunosuppressive TME, as indicated by elevated Tregs, might benefit from therapies designed to overcome this suppression.
- Monitoring Disease Progression/Response: Changes in the proportions of these immune cell subsets could potentially be monitored during treatment to assess therapeutic efficacy or disease recurrence.
9. Macrophage Subset Population Analysis in Colon Normal and Tumor Tissues
[Analysis Visualization Results]...
Analysis Overview
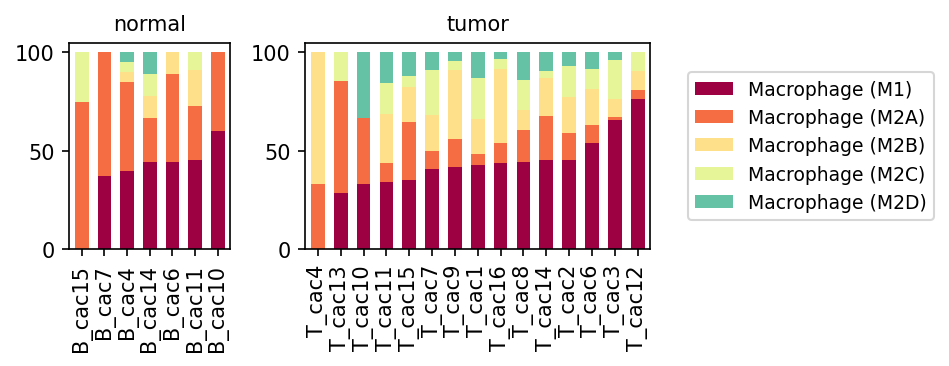
This analysis presents a population bar plot illustrating the relative proportions of various macrophage subsets (Macrophage (M1), Macrophage (M2A), Macrophage (M2B), Macrophage (M2C), and Macrophage (M2D)) within individual samples, comparing normal colon tissue to tumor colon tissue. This type of analysis is crucial for understanding the immune microenvironment and its potential shifts during disease progression, particularly in the context of cancer where macrophage polarization plays a significant role.
Visual Summary
The plot displays two main panels, one for 'normal' samples and one for 'tumor' samples, each showing stacked bar plots representing the macrophage subset composition within different individual samples (identified by B_cac for normal and T_cac for tumor samples).
In normal samples:
- Macrophage (M1) and Macrophage (M2A) represent the predominant macrophage subsets, with their combined proportions often exceeding 70-80% of the total macrophage population in most normal samples.
- Macrophage (M2B), Macrophage (M2C), and Macrophage (M2D) are present in relatively low proportions or are largely absent in most normal samples.
In tumor samples:
- There is a notable shift in the macrophage subset composition compared to normal tissue.
- Macrophage (M2A) appears to be reduced in proportion in many tumor samples compared to its prevalence in normal samples.
- Conversely, Macrophage (M2B), Macrophage (M2C), and particularly Macrophage (M2D) show a clear increase in their relative proportions across a majority of tumor samples. These subsets, which were minor or absent in normal tissue, become consistently present and contribute significantly to the macrophage pool in tumor samples (e.g., M2D in T_cac12, T_cac3, T_cac6; M2C in T_cac1, T_cac8, T_cac14).
- Macrophage (M1) proportions are variable in tumor samples; while still present, its relative contribution appears to be balanced by the increased prevalence of specific M2 subtypes.
Biological Interpretation
Macrophages are highly plastic immune cells that can differentiate into various functional phenotypes, broadly categorized as M1 (classically activated) and M2 (alternatively activated). M1 macrophages are generally pro-inflammatory and anti-tumorigenic, while M2 macrophages are typically associated with immune suppression, tissue repair, angiogenesis, and tumor promotion. The M2 category itself is heterogeneous, with subtypes like M2A, M2B, M2C, and M2D representing different polarization states.
The observed shifts in macrophage populations in colon tumor samples are highly significant:
- Reduced M2A in Tumor: M2A macrophages are often associated with allergic responses and wound healing. Their relative reduction in the tumor microenvironment might indicate a shift away from these specific reparative functions, possibly overshadowed by other M2 programs.
- Increased M2B, M2C, and M2D in Tumor: The increase in Macrophage (M2B), Macrophage (M2C), and especially Macrophage (M2D) in tumor tissue is a critical finding. These M2 subtypes are known to promote tumor growth, angiogenesis, metastasis, and immune evasion. Macrophage (M2D) is a specific subtype of tumor-associated macrophage (TAM) implicated in an immunosuppressive and pro-tumorigenic microenvironment PubMed search: tumor associated macrophages M2 polarization colon cancer.
- This suggests that the colon tumor microenvironment actively promotes the differentiation or recruitment of macrophage subsets that foster tumor progression, consistent with the observed aneuploidy and resolved tumor-origin Intestinal Epithelial cells. The collective enrichment of these pro-tumorigenic M2 subsets indicates an immunosuppressive landscape in the colon tumors.
Clinical or Translational Implications
The distinct shift in macrophage populations towards pro-tumorigenic M2 phenotypes in colon cancer tissues has several important clinical and translational implications:
- Biomarker Potential: The proportions of specific M2 macrophage subsets (e.g., M2D, M2C) could serve as prognostic biomarkers for disease aggressiveness or patient outcome in colon cancer. Higher proportions of these immunosuppressive macrophages might correlate with poorer prognosis.
- Therapeutic Targets: Macrophages, particularly TAMs, are emerging as attractive targets for cancer therapy. Strategies aimed at depleting pro-tumorigenic M2 macrophages, repolarizing them towards an M1-like anti-tumor phenotype, or inhibiting their recruitment could be beneficial in combination with existing treatments for colon cancer.
- Immunotherapy Response: The presence and composition of macrophage subsets can influence the efficacy of immunotherapies. A microenvironment rich in M2B, M2C, and M2D macrophages might contribute to resistance to certain immunotherapies, suggesting a need for combination strategies that also address macrophage polarization.
10. Differential Abundance of Macrophage Subsets in Colon Cancer
[Analysis Visualization Results]...
Analysis Overview
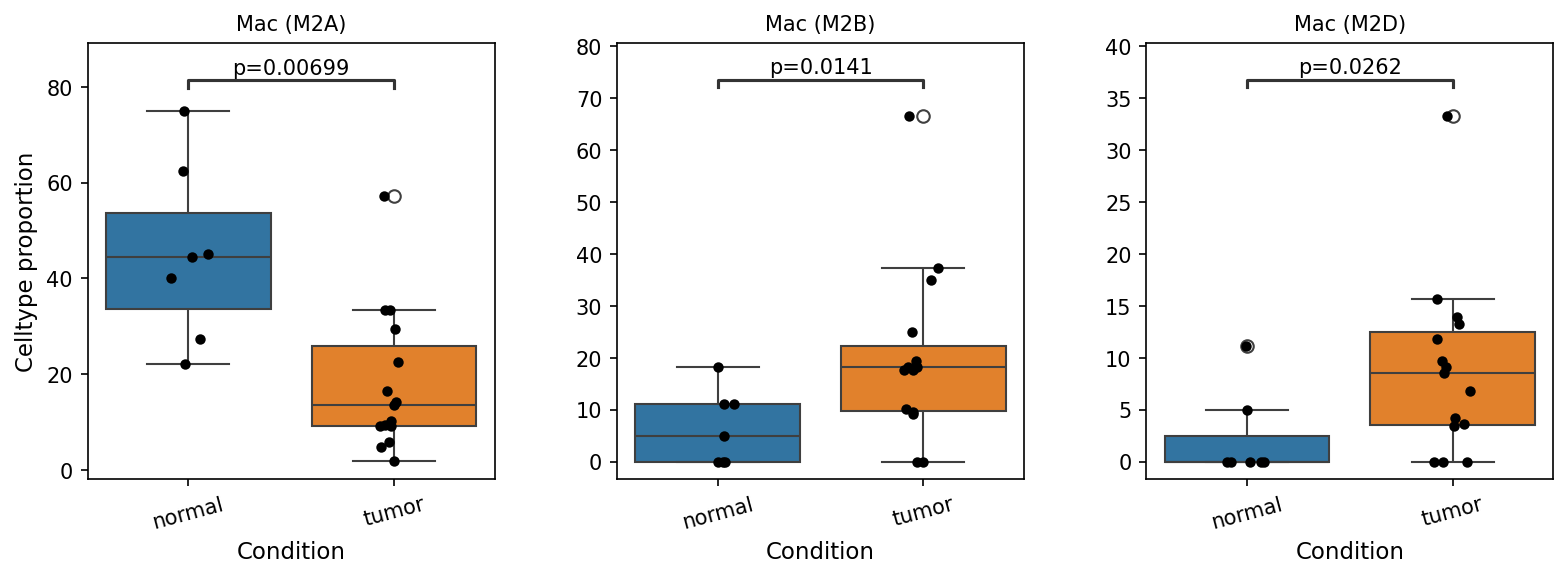
This analysis investigates the differential proportions of specific macrophage subsets (Mac M2A, Mac M2B, and Mac M2D) between normal colon tissue and colon tumor samples. Box plots are used to visualize the distribution of cell type proportions for each subset across the two conditions, with statistical significance indicated by p-values. The objective is to identify macrophage populations whose abundance significantly shifts in the tumor microenvironment, providing insights into their potential roles in colon cancer.
Visual Summary
The box plots illustrate the celltype proportion of three macrophage subsets, Mac (M2A), Mac (M2B), and Mac (M2D), in normal and tumor conditions.
- Mac (M2A): This subset shows a statistically significant decrease in celltype proportion in tumor samples compared to normal samples (p=0.00699). The median proportion of Mac (M2A) is considerably lower in tumors.
- Mac (M2B): Conversely, the proportion of Mac (M2B) cells is significantly increased in tumor samples compared to normal samples (p=0.0141). The median proportion for Mac (M2B) is higher in the tumor condition.
- Mac (M2D): Similar to Mac (M2B), Mac (M2D) cells exhibit a statistically significant increase in proportion within the tumor microenvironment (p=0.0262). The median proportion of Mac (M2D) is markedly elevated in tumor samples.
All three observed differences are statistically significant (p < 0.1), indicating a robust shift in the relative abundance of these macrophage subsets in colon cancer.
Biological Interpretation
Macrophages are highly plastic immune cells that polarize into different functional phenotypes, broadly categorized as M1 (pro-inflammatory, anti-tumor) and M2 (anti-inflammatory, pro-tumor). The M2 phenotype itself is heterogeneous, with subtypes like M2A, M2B, M2C, and M2D exhibiting distinct roles.
The observed changes in macrophage subsets in colon tumor samples suggest a profound re-education of the macrophage compartment, consistent with the establishment of a pro-tumor microenvironment:
- Decrease in Mac (M2A): Mac (M2A) macrophages are typically associated with tissue repair, allergy, and immune suppression, often induced by IL-4/IL-13. While M2A can contribute to pro-tumor functions like angiogenesis, its decrease in tumors here might indicate a preferential shift towards other M2-like subsets that are more directly involved in tumor progression and immune evasion within the specific context of colon cancer.
- Increase in Mac (M2B): Mac (M2B) macrophages are known to be involved in immune regulation, inflammation, and can exhibit both pro-inflammatory and anti-inflammatory characteristics, depending on the context. Their significant increase in colon tumors suggests a shift towards a phenotype that contributes to the inflammatory and immune-modulatory aspects that favor tumor growth and progression.
- Increase in Mac (M2D): Mac (M2D), often referred to as tumor-associated macrophages (TAMs), are particularly well-characterized for their pro-tumor functions. They are typically immunosuppressive, promote angiogenesis, facilitate metastasis, and contribute to extracellular matrix remodeling. The substantial enrichment of Mac (M2D) cells in the tumor microenvironment is a strong indicator of an immune landscape that supports cancer development and progression, aligning with the inferred disease context of Colon cancer.
Collectively, these findings indicate a significant repopulation of the macrophage compartment in colon tumors, away from Mac (M2A) and markedly towards Mac (M2B) and Mac (M2D) phenotypes. This shift suggests an immune environment that likely fosters tumor growth, invasion, and immune evasion in the colon.
Clinical or Translational Implications
The differential abundance of macrophage subsets, particularly the enrichment of Mac (M2B) and Mac (M2D) in colon tumors, has important clinical and translational implications:
- Biomarkers: The proportions of these macrophage subsets could serve as potential biomarkers for colon cancer progression or even prognosis.
- Therapeutic Targets: Macrophages, especially those with pro-tumor M2-like phenotypes, are attractive targets for cancer immunotherapy. Strategies aimed at reprogramming tumor-associated macrophages (TAMs) from an M2-like (pro-tumor) to an M1-like (anti-tumor) state, or inhibiting the recruitment and survival of M2B/M2D macrophages, could be beneficial in colon cancer treatment.
- Understanding Treatment Resistance: The specific polarization of macrophages could influence the efficacy of other therapies (e.g., chemotherapy, radiation, or checkpoint blockade), suggesting that modulating these macrophage populations might enhance therapeutic responses.
11. Ploidy Status of Intestinal Epithelial Cells in Normal and Tumor Conditions
[Analysis Visualization Results]...
Analysis Overview
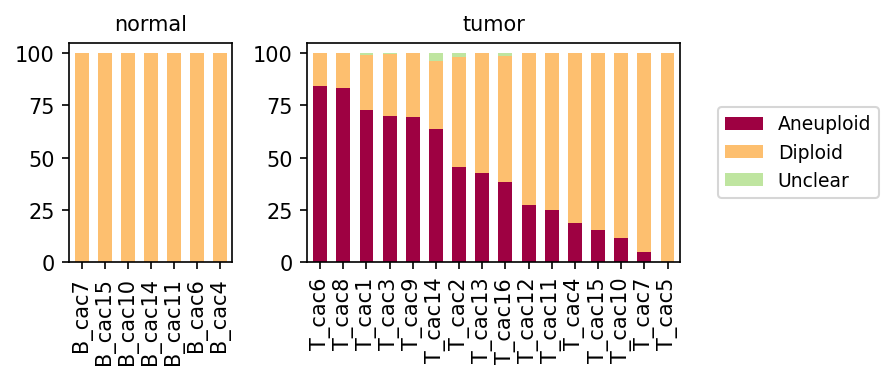
This analysis investigates the ploidy status (Aneuploid, Diploid, Unclear) of Intestinal Epithelial cells across various samples from both normal and tumor conditions. The primary goal is to visualize and compare the proportion of cells with different ploidy states in a cell type identified as the likely origin of the tumor (Intestinal Epithelial cells), thereby assessing genomic stability in these populations.
Visual Summary
The stacked bar plots display the relative proportions of Aneuploid (maroon), Diploid (orange), and Unclear (light green) cells within Intestinal Epithelial cell populations for individual samples under 'normal' and 'tumor' conditions.
- Normal Condition: In all 'normal' samples (B_cac7, B_cac15, B_cac10, B_cac14, B_cac11, B_cac6, B_cac4), Intestinal Epithelial cells are almost exclusively Diploid. The bars show nearly 100% diploid cells, with negligible to no visible aneuploidy or unclear ploidy status.
- Tumor Condition: In stark contrast, Intestinal Epithelial cells from 'tumor' samples (T_cac6, T_cac8, T_cac1, T_cac3, T_cac9, T_cac14, T_cac2, T_cac13, T_cac16, T_cac12, T_cac11, T_cac4, T_cac15, T_cac10, T_cac7, T_cac5) exhibit a substantial presence of Aneuploid cells. The proportion of aneuploid cells varies considerably among the tumor samples, ranging from over 80% (e.g., T_cac6) down to less than 10% (e.g., T_cac7, T_cac5). Diploid cells constitute the remainder of the population in most tumor samples, with a very small fraction of 'Unclear' cells sometimes present.
Biological Interpretation
The observed ploidy profiles provide strong evidence differentiating normal and tumor Intestinal Epithelial cells, aligning with established cancer biology principles.
- Genomic Stability in Normal Tissue: The consistent diploidy observed in Intestinal Epithelial cells from normal colon tissue is expected, reflecting the healthy state where cells maintain a stable number of chromosomes. This indicates proper cell division and genetic integrity in non-malignant epithelial cells.
- Aneuploidy as a Hallmark of Cancer: The significant and variable presence of aneuploid Intestinal Epithelial cells in tumor samples is a defining characteristic of cancer. Aneuploidy, an abnormal number of chromosomes, arises from genomic instability, a key driver of tumor initiation and progression. It allows cancer cells to acquire advantageous mutations and adapt to selective pressures, contributing to tumor heterogeneity and aggressiveness PubMed Search: Aneuploidy in cancer.
- Tumor-Origin Cell Type Confirmation: The data supports the inference that Intestinal Epithelial cells are the tumor-origin cell type in this dataset. The widespread aneuploidy specifically within these cells in tumor samples strongly suggests they are indeed the malignant population, consistent with colon cancer typically arising from epithelial cells GeneCards: Colon Cancer.
- Tumor Heterogeneity: The variability in the proportion of aneuploid cells across different tumor samples (e.g., high aneuploidy in T_cac6 vs. low in T_cac7/T_cac5) suggests underlying biological differences between individual tumors. This heterogeneity could be due to varying stages of tumor development, different genetic drivers, or varying levels of clonal evolution within each patient's tumor.
Clinical or Translational Implications
The distinct ploidy patterns observed have important clinical and translational relevance, particularly for colon cancer:
- Diagnostic Marker: Aneuploidy in Intestinal Epithelial cells can serve as a robust indicator for the presence of malignancy. Detecting aneuploid epithelial cells in a biopsy could aid in the diagnosis of colon cancer or distinguish dysplastic lesions from benign ones.
- Prognostic Value: The degree of aneuploidy can sometimes correlate with tumor aggressiveness, prognosis, and response to therapy in certain cancers. Further studies would be needed to determine if the variable aneuploidy observed here has such prognostic significance in these colon cancer samples PubMed Search: Aneuploidy cancer prognosis.
- Therapeutic Target Identification: Understanding the mechanisms leading to aneuploidy and genomic instability in tumor cells could inform the development of targeted therapies that exploit these vulnerabilities, such as drugs interfering with chromosome segregation or DNA repair pathways.
- Monitoring Treatment Response: Changes in the proportion of aneuploid Intestinal Epithelial cells over time or after treatment could potentially be used to monitor disease progression or response to therapeutic interventions.
12. Cell-Cell Interaction Landscape Alterations in Colon Cancer
[Analysis Visualization Results]...
Analysis Overview
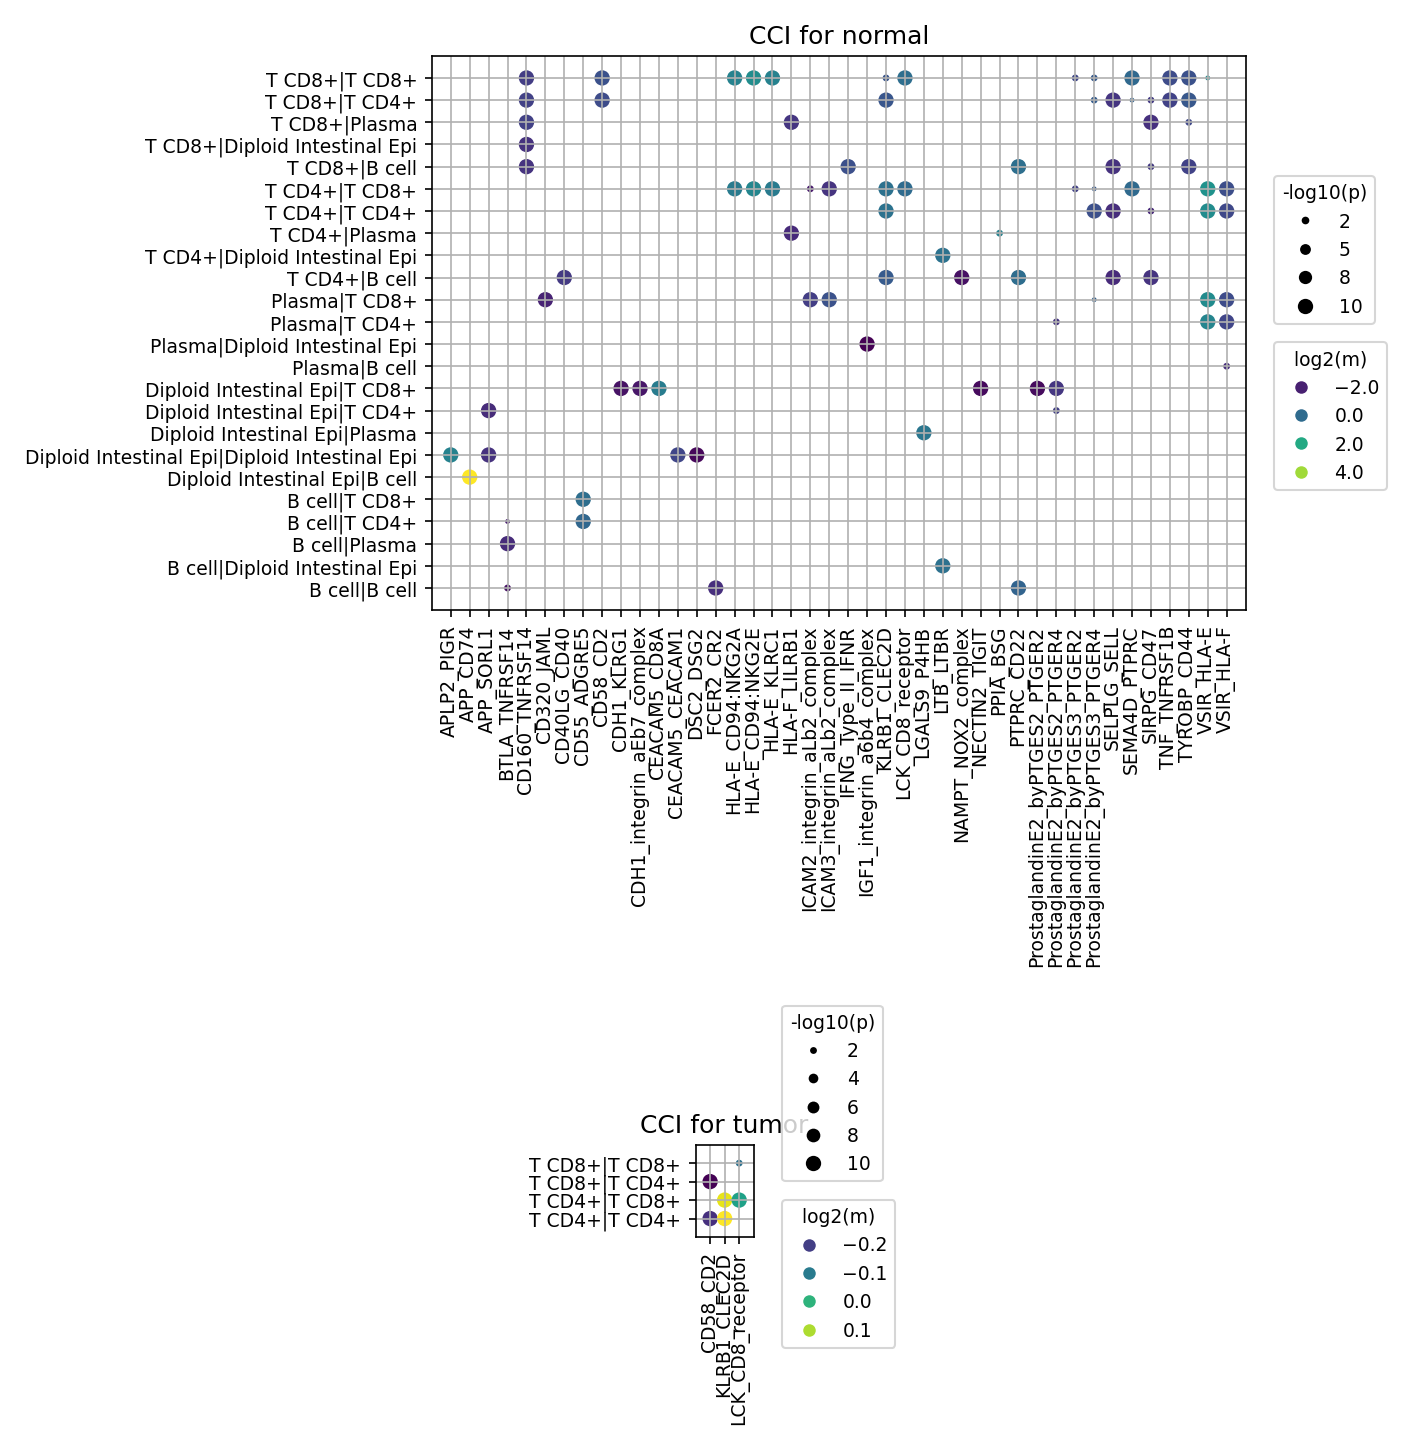
This analysis investigates cell-cell interaction patterns involving a comprehensive set of immune, stromal, and epithelial cell types in human colon tissue under normal and tumor conditions. The plot_cci_dots tool was utilized, displaying the top 80 most significant (based on p-value and mean expression) ligand-receptor interactions. This comparison aims to elucidate how cellular communication networks are altered in the context of colon cancer, focusing on interactions involving Intestinal Epithelial cells, Fibroblasts, Macrophages, T cells (CD4+, CD8+), B cells, Dendritic cells, Endothelial cells, ILCs, Mast cells, NK cells, Plasma cells, and Smooth muscle cells.
Visual Summary
CCI for normal
The visualization for normal colon tissue reveals a rich and diverse network of cell-cell interactions.
- Diverse Interacting Cell Types: A wide array of cell pairs are involved, including various T cell subsets (T CD8+|T CD8+, T CD8+|T CD4+, T CD4+|T CD4+), B cells (B cell|T CD4+, B cell|T CD8+, B cell|Diploid Intestinal Epi, B cell|B cell), Plasma cells (Plasma|T CD4+, Plasma|T CD8+, Plasma|Diploid Intestinal Epi, Plasma|B cell), and Diploid Intestinal Epithelial cells (Diploid Intestinal Epi|Diploid Intestinal Epi, Diploid Intestinal Epi|T CD4+, Diploid Intestinal Epi|T CD8+, Diploid Intestinal Epi|Plasma cell).
- Prominent Epithelial Interactions: Notably, Diploid Intestinal Epi|Diploid Intestinal Epi interactions, driven by CDH1_integrin_aE_b7_complex and CEACAM5_CD66a, exhibit high significance and strong expression, indicating robust epithelial cell-cell adhesion and homeostasis. Interactions between Diploid Intestinal Epi and various immune cells (T cells, Plasma cells) are also evident, involving pairs like ICAM2_integrin_aL_b2_complex and HLA-E_CD94_NKG2E.
- Extensive Immune Cell Interactions: T cells engage in numerous interactions among themselves and with B cells and Plasma cells, featuring pairs such as CD28_CD86, CD5_CD82, BTLA_HVEM, TNFRSF14_HVEM, and HLA-E_CD94_NKG2E.
- Metabolic and Immunomodulatory Pathways: Prostaglandin-related interactions (e.g., ProstaglandinD2_DP, ProstaglandinI2_Ptgir, ProstaglandinE2_PTGER4) are widely distributed across various immune cell interactions, suggesting active immune and inflammatory regulation in normal tissue.
- Overall Complexity: The normal tissue displays a highly complex and interconnected communication landscape, essential for tissue homeostasis and immune surveillance.
CCI for tumor
In stark contrast, the tumor condition presents a dramatically simplified cell-cell interaction landscape, showing only a very limited set of interactions among the top 80.
- Drastic Reduction in Diversity: The tumor plot shows significantly fewer interacting cell types and gene pairs. Only T cell-T cell interactions (T CD8+|T CD8+, T CD8+|T CD4+, T CD4+|T CD8+, T CD4+|T CD4+) are observed within the top 80 interactions.
- Absence of Epithelial and Other Cell Interactions: Crucially, interactions involving Intestinal Epithelial cells (the resolved tumor-origin cell type), B cells, Plasma cells, Fibroblasts, Macrophages, Dendritic cells, Endothelial cells, ILCs, Mast cells, NK cells, and Smooth muscle cells are completely absent from the top 80 most significant interactions in the tumor condition.
- Limited Gene Pairs: The T cell-T cell interactions in the tumor are primarily mediated by CD58_CD2, KLRB1_CLEC2D, and LCK_CD8_Treceptor. These interactions show varying levels of significance and mean expression.
Comparative Summary
The most striking finding is the profound reduction in the diversity and number of significant cell-cell interactions in tumor tissue compared to normal tissue. The complex network observed in normal colon, encompassing epithelial, immune, and stromal cell types, is largely replaced by a highly restricted set of T cell-T cell interactions in the tumor microenvironment (TME). The complete absence of Intestinal Epithelial cell interactions (which would include the aneuploid tumor cells) in the top 80 interactions in tumor tissue is a critical observation.
Biological Interpretation
The observed shift in cell-cell interaction patterns from a diverse, multi-cellular network in normal colon to a highly restricted T cell-centric communication in colon tumors has significant biological implications:
- Disruption of Epithelial Homeostasis and Intercellular Adhesion: The prominent CDH1_integrin_aE_b7_complex mediated self-interactions of Diploid Intestinal Epi cells in normal tissue highlight robust epithelial integrity. Its complete absence, along with other Intestinal Epithelial cell interactions, from the top 80 interactions in the tumor suggests a significant breakdown of epithelial cell-cell adhesion and communication, a hallmark of epithelial-to-mesenchymal transition (EMT) and cancer progression. The tumor-origin Intestinal Epithelial cells (likely aneuploid) appear to have either lost these adhesive properties or their interactions with other cells are dramatically altered and no longer among the most prominent.
- Immune Microenvironment Simplification and Dysregulation: The rich immune cell interactions (T cells, B cells, Plasma cells, and their interactions with epithelial cells) seen in normal tissue are largely absent in the tumor context. This simplification of the immune microenvironment, dominated by T cell-T cell communication, might reflect several phenomena:
- Immune Exclusion/Desert: Tumor cells may actively avoid engaging with the immune system, leading to an 'immune desert' phenotype where anti-tumor immune cells are either absent or dysfunctional within the tumor core.
- T Cell Dysfunction/Anergy: The remaining T cell-T cell interactions, such as CD58_CD2, which is involved in T cell activation, and KLRB1_CLEC2D, which can modulate NK and T cell activity, could signify attempts at sustaining T cell function within a hostile environment or indicate specific regulatory circuits. The specific interaction LCK_CD8_Treceptor points to internal signaling within T cells or related to TCR signaling, which might be activated or dysregulated.
- Loss of Co-stimulatory and Co-inhibitory Balance: The absence of many immune checkpoint-related interactions (e.g., BTLA_HVEM, TNFRSF14_HVEM found in normal) in the tumor's top 80 implies a potential shift in the balance of co-stimulatory and co-inhibitory signals critical for effective anti-tumor immunity.
- Altered Inflammatory and Immunomodulatory Signaling: The presence of prostaglandin pathway interactions in normal tissue underscores their role in maintaining immune balance. Their absence from the prominent interactions in the tumor suggests altered inflammatory signaling, which could contribute to immune suppression and tumor progression.
- Reduced Inter-cellular Communication: The profound reduction in the overall number and diversity of significant interactions points to a fundamental rewiring or suppression of intercellular communication in the tumor microenvironment. This could impair coordinated immune responses, stromal support, and epithelial regeneration.
Clinical or Translational Implications
The dramatic changes in cell-cell interaction patterns observed in colon cancer have critical implications for therapeutic development and patient management:
Therapeutic Target Prioritization:
- Restoring Epithelial-Immune Interactions: The absence of Intestinal Epithelial cell interactions with immune cells in the tumor provides a compelling rationale to investigate strategies that can re-establish these crucial interactions. For instance, modulating factors that prevent tumor cells from interacting with T cells or other immune cells could enhance anti-tumor immunity.
- Targeting Dysfunctional T Cell Interactions: The identified CD58_CD2 and KLRB1_CLEC2D interactions within the TME could represent novel targets to modulate T cell activity. Strategies to enhance activating signals or block inhibitory signals specific to these interactions might improve T cell efficacy.
- Reversing Loss of Adhesion: Understanding the mechanisms behind the loss of CDH1_integrin_aE_b7_complex mediated adhesion in tumor-origin epithelial cells could lead to therapies aimed at restoring epithelial integrity, potentially hindering metastasis and tumor invasiveness GeneCards: CDH1.
- Biomarker Development: The distinct signature of cell-cell interactions—a diverse network in normal tissue versus a simplified, T-cell-dominant pattern in tumor—could serve as a novel diagnostic or prognostic biomarker for colon cancer. Monitoring the presence or absence of specific interaction patterns could help in early detection, staging, or predicting treatment response.
- Immunotherapy Response and Resistance: These findings offer insights into the immune evasion mechanisms within the TME. A simplified interaction landscape dominated by T-T interactions, devoid of significant epithelial-immune cross-talk, may indicate an immunologically "cold" tumor or a state of T cell exhaustion, which could predict resistance to certain immunotherapies (e.g., checkpoint inhibitors). Future immunotherapeutic strategies might need to focus on enhancing TME infiltration and re-establishing broader immune-tumor and immune-stromal interactions.
13. Immune Checkpoint and Cell Cycle Pathway Cell-Cell Interactions in Colon Tissue
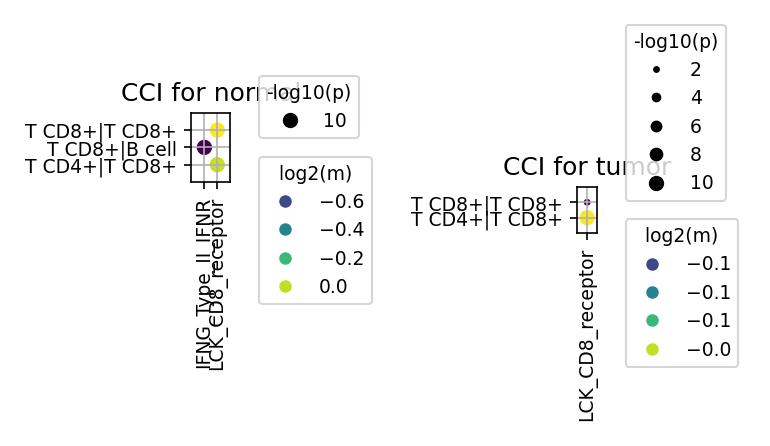
[Analysis Visualization Results]...
Analysis Overview
This analysis investigates cell-cell interactions (CCIs) involving a curated list of genes associated with immune checkpoint and cell cycle pathways in both normal and tumor colon tissue environments. The plot_cci_dots tool was used to visualize significant ligand-receptor interactions between specified minor cell types, aggregated by condition. The dot plot visualizes the statistical significance (-log10(p-value) represented by dot size) and the strength of interaction (log2(mean expression) represented by dot color) for detected cell-cell and gene-pair interactions. The analysis highlights key differences in immune-related signaling between normal and cancerous colon microenvironments.
Visual Summary
The analysis generated two dot plots comparing CCIs in "normal" and "tumor" conditions.
Normal Condition Plot:
- Active Interactions: The plot for the normal condition displays two prominent gene-pair interactions: IFNG_Type_II_IFNR and LCK_CD8_receptor.
Cell Type Pairs:
- IFNG_Type_II_IFNR shows strong interactions (large dot size, high -log10(p-value) ~10, indicating high significance; yellow color, high log2(mean) ~0.0) between T CD8+ and T CD8+ cells, and between T CD8+ and B cells.
- LCK_CD8_receptor also shows strong interactions (high significance and mean expression) between T CD8+ and T CD8+ cells, and between T CD4+ and T CD8+ cells.
- Overall: In the normal colon tissue, robust T cell-T cell and T cell-B cell communications involving critical immune signaling pathways are evident.
Tumor Condition Plot:
- Reduced Interactions: The plot for the tumor condition shows a stark reduction in detected significant interactions.
- Absent Interactions: The IFNG_Type_II_IFNR interaction is completely absent from the tumor plot, indicating a loss of this signaling pathway below the significance/mean cutoff.
- Diminished Interactions: The LCK_CD8_receptor interaction is still present for T CD8+|T CD8+ and T CD4+|T CD8+ cell pairs, but with significantly lower statistical significance (smaller dot sizes, -log10(p-value) ~2-4) and lower mean expression (darker blue/green color, log2(mean) ~-0.1).
- Overall: The tumor microenvironment exhibits a marked suppression or loss of these critical immune cell interactions compared to normal tissue.
Biological Interpretation
The observed differences in cell-cell interactions between normal and tumor conditions provide crucial insights into immune dysregulation in colon cancer.
Loss of IFN-gamma Signaling in Tumor Microenvironment (TME):
- In normal tissue, the strong IFNG_Type_II_IFNR interaction among T CD8+ cells and between T CD8+ and B cells suggests active immune surveillance and coordination. Interferon-gamma (IFN-γ), primarily produced by activated T cells and NK cells, is a key cytokine in anti-tumor immunity, promoting MHC class I expression on tumor cells and activating immune cells for tumoricidal activity [1].
- The complete absence of IFNG_Type_II_IFNR interactions in the tumor condition is a critical finding. This suggests a severe impairment or suppression of IFN-γ signaling within the TME, which is a known mechanism of immune evasion employed by many cancers, including colorectal cancer [2]. A "cold" tumor phenotype, characterized by low immune cell infiltration and activity, often correlates with suppressed IFN-γ signaling.
Impaired T Cell Activation and Function via LCK/CD8 Receptor in TME:
- LCK (Lymphocyte-specific protein tyrosine kinase) is an intracellular kinase crucial for T-cell receptor (TCR) signaling, associating with the cytoplasmic tails of CD4 and CD8 co-receptors [3]. The LCK_CD8_receptor interaction, while possibly representing a complex or internal signaling mechanism visualized by CellPhoneDB, broadly indicates T cell activation and communication involving CD8+ T cells.
- In normal tissue, robust LCK_CD8_receptor signaling within T CD8+ populations and between helper T (CD4+) and cytotoxic T (CD8+) cells signifies healthy and active T cell responses.
- The significant reduction in both the significance and strength of LCK_CD8_receptor interactions in the tumor suggests impaired T cell activation and functionality. This could lead to T cell exhaustion or anergy, where T cells are present but unable to mount an effective anti-tumor response [4]. The breakdown in communication between CD4+ and CD8+ T cells further compromises the coordinated immune attack.
Clinical or Translational Implications
These findings have significant clinical implications for understanding colon cancer progression and developing targeted immunotherapies.
- Immune Evasion Mechanisms: The data strongly supports that colon tumors create an immunosuppressive microenvironment by dampening critical T cell-mediated immune responses, particularly by suppressing IFN-γ signaling and impairing LCK-dependent T cell activation.
Therapeutic Targets:
- Restoring IFN-γ Signaling: Strategies aimed at restoring IFN-γ production, enhancing IFN-γ receptor sensitivity, or mimicking IFN-γ's effects could overcome immune resistance. This might involve cytokine therapies or agents that target IFN-γ pathway suppressors.
- Enhancing T Cell Function: Therapies designed to boost LCK activity or improve CD8+ T cell activation and proliferation, such as adoptive cell therapies (e.g., CAR-T, TILs) or combination immunotherapies that alleviate T cell exhaustion, could be beneficial.
- Biomarker Development: The observed reduction in IFNG_Type_II_IFNR and LCK_CD8_receptor interactions could serve as potential biomarkers to identify patients with immune-suppressed tumors who might benefit from specific immunomodulatory therapies.
- Rationale for Immunotherapy: The findings underscore the rationale for immune checkpoint blockade (ICB) therapies, which aim to reactivate dysfunctional T cells by blocking inhibitory pathways. While direct immune checkpoint ligand-receptor interactions were not the focus of these specific plots (other genes like PDCD1 and CD274 were in the target list but not shown as significant in these filtered results), the observed T cell dysfunction provides a strong biological context for their use, particularly in combination with strategies to overcome IFN-γ signaling defects.
References:
- IFN-gamma in cancer immunity:
PubMed Search: "IFN-gamma cancer immunity"
- Immune evasion in colorectal cancer:
PubMed Search: "colorectal cancer immune evasion"
- LCK function in T cells:
- T cell exhaustion:
PubMed Search: "T cell exhaustion cancer immunotherapy"
14. Condition-Specific Cell-Cell Interaction Patterns in Colon Tissue
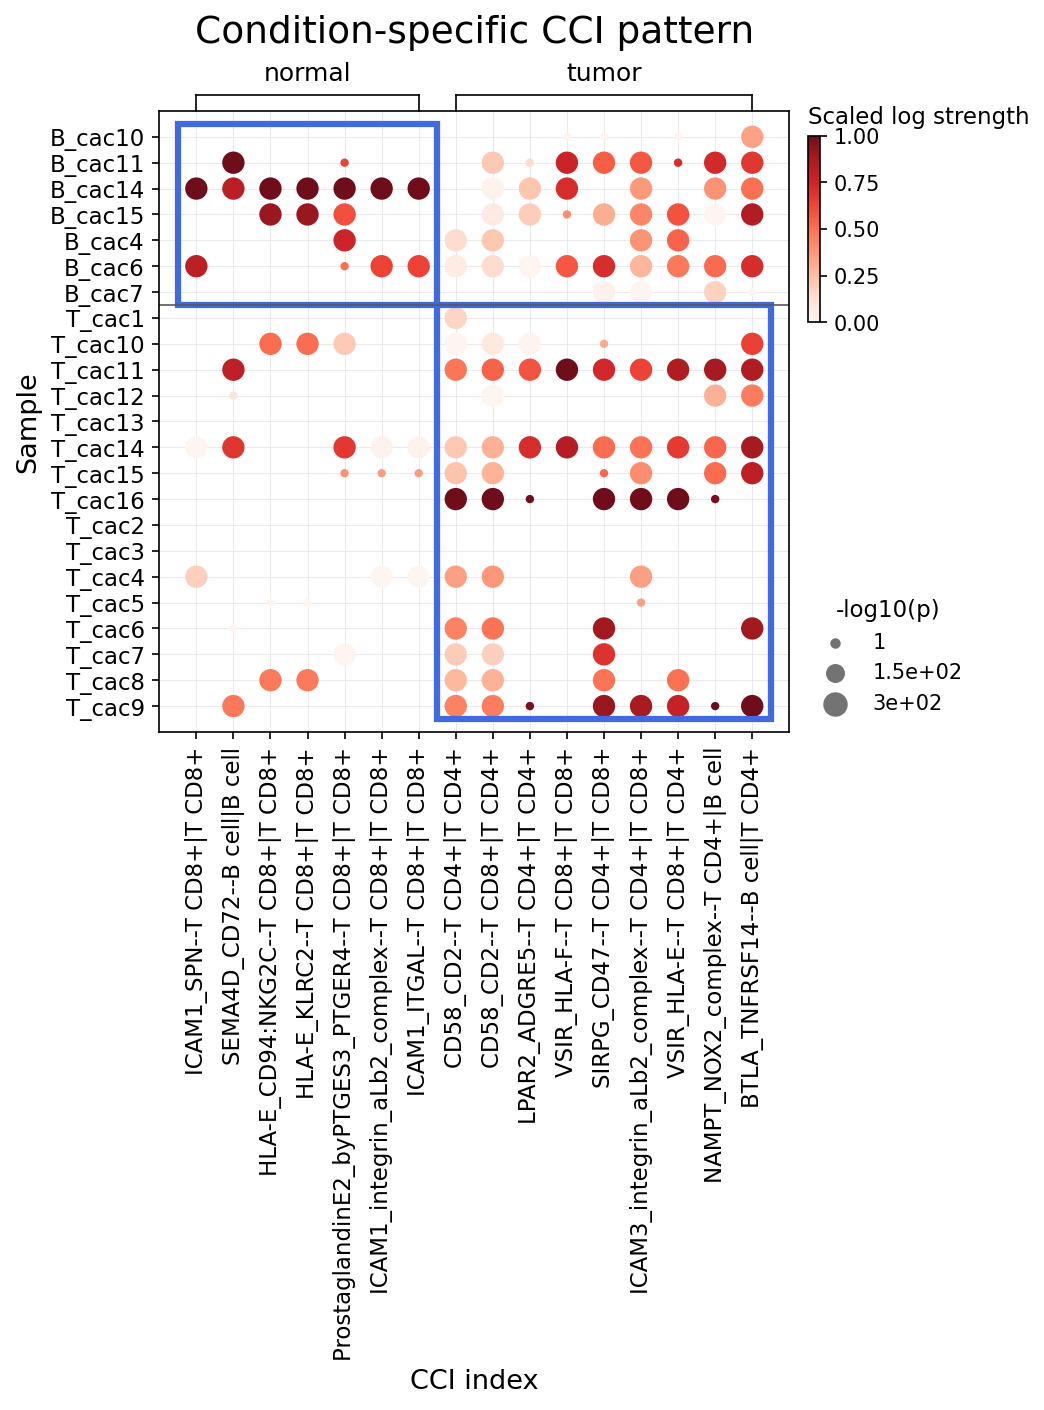
[Analysis Visualization Results]...
Analysis Overview
This analysis investigates condition-specific cell-cell interaction (CCI) patterns between major immune and stromal cells in human colon tissue, comparing 'normal' and 'tumor' conditions. The dot plot visualizes the strength (color intensity) and significance (dot size) of specific ligand-receptor interactions across individual samples from both conditions. The goal is to identify CCIs that are differentially regulated, providing insights into the immune microenvironment in colon cancer. The target cells for this analysis included T cells, B cells, Stromal cells, Endothelial cells, Myeloid cells, and Mast cells, with the plot specifically highlighting interactions within B and T cell subsets.
Visual Summary
The dot plot displays a clear differential pattern of cell-cell interactions between normal and tumor colon samples.
- Normal Condition (Left Panel): A distinct cluster of interactions is highly active and significant within samples from the 'normal' condition (indicated by the top-left blue box). These interactions primarily involve B cells (e.g., SEMA4D-CD72) and CD8+ T cells (e.g., various ICAM1-related interactions, HLA-E-NKG2C/KLRRC2, ProstaglandinE2-PTGER4). This suggests a well-orchestrated immune surveillance and regulatory environment in healthy tissue.
- Tumor Condition (Right Panel): In contrast, the 'tumor' condition samples exhibit a different set of highly active and significant interactions (indicated by the bottom-right blue box). These interactions predominantly involve CD4+ and CD8+ T cells. Key interactions include CD58-CD2, VSIR (VISTA)-HLA-F/HLA-E, SIRPG-CD47, BTLA-TNFRSF14 (HVEM), NAMPT-NOX2_complex, and ICAM3-integrin_aLb2_complex. This shift indicates a remodeled tumor microenvironment (TME) characterized by altered T cell activation, exhaustion, and immunosuppressive signaling.
- Overall Trend: Many interactions that are strong in normal samples are diminished or absent in tumor samples, and vice versa. The observed patterns suggest a profound reprogramming of immune cell communication in colon cancer, involving both adhesion/co-stimulation and immune checkpoint pathways.
Biological Interpretation
The analysis reveals distinct shifts in key immune cell communication pathways when comparing normal colon tissue to tumor tissue. This aligns with the inferred context of Colon cancer and the presence of aneuploid cells.
Interactions Enriched in Normal Condition:
These interactions often point to homeostatic immune functions or effective immune surveillance.
- SEMA4D-CD72 (B cell | B cell)
- Signaling Pathway/Mechanism: SEMA4D (Semaphorin 4D) on B cells interacts with CD72 on other B cells. This interaction is known to inhibit B cell activation and proliferation, playing a role in maintaining B cell homeostasis and preventing excessive humoral immune responses [1].
- Potential as a Therapeutic Target: In contexts where B cell overactivity is detrimental (e.g., autoimmune diseases), modulating this pathway could be beneficial. However, in cancer, its reduced presence might suggest dysregulation of B cell control.
- Relevant Therapeutic Agents: While direct therapeutic agents for this specific axis in cancer are not well-established, B-cell targeting therapies (e.g., anti-CD20) are used in lymphoma and autoimmune conditions.
- HLA-E - CD94:NKG2C / KLRRC2 (T CD8+ | T CD8+)
- Signaling Pathway/Mechanism: HLA-E is a non-classical MHC class I molecule. CD94:NKG2C is an activating receptor on NK cells and certain T cells (including CD8+ T cells), while KLRRC2 (NKG2C) is a component of this receptor complex. Their interaction can modulate immune cell activation, particularly in response to stress or infection. In normal tissue, this might contribute to the fine-tuning of anti-viral or anti-tumor immune responses [2].
- Potential as a Therapeutic Target: Activating NKG2C+ T cells or NK cells by modulating HLA-E could enhance anti-tumor immunity, especially in tumors that upregulate HLA-E to evade conventional T cell responses.
- Relevant Therapeutic Agents: Therapeutic antibodies targeting HLA-E or NKG2C are under preclinical and early clinical investigation for cancer immunotherapy.
- ICAM1-related interactions (ICAM1_SPN, ICAM1_integrin_aLb2_complex, ICAM1_ITGAL) (T CD8+ | T CD8+)
- Signaling Pathway/Mechanism: ICAM1 (CD54) is an intercellular adhesion molecule that binds to integrins like LFA-1 (composed of ITGAL/CD11a and ITGB2/CD18, forming the integrin_aLb2_complex) on T cells. SPN (CD43) also interacts with ICAM1. These interactions are fundamental for T cell adhesion, migration, and the formation of the immune synapse, critical for antigen recognition and T cell activation. Their robust presence in normal tissue indicates healthy immune cell trafficking and interaction [3].
- Potential as a Therapeutic Target: Modulating T cell adhesion could impact immune cell infiltration into tissues. While beneficial in inflammation, reduced adhesion in tumor could impair anti-tumor T cell function.
- Relevant Therapeutic Agents: Integrin inhibitors (e.g., Natalizumab targeting α4-integrin) are used in autoimmune diseases to prevent leukocyte trafficking. Efalizumab (an anti-CD11a antibody) was used for psoriasis but withdrawn.
Interactions Enriched in Tumor Condition:
These interactions are often associated with altered immune responses, immune evasion, or chronic inflammation within the tumor microenvironment.
- CD58-CD2 (T CD4+ | T CD4+ and T CD8+ | T CD8+)
- Signaling Pathway/Mechanism: CD58 (LFA-3) is a co-stimulatory molecule that binds to CD2 on T cells. This interaction enhances T cell adhesion, activation, and cytokine production, playing an important role in immune synapse formation and T cell responses. Its increased prominence in tumor samples might suggest active T cell infiltration and interaction, potentially leading to T cell exhaustion in the context of chronic antigen exposure [4].
- Potential as a Therapeutic Target: Modulating T cell activation.
- Relevant Therapeutic Agents: Alefacept, an LFA-3/CD2 fusion protein, targets CD2 and is used in psoriasis to inhibit T cell activation.
- VSIR-HLA-F / VSIR-HLA-E (T CD8+ | T CD8+)
- Signaling Pathway/Mechanism: VSIR (VISTA, B7-H5, PD-1H) is an immune checkpoint molecule that can suppress T cell function. HLA-F and HLA-E are non-classical MHC class I molecules. Interactions between VSIR and HLA-F/E, especially on T cells, could represent novel inhibitory pathways contributing to T cell dysfunction and immune evasion in the tumor microenvironment [5, 6].
- Potential as a Therapeutic Target: Blocking the VSIR pathway could reinvigorate anti-tumor T cell responses, similar to PD-1/PD-L1 or CTLA-4 blockade.
- Relevant Therapeutic Agents: Anti-VSIR monoclonal antibodies are in preclinical and early clinical development as novel cancer immunotherapies.
- SIRPG-CD47 (T CD4+ | T CD4+)
- Signaling Pathway/Mechanism: CD47 is a "don't eat me" signal expressed on many cell types, binding to SIRPα (SIRPG) on myeloid cells to inhibit phagocytosis. While commonly studied in myeloid-tumor cell interactions, its presence between T CD4+ cells suggests a potential role in modulating T cell-T cell communication or T cell survival mechanisms within the TME [7].
- Potential as a Therapeutic Target: Blocking CD47-SIRPα interaction is a promising strategy to promote anti-tumor immunity by enhancing phagocytosis of tumor cells and potentially modulating other immune cell interactions.
- Relevant Therapeutic Agents: Anti-CD47 antibodies (e.g., Magrolimab) are in various stages of clinical trials for hematological and solid tumors.
- BTLA-TNFRSF14 (HVEM) (B cell | T CD4+)
- Signaling Pathway/Mechanism: BTLA (B and T Lymphocyte Attenuator) is an inhibitory receptor on T cells that binds to TNFRSF14 (HVEM, Herpesvirus entry mediator) on B cells and other antigen-presenting cells. This interaction delivers inhibitory signals to T cells, contributing to T cell exhaustion and immune tolerance, which can be exploited by tumors to escape immune surveillance [8].
- Potential as a Therapeutic Target: Blocking the BTLA-HVEM pathway could unleash anti-tumor T cell responses, making it another attractive target for cancer immunotherapy.
- Relevant Therapeutic Agents: BTLA-blocking antibodies are currently in preclinical and early clinical investigations for various cancers.
Clinical or Translational Implications
The differential CCI patterns between normal and tumor colon tissue highlight the complex immune reprogramming occurring in colon cancer.
- Immune Evasion Mechanisms: The enrichment of inhibitory immune checkpoint interactions (e.g., VSIR-HLA-F/E, BTLA-HVEM, SIRPG-CD47) in the tumor microenvironment suggests active mechanisms of immune evasion. Targeting these pathways could disarm the tumor's ability to suppress anti-tumor immune responses, potentially leading to new therapeutic avenues for colon cancer, especially for patients who do not respond to existing immunotherapies.
- T Cell Dysfunction: The prominence of adhesion and co-stimulatory interactions (e.g., CD58-CD2, ICAM3-integrin_aLb2_complex) in tumor-infiltrating T cells could indicate chronic activation leading to exhaustion, a hallmark of dysfunctional anti-tumor immunity. Understanding the context of these interactions is crucial for developing strategies to revitalize exhausted T cells.
- Biomarker Potential: Specific CCI patterns could serve as biomarkers for patient stratification, predicting response to immunotherapy or identifying novel targets for combination therapies. For instance, high expression or activity of certain inhibitory pathways might indicate suitability for specific checkpoint blockade.
- Therapeutic Opportunities: The identified ligand-receptor pairs represent potential therapeutic targets. Investigational drugs like anti-VSIR antibodies, anti-CD47 antibodies, and BTLA-blocking antibodies could be explored for their efficacy in colon cancer. Combinatorial approaches, such as blocking multiple immune checkpoints, might be particularly effective given the multifaceted nature of immune suppression in the TME.
These findings underscore the importance of single-cell resolution analysis in dissecting the complex cellular crosstalk within the TME and guiding the development of more effective, personalized cancer immunotherapies.
---
References:
[1] CD72. GeneCards. (GeneCards)
[2] HLA-E. GeneCards. (GeneCards)
[3] ICAM1. GeneCards. (GeneCards)
[4] CD58. GeneCards. (GeneCards)
[5] VISTA (VSIR) as a novel immune checkpoint. PubMed search. (PubMed Search)
[6] HLA-F. GeneCards. (GeneCards)
[7] CD47-SIRPalpha signaling in cancer. PubMed search. (PubMed Search)
[8] BTLA-HVEM pathway in cancer. PubMed search. (PubMed Search)
15. Intestinal Epithelial Cell Condition-Specific Surfaceome Markers
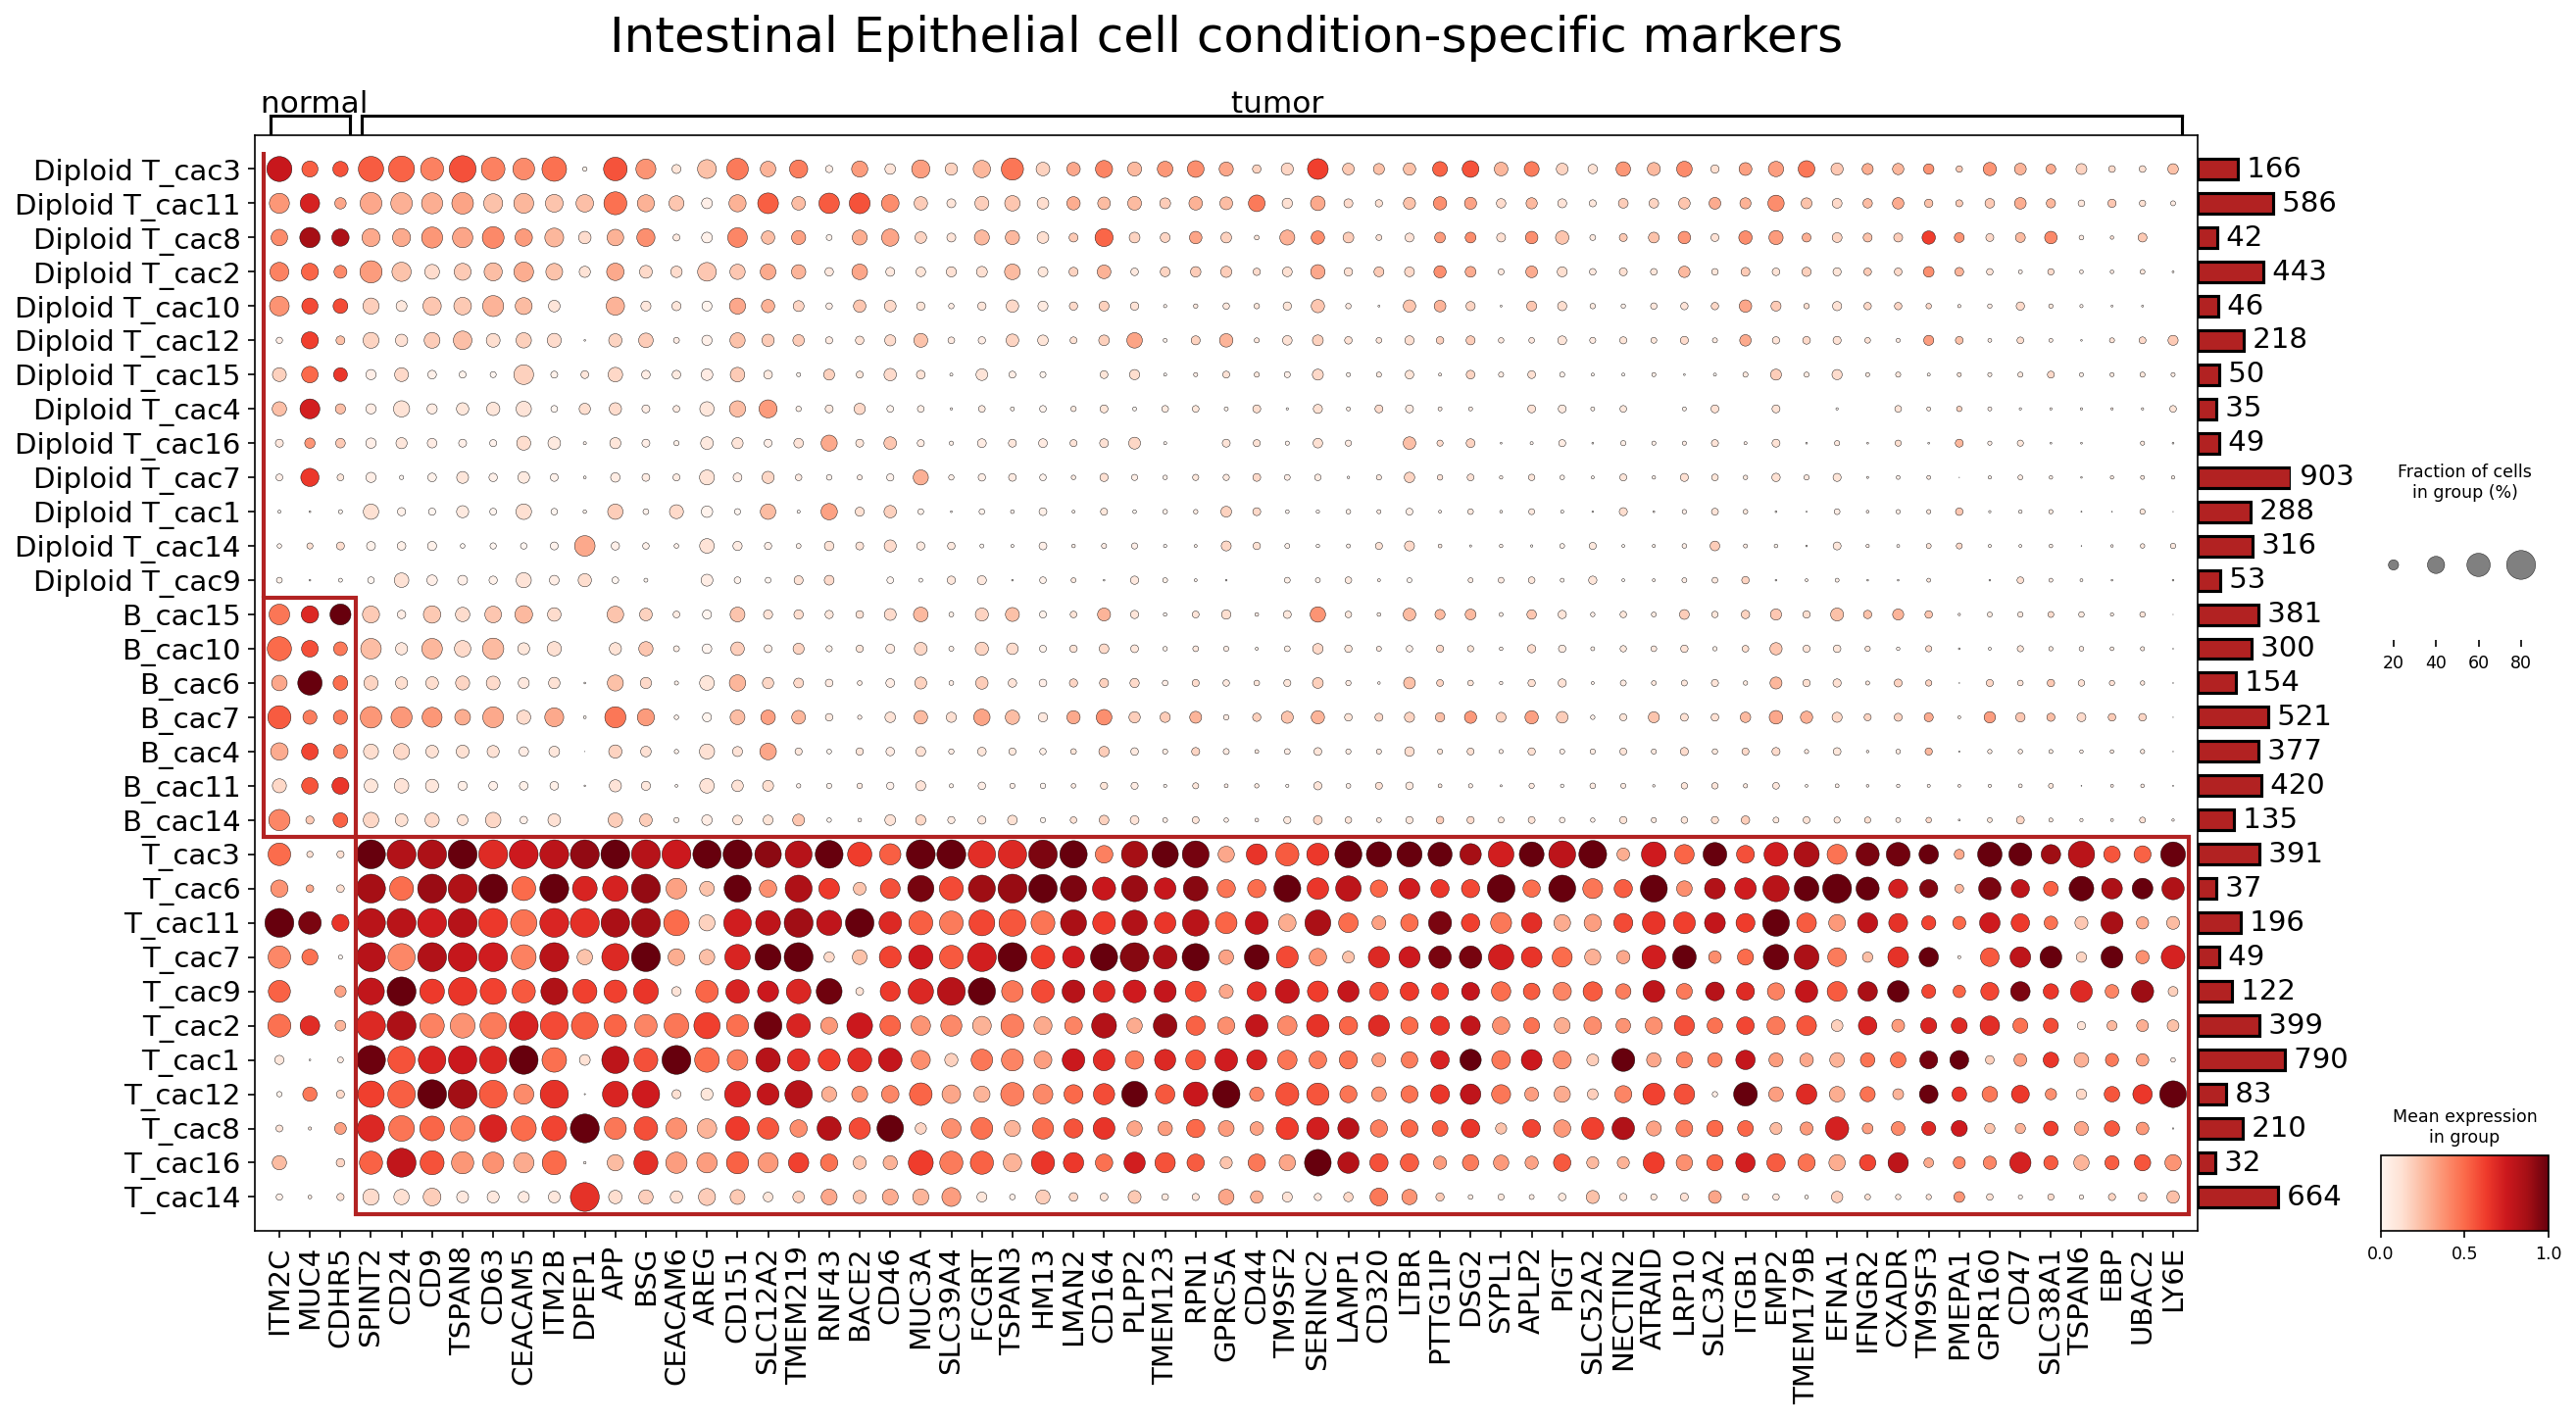
[Analysis Visualization Results]...
Analysis Overview
This analysis aimed to identify surfaceome markers differentially expressed in Intestinal Epithelial cells under 'normal' and 'tumor' conditions using single-cell RNA-seq data. The dot plot visualizes the mean expression and the fraction of cells expressing each marker across various sub-clusters of Intestinal Epithelial cells, categorized by their ploidy status and conditions. The goal was to pinpoint potential diagnostic, prognostic, or therapeutic targets, distinguishing between established and emerging candidates. The analysis focused on Intestinal Epithelial cells, which are identified as the tumor-origin cell type in this dataset.
Visual Summary
The dot plot, titled "Intestinal Epithelial cell condition-specific markers," effectively illustrates distinct expression profiles between Intestinal Epithelial cell sub-clusters associated with 'normal' and 'tumor' conditions.
The Y-axis displays various Intestinal Epithelial cell sub-clusters, broadly categorized into "Diploid T_cac" groups (upper section) and "T_cac" groups (lower section). This stratification likely reflects the ploidy status and/or distinct transcriptional states, with "Diploid T_cac" representing normal-like diploid cells and "T_cac" representing potentially aneuploid or tumor-associated cells, consistent with the observed aneuploidy in the dataset and the resolved tumor-origin cell type.
The X-axis lists a comprehensive set of surfaceome markers. The plot is divided into 'normal' and 'tumor' columns, representing the conditions under which marker expression was evaluated.
Key visual patterns:
- Normal-specific markers: The "Diploid T_cac" clusters (e.g., Diploid T_cac3, Diploid T_cac11) primarily show higher expression (darker red, larger dots) for a set of markers like MUC4, SPINT2, ITM2C, and some CDH1R5 variants, predominantly within the 'normal' condition column. These markers are largely absent or expressed at very low levels in the 'tumor' condition.
- Tumor-specific markers: Conversely, the "T_cac" clusters (e.g., T_cac3, T_cac6, T_cac11, T_cac7, T_cac9) exhibit strong and widespread expression for a large panel of surfaceome markers almost exclusively within the 'tumor' condition column. Notable examples include CEACAM5, CD44, CD47, ITGB1, AREG, LY6E, CD24, TSPAN8, CD63, DPEP1, MUC3A, and NECTIN2. These markers show minimal to no expression in the 'normal' condition.
- Differential expression within tumor clusters: Even within the 'tumor' group, some variability exists across different "T_cac" sub-clusters, indicating potential heterogeneity within the tumor microenvironment or different stages of tumor progression.
- Fraction of cells and expression level: The dot size (fraction of cells expressing the marker) and color intensity (mean expression level) together highlight that many tumor-specific markers are not only highly expressed but also prevalent across a significant fraction of tumor-associated Intestinal Epithelial cells.
Overall, the visualization clearly identifies distinct surfaceome expression signatures that differentiate normal Intestinal Epithelial cells from their tumor-associated counterparts, providing valuable candidates for further investigation as biomarkers and therapeutic targets in colorectal cancer.
Biological Interpretation
The distinct surfaceome marker profiles observed in normal versus tumor-associated Intestinal Epithelial cells provide crucial insights into the molecular changes occurring during colon cancer development and progression. The clear separation of "Diploid T_cac" groups (likely normal) from "T_cac" groups (likely tumor-derived) based on gene expression highlights the profound cellular reprogramming in malignancy.
Markers Prominent in Normal Intestinal Epithelial Cells
- MUC4 (Mucin 4, Cell Surface Associated)
- Description: MUC4 is a large transmembrane mucin that contributes to the protective mucus layer of epithelial surfaces. It plays a role in maintaining epithelial barrier integrity and cellular signaling, often interacting with ErbB2 (HER2).
- Associated Signaling Pathways & Mechanisms: In normal intestinal epithelia, MUC4 is involved in cell protection and can modulate cell growth and differentiation by influencing receptor tyrosine kinase signaling (e.g., EGFR/ErbB2 pathways) through indirect mechanisms. Its presence is crucial for maintaining the healthy mucosal barrier.
- Relevance to Cancer: Downregulation or altered expression of MUC4 in colorectal cancer can indicate a loss of normal epithelial differentiation and barrier function, potentially contributing to tumor invasion and metastasis.
- Relevant Therapeutic Agents: Not typically a direct therapeutic target for colon cancer due to its downregulation. However, its loss can serve as a prognostic marker.
- Supporting Evidence: Its role in epithelial differentiation and barrier function in normal colon is well-established [Source: UniProt - P10307, GeneCards - MUC4].
- Target Type: Less well-characterized marker with potential as a diagnostic/prognostic biomarker.
Markers Prominent in Tumor Intestinal Epithelial Cells
- CEACAM5 (Carcinoembryonic Antigen-Related Cell Adhesion Molecule 5)
- Description: A highly glycosylated cell surface protein involved in cell adhesion and signal transduction. CEACAM5 is a classic tumor-associated antigen, significantly overexpressed in various adenocarcinomas, including colorectal cancer.
- Associated Signaling Pathways & Mechanisms: CEACAM5 promotes tumor cell proliferation, survival, invasion, and metastasis. It can influence cell cycle progression and apoptosis resistance. Its interactions can modulate signaling pathways involving receptor tyrosine kinases like EGFR.
- Relevance to Cancer: Overexpression of CEACAM5 is a hallmark of many solid tumors and is associated with aggressive disease and poor prognosis. It contributes to immune evasion and chemotherapy resistance.
- Relevant Therapeutic Agents: Established therapeutic target.
- Tusamitamab ravtansine (ADC): An antibody-drug conjugate (ADC) specifically targeting CEACAM5, currently in clinical trials for CEACAM5-positive cancers. [PubMed Search: Tusamitamab ravtansine CEACAM5]
- Labetuzumab govitecan (ADC): Another CEACAM5-targeting ADC investigated for metastatic colorectal cancer. [PubMed Search: Labetuzumab govitecan CEACAM5]
- Supporting Evidence: Extensive literature documents CEACAM5 overexpression in colorectal cancer and its role in promoting tumor progression and as a target for ADCs [Source: GeneCards - CEACAM5].
- Target Type: Established therapeutic target.
- CD44 (Cluster of Differentiation 44)
- Description: A transmembrane glycoprotein and receptor for hyaluronic acid (HA), involved in cell adhesion, migration, and signaling. CD44 is a well-known marker for cancer stem cells (CSCs).
- Associated Signaling Pathways & Mechanisms: CD44 plays critical roles in cell-cell and cell-matrix interactions, and its signaling is linked to cell proliferation, survival, and epithelial-mesenchymal transition (EMT). It can activate pathways such as PI3K/Akt, MAPK, and Wnt/β-catenin, contributing to tumor growth, metastasis, and drug resistance.
- Relevance to Cancer: Its overexpression in tumor-associated Intestinal Epithelial cells is indicative of cancer stemness and increased metastatic potential.
- Relevant Therapeutic Agents: Established therapeutic target / Biomarker.
- Anti-CD44 antibodies: Several antibodies are under development to block CD44 function or deliver therapeutic payloads.
- Targeting CD44v6: Specific isoforms like CD44v6 are being explored for CAR T-cell therapies in various cancers. [PubMed Search: CD44 cancer therapy]
- Supporting Evidence: CD44's role as a cancer stem cell marker and its involvement in colorectal cancer progression and metastasis is widely recognized [Source: GeneCards - CD44].
- Target Type: Established therapeutic target (especially for CSCs/metastasis) and important biomarker.
- CD47 (Cluster of Differentiation 47)
- Description: A transmembrane glycoprotein that acts as a "don't eat me" signal, binding to SIRPα on phagocytic cells (e.g., macrophages) to inhibit their activity.
- Associated Signaling Pathways & Mechanisms: Overexpression of CD47 in cancer cells allows them to evade immune surveillance by inhibiting phagocytosis. It is also involved in cell adhesion, migration, and apoptosis.
- Relevance to Cancer: Its high expression in tumor-associated Intestinal Epithelial cells highlights a key mechanism of immune evasion employed by these cancer cells.
- Relevant Therapeutic Agents: Established therapeutic target.
- Anti-CD47 monoclonal antibodies: (e.g., Magrolimab, Letaplimab, Evorpacept). These antibodies block the CD47-SIRPα interaction, promoting macrophage-mediated phagocytosis of tumor cells. Currently in clinical trials for various solid and hematologic malignancies, including colorectal cancer. [PubMed Search: CD47 SIRPalpha cancer therapy]
- Supporting Evidence: CD47 overexpression is a common feature across many human cancers, correlating with poor prognosis and immune evasion, with blocking antibodies showing promising anti-tumor activity [Source: UniProt - Q08722].
- Target Type: Established therapeutic target.
- ITGB1 (Integrin Beta 1)
- Description: A crucial subunit of various integrin heterodimers, cell surface receptors that mediate cell-extracellular matrix (ECM) interactions.
- Associated Signaling Pathways & Mechanisms: Integrins are vital for cell adhesion, migration, proliferation, and survival. They transmit signals bidirectionally, linking the ECM to the cytoskeleton and activating intracellular pathways such as FAK, Src, PI3K/Akt, and MAPK, which are critical for tumor cell invasion, metastasis, and angiogenesis.
- Relevance to Cancer: Overexpression and activation of ITGB1-containing integrins in tumor cells enhance their ability to migrate, invade surrounding tissues, and metastasize, and contribute to therapy resistance.
- Relevant Therapeutic Agents: Potential therapeutic target.
- Integrin inhibitors: While ITGB1 is a common subunit, targeting specific alpha subunits combined with beta1 (e.g., anti-α5β1 integrin antibodies) or pan-integrin approaches are under investigation to disrupt tumor-ECM interactions. [PubMed Search: ITGB1 cancer therapy]
- Supporting Evidence: Overexpression and activation of ITGB1 integrins are frequently observed in various cancers, including colorectal cancer, and are associated with aggressive tumor behavior [Source: GeneCards - ITGB1].
- Target Type: Less well-characterized but with strong potential as a therapeutic target.
- AREG (Amphiregulin)
- Description: A ligand for the epidermal growth factor receptor (EGFR), acting as a growth factor.
- Associated Signaling Pathways & Mechanisms: AREG binds to EGFR, leading to its activation and subsequent downstream signaling through pathways like MAPK (Ras-Raf-MEK-ERK) and PI3K/Akt. These pathways drive cell proliferation, survival, migration, and resistance to apoptosis. AREG often functions in an autocrine/paracrine manner to promote tumor growth.
- Relevance to Cancer: High expression in tumor-associated Intestinal Epithelial cells suggests an active EGFR-driven proliferative and survival advantage, contributing to tumor progression and potentially resistance to anti-EGFR therapies.
- Relevant Therapeutic Agents: Established therapeutic target (indirectly via EGFR).
- EGFR inhibitors: Cetuximab and Panitumumab (monoclonal antibodies blocking EGFR) are approved for metastatic colorectal cancer. While they target the receptor, AREG's presence can influence response.
- Supporting Evidence: AREG overexpression is a known prognostic marker in colorectal cancer and contributes to resistance to EGFR-targeted therapies [Source: UniProt - P15514].
- Target Type: Established therapeutic target (as an EGFR ligand), also a potential biomarker for EGFR inhibitor response/resistance.
- LY6E (Lymphocyte Antigen 6 Family Member E)
- Description: A glycosylphosphatidylinositol (GPI)-anchored protein whose precise molecular mechanisms are still being elucidated, but it is implicated in cell survival and proliferation.
- Associated Signaling Pathways & Mechanisms: LY6E has been shown to promote cell survival, proliferation, and invasion in various cancers. It may modulate growth factor receptor signaling pathways, including EGFR, and impact cell adhesion.
- Relevance to Cancer: Its robust expression in tumor-associated Intestinal Epithelial cells suggests a role in maintaining tumor cell viability and potentially contributing to tumor aggressiveness.
- Relevant Therapeutic Agents: Potential therapeutic target.
- Currently, no approved therapies directly target LY6E. However, its consistent overexpression in numerous cancers makes it an attractive candidate for developing novel therapies, such as antibody-drug conjugates (ADCs) or CAR T-cell therapies. [PubMed Search: LY6E cancer therapy]
- Supporting Evidence: LY6E has been identified as an oncogene and a prognostic biomarker in several cancers, promoting tumor cell survival and metastasis [Source: GeneCards - LY6E].
- Target Type: Less well-characterized marker with strong potential as a therapeutic target.
Clinical or Translational Implications
The identification of these cell-type and condition-specific surfaceome markers in Intestinal Epithelial cells holds significant clinical and translational potential for colon cancer.
- Diagnostic and Prognostic Biomarkers:
- Markers like CEACAM5 and CD44, which are highly expressed in tumor-associated Intestinal Epithelial cells, can serve as valuable diagnostic markers, potentially detectable in tissue biopsies or liquid biopsies (e.g., circulating tumor cells). Their expression levels could also correlate with disease stage, aggressiveness, and patient prognosis.
- The loss of MUC4 in tumor cells could be indicative of disease progression and loss of differentiation, potentially serving as an early indicator of malignant transformation or prognostic marker.
- Therapeutic Targets for Novel Drug Development:
- Established Targets: The high expression of CEACAM5, CD44, and CD47 in tumor Intestinal Epithelial cells makes them compelling targets. Therapeutic strategies already exist or are in advanced clinical development, such as antibody-drug conjugates (ADCs) for CEACAM5 (Tusamitamab ravtansine, Labetuzumab govitecan) and anti-CD47 antibodies (Magrolimab, Letaplimab, Evorpacept) to overcome immune evasion. Targeting CD44 (especially specific isoforms) could be crucial for eradicating cancer stem cells and preventing metastasis.
- Targeting AREG-EGFR axis: High AREG expression suggests that while EGFR inhibitors (Cetuximab, Panitumumab) are standard, the role of AREG in primary or acquired resistance to these therapies warrants further investigation.
- Potential New Targets: ITGB1 and LY6E represent promising, less well-characterized therapeutic targets. Their consistent overexpression in tumor cells suggests they play critical roles in tumor biology. Further research into ITGB1 inhibitors or developing ADCs/CAR T-cells against LY6E could lead to new treatment options. Given their surface localization, these proteins are highly accessible for antibody-based therapies.
- Understanding Tumor Heterogeneity and Resistance:
- The heterogeneity observed in marker expression across different "T_cac" sub-clusters underscores the complexity of colon tumors. Understanding these variations could lead to personalized treatment strategies, where specific therapies are matched to the marker profile of an individual patient's tumor.
- Identifying these surface markers can help elucidate mechanisms of drug resistance and inform strategies to overcome them, for example, by combining therapies that target different pathways or cell populations.
In conclusion, this analysis provides a strong foundation for developing targeted therapies and diagnostic tools tailored to the specific molecular landscape of Intestinal Epithelial cell-derived colon cancer.
16. Fibroblast Condition-Specific Surfaceome Markers in Colon Tissue
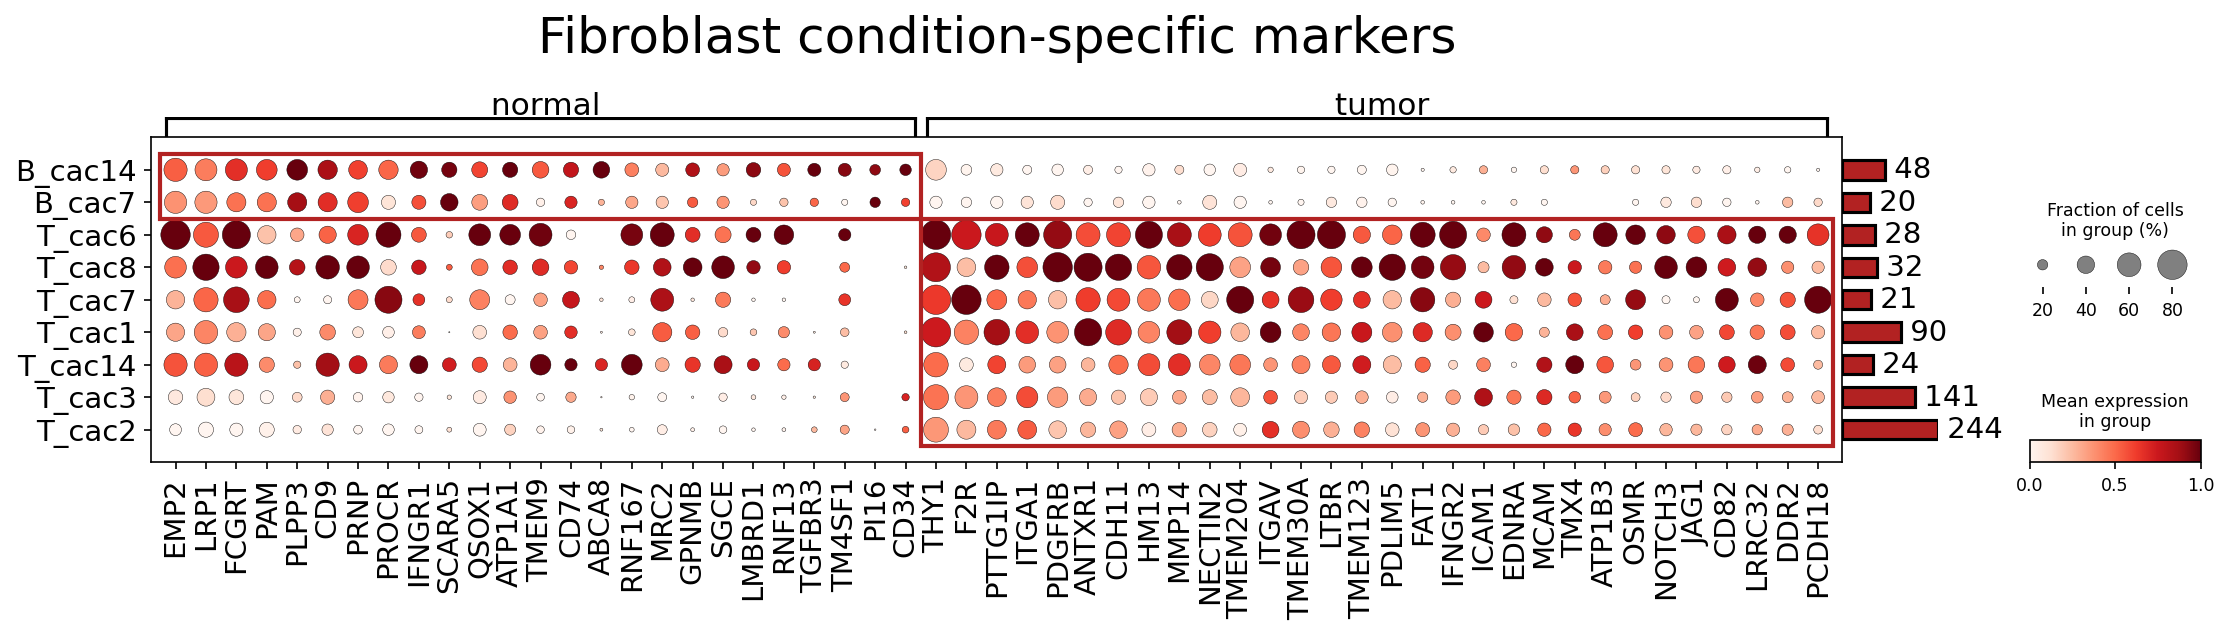
[Analysis Visualization Results]...
Analysis Overview
This analysis identifies and visualizes surfaceome markers specifically expressed by Fibroblast subclusters in normal and tumor colon tissue using a dot plot. The goal is to characterize the distinct surface protein profiles of fibroblasts in different conditions, particularly focusing on potential therapeutic targets in the context of colon cancer. The dot plot displays the mean expression level (color intensity) and the fraction of cells expressing the marker (dot size) for each gene across various fibroblast subclusters, grouped by 'normal' and 'tumor' conditions.
Visual Summary
The dot plot clearly differentiates the surfaceome profiles of Fibroblast subclusters between normal and tumor conditions.
- Distinct Condition-Specific Profiles: There is a pronounced separation of marker expression patterns. Genes on the left side (e.g., EMP2, LRP1, FCGRT, PAM, PROCR, CD74, ABCA8, MRC2, GPNMB) show higher expression and prevalence predominantly in Fibroblast subclusters from normal colon tissue. Conversely, genes on the right side (e.g., THY1, F2R, PTTG1IP, PDGFRB, ANTXR1, CDH11, MMP14, ITGAV, LTBR, EDNRA, ICAM1, OSMR, NOTCH3, JAG1, DDR2, PCDH18) are highly expressed and prevalent in Fibroblast subclusters from tumor tissue.
- Normal Fibroblast Markers: Subclusters like B_cac14, B_cac7, T_cac6, T_cac8, T_cac7, T_cac1, T_cac14, T_cac3, and T_cac2 show varying expression of markers in the 'normal' condition. Notably, PROCR, CD74, ABCA8, MRC2, and GPNMB appear broadly expressed across several normal fibroblast clusters, though with varying intensities and prevalences.
- Tumor Fibroblast Markers: Fibroblast subclusters in the 'tumor' condition (e.g., B_cac14, B_cac7, T_cac6, T_cac8, T_cac7, T_cac1, T_cac14, T_cac3, T_cac2) exhibit a generally strong and widespread expression of numerous markers. Many of these markers, such as THY1, PDGFRB, MMP14, ITGAV, EDNRA, JAG1, and ICAM1, are highly expressed (dark red color) and present in a large fraction of cells (large dot size) across multiple tumor-associated fibroblast subclusters, indicating a significant phenotypic shift.
- Activation Signature: The marked upregulation and broader expression of a distinct set of surface markers in tumor fibroblasts suggest a widespread activation of these cells into Cancer-Associated Fibroblasts (CAFs), reflecting their altered role in the tumor microenvironment.
Biological Interpretation
The observed shift in surfaceome markers highlights the phenotypic transformation of normal fibroblasts into CAFs within the colon tumor microenvironment. This transformation is crucial for tumor progression and offers potential therapeutic avenues.
Markers in Normal Fibroblasts
While the primary focus is on tumor-associated markers, several genes are prominently expressed in normal fibroblast subclusters, potentially representing quiescent or tissue-maintenance functions.
EMP2 (Epithelial Membrane Protein 2)
- Signaling Pathways: Interacts with integrins and other cell surface proteins to regulate cell adhesion, proliferation, and apoptosis. Can affect cell-matrix interactions and membrane raft organization.
- Role in TME: In normal fibroblasts, EMP2 may contribute to maintaining cellular organization and homeostasis. Its role in tumor contexts is complex, with both pro- and anti-tumorigenic functions reported depending on the cancer type. In normal colon, it might indicate quiescent stromal cells.
- Therapeutic Potential: Not typically considered a direct therapeutic target in cancer, but its modulation could impact cell adhesion and invasion pathways.
- Relevant Therapeutic Agents: No established therapeutic agents directly targeting EMP2.
- Reference: GeneCards: https://www.genecards.org/cgi-bin/carddisp.pl?gene=EMP2
PROCR (Protein C Receptor, Endothelial)
- Signaling Pathways: Binds Protein C, facilitating its activation by thrombin to Activated Protein C (APC). APC exhibits anticoagulant, anti-inflammatory, and cytoprotective effects via PAR1 signaling.
- Role in TME: In normal fibroblasts/stroma, PROCR contributes to maintaining vascular integrity and modulating inflammatory responses, helping to preserve tissue homeostasis. Its presence in normal fibroblasts may reflect their quiescent, non-inflammatory state.
- Therapeutic Potential: Not a direct therapeutic target for cancer but involved in pathways relevant to inflammation and vascular health. Its presence suggests functions distinct from activated CAFs.
- Relevant Therapeutic Agents: Recombinant human Activated Protein C (rhAPC) was explored for sepsis.
- Reference: GeneCards: https://www.genecards.org/cgi-bin/carddisp.pl?gene=PROCR
CD74 (HLA Class II Histocompatibility Antigen Gamma Chain)
- Signaling Pathways: Functions as an invariant chain in MHC class II antigen presentation. Also acts as a receptor for macrophage migration inhibitory factor (MIF), activating pro-survival and pro-inflammatory pathways (e.g., ERK, Akt).
- Role in TME: In normal cells, CD74 is involved in immune regulation. In certain contexts, CD74 can promote cell growth and survival. Its expression in normal fibroblasts may be linked to basal immune signaling or cellular housekeeping.
- Therapeutic Potential: CD74 is a target in some B-cell malignancies. Its role in normal fibroblasts may be indicative of immune-regulatory functions rather than direct oncogenic drive.
- Relevant Therapeutic Agents: Monoclonal antibodies (e.g., milatuzumab) targeting CD74 have been investigated for hematological cancers.
- Reference: GeneCards: https://www.genecards.org/cgi-bin/carddisp.pl?gene=CD74
Markers in Tumor-Associated Fibroblasts
The high and prevalent expression of specific surface markers in tumor fibroblasts points to their active involvement in tumor progression and identifies them as key components of the tumor microenvironment (TME) in colon cancer.
THY1 (CD90)
- Signaling Pathways: A GPI-anchored glycoprotein that interacts with integrins, focal adhesion kinase (FAK), and Src family kinases. Involved in cell adhesion, migration, and differentiation, and can modulate TGF-β signaling.
- Role in TME: THY1 is a widely recognized marker of activated fibroblasts and Cancer-Associated Fibroblasts (CAFs). It promotes tumor progression by influencing ECM remodeling, angiogenesis, and immune cell modulation (e.g., suppressing T cell responses). Its upregulation in colon CAFs suggests a pro-tumorigenic phenotype.
- Therapeutic Potential: High expression on CAFs, and often low expression on normal tissues, makes THY1 an attractive target for selective CAF ablation or neutralization strategies.
- Relevant Therapeutic Agents: Experimental antibodies or antibody-drug conjugates (ADCs) targeting THY1 are being explored in pre-clinical studies for cancer and fibrotic diseases.
- Reference: GeneCards: https://www.genecards.org/cgi-bin/carddisp.pl?gene=THY1
PDGFRB (Platelet-Derived Growth Factor Receptor Beta)
- Signaling Pathways: A receptor tyrosine kinase (RTK) that binds PDGF ligands (e.g., PDGF-B, PDGF-D). Activation leads to downstream signaling through PI3K/Akt, MAPK/ERK, and STAT pathways, promoting cell proliferation, survival, migration, and angiogenesis.
- Role in TME: PDGFRB is a prominent marker of activated CAFs. Its signaling drives fibroblast proliferation, differentiation, and the extensive deposition of extracellular matrix (ECM) components, contributing to tumor desmoplasia. It also plays a role in pericyte recruitment and angiogenesis.
- Therapeutic Potential: PDGFRB is a well-established therapeutic target in various cancers and fibrotic conditions due to its critical role in CAF activation and TME remodeling.
- Relevant Therapeutic Agents: Multi-kinase inhibitors with anti-PDGFR activity, such as imatinib, sunitinib, pazopanib, and nintedanib, are approved for different cancers or fibrosis.
- Reference: GeneCards: https://www.genecards.org/cgi-bin/carddisp.pl?gene=PDGFRB
MMP14 (Matrix Metallopeptidase 14)
- Signaling Pathways: A membrane-anchored matrix metalloproteinase (MT1-MMP) that directly degrades ECM components (e.g., collagen, fibronectin) and activates other MMPs (e.g., pro-MMP2). It also cleaves various cell surface receptors.
- Role in TME: MMP14 is highly expressed by CAFs and is crucial for remodeling the ECM, thereby facilitating tumor cell invasion, intravasation, and metastasis. It also contributes to angiogenesis and immune cell infiltration within the TME.
- Therapeutic Potential: Inhibiting MMP14 activity could impede tumor progression and metastasis by preventing ECM degradation and facilitating immune cell access.
- Relevant Therapeutic Agents: While broad-spectrum MMP inhibitors have faced challenges, more selective MMP14 inhibitors are under preclinical and early clinical investigation.
- Reference: GeneCards: https://www.genecards.org/cgi-bin/carddisp.pl?gene=MMP14
ITGAV (Integrin Alpha V)
- Signaling Pathways: Forms heterodimers with several beta integrin chains (e.g., ITGB1, ITGB3, ITGB5, ITGB6, ITGB8) to recognize RGD motifs in ECM proteins like fibronectin and vitronectin. Integrin ligation activates focal adhesion kinase (FAK) and Src family kinases, regulating cell adhesion, migration, proliferation, and survival.
- Role in TME: Integrin alpha-v containing heterodimers mediate crucial fibroblast-ECM interactions, essential for CAF activation, migration, and the deposition and remodeling of the fibrotic matrix. ITGAV also plays a role in activating latent TGF-β, a key pro-fibrotic and immunosuppressive cytokine.
- Therapeutic Potential: Targeting ITGAV-mediated adhesion and signaling can disrupt CAF function, reduce fibrosis, and limit tumor progression.
- Relevant Therapeutic Agents: RGD-mimetic peptides like cilengitide, which targets αvβ3 and αvβ5 integrins, have been tested in clinical trials for various cancers.
- Reference: GeneCards: https://www.genecards.org/cgi-bin/carddisp.pl?gene=ITGAV
EDNRA (Endothelin Receptor Type A)
- Signaling Pathways: A G protein-coupled receptor (GPCR) that primarily binds endothelin-1 (EDN1). This binding activates diverse downstream pathways including MAPK/ERK, PI3K/Akt, and phospholipase C, leading to vasoconstriction, cell proliferation, angiogenesis, and fibrosis.
- Role in TME: EDNRA signaling in CAFs promotes fibroblast activation, proliferation, and ECM production, contributing to the desmoplastic reaction characteristic of many solid tumors, including colon cancer. It also supports tumor angiogenesis and can influence immune responses.
- Therapeutic Potential: Blockade of EDNRA can reduce tumor growth, angiogenesis, and fibrosis, making it a viable therapeutic target.
- Relevant Therapeutic Agents: Endothelin receptor antagonists (ERAs) such as bosentan and ambrisentan are approved for pulmonary hypertension; selective EDNRA antagonists (e.g., atrasentan) have been investigated in cancer trials.
- Reference: GeneCards: https://www.genecards.org/cgi-bin/carddisp.pl?gene=EDNRA
JAG1 (Jagged Canonical Notch Ligand 1)
- Signaling Pathways: A ligand for Notch receptors (NOTCH1-4). Binding of JAG1 to a Notch receptor on an adjacent cell initiates a proteolytic cascade that releases the Notch intracellular domain (NICD), which then translocates to the nucleus to activate target gene transcription (e.g., HES and HEY family genes).
- Role in TME: CAFs expressing JAG1 can activate Notch signaling in adjacent tumor cells or other stromal cells, influencing cell fate, proliferation, angiogenesis, and stemness. This contributes to tumor growth, resistance to therapy, and maintenance of a pro-tumorigenic TME.
- Therapeutic Potential: Disrupting the JAG1-Notch signaling axis, particularly in CAFs, could suppress tumor progression and overcome therapeutic resistance.
- Relevant Therapeutic Agents: Gamma-secretase inhibitors (GSIs) are a class of drugs that indirectly block Notch signaling by preventing NICD release; Notch pathway blocking antibodies are also under development.
- Reference: GeneCards: https://www.genecards.org/cgi-bin/carddisp.pl?gene=JAG1
ICAM1 (Intercellular Adhesion Molecule 1)
- Signaling Pathways: A cell surface glycoprotein that binds to integrin ligands (LFA-1, Mac-1) on leukocytes, mediating cell-cell adhesion. Involved in leukocyte trafficking, inflammation, and immune responses. Can activate downstream signaling pathways leading to cytokine production.
- Role in TME: Upregulated on various stromal cells, including CAFs, in response to inflammatory cytokines. It facilitates the recruitment and adhesion of immune cells to the TME, which can have both pro- and anti-tumorigenic effects depending on the context. In some tumors, ICAM1 on CAFs can promote immune evasion or facilitate metastasis.
- Therapeutic Potential: Modulating ICAM1 expression or its interaction with immune cells could influence immune infiltration and anti-tumor immunity.
- Relevant Therapeutic Agents: Antibodies targeting ICAM1 or its ligands have been explored for inflammatory diseases; their role in cancer therapy is being investigated for modulating immune responses.
- Reference: GeneCards: https://www.genecards.org/cgi-bin/carddisp.pl?gene=ICAM1
Clinical or Translational Implications
The distinct surfaceome profiles of tumor-associated fibroblasts identified in this analysis have significant clinical and translational implications for colon cancer:
- Biomarker Potential: The highly expressed tumor-specific surface markers (e.g., THY1, PDGFRB, MMP14, ITGAV, EDNRA, JAG1, ICAM1) could serve as novel biomarkers for identifying and characterizing CAFs in colon cancer biopsies. These markers could potentially aid in distinguishing tumor stroma from normal tissue, assessing disease progression, or predicting response to therapy.
- Therapeutic Targets: The prominent and widespread expression of these surface proteins in CAFs suggests their critical role in supporting tumor growth and metastasis. Targeting these markers offers a strategy to inhibit CAF functions, remodel the TME, and potentially enhance the efficacy of existing cancer treatments.
- Direct Targeting: Strategies such as antibody-drug conjugates (ADCs) or CAR-T cell therapies could be engineered to specifically target surface markers like THY1 or PDGFRB on CAFs, leading to their selective depletion or functional inhibition.
- Pathway Inhibition: Inhibitors against key signaling pathways (e.g., PDGFRB, EDNRA) or enzymes (e.g., MMP14) frequently activated in CAFs could reduce desmoplasia, improve drug delivery to the tumor core, and attenuate pro-tumorigenic signaling.
- Immunomodulation: Modulating adhesion molecules like ICAM1 or signaling pathways like Notch (via JAG1) on CAFs could alter immune cell infiltration and function within the TME, potentially turning an immunosuppressive environment into an immunostimulatory one.
- Combination Therapies: Targeting CAFs alongside tumor cells might overcome resistance mechanisms and lead to more durable responses, particularly in desmoplastic tumors like colon adenocarcinoma, where CAFs are abundant and highly influential.
- Diagnostic and Prognostic Tool: The unique expression patterns could be developed into diagnostic tools (e.g., using immunohistochemistry or flow cytometry on biopsies) to identify subsets of colon cancers with a highly activated CAF compartment, which might correlate with more aggressive disease or different treatment responses.
Overall, this analysis provides a valuable resource for understanding CAF heterogeneity in colon cancer and highlights several compelling surfaceome-expressed candidates for further investigation as diagnostic markers and therapeutic targets.
17. T cell CD4+ Condition-Specific Surfaceome Markers in Colon Tissue
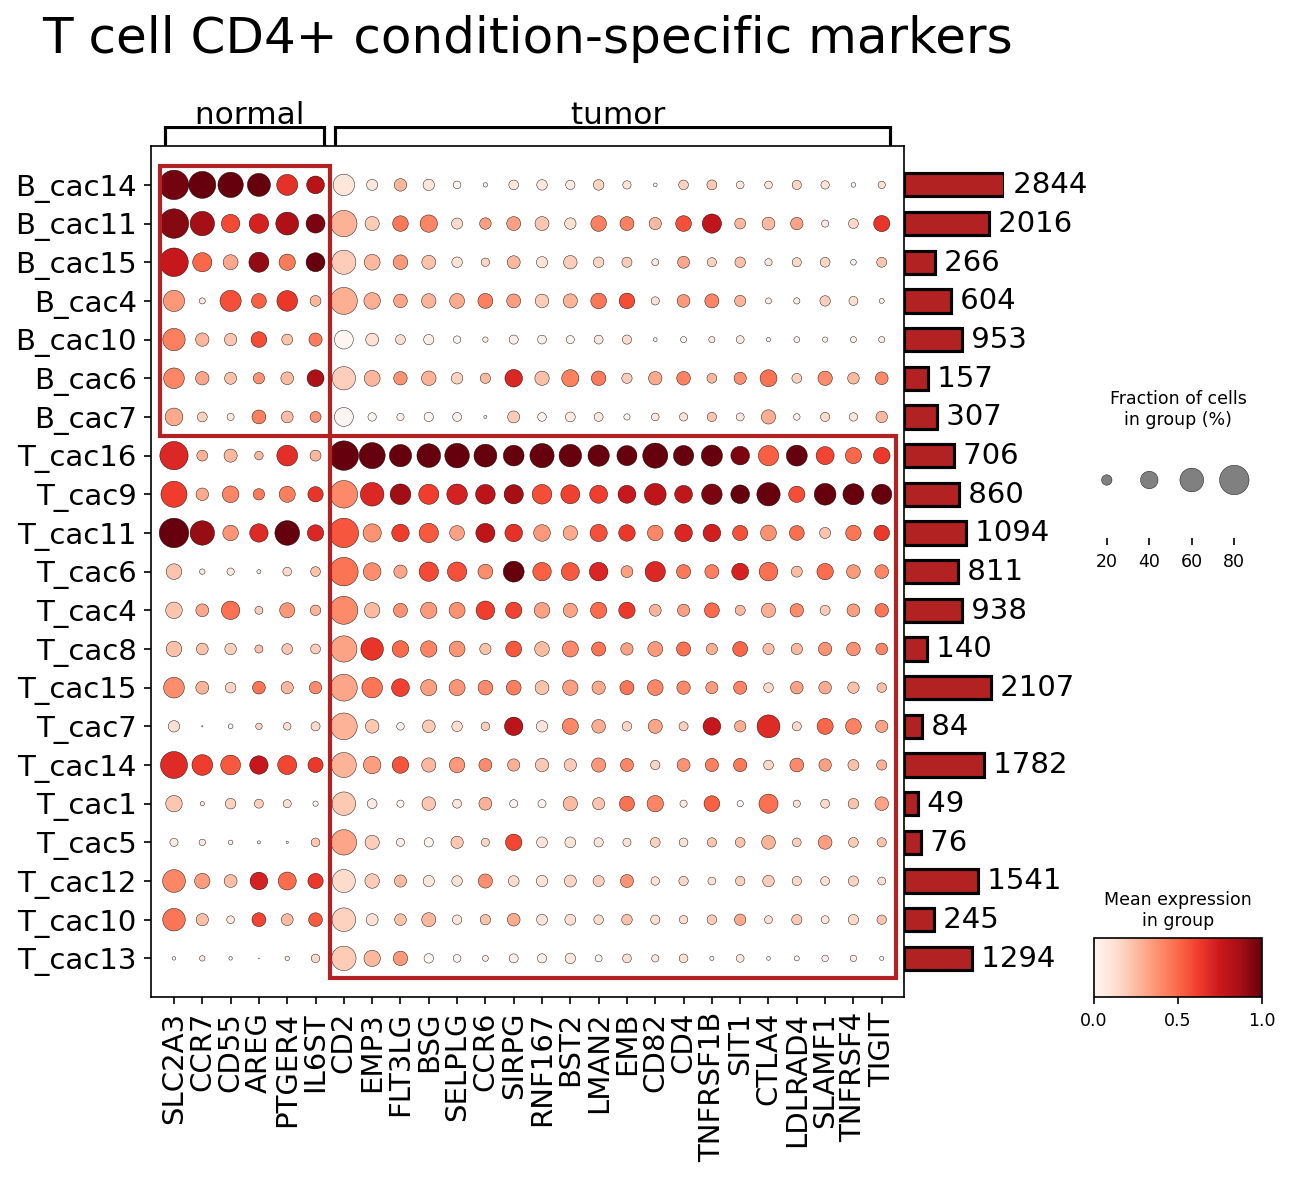
[Analysis Visualization Results]...
Analysis Overview
This analysis identifies condition-specific surfaceome markers within the T cell CD4+ population from single-cell RNA-seq data derived from human colon tissue, comparing 'normal' and 'tumor' conditions. The dot plot visualizes the expression of 26 selected surfaceome genes across different T cell CD4+ subclusters. Circle size represents the fraction of cells expressing the marker, while color intensity indicates the mean expression level within each cluster. The primary goal is to identify markers that distinguish CD4+ T cell states and functions in the tumor microenvironment (TME) versus normal tissue.
Visual Summary
The dot plot clearly segregates T cell CD4+ subclusters and their marker expression patterns based on the 'normal' and 'tumor' conditions.
- Normal Condition-Enriched Clusters and Markers: A group of CD4+ T cell clusters (labeled B_cac14, B_cac11, B_cac15, B_cac4, B_cac10, B_cac6, B_cac7) exhibit high expression of specific markers predominantly in the 'normal' condition. Key markers in these clusters include SLC2A3, CCR7, CD55, AREG, PTGER4, and IL6ST. These markers show significantly lower or absent expression in tumor-associated T cell CD4+ clusters.
- Tumor Condition-Enriched Clusters and Markers: A larger group of CD4+ T cell clusters (labeled T_cac16, T_cac9, T_cac11, T_cac6, T_cac4, T_cac8, T_cac15, T_cac7, T_cac14, T_cac1, T_cac5, T_cac12, T_cac10, T_cac13) display high expression of a distinct set of markers primarily in the 'tumor' condition. Prominent tumor-enriched markers include EMP3, FLT3LG, BSG, SELPLG, CCR6, SIRPG, RNF167, BST2, LMAN2, EMB, CD82, TNFRSF1B, SIT1, CTLA4, LDLRAD4, SLAMF1, TNFRSF4, and TIGIT. Many of these are associated with T cell activation, exhaustion, or specific TME interactions.
- Ubiquitous Markers: Core T cell markers such as CD3 (T cell receptor complex component) and CD4 (co-receptor defining helper T cells) are broadly expressed across most T cell CD4+ clusters in both normal and tumor conditions, as expected, confirming their identity as CD4+ T cells.
The differential expression patterns highlight distinct phenotypic and functional states of T cell CD4+ populations in response to the tumor microenvironment.
Biological Interpretation
The observed differential expression of surfaceome markers in T cell CD4+ subsets between normal and tumor conditions suggests significant shifts in T cell function, trafficking, and interaction within the colon cancer microenvironment. The inferred disease context is Colon cancer, with Intestinal Epithelial cells identified as the tumor-origin cell type, and a significant aneuploid population observed. CD4+ T cells play a crucial role in orchestrating immune responses, and their phenotype can dictate the outcome of anti-tumor immunity or immune evasion.
Here is an interpretation of the identified surfaceome markers:
Markers Predominantly Expressed in Normal CD4+ T cell Clusters
These markers are generally indicative of a homeostatic, naive, or central memory phenotype, or T cells involved in normal tissue function and immune surveillance.
SLC2A3 (GLUT3)
- Associated Signaling Pathways: Glucose transport; involved in metabolic reprogramming.
- Role in TME: GLUT3 is a high-affinity glucose transporter. T cells undergo metabolic shifts upon activation. High expression in normal T cells might indicate a specific metabolic state or their readiness for activation. In the TME, glucose competition can impact T cell function.
- Therapeutic Potential: Targeting T cell metabolism is an emerging strategy to enhance anti-tumor immunity, though SLC2A3 itself is not a direct therapeutic target.
- Other Information: Crucial for rapid glucose uptake in highly glycolytic cells. SLC2A3 on GeneCards
CCR7
- Associated Signaling Pathways: G protein-coupled receptor (GPCR) signaling; binds chemokines CCL19 and CCL21, mediating chemotaxis.
- Role in TME: CCR7 is characteristic of naive T cells and central memory T cells, guiding them to secondary lymphoid organs (e.g., lymph nodes, Peyer's patches in the gut) for antigen encounter. Its high expression in normal colon T cells suggests a circulating or lymphoid-resident phenotype, not yet fully activated or differentiated into effector cells that have migrated into non-lymphoid tissues.
- Therapeutic Potential: Modulating T cell trafficking could impact immune responses, but CCR7 is not a primary direct target for boosting anti-tumor immunity in the TME.
- Other Information: A key marker for distinguishing naive/central memory T cells from effector T cells. CCR7 on UniProt
CD55 (DAF)
- Associated Signaling Pathways: Complement cascade regulation; it binds C3b and C4b, preventing the formation of C3 and C5 convertases.
- Role in TME: CD55 acts as a complement regulatory protein, protecting host cells from complement-mediated lysis. Its presence on T cells in normal tissue helps maintain immune homeostasis by preventing bystander damage. In the TME, its expression on tumor cells can help them evade complement attack, but its role on T cells is primarily protective.
- Therapeutic Potential: Not a direct target for cancer immunotherapy on T cells, but its role in complement evasion is relevant for tumor cells.
- Other Information: Also known as Decay-Accelerating Factor (DAF). CD55 on GeneCards
AREG (Amphiregulin)
- Associated Signaling Pathways: Epidermal Growth Factor Receptor (EGFR) signaling; binds EGFR, activating MAPK/ERK and PI3K/Akt pathways.
- Role in TME: While best known as a growth factor for epithelial cells, AREG can be produced by immune cells, including T cells. Its expression by T cells in normal tissue might be involved in tissue repair or modulating local immune responses. In cancer, AREG can promote tumor growth and survival by activating EGFR on tumor cells.
- Therapeutic Potential: EGFR is a major target in many cancers (e.g., cetuximab), but targeting AREG specifically on T cells is not a primary strategy.
- Other Information: A member of the EGF family of growth factors. AREG on GeneCards
PTGER4 (EP4)
- Associated Signaling Pathways: G protein-coupled receptor signaling; binds prostaglandin E2 (PGE2). Activates adenylate cyclase and increases cAMP levels.
- Role in TME: PGE2 is a pro-inflammatory mediator, often highly abundant in the TME. Activation of EP4 on T cells can lead to immunosuppression, inhibiting T cell proliferation and cytokine production. High expression in normal cells might suggest a regulatory role to prevent excessive inflammation.
- Therapeutic Potential: Targeting the PGE2-EP4 axis is being investigated to reverse immune suppression in cancer.
- Other Information: Other PGE2 receptors (EP1, EP2, EP3) have varied effects. PTGER4 on UniProt
IL6ST (GP130)
- Associated Signaling Pathways: Common signal transducing subunit for the IL-6 cytokine family (e.g., IL-6, IL-11, LIF, OSM, CNTF). Activates JAK/STAT3, MAPK, and PI3K/Akt pathways.
- Role in TME: IL-6 signaling, transduced via GP130, is crucial for immune cell differentiation and function, including T cells. In the TME, IL-6 is often pro-tumorigenic, promoting inflammation, angiogenesis, and tumor cell survival. Its presence on normal T cells indicates responsiveness to these cytokines, which can be altered in cancer.
- Therapeutic Potential: Targeting IL-6/GP130 signaling (e.g., tocilizumab for IL-6R) is used in inflammatory diseases and explored in cancer to block pro-tumorigenic inflammation.
- Other Information: Essential for diverse cellular processes due to its role in cytokine signaling. IL6ST on GeneCards
Markers Predominantly Expressed in Tumor CD4+ T cell Clusters
These markers are often associated with T cell activation, differentiation, exhaustion, or specific TME adaptation, indicative of their interaction with tumor cells and other stromal cells.
EMP3 (Epithelial Membrane Protein 3)
- Associated Signaling Pathways: Involved in cell adhesion and growth inhibition, though specific pathways on T cells are less well-defined.
- Role in TME: While originally identified in neural tissues, EMP3 can be expressed by various cell types. Its role on T cells in the TME is not fully elucidated but may relate to cell-cell interactions or modulating cell proliferation/survival in the inflammatory context.
- Therapeutic Potential: Not currently a direct therapeutic target.
- Other Information: A member of the Peripheral Myelin Protein 22 (PMP22) family. EMP3 on GeneCards
FLT3LG (Fms-like Tyrosine Kinase 3 Ligand)
- Associated Signaling Pathways: Binds to FLT3 receptor (a receptor tyrosine kinase), activating downstream signaling pathways like MAPK/ERK and PI3K/Akt.
- Role in TME: FLT3LG is a cytokine important for the development of hematopoietic stem cells, dendritic cells, and NK cells. Its expression on T cells (as a ligand) might indicate a role in stimulating antigen-presenting cells within the TME, potentially influencing subsequent anti-tumor responses.
- Therapeutic Potential: FLT3 is a target in certain leukemias, but FLT3LG on T cells is not a primary cancer therapeutic target.
- Other Information: Can enhance dendritic cell-mediated anti-tumor immunity. FLT3LG on UniProt
BSG (CD147, Basigin)
- Associated Signaling Pathways: Involved in cell adhesion, migration, and signal transduction; known to induce matrix metalloproteinases (MMPs) in stromal cells. Interacts with cyclophilins.
- Role in TME: On T cells, BSG can contribute to T cell activation, proliferation, and migration. Its ability to induce MMPs in other cells can facilitate tumor invasion and metastasis, thus indirectly impacting TME remodeling. High expression suggests activated T cells with potential roles in immune cell-extracellular matrix interactions.
- Therapeutic Potential: Anti-CD147 antibodies have been explored as therapeutic agents in cancer, primarily targeting tumor cells, but blocking its function on immune cells could also modulate the TME.
- Therapeutic Agents: Metuximab (anti-CD147 antibody) has been explored. BSG on GeneCards
SELPLG (CD162, PSGL-1)
- Associated Signaling Pathways: Involved in leukocyte rolling and adhesion to endothelial cells; binds to selectins (P-selectin, E-selectin).
- Role in TME: SELPLG is a ligand for selectins, mediating the initial adhesion of leukocytes to endothelial cells, crucial for immune cell extravasation into inflamed or cancerous tissues. Its presence indicates the migratory potential of T cells to enter the tumor site.
- Therapeutic Potential: Modulating cell adhesion molecules can affect immune cell infiltration, but SELPLG itself is not a direct therapeutic target in cancer.
- Other Information: Plays a critical role in inflammation and immune surveillance. SELPLG on UniProt
CCR6
- Associated Signaling Pathways: G protein-coupled receptor (GPCR) signaling; binds chemokine CCL20, mediating chemotaxis.
- Role in TME: CCR6 is known for its role in recruiting specific T cell subsets, notably Th17 cells and some regulatory T cells (Tregs), to sites of inflammation and tumors. In the colon, Th17 cells can have dual roles (pro- or anti-tumorigenic), while Tregs are generally immunosuppressive. Its high expression in tumor-associated T cells suggests active recruitment of these subsets to the colon TME.
- Therapeutic Potential: Targeting chemokine axes like CCR6/CCL20 could modulate the infiltration of specific T cell populations, aiming to shift the immune balance towards anti-tumor responses.
- Other Information: Involved in mucosal immunity. CCR6 on GeneCards
SIRPG (Signal Regulatory Protein Gamma)
- Associated Signaling Pathways: Involved in cell-cell recognition and adhesion, and modulating immune cell activation; interacts with CD47.
- Role in TME: SIRPG is expressed on T cells and interacts with CD47 (a "don't eat me" signal) expressed on tumor cells and other host cells. This interaction can modulate T cell activation and differentiation. Its specific role in the TME is complex, potentially influencing T cell effector functions or tolerance.
- Therapeutic Potential: CD47-SIRPα axis is a major target for myeloid cells (macrophages), and SIRPG's role on T cells might also be relevant for broader immune checkpoint modulation.
- Other Information: Part of the SIRP family, often involved in inhibitory signaling. SIRPG on GeneCards
RNF167 (Ring Finger Protein 167)
- Associated Signaling Pathways: E3 ubiquitin ligase, involved in protein ubiquitination, which can regulate protein stability, localization, and activity, including in immune signaling.
- Role in TME: As an E3 ubiquitin ligase, RNF167's expression on T cells in the TME could indicate its involvement in regulating specific protein degradation pathways critical for T cell activation, differentiation, or survival within the stressful tumor environment. Specific substrates and their impact on T cell function need further study.
- Therapeutic Potential: Ubiquitin ligases are increasingly recognized as drug targets, but RNF167's specific role in cancer immunity is still emerging.
- Other Information: Implicated in various cellular processes. RNF167 on GeneCards
BST2 (CD317, PDCA-1)
- Associated Signaling Pathways: Involved in innate immune responses, restriction of viral budding, and antigen presentation.
- Role in TME: BST2 (Bone Marrow Stromal Antigen 2), also known as tetherin, is an interferon-inducible protein. Its expression on T cells in the TME might indicate a response to inflammatory cytokines (e.g., interferons) or a role in modulating immune cell interactions, potentially in an anti-viral or anti-tumor context. It's often highly expressed on plasmacytoid dendritic cells (pDCs).
- Therapeutic Potential: Not a direct therapeutic target on T cells for cancer, but modulation of innate immune responses is relevant.
- Other Information: Known for restricting HIV-1 release. BST2 on UniProt
LMAN2 (Lectin, Mannose-Binding 2)
- Associated Signaling Pathways: Involved in protein trafficking within the endoplasmic reticulum (ER) and Golgi apparatus; a cargo receptor.
- Role in TME: While primarily an intracellular protein involved in protein quality control and transport, surface expression of LMAN2 on T cells could indicate an atypical activation state or a role in specific cell surface interactions not yet fully characterized. Its precise role on the T cell surface in the TME is unclear.
- Therapeutic Potential: Unlikely to be a direct therapeutic target.
- Other Information: Also known as VIP36. LMAN2 on GeneCards
EMB (Embigin)
- Associated Signaling Pathways: A member of the immunoglobulin superfamily, involved in cell adhesion and neural development; can interact with basigin (CD147).
- Role in TME: Given its role in cell adhesion and interaction with BSG (also upregulated in tumor T cells), EMB expression on T cells could facilitate their interactions with other cells in the TME, influencing T cell activation, migration, or survival.
- Therapeutic Potential: Not a direct therapeutic target on T cells.
- Other Information: Its interaction with CD147 suggests a potential role in regulating MMP activity or other CD147-mediated functions. EMB on GeneCards
CD82 (KAI1)
- Associated Signaling Pathways: Tetraspanin family member; involved in cell-cell adhesion, motility, and signal transduction by organizing membrane microdomains and interacting with integrins and growth factor receptors.
- Role in TME: CD82 is often recognized as a metastasis suppressor gene in many cancers. On T cells, it's associated with T cell activation, differentiation, and migration. Its expression in tumor-associated T cells could reflect T cells actively migrating or interacting with tumor cells and the extracellular matrix.
- Therapeutic Potential: Not a direct therapeutic target on T cells, but a marker providing insights into T cell migratory and adhesive properties.
- Other Information: Can inhibit cell motility and invasion. CD82 on UniProt
TNFRSF1B (TNFR2)
- Associated Signaling Pathways: TNF receptor superfamily member; binds TNF-α, activating NF-κB and MAPK pathways, primarily mediating pro-survival and anti-apoptotic signals.
- Role in TME: TNFR2 is highly expressed on regulatory T cells (Tregs) and often on activated effector T cells. In the TME, it plays a critical role in the survival, proliferation, and suppressive function of Tregs, contributing significantly to immune tolerance and evasion. Its expression on tumor-associated CD4+ T cells points towards a more suppressive or anergic phenotype.
- Therapeutic Potential: Blocking TNFR2 can inhibit Treg function and enhance anti-tumor immunity. It is an emerging immune checkpoint target.
- Therapeutic Agents: Anti-TNFR2 antibodies are in preclinical and early clinical development. TNFRSF1B on GeneCards, TNFR2 in cancer PubMed
SIT1 (SHP2-Interacting Transmembrane Adaptor Protein 1)
- Associated Signaling Pathways: Involved in T cell receptor (TCR) signaling; acts as a negative regulator, recruiting phosphatases (e.g., SHP2) to inhibit TCR signaling.
- Role in TME: SIT1's expression on tumor-associated T cells suggests a mechanism for attenuating T cell activation. In the TME, where T cells are often exposed to chronic antigen stimulation and inhibitory signals, SIT1 could contribute to T cell exhaustion or anergy, limiting effective anti-tumor responses.
- Therapeutic Potential: Targeting negative regulators of TCR signaling could potentially enhance T cell anti-tumor function, but SIT1 is not a direct therapeutic target.
- Other Information: Also known as T cell-specific adapter protein (TSAP). SIT1 on GeneCards
CTLA4 (Cytotoxic T-Lymphocyte Associated Protein 4)
- Associated Signaling Pathways: Immune checkpoint receptor; binds CD80/CD86 on antigen-presenting cells (APCs), outcompeting CD28 and delivering an inhibitory signal that dampens T cell activation.
- Role in TME: CTLA4 is a crucial negative regulator of T cell activation, often upregulated on activated T cells and regulatory T cells (Tregs) in the TME. Its high expression on tumor-associated CD4+ T cells is a strong indicator of immune suppression, T cell exhaustion, or the presence of immunosuppressive Tregs, contributing significantly to tumor immune evasion.
- Therapeutic Potential: Well-established immune checkpoint blockade target. Blocking CTLA4 enhances T cell activation and anti-tumor immunity.
- Therapeutic Agents: Ipilimumab (Yervoy), Tremelimumab (Imjudo) – anti-CTLA-4 monoclonal antibodies. CTLA4 on GeneCards, Ipilimumab for cancer PubMed
LDLRAD4 (Low-Density Lipoprotein Receptor-Related Protein 4)
- Associated Signaling Pathways: Involved in various cellular processes including cell adhesion and receptor signaling; potentially interacts with other cell surface receptors.
- Role in TME: The precise role of LDLRAD4 on T cells in the TME is not fully characterized. Given its function in adhesion and signaling, it might contribute to T cell interactions with tumor cells or stromal components, or influence T cell activation.
- Therapeutic Potential: Not a direct therapeutic target.
- Other Information: A transmembrane protein with roles in various tissues. LDLRAD4 on GeneCards
SLAMF1 (CD150, SLAM)
- Associated Signaling Pathways: Signaling Lymphocytic Activation Molecule Family member; involved in self-ligand recognition and homotypic cell interactions, leading to co-stimulatory signals for T cells and B cells.
- Role in TME: SLAMF1 is a co-stimulatory molecule, and its expression on tumor-associated T cells suggests active intercellular communication within the TME, potentially enhancing T cell effector functions or contributing to their differentiation.
- Therapeutic Potential: Modulating SLAM family receptors is being explored to enhance immune responses.
- Other Information: Plays a role in bridging innate and adaptive immunity. SLAMF1 on UniProt
TNFRSF4 (OX40)
- Associated Signaling Pathways: TNF receptor superfamily member; binds OX40L (TNFSF4) on APCs, delivering a co-stimulatory signal that promotes T cell survival, proliferation, and cytokine production, and inhibits T cell apoptosis. Activates NF-κB and Akt pathways.
- Role in TME: OX40 is typically upregulated on activated CD4+ and CD8+ T cells. Its high expression in tumor-associated T cells suggests active T cell stimulation within the TME. While often associated with anti-tumor immunity, the presence of inhibitory receptors (CTLA4, TIGIT) indicates a complex balance.
- Therapeutic Potential: A promising co-stimulatory target for cancer immunotherapy. Agonistic anti-OX40 antibodies aim to boost anti-tumor T cell responses.
- Therapeutic Agents: Agonistic anti-OX40 antibodies (e.g., BMS-986178, MOXR0916) are in clinical trials. TNFRSF4 on GeneCards, OX40 agonist in cancer PubMed
TIGIT (T cell Immunoreceptor with Ig and ITIM domains)
- Associated Signaling Pathways: Immune checkpoint receptor; binds PVR (CD155) and Nectin-2 (CD112) on APCs and tumor cells, delivering an inhibitory signal that suppresses T cell activation and proliferation, similar to CTLA4.
- Role in TME: TIGIT is a relatively new but significant immune checkpoint, often co-expressed with other inhibitory receptors like PD-1 on exhausted T cells and Tregs in the TME. Its high expression indicates a suppressive phenotype contributing to immune evasion in colon cancer.
- Therapeutic Potential: Emerging immune checkpoint blockade target. Blocking TIGIT can enhance T cell anti-tumor responses, particularly in combination with anti-PD-1 therapy.
- Therapeutic Agents: Multiple TIGIT-blocking antibodies (e.g., Tiragolumab, Vibostolimab) are in clinical development. TIGIT on GeneCards, TIGIT immunotherapy cancer PubMed
Markers Ubiquitously Expressed Across CD4+ T cell Clusters
These are fundamental markers for identifying and classifying T cells.
CD3
- Associated Signaling Pathways: Component of the T cell receptor (TCR) complex; involved in antigen recognition and initiation of downstream signaling (e.g., ZAP70, LCK, MAPK, PI3K/Akt pathways) leading to T cell activation.
- Role in TME: Essential for T cell function and recognition of tumor antigens. Its ubiquitous expression confirms the cellular identity as T cells.
- Therapeutic Potential: Not a direct therapeutic target for enhancing anti-tumor immunity on T cells, but antibodies targeting CD3 are used in bispecific antibodies (e.g., blinatumomab) to redirect T cells to tumor cells.
- Other Information: A pan-T cell marker. CD3G on GeneCards
CD4
- Associated Signaling Pathways: Co-receptor for the TCR, primarily on helper T cells; binds to MHC class II molecules on APCs, enhancing TCR signaling and recruiting Lck kinase.
- Role in TME: Defines the helper T cell lineage, crucial for orchestrating adaptive immune responses, including B cell help, macrophage activation, and CD8+ T cell priming. Its ubiquitous expression confirms the cellular identity as CD4+ T cells.
- Therapeutic Potential: Not a direct therapeutic target in cancer.
- Other Information: Essential for recognizing antigens presented by MHC class II. CD4 on UniProt
Clinical or Translational Implications
The distinct surfaceome profiles of CD4+ T cells in normal versus tumor colon tissue have significant clinical and translational implications for colon cancer:
- Biomarker Identification: The identified tumor-enriched markers (e.g., CTLA4, TIGIT, TNFRSF4, TNFRSF1B, BSG, CCR6) serve as potential biomarkers to distinguish tumor-infiltrating CD4+ T cells (TILs) from T cells in healthy tissue. These markers could be used for patient stratification, predicting response to immunotherapy, or monitoring disease progression.
- Therapeutic Targets for Immunotherapy:
- Immune Checkpoint Blockade: The strong upregulation of inhibitory receptors like CTLA4 and TIGIT on tumor-associated CD4+ T cells highlights their critical role in immune suppression within the colon TME. These findings strongly support the rationale for utilizing anti-CTLA4 (e.g., ipilimumab) and anti-TIGIT antibodies (e.g., tiragolumab) to reactivate exhausted T cells and unleash anti-tumor immunity in colon cancer patients. Combinatorial approaches with other checkpoint inhibitors (e.g., anti-PD-1/PD-L1) may be particularly effective.
- Co-stimulatory Agonists: The concomitant expression of co-stimulatory receptors like TNFRSF4 (OX40) suggests that a subset of these T cells might be amenable to activation strategies. Agonistic anti-OX40 antibodies could be employed to enhance T cell survival, proliferation, and effector functions, tipping the balance towards anti-tumor immunity.
- Modulating Treg Activity: The upregulation of TNFRSF1B (TNFR2), which is crucial for Treg survival and suppressive function, indicates a potential strategy to reduce the immunosuppressive burden in the TME by blocking TNFR2 signaling. Similarly, blocking CCR6 could alter the recruitment of immunosuppressive Tregs.
- Targeting TME Interactions: Markers like BSG (CD147) and SELPLG suggest T cell interactions with the tumor microenvironment. While not direct T cell targets for activation, understanding these interactions could inform strategies to remodel the TME or enhance T cell infiltration.
- Understanding T Cell Plasticity and Exhaustion: The shift from a largely CCR7+ (naive/central memory) phenotype in normal tissue to T cells expressing multiple activation/exhaustion markers (CTLA4, TIGIT, OX40, TNFR2) in tumors reflects the adaptation and functional changes of CD4+ T cells in the hostile colon cancer microenvironment. This highlights the complex interplay of activation and suppression that dictates the overall anti-tumor immune response. Further characterization of these CD4+ subsets (e.g., Th1, Th17, Treg, exhausted) could refine therapeutic strategies.
- Drug Development: These identified surfaceome markers provide a rich resource for developing novel immunotherapies, including antibody-drug conjugates, CAR-T cell targets, or bispecific antibodies that specifically engage or deplete distinct T cell CD4+ subsets based on their expression profile in the tumor.
Overall, this analysis provides a clear molecular signature of CD4+ T cells in the colon cancer microenvironment, offering valuable insights for the development of targeted immunotherapeutic strategies.
18. Differential Expression of Cell Cycle Genes in Intestinal Epithelial Cells in Colon Cancer
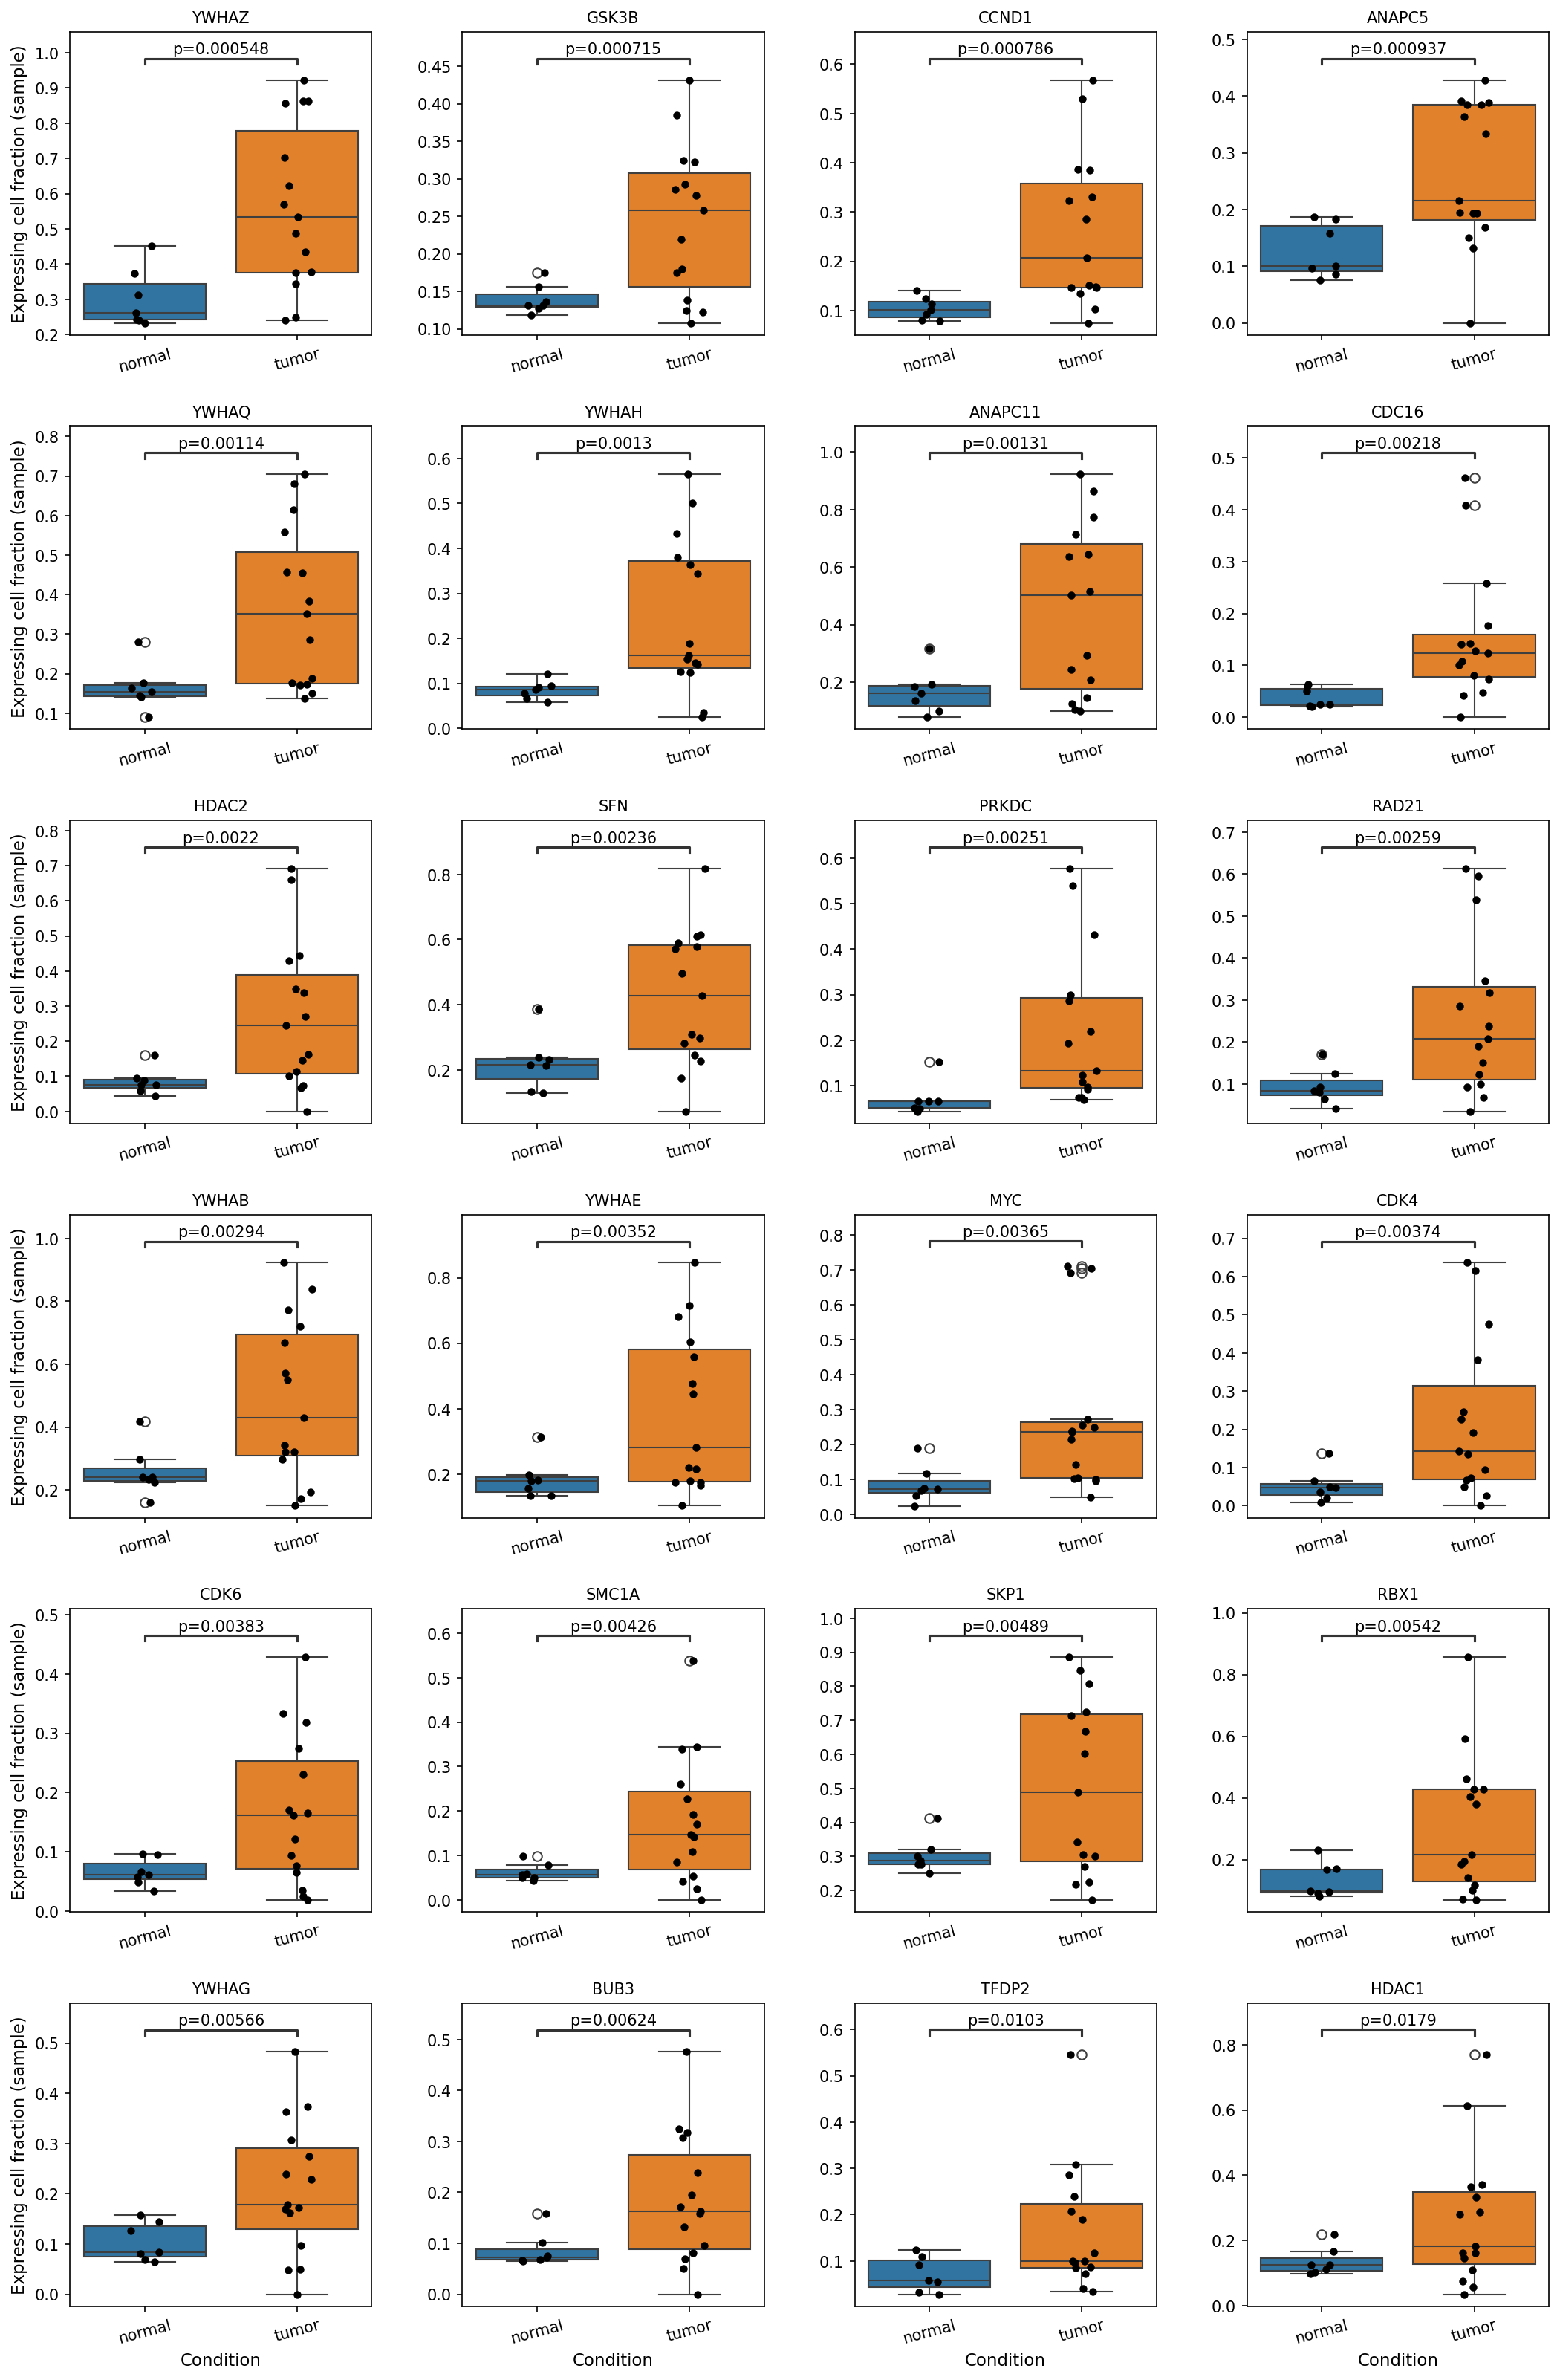
[Analysis Visualization Results]...
Analysis Overview
This analysis investigates the differential expression of a curated set of cell cycle pathway genes in Intestinal Epithelial cells, comparing 'normal' and 'tumor' conditions. The plot_box_for_gene_expression_with_signif_difference tool was used to identify and visualize genes with statistically significant expression differences. A total of 24 genes, chosen from the specified cell cycle pathway list based on their significant differential expression (p-value < 0.05), are displayed. The visualization presents box plots showing the "Expressing cell fraction (sample)" for each gene across normal and tumor samples.
Visual Summary
The visualization displays box plots for 24 distinct cell cycle-related genes, comparing their expression in Intestinal Epithelial cells from 'normal' versus 'tumor' samples.
- Consistent Upregulation in Tumor: For all 24 genes presented, there is a clear and statistically significant (indicated by low p-values, e.g., YWHAZ p=0.000548, GSK3B p=0.000715, CCND1 p=0.000786) increase in the "Expressing cell fraction (sample)" within the 'tumor' condition compared to the 'normal' condition. This means a higher proportion of Intestinal Epithelial cells in tumor samples express these genes.
- Higher Expression Levels: Beyond a higher fraction of expressing cells, the box plots also indicate generally higher median expression levels and broader distributions (interquartile ranges) in the tumor samples for most of these genes, suggesting not only more cells express them but also potentially at higher levels on average.
- Variety of Cell Cycle Regulators: The selected genes cover a broad spectrum of cell cycle regulation, including cyclins (e.g., CCND1), cyclin-dependent kinases (CDK4, CDK6), components of the anaphase-promoting complex (ANAPC5, ANAPC11), DNA damage response/repair proteins (RAD21, PRKDC), cell cycle checkpoints (BUB3, SFN), signaling molecules (GSK3B, YWHAZ family), and epigenetic modifiers (HDAC1, HDAC2), as well as the oncogene MYC.
Biological Interpretation
The observed widespread and significant upregulation of numerous cell cycle genes in Intestinal Epithelial cells within tumor samples strongly supports the inferred diagnosis of Colon cancer. Cancer is fundamentally characterized by uncontrolled cell proliferation, which relies on the dysregulation and hyperactivation of the cell cycle machinery.
- Increased Proliferation: Genes like CCND1 (Cyclin D1), CDK4, and CDK6 are key drivers of the G1-S phase transition, promoting cell cycle entry and progression [1]. Their upregulation in tumor-derived Intestinal Epithelial cells indicates enhanced proliferative activity, a hallmark of malignancy.
- Chromosome Segregation and Stability: Genes such as ANAPC5, ANAPC11, CDC16 (components of the Anaphase-Promoting Complex/Cyclosome, APC/C), BUB3, RAD21, and SMC1A are crucial for proper chromosome segregation, spindle assembly, and sister chromatid cohesion during mitosis [2]. Their altered expression in tumor cells could reflect attempts to manage rapid division, or conversely, contribute to chromosomal instability and aneuploidy, which is consistent with the observed 6.1% aneuploid cells in the dataset.
- DNA Damage Response and Repair: PRKDC (DNA-PKcs) and SFN (14-3-3 sigma) are involved in DNA repair and cell cycle checkpoint control [3]. Their increased expression could reflect higher DNA damage rates due to rapid proliferation or genomic instability inherent to cancer cells.
- Oncogenic Signaling: MYC is a potent oncogene that regulates cell growth, proliferation, and apoptosis [4]. Its upregulation is a common event in many cancers, including colon cancer, and contributes significantly to tumor development and progression.
- Epigenetic Remodeling: HDAC1 and HDAC2 are histone deacetylases involved in chromatin remodeling and gene expression regulation [5]. Their increased expression in tumor cells suggests altered epigenetic landscapes that can promote oncogene expression or suppress tumor suppressor genes, contributing to uncontrolled growth.
- Signaling and Protein Regulation: Genes from the YWHA (14-3-3 protein) family (YWHAZ, YWHAQ, YWHAH, YWHAB, YWHAE, YWHAG) are adapter proteins that regulate diverse cellular processes, including cell cycle, apoptosis, and signal transduction [6]. Their consistent upregulation suggests widespread cellular reprogramming in tumor cells affecting multiple signaling pathways critical for survival and proliferation. GSK3B is a kinase involved in numerous pathways, including Wnt signaling, which is frequently dysregulated in colon cancer [7].
The coordinated upregulation of these diverse cell cycle-related genes in the tumor-origin Intestinal Epithelial cells provides strong evidence for enhanced and dysregulated proliferative processes characteristic of colon cancer.
Clinical or Translational Implications
The comprehensive upregulation of cell cycle pathway genes in tumor-derived Intestinal Epithelial cells has several clinical and translational implications:
- Diagnostic and Prognostic Biomarkers: The identified genes, particularly those with the most significant and consistent upregulation (e.g., CCND1, MYC, CDK4, HDACs, and members of the YWHA family), could serve as potential diagnostic or prognostic biomarkers for colon cancer. Elevated expression in biopsies could indicate malignancy or aggressive disease.
- Therapeutic Targets: Many of these genes represent established or emerging therapeutic targets in oncology:
- CDK4/6 inhibitors: Already approved for breast cancer, targeting CDK4 and CDK6 could be a strategy in colon cancer, especially given their upregulation [8].
- HDAC inhibitors: Drugs targeting HDAC1 and HDAC2 are used in various hematological malignancies and are under investigation for solid tumors [9].
- MYC inhibitors: Directly targeting MYC remains challenging, but strategies to indirectly inhibit MYC activity are actively pursued [4].
- Cell cycle checkpoint inhibitors: Targeting components like BUB3 or DNA damage response proteins could sensitize cancer cells to chemotherapy or radiation.
- Understanding Resistance: Further studies investigating the specific isoforms or interacting partners of these proteins could provide insights into mechanisms of therapeutic resistance in colon cancer.
This analysis highlights the profound alteration of the cell cycle machinery in colon cancer and identifies multiple avenues for potential clinical exploitation.
References
- Cyclins and CDKs: PubMed search for "cyclin cdk cell cycle cancer"
- APC/C, Chromosome Segregation: PubMed search for "ANAPC BUB RAD21 SMC1A chromosome segregation cancer"
- DNA Damage Response (PRKDC, SFN): GeneCards: SFN, GeneCards: PRKDC
- MYC Oncogene: GeneCards: MYC
- HDACs: GeneCards: HDAC1, GeneCards: HDAC2
- 14-3-3 Proteins (YWHA family): PubMed search for "14-3-3 protein cell cycle cancer"
- GSK3B and Wnt Signaling: GeneCards: GSK3B
- CDK4/6 Inhibitors in Cancer: PubMed search for "CDK4/6 inhibitors cancer"
- HDAC Inhibitors in Cancer: PubMed search for "HDAC inhibitors cancer"
19. Gene Ontology (GSA) Analysis for Intestinal Epithelial Cells
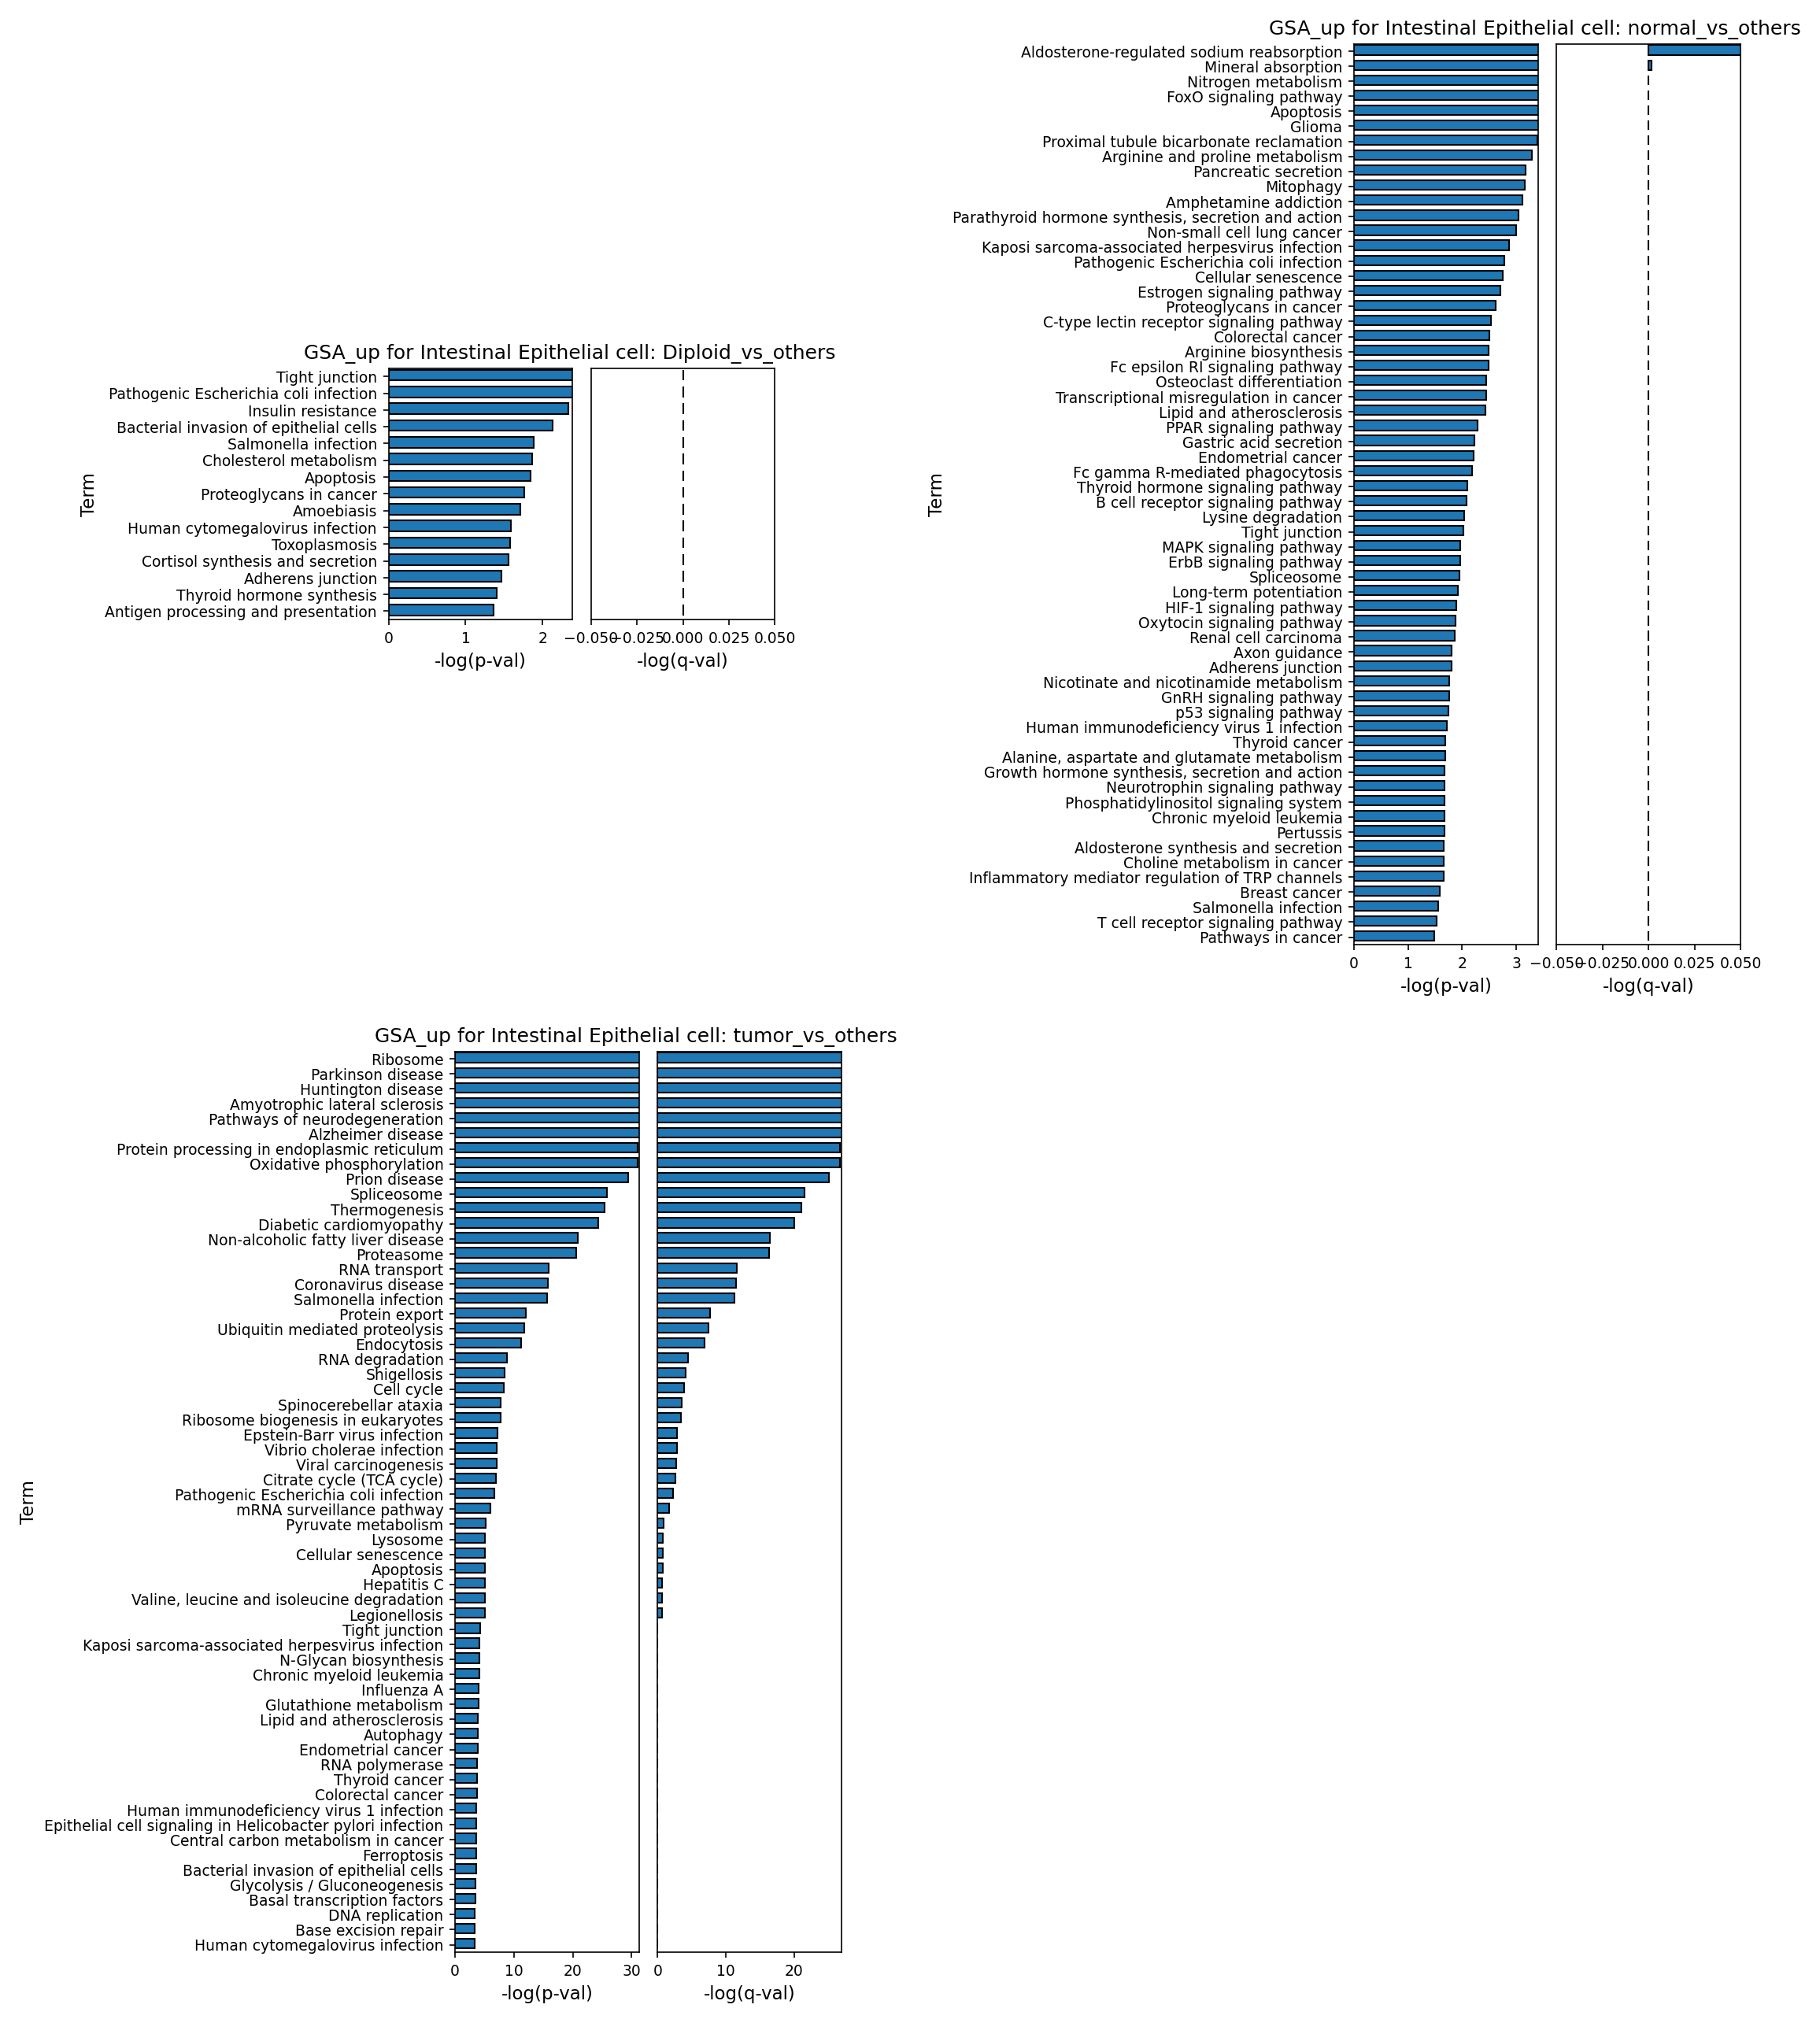
[Analysis Visualization Results]...
Analysis Overview
This analysis presents Gene Ontology (GO) enrichment results (GSA) for "Intestinal Epithelial cell" populations under different conditions or states, specifically comparing:
- Diploid Intestinal Epithelial cells against all other diploid cell types.
- Intestinal Epithelial cells from 'normal' tissue against all other cell types from 'normal' tissue.
- Intestinal Epithelial cells from 'tumor' tissue against all other cell types from 'tumor' tissue.
The results highlight biological processes and pathways that are significantly upregulated in Intestinal Epithelial cells within each specified context, providing insight into their intrinsic functional characteristics. The terms are ranked by the negative logarithm of the p-value (-log(p-val)), indicating the statistical significance of their enrichment.
Visual Summary
The provided bar plots illustrate the top enriched GO terms for Intestinal Epithelial cells in three distinct comparisons, ordered by their statistical significance (-log(p-val)). Each plot includes a second panel displaying -log(q-val) (FDR-adjusted p-value), though its scale and interpretation require careful consideration.
Diploid Intestinal Epithelial Cells vs. Other Diploid Cells
This plot shows GO terms enriched in Intestinal Epithelial cells with a diploid ploidy status, relative to other diploid cell types.
- Key Enriched Terms: The most significant terms (ranked by -log(p-val)) include "Tight junction", "Pathogenic Escherichia coli infection", "Insulin resistance", "Bacterial invasion of epithelial cells", and "Salmonella infection". These pathways are indicative of fundamental epithelial functions such as barrier integrity, innate immune response to pathogens, and metabolic regulation. "Proteoglycans in cancer" is also observed.
- Significance Assessment: The -log(p-val) values range up to approximately 2.3. However, the accompanying -log(q-val) panel displays values extremely close to zero (within the range of -0.05 to 0.05). If interpreted literally, a -log(q-val) of 0.05 corresponds to a q-value of ~0.89, suggesting that these terms, despite nominal p-value significance, do not pass conventional FDR-adjusted significance thresholds (e.g., q < 0.05).
Normal Intestinal Epithelial Cells vs. Other Normal Cells
This plot shows GO terms enriched in Intestinal Epithelial cells from normal colon tissue, relative to other cell types within the normal tissue context.
- Key Enriched Terms: The list of enriched terms is broader than in the Diploid comparison. Top terms include "Aldosterone-regulated sodium reabsorption", "Mineral absorption", "Nitrogen metabolism", "FoxO signaling pathway", and "Glioma". Many terms relate to diverse metabolic processes (e.g., arginine, proline, cholesterol, mitophagy), cellular signaling (e.g., Estrogen, PPAR, MAPK, ERBB, HIF-1), and some cancer-related pathways (e.g., "Proteoglycans in cancer", "Colorectal cancer"). Core epithelial functions like "Tight junction" and "Adherens junction" are also present.
- Significance Assessment: Similar to the Diploid comparison, -log(p-val) values are generally low (up to ~3.0), and the corresponding -log(q-val) bars remain very short, indicating a likely lack of significance after FDR correction, assuming a standard interpretation of the displayed scale.
Tumor Intestinal Epithelial Cells vs. Other Tumor Cells
This plot reveals GO terms significantly enriched in Intestinal Epithelial cells originating from tumor tissue, relative to other cell types within the tumor microenvironment.
- Key Enriched Terms: A striking and extensive list of terms shows extremely high -log(p-val) values (exceeding 30 for the top terms), indicating highly significant enrichment. Dominant themes include:
- High Cellular Activity & Proliferation: "Ribosome biogenesis", "Protein processing in endoplasmic reticulum", "Spliceosome", "RNA transport", "Cell cycle", "Oxidative phosphorylation", "Citrate cycle (TCA cycle)", "Pyruvate metabolism", "Glycolysis / Gluconeogenesis", "DNA replication", "Base excision repair", and "Basal transcription factors". These reflect the rapid growth and high metabolic demands characteristic of cancer cells.
- Protein Homeostasis & Stress: "Ubiquitin mediated proteolysis", "Endocytosis", "RNA degradation", "Autophagy", "Apoptosis", and "Cellular senescence".
- Infectious Diseases: A multitude of terms related to various bacterial and viral infections (e.g., "Pathogenic Escherichia coli infection", "Salmonella infection", "Epstein-Barr virus infection", "Vibrio cholerae infection", "Human cytomegalovirus infection", "Helicobacter pylori infection").
- Neurodegenerative Diseases: "Parkinson disease", "Huntington disease", "Amyotrophic lateral sclerosis", "Pathways of neurodegeneration", "Alzheimer disease", "Prion disease". These often relate to protein misfolding and proteostasis defects.
- Cancer-Specific Pathways: Direct mentions of various cancers, including "Colorectal cancer", "Endometrial cancer", "Breast cancer", and general "Pathways in cancer".
- Significance Assessment: Unlike the previous two comparisons, the -log(q-val) bars for many terms in this plot are noticeably longer and extend further to the right. While the absolute scale of the -log(q-val) axis (max 0.05) remains unusual for a standard interpretation of FDR significance (where -log(q-val) > 1.3 is typically required for q < 0.05), the dramatic difference in both -log(p-val) and the *relative length* of -log(q-val) bars suggests that many of these tumor-associated terms are indeed highly significant after multiple testing correction, robustly distinguishing tumor Intestinal Epithelial cells.
Biological Interpretation
The analysis reveals distinct functional profiles for Intestinal Epithelial cells (IECs) across different cellular states (diploid, normal, tumor), consistent with their central role in colon health and disease.
Intrinsic Functions of Diploid/Normal Intestinal Epithelial Cells
In both diploid and normal conditions, IECs exhibit enrichment for pathways associated with their fundamental physiological roles:
- Barrier Function: Terms like "Tight junction" and "Adherens junction" underscore the critical role of IECs in maintaining the intestinal barrier, essential for preventing pathogen entry and maintaining tissue integrity.
- Immune Surveillance and Response: Enrichment for "Pathogenic Escherichia coli infection", "Bacterial invasion of epithelial cells", and "Salmonella infection" highlights the constant interaction of IECs with the gut microbiome and their involvement in innate immune responses. "Antigen processing and presentation" further points to their immune sensing capabilities.
- Metabolic Activities: Pathways such as "Insulin resistance", "Cholesterol metabolism", "Aldosterone-regulated sodium reabsorption", "Mineral absorption", and "Nitrogen metabolism" reflect the diverse metabolic and absorptive functions of healthy IECs.
- While these terms are biologically relevant, the visual assessment of -log(q-val) suggests that these intrinsic features may not be *uniquely* distinguishing enough from other diploid or normal cell types to achieve FDR significance with the chosen settings.
Hallmarks of Tumor Intestinal Epithelial Cells
The functional profile of Intestinal Epithelial cells dramatically shifts in the tumor context, showcasing characteristic hallmarks of cancer:
- Hyper-proliferation and Metabolism: The overwhelming enrichment of pathways involved in ribosome biogenesis, protein processing, RNA metabolism, cell cycle, oxidative phosphorylation, and glycolysis points to an intense proliferative drive and altered energy metabolism—key features of rapidly dividing cancer cells. Genes involved in DNA replication and repair (e.g., "Base excision repair") are also highly active, indicating genomic instability and ongoing repair efforts.
- Dysregulated Protein Homeostasis: The strong signal for pathways related to "Protein processing in endoplasmic reticulum," "Ubiquitin mediated proteolysis," and various neurodegenerative diseases (which often involve protein misfolding and aggregation) suggests a significant burden on the protein quality control system within tumor IECs. This could be a consequence of rapid protein synthesis and altered proteostasis in cancer cells.
- Interaction with Microenvironment and Immune Dysregulation: The numerous infectious disease pathways suggest an altered interaction with pathogens, potentially reflecting an inflammatory tumor microenvironment, dysbiosis in the colon, or even tumor cells co-opting pathogen-related survival mechanisms. This is particularly relevant in colon cancer, where the microbiome plays a significant role in tumorigenesis and progression.
- Direct Oncogenic Pathways: The explicit enrichment for "Colorectal cancer" and other general "Pathways in cancer" directly confirms the oncogenic transformation of these IECs.
Clinical or Translational Implications
The profound differences in GO enrichment between normal and tumor Intestinal Epithelial cells offer several clinical and translational insights for colon cancer:
- Therapeutic Targets: The highly upregulated pathways in tumor IECs, particularly those related to cell cycle, protein synthesis (ribosome biogenesis), and energy metabolism (oxidative phosphorylation, glycolysis), represent potential therapeutic vulnerabilities. Inhibitors targeting these fundamental processes could selectively impede tumor growth.
- Biomarkers: Specific pathways or genes within these enriched GO terms could serve as diagnostic or prognostic biomarkers for colon cancer, distinguishing malignant IECs from healthy ones.
- Role of Microbiome and Immune Evasion: The strong signal for infectious disease pathways warrants further investigation into the role of the gut microbiome in colon cancer progression and the potential for immunomodulatory therapies or interventions targeting specific pathogens or pathogen-like pathways.
- Novel Therapeutic Avenues: The enrichment of neurodegenerative disease pathways, often linked to protein misfolding and proteostasis, suggests that targeting protein quality control mechanisms (e.g., proteasome inhibitors, autophagy modulators) could be a novel strategy for colon cancer treatment, given the high protein turnover and stress in tumor cells.
- Robustness of Tumor Findings: The high -log(p-val) and relatively stronger (though still ambiguously scaled) -log(q-val) for tumor-associated pathways suggest these findings are robust and warrant further experimental validation. However, the exact FDR-corrected significance requires more clarity on the q-value plot scale.
20. Gene Set Enrichment Analysis of Colon Cancer Cell Types
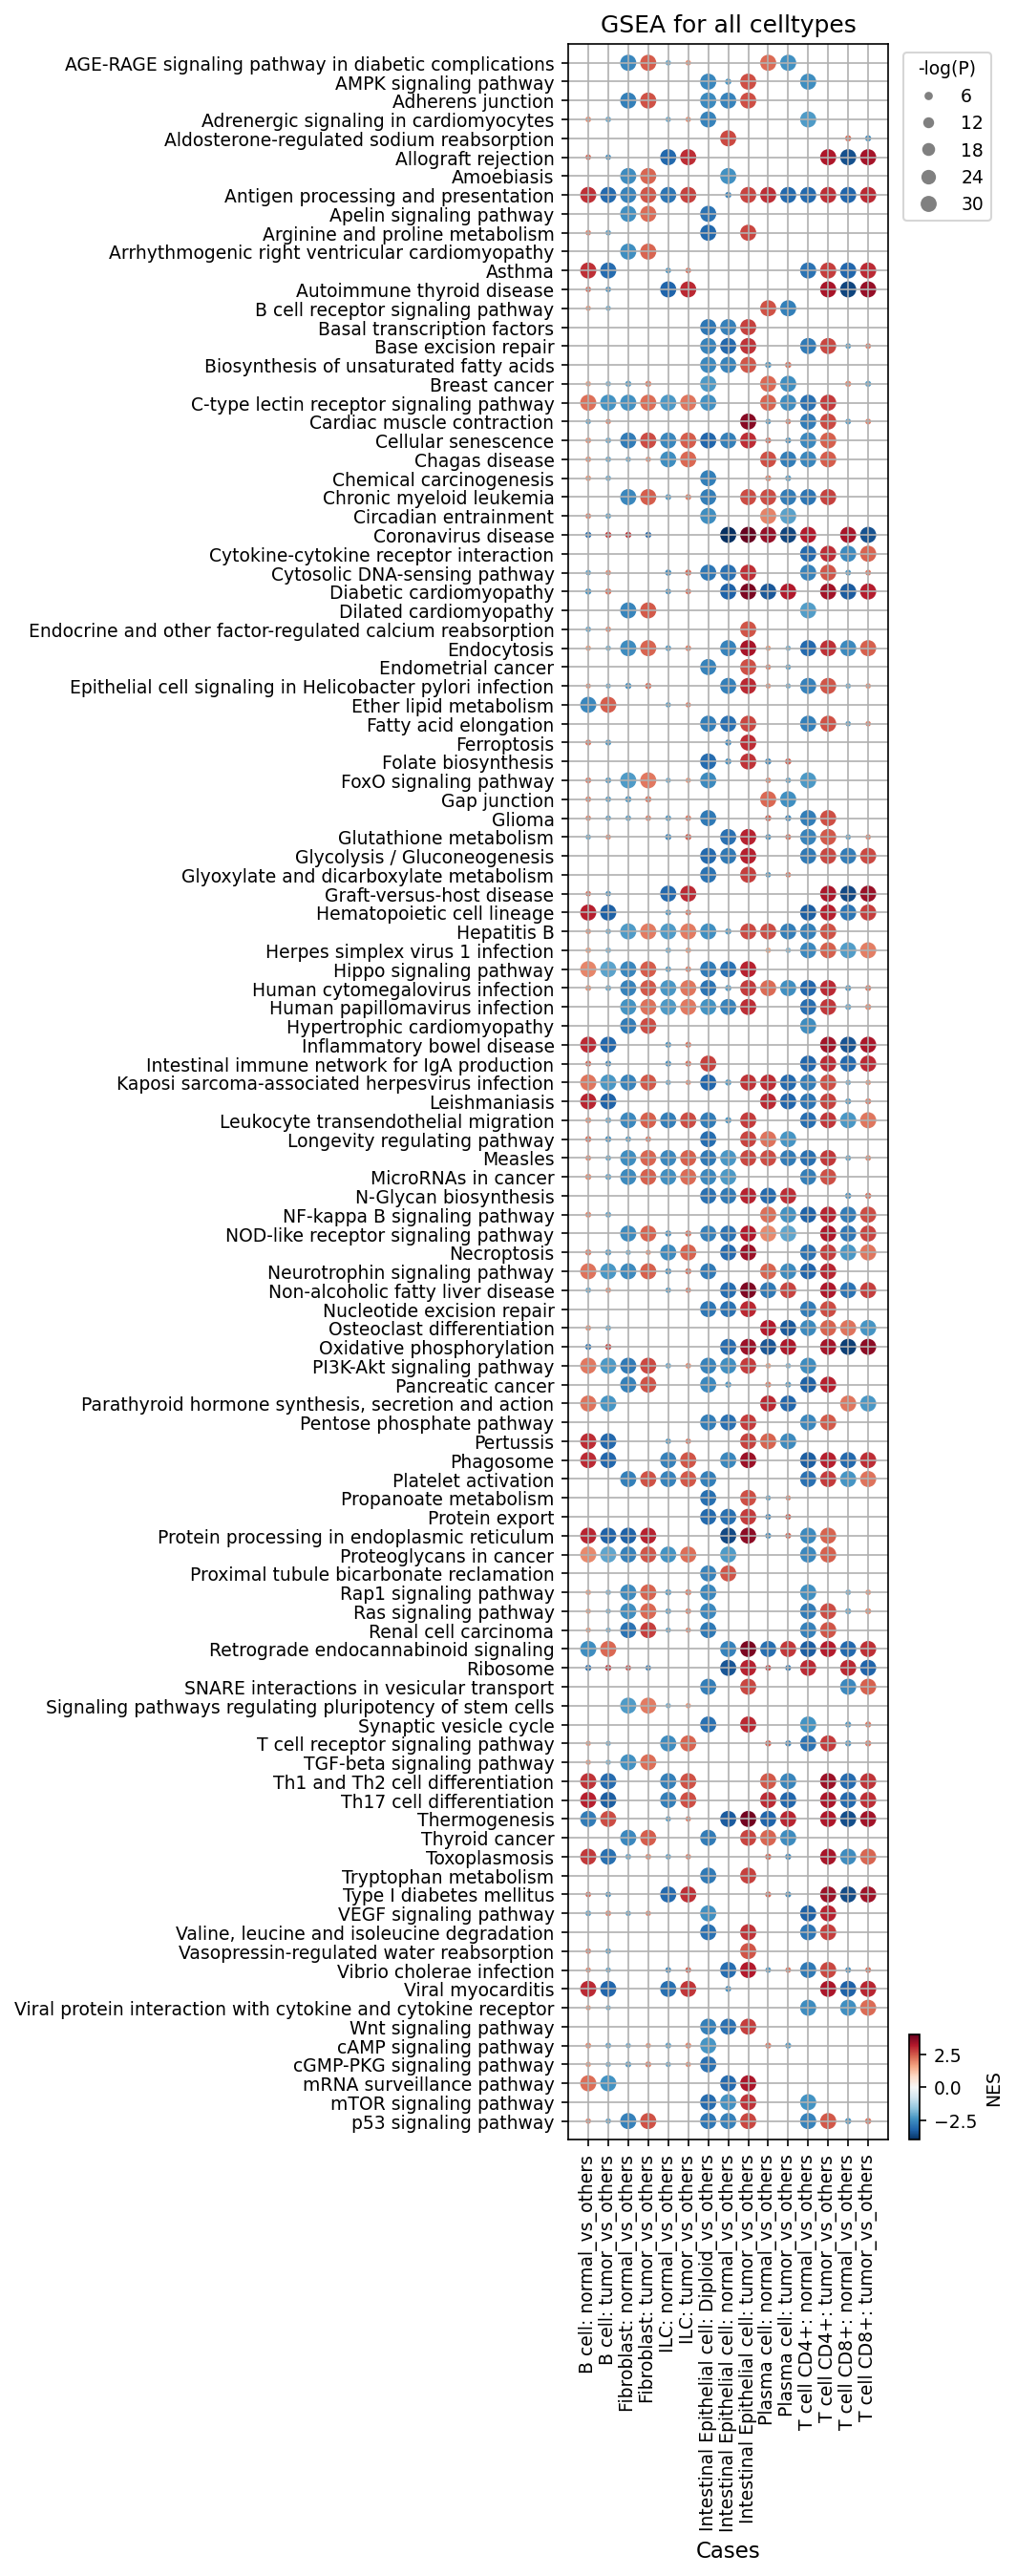
[Analysis Visualization Results]...
Analysis Overview
This analysis presents Gene Set Enrichment Analysis (GSEA) results across various cell types identified in single-cell RNA-seq data from human Colon tissue, comparing 'normal' and 'tumor' conditions. The plot displays the Normalized Enrichment Score (NES) and significance (-log(p-val)) for 120 selected gene sets, providing insights into differentially active biological pathways in specific cell populations within the colon cancer microenvironment. The comparisons are primarily focused on condition-specific enrichment for each cell type (e.g., 'B cell in normal condition vs. B cell in tumor condition', or vice-versa). For Intestinal Epithelial cells, additional comparisons by ploidy status (Diploid, Aneuploid) within the tumor context are included.
Visual Summary
The provided dot plot visualizes GSEA results:
- X-axis: Represents different "Cases" which are specific cell types (e.g., B cell, Fibroblast, Intestinal Epithelial cell, Plasma cell, ILC, T cell CD4+, T cell CD8+) paired with a condition comparison (e.g., 'normal_vs_others', 'tumor_vs_others', or ploidy-specific comparisons within the tumor).
- Y-axis: Lists 120 selected gene sets or pathways, encompassing a wide range of biological processes, metabolic functions, and disease-specific pathways.
- Dot Color: Indicates the Normalized Enrichment Score (NES), with a color gradient from deep blue (strongly negative NES, downregulated) to deep red (strongly positive NES, upregulated). A positive NES signifies that the gene set is enriched in the 'test' group of the comparison (e.g., 'tumor' cells), while a negative NES indicates enrichment in the 'reference' group (e.g., 'normal' cells).
- Dot Size: Corresponds to the negative logarithm of the p-value (-log(P)), where larger dots represent more statistically significant enrichment.
The plot highlights a complex interplay of pathway activation and repression across different cell types and conditions, with distinct patterns emerging in tumor-associated cells compared to their normal counterparts.
Biological Interpretation
General Cancer Hallmarks and Metabolic Reprogramming
Many classic cancer-associated pathways are consistently enriched in tumor-associated cells:
- PI3K-Akt signaling pathway is notably upregulated (positive NES) in Intestinal Epithelial cells (both diploid and aneuploid in tumor), Fibroblasts, and some immune cells (ILC, Macrophage) in the tumor context. This pathway is a central regulator of cell growth, proliferation, survival, and metabolism, frequently hyperactivated in various cancers, including colorectal cancer [PubMed: 35056690].
- Wnt signaling pathway and Hippo signaling pathway show significant positive enrichment in tumor Intestinal Epithelial cells and Fibroblasts. Wnt signaling is a well-known driver of colorectal cancer progression [GeneCards: WNT1], and dysregulation of the Hippo pathway is frequently observed in malignancies [PubMed: 32095811].
- Glycolysis / Gluconeogenesis is positively enriched across tumor Intestinal Epithelial cells (especially aneuploid ones), Fibroblasts, and Plasma cells, reflecting the Warburg effect (aerobic glycolysis), a metabolic hallmark of cancer cells [PubMed: 32427848]. This suggests an increased reliance on glycolysis for energy production in the tumor microenvironment.
- Oxidative phosphorylation is also enriched in tumor Intestinal Epithelial cells and Fibroblasts, indicating active mitochondrial metabolism alongside glycolysis, which can support rapid proliferation.
- The p53 signaling pathway, a critical tumor suppressor pathway, is consistently depleted (negative NES) in tumor Intestinal Epithelial cells, consistent with its frequent inactivation or mutation in cancer development.
- Pathways related to Protein processing in endoplasmic reticulum, Ribosome, and Protein export are enriched in tumor Intestinal Epithelial cells and Plasma cells, indicating high protein synthesis and secretion demands associated with rapid growth and specific cell functions (e.g., antibody production by plasma cells).
Immune Microenvironment Dysregulation
The GSEA results reveal significant alterations in immune cell functions within the tumor microenvironment:
- T cell receptor signaling pathway and B cell receptor signaling pathway are positively enriched in normal T cells (CD4+ and CD8+) and B cells, respectively, but show marked depletion (negative NES) in their tumor-associated counterparts. This suggests a functional suppression or anergic state of T and B lymphocytes in the tumor microenvironment, contributing to immune evasion.
- Pathways related to Th1 and Th2 cell differentiation and Th17 cell differentiation are enriched in normal T cells but depleted in tumor T cells, indicating a shift away from protective effector T cell responses in the tumor.
- Cytokine-cytokine receptor interaction and NF-kappa B signaling pathway show widespread enrichment across various tumor immune cell types (ILC, Macrophage, T cells), highlighting active inflammatory signaling and cellular communication within the tumor microenvironment, which can be both pro-tumorigenic and anti-tumorigenic depending on the context.
- Antigen processing and presentation pathways are enriched in normal B cells and normal T cells, but show more varied patterns in tumor immune cells, sometimes depleted in B cells but enriched in CD4+ and CD8+ T cells in tumor, suggesting complex antigen presentation dynamics.
- The Inflammatory bowel disease pathway is enriched in tumor B cells and ILCs, which might signify a sustained inflammatory state contributing to tumor progression, as chronic inflammation is a known risk factor for colorectal cancer.
Fibroblast Activation in Tumor Stroma
Tumor-associated Fibroblasts exhibit a distinct activation profile:
- Pathways associated with extracellular matrix (ECM) remodeling, such as Proteoglycans in cancer and Focal adhesion, are strongly enriched in tumor Fibroblasts. This is characteristic of Cancer-Associated Fibroblasts (CAFs), which play a crucial role in shaping the tumor microenvironment, promoting tumor growth, invasion, and metastasis [PubMed: 30455582].
- TGF-beta signaling pathway, a key regulator of fibrosis and immunosuppression, is also enriched in tumor Fibroblasts, further supporting their role in stromal remodeling and immune modulation [PubMed: 28412853].
- Enrichment of Rap1 signaling pathway and AMPK signaling pathway in tumor Fibroblasts suggests their involvement in cell adhesion, migration, and metabolic adaptation within the tumor stroma.
Ploidy-Specific Differences in Tumor Intestinal Epithelial Cells
Comparing diploid and aneuploid Intestinal Epithelial cells within the tumor context provides nuanced insights:
- Both diploid and aneuploid tumor Intestinal Epithelial cells show enrichment in common oncogenic pathways (e.g., PI3K-Akt, Wnt, Hippo, Glycolysis, Oxidative phosphorylation) and depletion of p53 signaling, indicating that both cell states contribute to the malignant phenotype.
- However, Glycolysis / Gluconeogenesis shows a stronger positive enrichment in aneuploid tumor Intestinal Epithelial cells compared to their diploid counterparts. This might suggest a more aggressive metabolic reprogramming in aneuploid cells, potentially linked to higher proliferative rates or increased energy demands associated with genomic instability.
- Nucleotide excision repair pathway is depleted in both diploid and aneuploid tumor Intestinal Epithelial cells, possibly indicating compromised DNA repair mechanisms in tumor cells, contributing to genomic instability.
Clinical or Translational Implications
The GSEA results provide several potential clinical and translational avenues for colon cancer:
- Therapeutic Targeting of Key Pathways: The consistent upregulation of PI3K-Akt, Wnt, and Hippo signaling in tumor Intestinal Epithelial cells and Fibroblasts identifies these pathways as potential therapeutic targets. Inhibitors against components of these pathways could be evaluated for efficacy in colon cancer.
- Modulating the Tumor Microenvironment: The observed activation of CAFs, characterized by enriched Proteoglycans in cancer and TGF-beta signaling, suggests that targeting CAF activity could impair tumor progression and metastasis. Strategies aimed at disrupting the fibrotic tumor microenvironment or normalizing CAF function may enhance existing therapies [PubMed: 30455582].
- Immune Checkpoint Strategies: The depletion of TCR/BCR signaling and altered T cell differentiation patterns in the tumor microenvironment highlight immune evasion mechanisms. Immunotherapies aimed at reversing T cell exhaustion or restoring effector T cell functions (e.g., through checkpoint inhibitors or adoptive cell therapies) could be beneficial.
- Metabolic Vulnerabilities: The pronounced enrichment of Glycolysis / Gluconeogenesis in tumor cells, particularly aneuploid Intestinal Epithelial cells, suggests that targeting cancer cell metabolism could be a viable therapeutic strategy, potentially by inhibiting glycolytic enzymes.
- Ploidy-Specific Therapies: The subtle differences in pathway enrichment between diploid and aneuploid tumor Intestinal Epithelial cells, such as heightened glycolysis in aneuploid cells, suggest that therapies could be tailored based on the genomic stability of tumor cells. This could lead to more personalized treatment approaches.
21. Discussion
The single-cell RNA sequencing analysis of human colon tissue provides a multi-faceted view of colon cancer, integrating transcriptomic profiling, copy number variations (CNVs), and cell-cell interaction dynamics. A primary finding, reinforced by UMAP visualizations and ploidy analysis (Sections 1, 2, 5, 11), is the unambiguous identification of Intestinal Epithelial cells (IECs) as the tumor-origin cell type. These cells in tumor samples exhibit striking aneuploidy, a hallmark of malignancy, and harbor recurrent genomic amplifications (Section 4), notably including ERBB2 on 17q12:17q21.2 and regions on 8q22.1:8q24.3 (containing INTS8 and EIF3E). This genomic instability underpins the profound phenotypic changes observed in tumor IECs.
The tumor microenvironment (TME) undergoes extensive remodeling, crucial for cancer progression. Immune cell population analysis reveals significant shifts (Sections 6, 7, 8, 9, 10). Specifically, a substantial increase in regulatory T cells (Tregs), Th17, and Th22 populations in tumor tissue points towards an immunosuppressive and pro-inflammatory milieu. Concurrently, macrophage populations polarize towards pro-tumorigenic M2B and M2D phenotypes, actively contributing to immune evasion and tumor growth. Cancer-associated fibroblasts (CAFs) also emerge as a prominent component of the tumor stroma, characterized by specific surface markers (Section 16) like THY1, PDGFRB, and MMP14, indicative of their activated state and role in extracellular matrix remodeling and angiogenesis.
Cell-cell interaction (CCI) analysis highlights a dramatic disruption of communication networks in the TME (Sections 12, 13, 14). While normal colon tissue exhibits a rich, diverse network of epithelial-immune and immune-immune interactions (e.g., strong IFN-gamma signaling and T cell activation pathways), the tumor microenvironment presents a significantly simplified landscape. Key findings include the loss of crucial IFN-gamma signaling among T cells and a marked impairment of T cell activation pathways (LCK/CD8 receptor interactions). Conversely, tumor-specific interactions emerge, involving novel immune checkpoints like VSIR-HLA-F/E, BTLA-HVEM, and SIRPG-CD47, which actively contribute to T cell dysfunction and immune evasion. The general absence of epithelial-immune interactions within the most prominent tumor CCIs further underscores the immune-excluded or suppressed nature of the malignant epithelial cells.
Functionally, tumor-derived IECs display hallmarks of aggressive malignancy. Gene Ontology (GSA) and Gene Set Enrichment Analysis (GSEA) (Sections 19, 20) reveal overwhelming enrichment for pathways related to hyper-proliferation (e.g., ribosome biogenesis, protein processing, DNA replication, cell cycle) and altered metabolism (e.g., glycolysis, oxidative phosphorylation). This is corroborated by the widespread and statistically significant upregulation of numerous cell cycle pathway genes, including CCND1, MYC, CDK4/6, and HDACs, in tumor IECs (Section 18). Concurrently, tumor suppressor pathways like p53 signaling are depleted. These analyses underscore the intrinsic drive of tumor cells for uncontrolled growth and adaptation.
Finally, the identification of condition-specific surfaceome markers (Sections 15, 16, 17) in tumor IECs, CAFs, and CD4+ T cells provides a critical foundation for therapeutic development. Established targets such as CEACAM5, CD44, and CD47 on tumor cells, and immune checkpoints like CTLA4 and TIGIT on T cells, show high expression. Promising novel targets on CAFs (e.g., PDGFRB, MMP14) and potentially exhausted T cells (e.g., TNFRSF1B, OX40) highlight avenues for stromal and immune modulation. Overall, this comprehensive analysis provides an integrated understanding of the genomic and transcriptomic changes in human colon cancer, detailing the complex interplay between tumor cells and their microenvironment, and offering a robust platform for the identification and validation of next-generation diagnostic and therapeutic strategies.
Hypotheses:
- The observed increase in immunosuppressive cell populations (Tregs, M2 macrophages) and the activation of specific immune checkpoint interactions (VSIR-HLA-F/E, BTLA-HVEM, SIRPG-CD47, CTLA4, TIGIT) in the tumor microenvironment directly correlate with the functional suppression of anti-tumor T cell responses (e.g., reduced IFN-gamma signaling and LCK/CD8 receptor interactions) and promote immune evasion in colon cancer.
- The widespread genomic instability and aneuploidy in Intestinal Epithelial cells, along with specific recurrent gene amplifications (e.g., ERBB2, INTS8, EIF3E), drive a hyper-proliferative state and profound metabolic reprogramming, characterized by enhanced glycolysis and oxidative phosphorylation, thereby supporting aggressive tumor growth and contributing to altered protein homeostasis.
- The unique activation and distinct surfaceome profile of Cancer-Associated Fibroblasts (CAFs), including upregulation of PDGFRB, ITGAV, MMP14, EDNRA, and JAG1, remodel the extracellular matrix and foster an immunosuppressive milieu, which collectively facilitates tumor invasion, angiogenesis, and metastasis in colon cancer.
- The drastic reduction in the diversity and number of significant cell-cell interactions, particularly the loss of epithelial-immune crosstalk and the prominence of T cell-T cell inhibitory interactions, in tumor tissue indicates a fundamental rewiring or suppression of intercellular communication, leading to an 'immune desert' phenotype or active immune exclusion mechanisms.
- The high and specific expression of novel surface markers (e.g., LY6E, TNFRSF1B, OX40) on distinct cell populations within the tumor microenvironment represents unexplored therapeutic vulnerabilities beyond established targets, offering potential for precision medicine approaches to modulate tumor growth, stromal support, or immune responses.
Potential therapeutic targets:
- CEACAM5: A classic tumor-associated surface antigen significantly overexpressed in tumor-origin Intestinal Epithelial cells, promoting tumor cell proliferation, survival, invasion, and immune evasion. Evidence: Section 15: "CEACAM5 is a classic tumor-associated antigen, significantly overexpressed in various adenocarcinomas, including colorectal cancer. It promotes tumor cell proliferation, survival, invasion, and metastasis. It can influence cell cycle progression and apoptosis resistance. Its high expression in tumor-associated Intestinal Epithelial cells highlights a key mechanism of immune evasion." Listed as an 'Established therapeutic target'. Validation: Test the efficacy of CEACAM5-targeting antibody-drug conjugates (ADCs) like Tusamitamab ravtansine or Labetuzumab govitecan in colon cancer cell lines, patient-derived organoids, and xenograft models to assess tumor growth inhibition and patient response.
- CD47: Upregulated surface protein on tumor-origin Intestinal Epithelial cells that acts as a 'don't eat me' signal, binding to SIRPα on phagocytic cells to inhibit their activity, thereby enabling immune evasion. Evidence: Section 15: "Overexpression of CD47 in cancer cells allows them to evade immune surveillance by inhibiting phagocytosis. Its high expression in tumor-associated Intestinal Epithelial cells highlights a key mechanism of immune evasion employed by these cancer cells." Listed as an 'Established therapeutic target'. Validation: Evaluate anti-CD47 monoclonal antibodies (e.g., Magrolimab, Letaplimab) in preclinical colon cancer models to demonstrate enhanced macrophage-mediated phagocytosis of tumor cells, potentially in combination with chemotherapy or other immunotherapies.
- ERBB2 (HER2): The ERBB2 gene is recurrently amplified (50% frequency) in tumor-associated Intestinal Epithelial cells, suggesting it is a significant driver oncogene in these colon cancer samples. Evidence: Section 4: "Amplification of 17q12:17q21.2 containing ERBB2 is a well-established oncogene whose amplification and overexpression drive tumor growth in various cancers, including a subset of colorectal cancers. Its high frequency (50%) in the T_cac cells suggests it could be a significant driver in these colon cancer samples." Validation: Assess the efficacy of HER2-targeted therapies (e.g., trastuzumab, pertuzumab, or antibody-drug conjugates like fam-trastuzumab deruxtecan) in colon cancer patient-derived xenograft (PDX) models or organoids with confirmed ERBB2 amplification, to confirm therapeutic response.
- PDGFRB: A prominent receptor tyrosine kinase highly expressed on activated Cancer-Associated Fibroblasts (CAFs), driving fibroblast proliferation, differentiation, extracellular matrix deposition, and angiogenesis, all critical for tumor progression. Evidence: Section 16: "PDGFRB is a prominent marker of activated CAFs. Its signaling drives fibroblast proliferation, differentiation, and the extensive deposition of extracellular matrix (ECM) components, contributing to tumor desmoplasia. It also plays a role in pericyte recruitment and angiogenesis." Listed as an 'Established therapeutic target'. Validation: Test multi-kinase inhibitors with anti-PDGFR activity (e.g., imatinib, sunitinib) in preclinical models to determine their impact on CAF activation, TME stiffness, tumor growth, and metastatic potential.
- MMP14: A membrane-anchored matrix metalloproteinase highly expressed by CAFs, crucial for remodeling the ECM, facilitating tumor cell invasion, and contributing to angiogenesis. Evidence: Section 16: "MMP14 is highly expressed by CAFs and is crucial for remodeling the ECM, thereby facilitating tumor cell invasion, intravasation, and metastasis. It also contributes to angiogenesis and immune cell infiltration within the TME." Listed as a 'Potential therapeutic target'. Validation: Evaluate selective MMP14 inhibitors in organoid or xenograft models to demonstrate reduced tumor invasion and metastasis. Investigate if MMP14 inhibition improves delivery and efficacy of co-administered chemotherapies or immunotherapies due to TME normalization.
- CTLA4: A crucial inhibitory immune checkpoint receptor strongly upregulated on tumor-associated CD4+ T cells, dampening T cell activation and contributing significantly to immune suppression and evasion in the TME. Evidence: Section 17: "CTLA4 is a crucial negative regulator of T cell activation, often upregulated on activated T cells and regulatory T cells (Tregs) in the TME. Its high expression on tumor-associated CD4+ T cells is a strong indicator of immune suppression, T cell exhaustion, or the presence of immunosuppressive Tregs, contributing significantly to tumor immune evasion." Listed as an 'Established therapeutic target'. Validation: Utilize anti-CTLA4 monoclonal antibodies (e.g., Ipilimumab) in clinical trials for colon cancer, particularly in combination with other immunotherapies (e.g., anti-PD-1/PD-L1), to enhance T cell activation and anti-tumor immunity.
- TIGIT: An emerging inhibitory immune checkpoint receptor highly expressed on tumor-associated CD4+ T cells, co-expressed with other inhibitory receptors, and implicated in suppressing T cell activation and proliferation, thereby contributing to immune evasion. Evidence: Section 17: "TIGIT is a relatively new but significant immune checkpoint, often co-expressed with other inhibitory receptors like PD-1 on exhausted T cells and Tregs in the TME. Its high expression indicates a suppressive phenotype contributing to immune evasion in colon cancer." Listed as an 'Emerging immune checkpoint blockade target'. Validation: Conduct preclinical and clinical evaluations of TIGIT-blocking antibodies (e.g., Tiragolumab) alone and in combination with anti-PD-1 therapy to demonstrate restored T cell function and enhanced anti-tumor responses in colon cancer.
- TNFRSF1B (TNFR2): Highly expressed on regulatory T cells (Tregs) and activated effector T cells in the TME, it promotes Treg survival, proliferation, and suppressive function, contributing significantly to immune tolerance and evasion. Evidence: Section 17: "TNFR2 is highly expressed on regulatory T cells (Tregs) and often on activated effector T cells. In the TME, it plays a critical role in the survival, proliferation, and suppressive function of Tregs, contributing significantly to immune tolerance and evasion. Its expression on tumor-associated CD4+ T cells points towards a more suppressive or anergic phenotype." Listed as an 'Emerging immune checkpoint target'. Validation: Evaluate anti-TNFR2 antibodies in preclinical models to assess their ability to deplete or inhibit Treg function and consequently enhance anti-tumor T cell responses, potentially in combination with other immunotherapies.
Follow-up validation ideas:
- Flow Cytometry/Immunohistochemistry: Validate population shifts of immune and stromal cells (e.g., Treg, Th17, M2 macrophage subsets, CAFs) and protein-level expression of key surface markers (e.g., CEACAM5, CD47 on IECs; THY1, PDGFRB on Fibroblasts; CTLA4, TIGIT, OX40, TNFR2 on T cells) in independent human colon cancer cohorts and adjacent normal tissues.
- Spatial Transcriptomics/Proteomics: Map the precise localization of distinct immune and stromal cell subsets, as well as specific ligand-receptor interactions (e.g., VSIR-HLA-F/E, BTLA-HVEM), within the colon tumor architecture to understand their spatial relationships, interactions, and contributions to immune exclusion or suppression in situ.
- In vitro/Ex vivo Functional Assays: Conduct co-culture experiments with isolated tumor IECs, CAFs, and immune cells to investigate the functional impact of identified interactions and pathways on cell proliferation, migration, invasion, immune evasion, and T cell activation/exhaustion. For example, test inhibitors of PDGFRB or MMP14 on CAF-mediated ECM remodeling and tumor cell invasion.
- CRISPR/shRNA Knockdown/Overexpression: Genetically manipulate identified target genes (e.g., CEACAM5, LY6E in tumor cells; PDGFRB, MMP14 in CAFs; TIGIT, CTLA4 in T cells) in relevant colon cancer cell lines or patient-derived organoids to assess their functional impact on tumor cell fitness, TME interactions, and immune responses.
- Patient-Derived Xenograft (PDX) Models / Syngeneic Mouse Models: Evaluate the in vivo efficacy of therapeutic agents targeting identified pathways and surface markers (e.g., anti-CEACAM5 ADCs, anti-CD47 antibodies, PDGFRB inhibitors, anti-TIGIT/CTLA4 antibodies) alone or in combination, monitoring tumor growth, metastasis, and immune cell infiltration/function.
- FISH/qPCR for CNVs: Validate recurrent CNV amplifications (e.g., ERBB2, INTS8, EIF3E) identified in tumor IECs at the genomic DNA level using Fluorescence In Situ Hybridization (FISH) on tissue sections, and assess their gene expression changes via targeted qPCR or single-molecule FISH in specific cell populations.
Limitations:
This report's findings are based on computational analysis of single-cell RNA sequencing data and inferred copy number variations, thus providing associations rather than direct causality. While the cell type annotations and ploidy calls are robust, the interpretation of some statistical measures (e.g., GSA q-values) had ambiguous visual scaling and requires cautious interpretation. Cell-cell interaction predictions are based on gene expression and known ligand-receptor pairs, not direct biochemical validation. The observed tumor heterogeneity between samples implies that specific findings may not universally apply to all colon cancer cases. Furthermore, the specific histological subtype and stage of colon cancer are not determined from the provided data. Therefore, these findings necessitate further in vitro and in vivo experimental validation to confirm their biological and clinical significance.
22. Query List
- Show and save UMAPs for condition, sample, major cell type, minor cell type, ploidy_dec, and celltype_subset in two columns.
- Show major cell type scores on UMAP and save the result.
- Show and save a marker expression dot plot for celltype_subset. SET target_cell = None and var_group_rotation = 45. Leave all other arguments at their default values.
- Select Intestinal Epithelial cells, show a CNV heatmap grouped by sample together with a summary of regions with significantly amplified copy numbers, and save the results.
- Show and save UMAPs of CNV patterns colored by major cell type, minor cell type, ploidy results, condition, and sample in two columns.
- Show and save a population bar plot of minor cell types.
- Show and save a population bar plot of T cell subsets.
- Show and save box plots of T cell subset populations with statistically significant differences between conditions, if any. Choose ncols based on the total number of panels.
- Show and save a population bar plot of macrophage subsets.
- Show and save box plots of macrophage subset populations with statistically significant differences between conditions, if any. Choose ncols based on the total number of panels.
- Select Intestinal Epithelial cells, show their ploidy populations as a bar plot, and save the result.
- Show and save cell-cell interaction patterns involving Intestinal Epithelial cells, Fibroblasts, Macrophages, T cells, B cells, Dendritic cells, Endothelial cells, ILC, Mast cells, NK cells, Plasma cells, and Smooth muscle cells. Select at most 80 cell-cell interactions per group.
- Select only genes associated with immune checkpoint and cell cycle pathways, show cell-cell interactions for these genes, and save the result.
- Find cell-cell interactions involving major immune and stromal cells that differ significantly between conditions, show them as a dot plot, and save the result. Set max_n_items_per_group to 60. For each interaction identified under each condition, using the provided dataset context, describe the associated signaling pathways and mechanisms, its potential as a therapeutic target, and relevant therapeutic agents.
- Show marker expressions for Intestinal Epithelial cells in a dot plot, and save the result. Use only surfaceome markers, with at most 60 markers per condition. For the markers identified under each condition, distinguish between established therapeutic targets and less well-characterized markers with potential as therapeutic targets. For each marker, using the provided dataset context, describe the associated signaling pathways and mechanisms, relevant therapeutic agents, and supporting evidence.
- Show marker expressions for Fibroblasts in a dot plot, and save the result. Use only surfaceome markers, with at most 40 markers per condition. For each marker identified under each condition, using the provided dataset context, describe the associated signaling pathways, the role of the corresponding cell type in the tumor microenvironment, the marker’s potential as a therapeutic target, relevant therapeutic agents, and other pertinent information.
- Show marker expressions for T cell CD4+ in a dot plot, and save the result. Use only surfaceome markers, with at most 40 markers per condition. For each marker identified under each condition, using the provided dataset context, describe the associated signaling pathways, the role of the corresponding cell type in the tumor microenvironment, the marker’s potential as a therapeutic target, relevant therapeutic agents, and other pertinent information.
- Among cell cycle pathway genes, select those with statistically significant expression differences between conditions in Intestinal Epithelial cells, show box plots, and save the result. Set max_n_items_to_plot to 24 and choose ncols based on the total number of panels for an overall width-to-height ratio of approximately 2:3.
- Show and save Gene Ontology (GSA) analysis results for Intestinal Epithelial cells as a bar plot.
- Show Gene Set Enrichment Analysis results as a dot plot, and save it. Set the color map to RdBu_r, n_pws_to_show to 120, and target_cells to None.