Single-Cell Transcriptomic Analysis Reveals Distinct Cellular and Molecular Signatures in Acute and Chronic Colitis
This single-cell RNA sequencing analysis of mouse colon tissue delineates significant shifts in cellular composition, gene expression, and cell-cell interactions across healthy, acute, and chronic colitis conditions. Key findings include a decrease in intestinal epithelial cells and naive T cells, alongside a pronounced expansion of B cells and specific immune subsets like ILCs and M1 macrophages in colitis. Distinct surface marker profiles and pathway enrichments in T cells, macrophages, intestinal epithelial cells, and fibroblasts highlight the dynamic and stage-specific immunological and stromal responses driving disease progression.
Contents
- Dataset overview
- UMAP Visualization of Colon Single-Cell RNA-seq Data by Condition and Cell Type Annotation
- Major Cell Type Score Visualization on UMAP
- Marker Expression Profiling and Celltype Annotation Validation in Colon Tissue Subsets
- Minor Cell Type Population Analysis in Colitis Conditions
- T Cell and Innate Lymphoid Cell Subpopulation Shifts in Colitis
- Condition-Specific Shifts in T Cell and ILC Subsets in Colitis
- Macrophage Subset Population Dynamics Across Colitis Conditions
- Macrophage Subset Proportion Shifts Across Colitis Stages
- Cell-Cell Interaction Patterns Across Colitis Conditions
- Condition-Specific Cell-Cell Interaction Patterns in Colon Inflammation
- Intestinal Epithelial Cell Condition-Specific Surfaceome Markers in Colon Inflammation
- Macrophage Condition-Specific Surfaceome Markers in Colon Tissue
- Fibroblast Condition-Specific Surfaceome Markers in Colitis
- T cell CD4+ Condition-Specific Surfaceome Markers in Colitis
- Gene Ontology Enrichment in Macrophages across Colitis Conditions
- Gene Set Enrichment Analysis Across Colitis Conditions and Cell Types
- Discussion
- Query List
0. Dataset overview
데이터셋 요약
- 데이터 출처 및 구성: 이 데이터셋은 84,594개의 세포와 21,984개의 유전자로 구성된 단일 세포 RNA 시퀀싱 AnnData 객체입니다.
- 생물학적 정보: 생쥐(mouse)의 대장(Colon) 조직에서 유래했습니다.
- 조건 (Conditions): 데이터는 AC (급성 대장염), CC (만성 대장염), HC (건강 대조군)의 세 가지 조건으로 분류됩니다. HC는 차등 유전자 발현 (DEG) 및 유전자 세트 농축 분석 (GSEA/GSA)의 참조 조건으로 사용됩니다.
- 세포 유형 계층: 세포는 celltype_major, celltype_minor, celltype_subset의 세 가지 계층적 수준으로 정밀하게 분류되어 있습니다. 예를 들어, 주요 세포 유형에는 골수 세포(Myeloid cell), T 세포, B 세포 등이 있으며, 더 세분화된 하위 유형도 포함됩니다.
- 측정된 변수 (obs columns): 각 세포에 대한 샘플(sample), 조건(condition), 세포 유형 정보(celltype_major, celltype_minor, celltype_subset), 클러스터(cluster)와 같은 주석 정보가 포함되어 있습니다.
- 유전자 변수 (var columns): 유전자 ID와 가변 유전자 정보가 포함되어 있습니다.
- 특수 분석 가능 여부: 종양 식별은 요청되지 않았으며, CNV (Copy Number Variation) 추정치는 현재 데이터셋에서 제공되지 않습니다.
- 사전 계산된 결과: 세포-세포 상호작용 (CCI), 차등 유전자 발현 (DEG), 유전자 세트 농축 분석 (GSEA), 유전자 온톨로지 (GSA/GO) 결과가 조건 및 참조 조건 대비하여 각 세포 유형에 대해 미리 계산되어 저장되어 있습니다.
추론된 생물학적/질병 문맥
- 이 데이터셋은 대장(Colon) 조직에서 AC, CC, HC 조건으로 구성되어 있어, 염증성 장 질환 (IBD), 특히 대장염(Colitis) 관련 연구에 중점을 둔 것으로 추정됩니다. HC가 건강 대조군임을 고려할 때, AC와 CC는 각각 급성 및 만성 대장염 상태를 나타낼 가능성이 높습니다.
1. UMAP Visualization of Colon Single-Cell RNA-seq Data by Condition and Cell Type Annotation
[Analysis Visualization Results]...
Analysis Overview
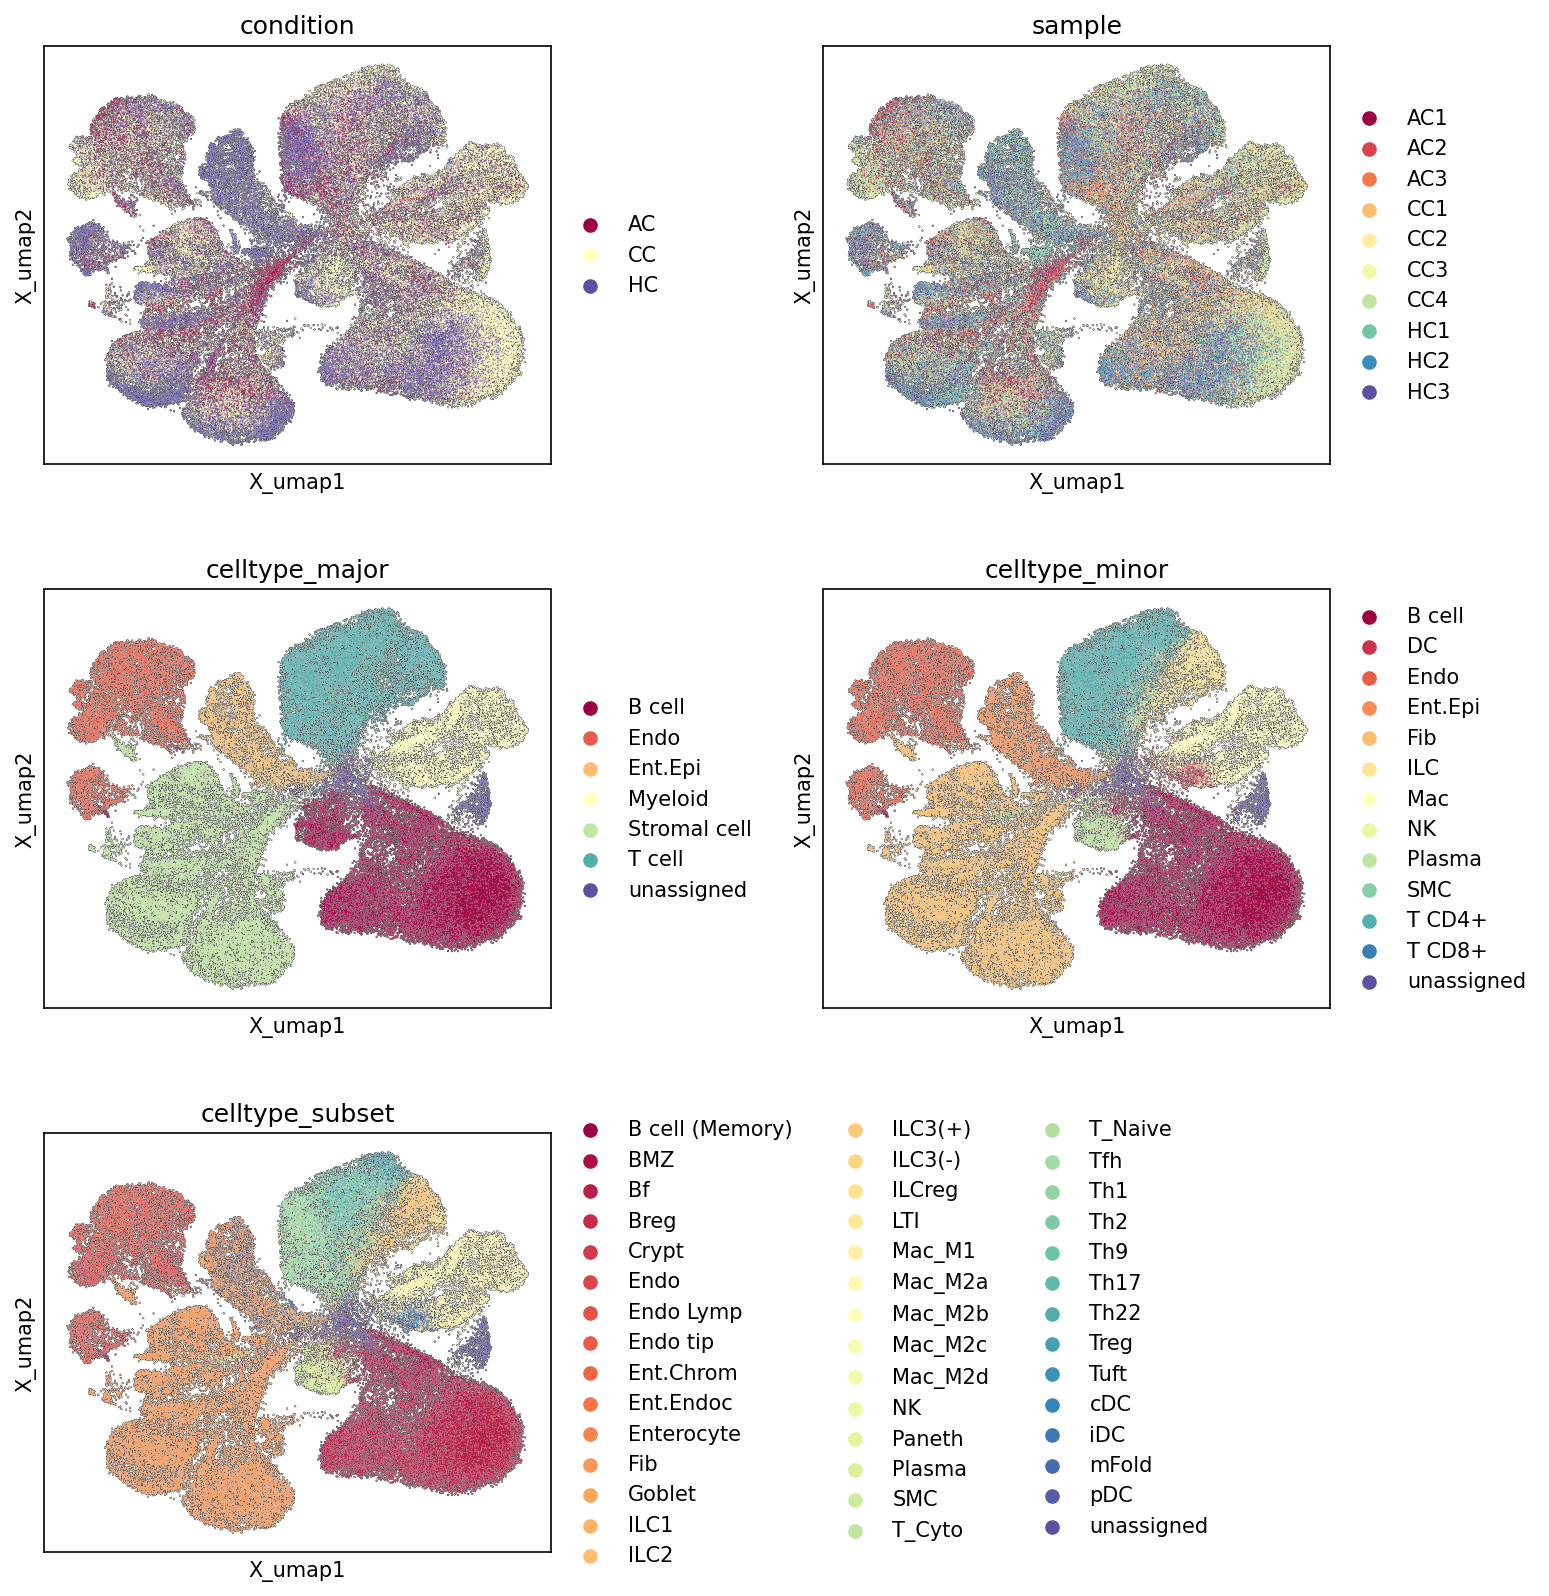
This analysis provides an overview of the single-cell RNA sequencing (scRNA-seq) dataset by visualizing cells in a Uniform Manifold Approximation and Projection (UMAP) embedding space. The UMAPs are colored by key metadata: experimental condition (AC, CC, HC), individual sample, and hierarchical cell type annotations (major, minor, and subset levels). This allows for an assessment of cell population structure, condition-specific differences, and the quality of cell type annotation.
Visual Summary
Condition and Sample Distribution
- Condition UMAP: The UMAP shows a clear separation between the healthy control (HC, purple) cells and the colitis conditions (AC, maroon; CC, yellow). HC cells tend to form distinct clusters, particularly on the left side and bottom-right periphery of the embedding. AC and CC cells, while showing some condition-specific enrichment in certain regions, largely overlap and intermingle in the central and upper-right areas of the UMAP. This suggests significant transcriptional and/or compositional differences between healthy and inflamed colon tissue, with shared characteristics or a continuum of cellular states between acute (AC) and chronic (CC) colitis.
- Sample UMAP: Individual samples largely exhibit good mixing within their respective conditions (e.g., AC1, AC2, AC3 are intermingled; similarly for CC and HC samples). This indicates that major batch effects originating from individual samples are not strongly driving the overall clustering patterns. Some minor sample-specific variations or enrichments can be observed, but they do not cause a complete separation of samples belonging to the same condition.
Cell Type Annotation Quality
- Celltype_major UMAP: Major cell types (e.g., T cell, Myeloid cell, B cell, Intestinal Epithelial cell, Stromal cell, Endothelial cell) form largely distinct and well-separated clusters, indicating robust identification of these broad cell populations. The 'unassigned' cells (dark purple) are sparse and scattered, suggesting a high proportion of cells have been successfully classified.
- Celltype_minor UMAP: This level of annotation provides finer granularity within the major cell types. For example, T cells are differentiated into T cell CD4+ and T cell CD8+, Myeloid cells into Macrophage and Dendritic cell. These minor cell types also form well-defined, generally discrete clusters, often nested within their corresponding major cell type regions, further affirming the quality of the annotation.
- Celltype_subset UMAP: At the highest resolution, various cell subsets (e.g., Macrophage (M1, M2A-D), T cell (Treg, Th1, Th2, Th17, Th22, T_Naive, T_Cyto), diverse Intestinal Epithelial cells like Enterocytes, Goblet cells, Paneth cells, and Tuft cells) are identified. These subsets typically form coherent sub-clusters within their parent minor cell types, demonstrating successful sub-clustering and consistent annotation down to fine cellular states. The distinct separation of these subsets suggests biologically meaningful differences captured by the gene expression profiles.
Biological Interpretation
The UMAP visualizations provide crucial insights into the cellular landscape of the colon across healthy and inflammatory conditions, supporting the inferred context of Inflammatory Bowel Disease (Colitis).
- Inflammation-driven Cellular Reprogramming and Infiltration: The clear separation of HC from AC/CC conditions suggests substantial alterations in cell type composition and/or gene expression programs during colitis. The significant overlap between AC and CC conditions, despite some distinct regions, could indicate shared inflammatory pathways or a progression where acute inflammation transitions into chronic forms, involving similar cellular responses or persistent immune cell infiltration [PubMed search: colitis acute chronic immune cells].
- Diverse Immune Cell Involvement: The distinct clustering of numerous immune cell populations at major, minor, and subset levels (e.g., T cells, B cells, Macrophages, Dendritic cells, ILCs) highlights the complex immune response in the colon. The differential distribution of these cell types across the condition UMAPs (not directly shown by individual UMAPs, but inferred from the distinct condition clusters) would be a critical next step to investigate which specific immune populations are expanded or activated in AC and CC conditions. For example, specific macrophage subtypes (M1 vs. M2) or T helper cell subsets (Th1, Th2, Th17, Treg) are known to play distinct roles in orchestrating inflammatory responses in the gut [GeneCards: TH17; PubMed search: macrophage subtypes inflammatory bowel disease].
- Impact on Resident Cells: The clear annotation of various Intestinal Epithelial cell types (Enterocytes, Goblet, Paneth, Tuft, Microfold, Crypt cells) and Stromal cells (Fibroblast, Smooth muscle cell) is vital. Changes in the relative proportions or transcriptional states of these resident cells in AC/CC regions would reflect the direct impact of inflammation on tissue function, barrier integrity, and repair mechanisms in the colon [PubMed search: intestinal epithelial barrier inflammatory bowel disease]. The maintenance of distinct clusters for these cells suggests that their fundamental identities are preserved even under inflammatory stress, though their expression profiles may be perturbed.
Annotation Notes
The UMAP embeddings demonstrate a high quality of cell type annotation across all hierarchical levels (major, minor, subset). The distinct clustering of various cell types and their consistent organization within the embedding space provide strong confidence in the assigned cell identities. The low number of 'unassigned' cells, which are also scattered rather than forming coherent problematic clusters, further supports the robustness of the annotation. This well-annotated dataset forms a solid foundation for downstream differential expression, gene set enrichment, and cell-cell interaction analyses to unravel the molecular mechanisms underlying acute and chronic colitis.
2. Major Cell Type Score Visualization on UMAP
[Analysis Visualization Results]...
Analysis Overview
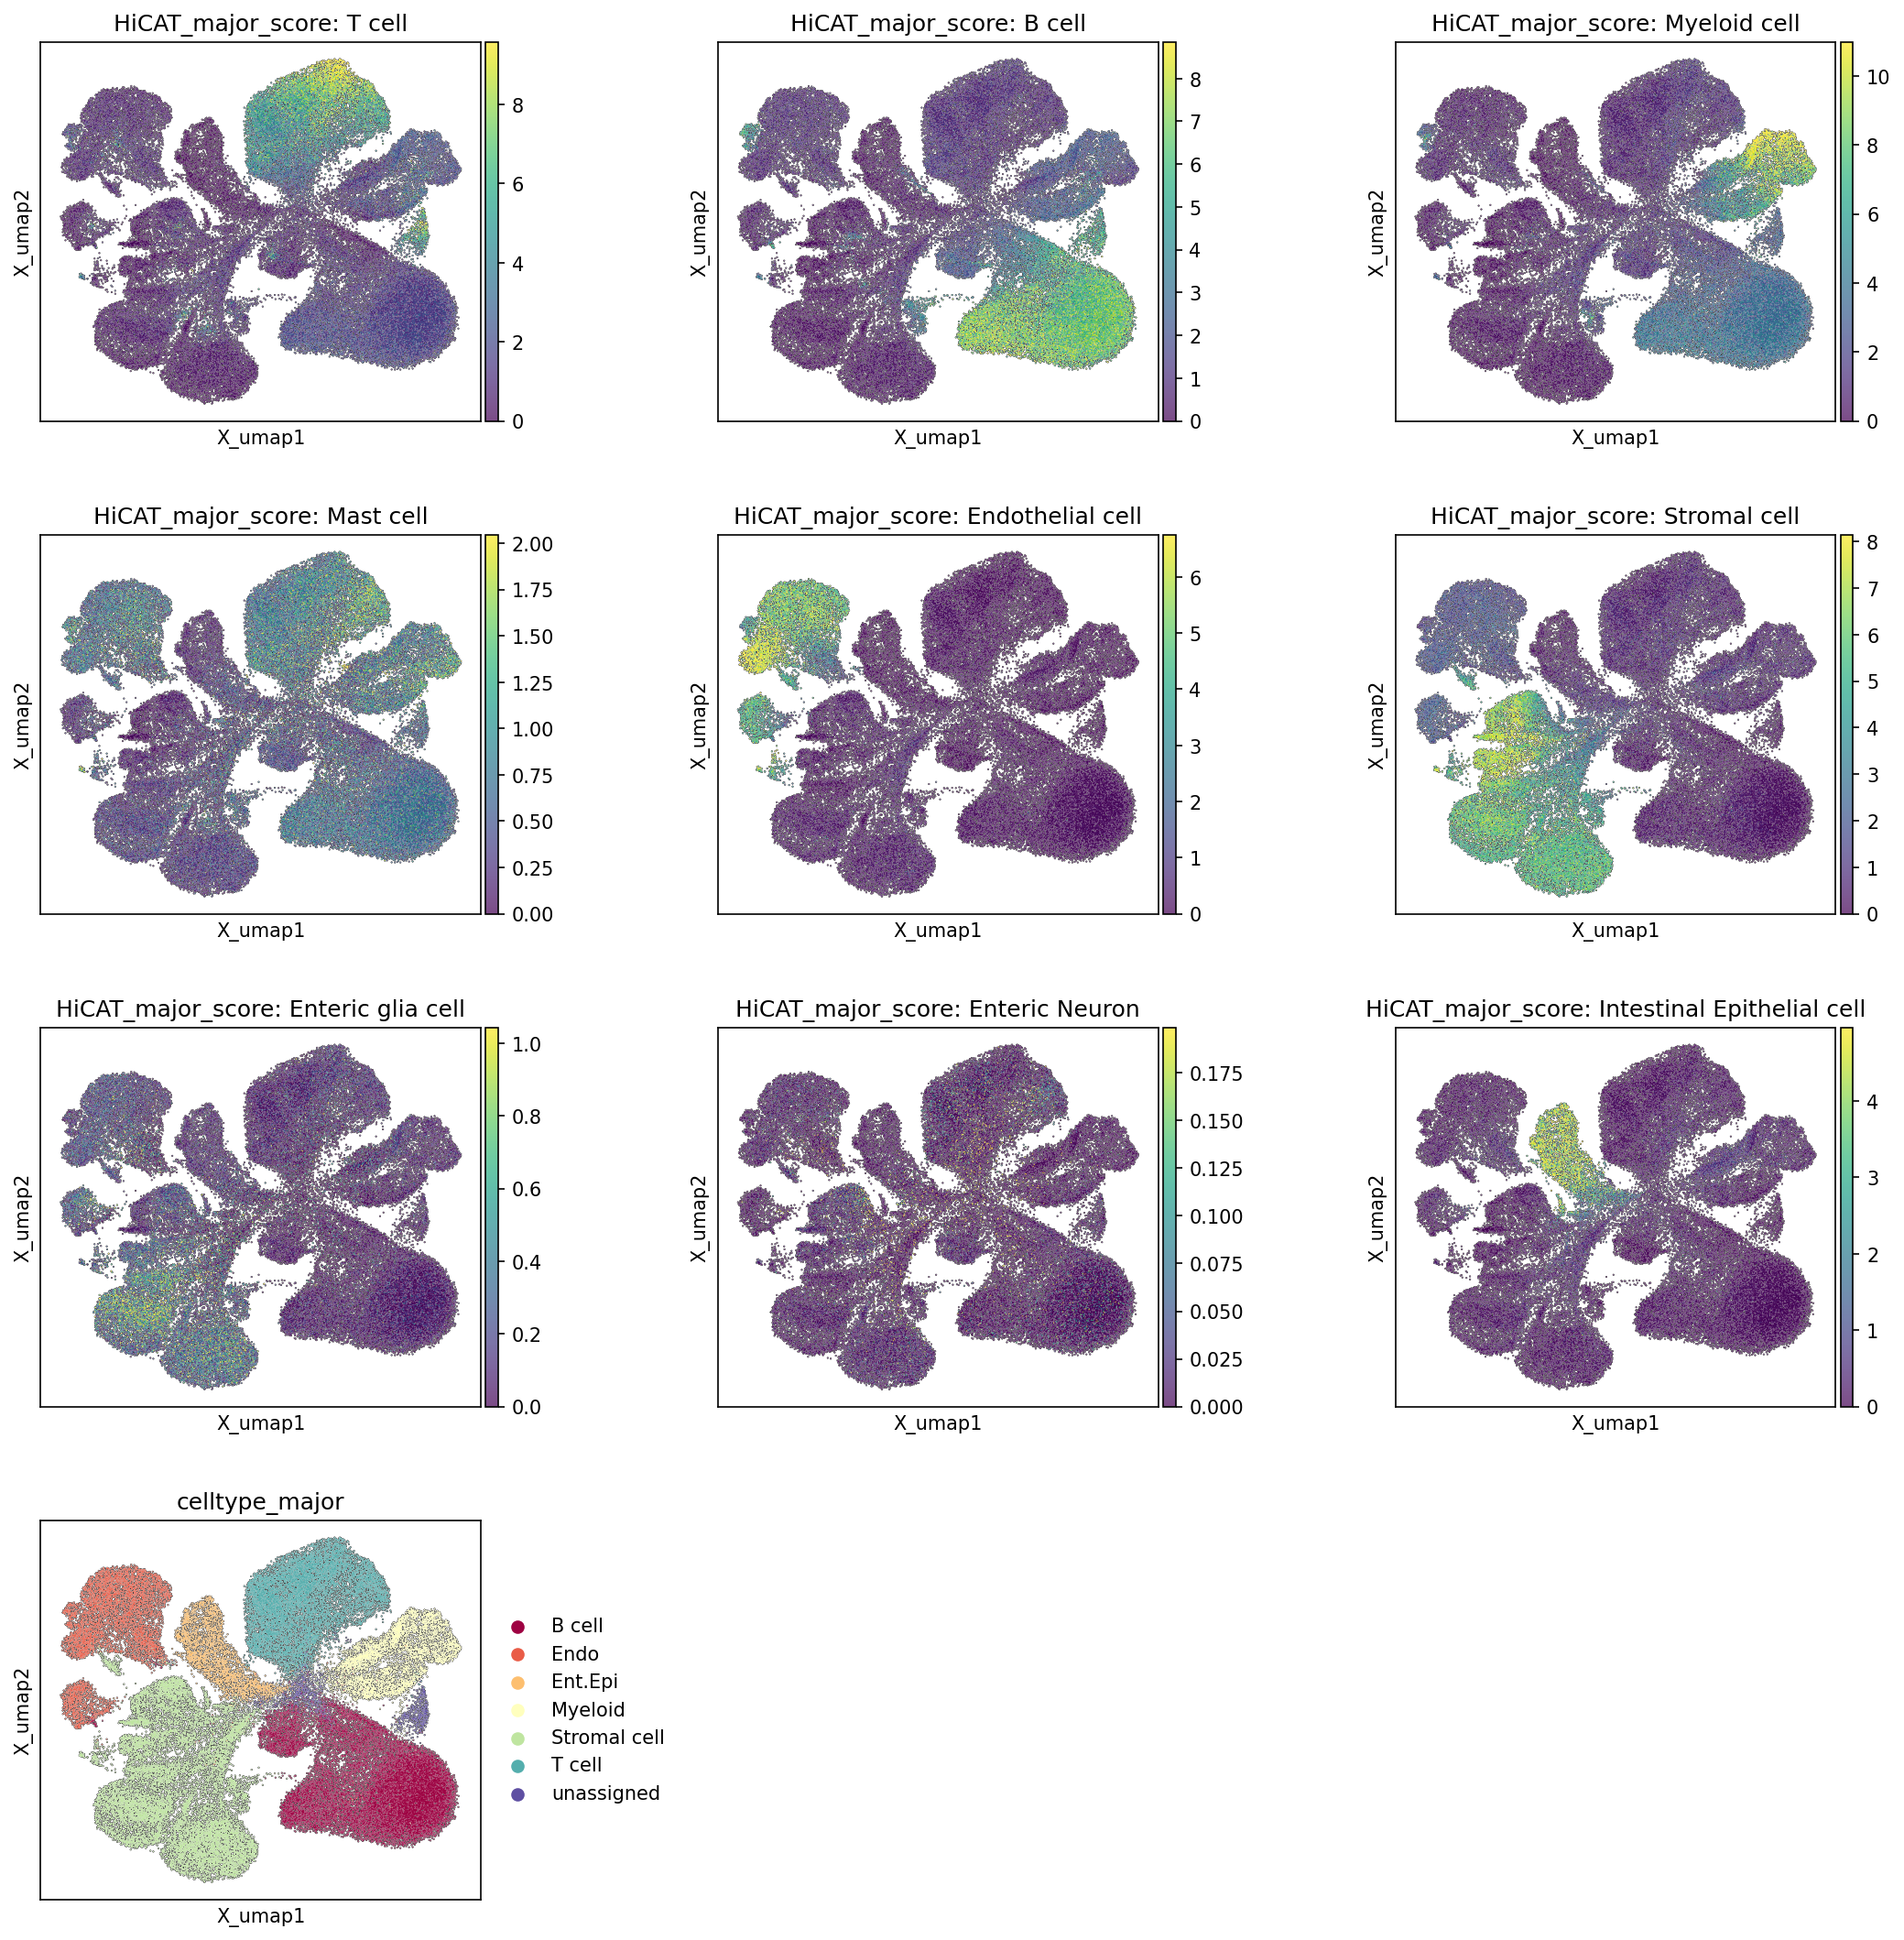
This analysis visualizes the distribution of major cell type scores across a Uniform Manifold Approximation and Projection (UMAP) embedding of single-cell RNA-seq data from mouse Colon tissue. The purpose is to assess how well defined and spatially segregated major cell populations are, using a computed "HiCAT_major_score" for each cell type. The results are compared against the existing celltype_major annotations to evaluate the consistency of cell type identification and embedding structure.
Visual Summary
The UMAP plots provide a comprehensive overview of the cellular landscape:
- Overall UMAP Structure (celltype_major plot): The final UMAP plot, colored by celltype_major annotations, reveals distinct, well-separated clusters for key cell populations such as T cells (light green), B cells (burgundy), Myeloid cells (yellow), Stromal cells (light blue), Endothelial cells (orange), and an aggregated "Ent.Epi" group (beige/light yellow) which represents Intestinal Epithelial cells and enteric nervous system components. A smaller "unassigned" population (dark blue) is also present, spread across the UMAP.
HiCAT_major_score Plots and Correspondence to celltype_major:
- T cell, B cell, Myeloid cell, Stromal cell, Endothelial cell: These cell types exhibit strong, concentrated high scores (yellow/green regions) that align very well with their respective distinct clusters in the celltype_major annotated UMAP. This indicates that these populations are transcriptionally distinct and well-defined by the markers used for scoring. For instance, the HiCAT_major_score: T cell plot shows high values precisely in the region annotated as T cells.
- Intestinal Epithelial cell: This score also shows a robust, high-scoring region corresponding to a large cluster, largely overlapping with the "Ent.Epi" region in the celltype_major plot, which is expected as Intestinal Epithelial cells are a major component of this group.
- Enteric glia cell and Enteric Neuron: These scores are generally lower and more diffuse compared to the major immune or stromal populations, but they show localized enrichment within the broader "Ent.Epi" region. This suggests they are present but might be rarer or have less distinct expression profiles compared to more abundant cell types. The range of scores for these populations is considerably lower (e.g., max ~1.0 for Enteric glia, ~0.175 for Enteric Neuron) compared to immune cells (e.g., max ~8-10).
- Mast cell: The HiCAT_major_score: Mast cell plot shows relatively low scores (max ~2.0) distributed sparsely, with small areas of higher intensity. This suggests Mast cells are either a rarer population or their defining markers are less strongly expressed across the dataset compared to other major cell types. It does not form a clearly demarcated, high-scoring cluster like T cells or B cells.
Biological Interpretation
The UMAP visualizations of cell type scores confirm the successful identification and spatial separation of major cellular components within the mouse Colon tissue.
- Robust Cell Type Identification: The strong alignment between the HiCAT_major_score distributions and the celltype_major annotations provides high confidence in the quality of cell type assignments for most major populations, including T cells, B cells, Myeloid cells, Stromal cells, Endothelial cells, and Intestinal Epithelial cells. These are all crucial cell types for maintaining gut homeostasis and orchestrating immune responses in the colon.
- Colon-Specific Cell Diversity: The presence of specialized cell types such as Intestinal Epithelial cells (essential for barrier function), Enteric glia, and Enteric Neurons (components of the enteric nervous system regulating gut function) is consistent with the Colon tissue origin.
- Inflammatory Context: In the inferred context of Inflammatory Bowel Disease (Colitis), the clear presence and distinct clustering of immune cells (T cells, B cells, Myeloid cells) and stromal cells are particularly relevant. These populations play central roles in inflammatory processes. Changes in their composition, activation state, and spatial organization are hallmarks of Colitis. The distinct localization of these cells on the UMAP provides a solid foundation for further differential analyses comparing the AC, CC, and HC conditions.
- Granularity within Epithelial/Neural Compartment: The individual scores for Enteric glia and Enteric Neuron, while lower in overall magnitude, demonstrate that finer distinctions can be made within the broader "Ent.Epi" celltype_major group, suggesting a potential for more granular analysis of these crucial non-immune cell types in gut health and disease.
Annotation Notes
- The HiCAT_major_score plots largely validate the pre-existing celltype_major annotations, reinforcing confidence in the cell type assignments used for downstream analyses.
- The "unassigned" population visible in the celltype_major plot does not show strong enrichment for any single HiCAT_major_score among those plotted. This indicates that these cells either represent a mix of progenitor/transitional states, are technical artifacts (e.g., doublets, low-quality cells), or belong to very rare populations not specifically scored here, warranting further investigation.
- The relatively low score magnitude and sparse distribution for Mast cells suggest they might be a less abundant cell type in this dataset or require a more refined marker set for robust scoring as a major cell type.
- The combination of "Intestinal Epithelial cell," "Enteric glia cell," and "Enteric Neuron" into a single "Ent.Epi" group in the celltype_major legend implies a broader classification at that level, while the individual score plots demonstrate the ability to distinguish these components more finely.
3. Marker Expression Profiling and Celltype Annotation Validation in Colon Tissue Subsets
[Analysis Visualization Results]...
Analysis Overview
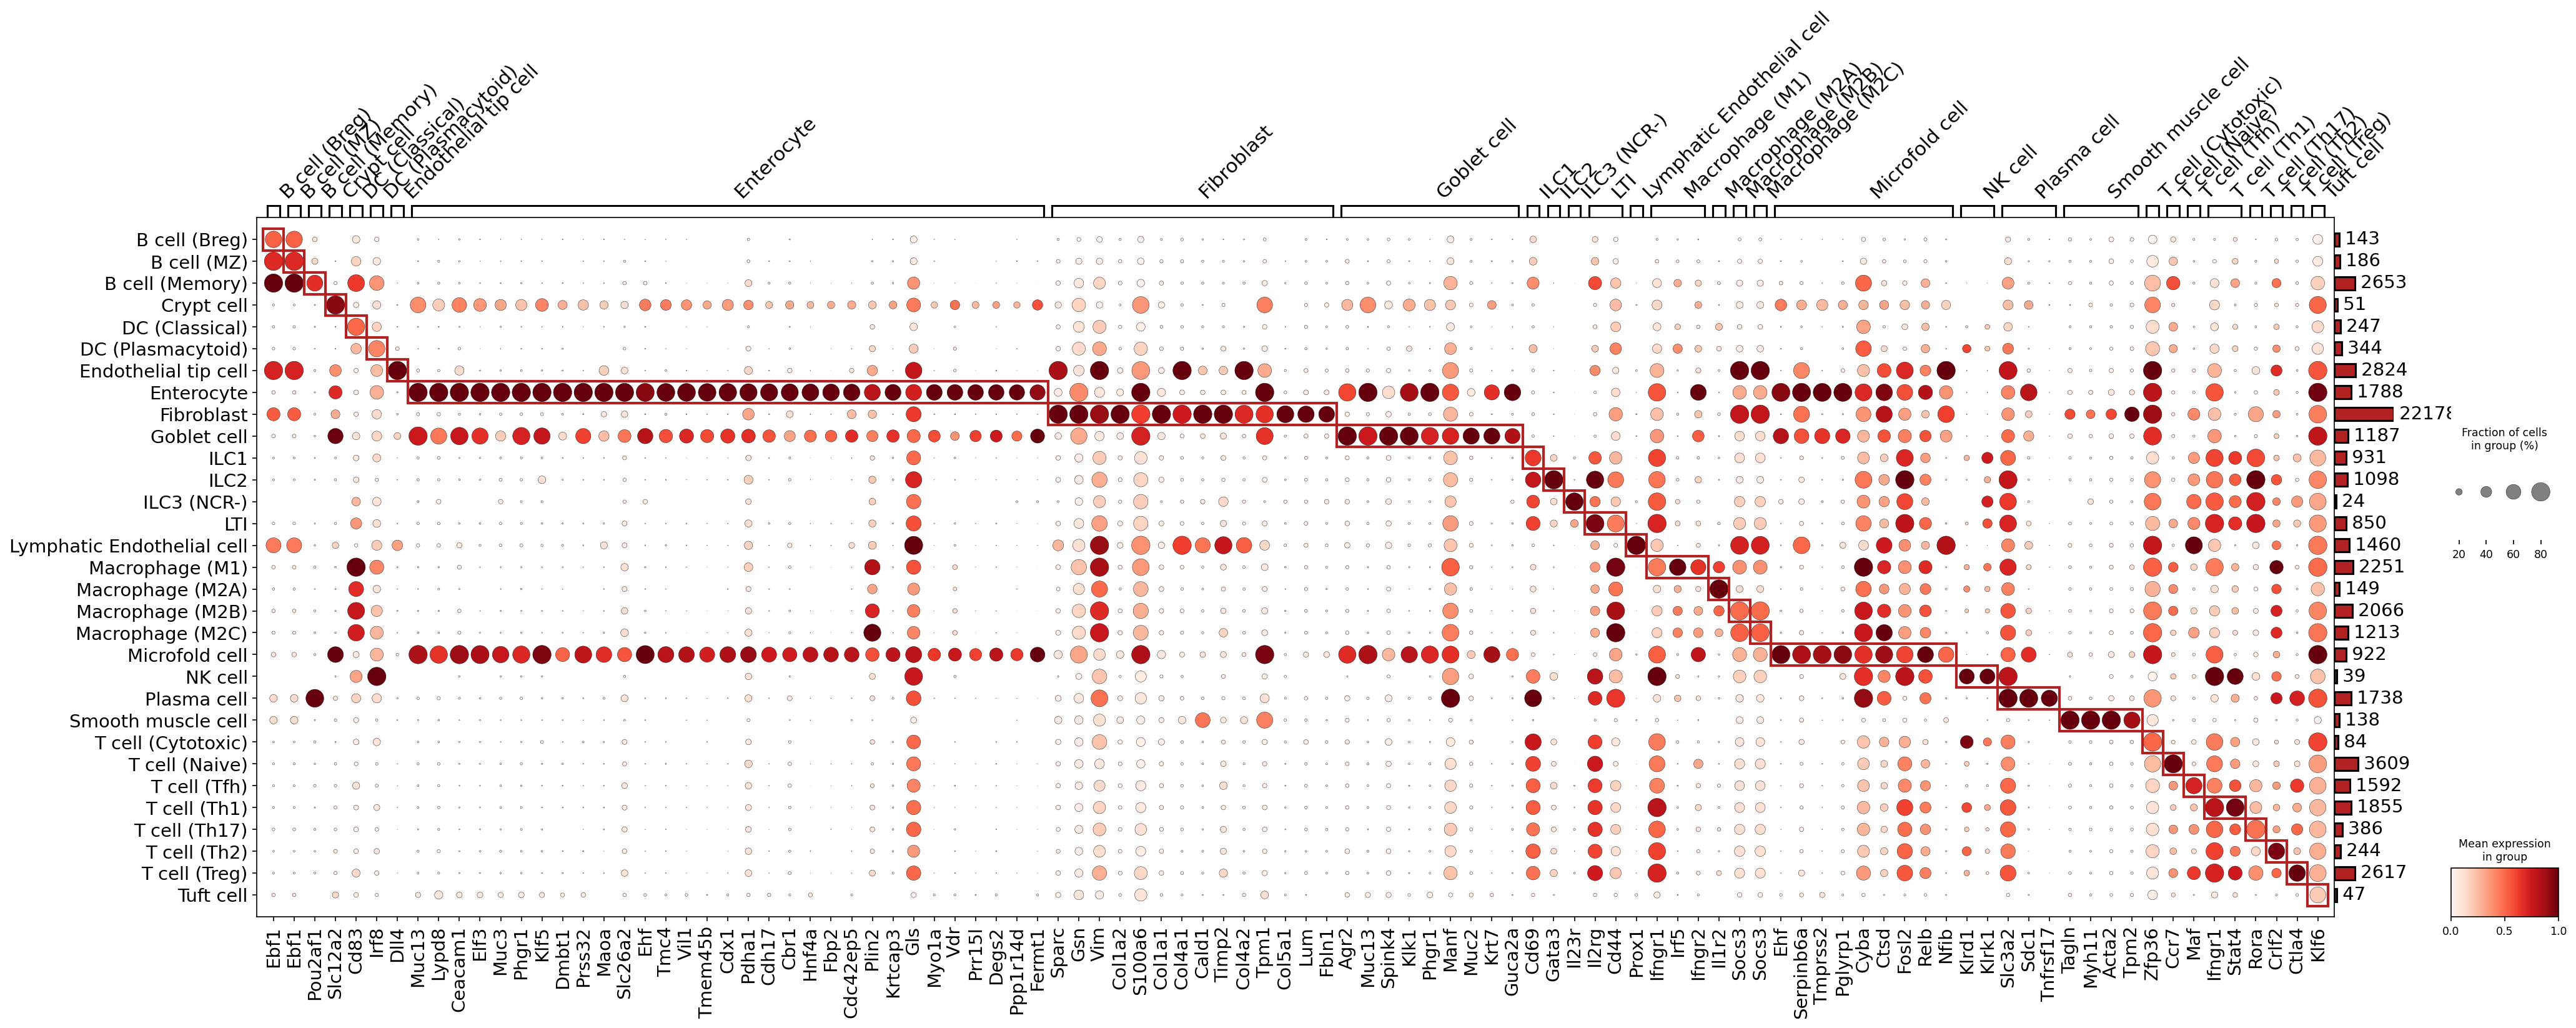
This analysis presents a dot plot illustrating the expression patterns of a curated set of marker genes across various celltype_subset populations identified in the single-cell RNA-seq data from mouse colon tissue. The primary goal of this visualization is to validate the robustness and specificity of the assigned cell type annotations based on the expression of known cellular markers. The plot shows the mean expression level (color intensity) and the fraction of cells expressing a gene (dot size) for each gene-cell type pair. Markers were discovered across all cell types (target_cell = None), and genes commonly expressed in three or more groups were removed to emphasize specificity.
Visual Summary
The dot plot effectively visualizes the expression of 100 top marker genes across 40 distinct celltype_subset annotations. Each row represents a cell type, and each column represents a marker gene.
- Distinct Expression Patterns: A prominent feature is the clear grouping of highly expressed marker genes within their respective annotated cell type subsets, often highlighted by the red bounding boxes. This indicates strong specificity for many of the identified markers.
- Cell Type Specificity: For instance, B cell subsets (Breg, MZ, Memory) robustly express canonical B cell markers like Ebf1, Cd79a, Cd79b, and Ms4a1 (CD20). Intestinal epithelial cell subsets (Crypt cell, Enterocyte, Goblet cell, Microfold cell, Paneth cell, Tuft cell) show distinct but specific marker profiles, such as Lgr5 for Crypt cells, Vil1 for Enterocytes, Muc2 for Goblet cells, and Gp2 for Microfold cells.
- Immune Cell Heterogeneity: Various immune cell populations (T cells, B cells, Macrophages, Dendritic cells, ILCs, NK cells, Plasma cells) are well-distinguished by their specific marker signatures. T cell subsets, for example, demonstrate unique patterns for genes like Foxp3 (Treg), Gata3 (Th2), and Il23r (Th17). Macrophages of different polarization states (M1, M2A, M2B, M2C) share general myeloid markers but also show some differential expression for genes like Spp1 (M1) and Irf5 (M1).
- Stromal and Endothelial Cells: Fibroblasts exhibit a signature with Col1a1, Col1a2, and Dcn, while Endothelial cells (Endothelial tip cell, Lymphatic Endothelial cell) express pan-endothelial markers like Pecam1 (CD31) and subset-specific markers such as Prox1 for lymphatic endothelial cells.
- Cell Group Sizes: The bar plot on the right indicates the number of cells belonging to each celltype_subset, providing context for the observed expression levels and fractions. Most cell types have a substantial number of cells, contributing to reliable marker detection.
Biological Interpretation
The observed marker expression patterns largely align with established knowledge of cellular identity in the colon, providing strong validation for the celltype_subset annotations.
- Robust Cell Identification: The high specificity and strong expression of key lineage markers for diverse cell types—ranging from various immune cell populations (e.g., T helper cell subtypes, macrophage polarization states, B cell subsets), epithelial cells (e.g., stem-like Crypt cells, absorptive Enterocytes, secretory Goblet and Paneth cells, chemosensory Tuft cells, antigen-sampling Microfold cells), to stromal (Fibroblasts) and endothelial cells—confirm the successful identification and clustering of these populations. This is particularly important in a complex tissue like the colon, which harbors a rich and dynamic cellular ecosystem.
- Intestinal Epithelial Cell Specialization: The distinct marker profiles for different intestinal epithelial subsets (e.g., Lgr5 for crypt base columnar cells [GeneCards], Muc2 for goblet cells [GeneCards]) confirm the accurate annotation of these functionally specialized cells that are critical for gut barrier function and host-microbe interactions.
- Immune Cell Diversity in Colitis Context: The precise identification of various immune cell subsets is highly relevant given the inferred biological context of Inflammatory Bowel Disease (Colitis). The presence and robust annotation of specific T cell subsets (e.g., Th1, Th17, Treg), B cell subsets, macrophages, and ILCs provide a solid foundation for further investigations into their roles and changes during acute and chronic colitis. For instance, the accurate identification of T cell (Treg) cells via Foxp3 expression [GeneCards] is crucial, as these cells play a central role in immune tolerance and dampening inflammation in the gut. Similarly, distinguishing macrophage subsets is important for understanding their diverse pro- or anti-inflammatory functions in IBD pathogenesis [PMID: 32677583].
- Surface Marker Enrichment: The parameter surfaceome_only = True in marker finding ensures that the identified markers are predominantly surface proteins. This is valuable for potential future validation experiments using flow cytometry or for identifying targets for antibody-based therapies, although such applications are beyond the scope of this annotation validation step.
Annotation Notes
Based on the marker expression dot plot, the celltype_subset annotations appear to be highly accurate and well-supported by the expression of known, specific marker genes. The distinct and localized expression patterns provide strong confidence in the biological identity of each cell population. This robust annotation serves as a reliable basis for subsequent differential expression, pathway analysis, and cell-cell interaction studies, particularly in the context of understanding cellular changes in inflammatory conditions like colitis.
4. Minor Cell Type Population Analysis in Colitis Conditions
[Analysis Visualization Results]...
Analysis Overview
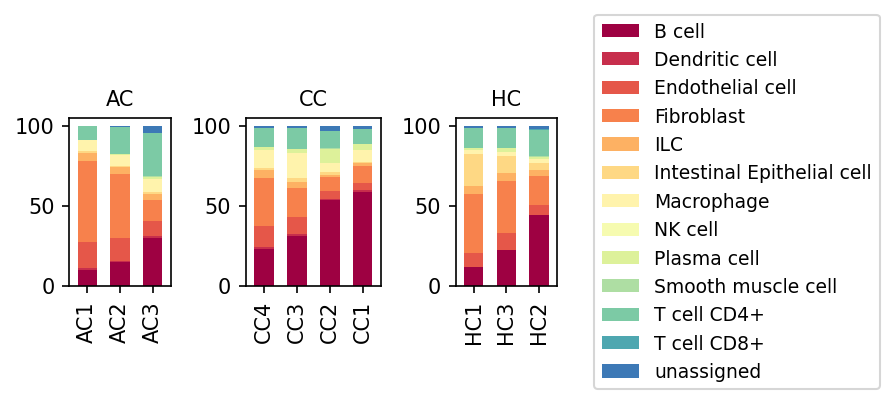
This analysis presents a stacked bar plot illustrating the relative proportions of minor cell types across individual samples from three conditions: Healthy Control (HC), Acute Colitis (AC), and Chronic Colitis (CC). The visualization allows for a direct comparison of cellular composition shifts in the colon tissue under different inflammatory states, providing insights into the immune and stromal cell landscape changes during colitis.
Visual Summary
The population bar plot reveals distinct shifts in minor cell type proportions across the three conditions:
Healthy Control (HC) Samples:
- Intestinal Epithelial cells represent a substantial proportion, indicating a healthy gut lining.
- Fibroblasts and B cells are also prominent components.
- Other immune cells like T cells (CD4+ and CD8+), Macrophages, Dendritic cells, and ILCs are present in smaller, yet consistent, proportions.
Acute Colitis (AC) Samples:
- A notable decrease in the relative proportion of Intestinal Epithelial cells is observed compared to HC.
- There is an apparent increase in T cell (CD4+ and CD8+) populations, consistent with an active immune response.
- Fibroblasts remain a significant component, while B cell proportions appear somewhat reduced compared to HC.
Chronic Colitis (CC) Samples:
- The most striking feature is a dramatic expansion of B cell populations, which often become the predominant cell type in several CC samples (e.g., CC1, CC2).
- Intestinal Epithelial cells show a sustained and often more pronounced reduction compared to both HC and AC, indicating ongoing epithelial damage.
- T cell (CD4+ and CD8+) proportions remain elevated compared to HC, though the magnitude of increase is less prominent than the B cell expansion in this chronic phase.
- Macrophages appear to represent a relatively smaller fraction of the total cell population compared to HC.
Biological Interpretation
The observed shifts in cell populations align well with the inferred biological context of Inflammatory Bowel Disease (Colitis) progression:
- Epithelial Damage and Loss: The progressive decrease in Intestinal Epithelial cell proportions from HC to AC and further to CC strongly suggests increasing damage and loss of the gut epithelial barrier, a hallmark of active and chronic colitis. This epithelial erosion compromises barrier function and exacerbates inflammation.
- Acute Inflammatory Response (AC): The increase in T cell populations in AC samples reflects an acute adaptive immune response characteristic of initial inflammation. T cells, particularly helper T cells (CD4+) and cytotoxic T cells (CD8+), play critical roles in mediating inflammatory processes in the gut.
- Chronic Inflammation and B Cell Dominance (CC): The profound expansion of B cells in CC is a key indicator of chronicity and a shift towards an adaptive immune response with a significant humoral component. B cells contribute to chronic inflammation through various mechanisms, including antibody production (e.g., autoantibodies), antigen presentation, and cytokine secretion, which can sustain and amplify the inflammatory cascade [PubMed: 32671510]. This B cell accumulation may also reflect the formation of tertiary lymphoid structures, common in chronic inflammatory conditions.
- Altered Immune Cell Balance: While macrophages are crucial for gut homeostasis and inflammation, their relative decrease in CC alongside the substantial increase in B cells suggests a re-orchestration of the immune cell landscape, potentially driven by the sustained chronic inflammatory environment. Fibroblasts, remaining a consistent component, likely contribute to tissue remodeling and scar formation processes in chronic disease.
Clinical or Translational Implications
The distinct cellular landscape observed in acute versus chronic colitis has several potential clinical and translational implications:
- Disease Stage Biomarkers: The differential expansion of T cells in acute phases and a predominant B cell response in chronic phases could serve as cellular biomarkers for distinguishing between active disease stages or assessing disease chronicity.
- Therapeutic Targeting: The significant B cell expansion in chronic colitis suggests that B cells could be a highly relevant therapeutic target for managing chronic IBD. Strategies aimed at depleting B cells or modulating their function, similar to treatments for other autoimmune diseases, might be effective in a subset of chronic colitis patients.
- Understanding Pathogenesis: These population shifts offer valuable insights into the dynamic immune processes underlying colitis. Understanding how the immune system transitions from an acute, predominantly T-cell-driven response to a chronic state with prominent B cell involvement is crucial for developing targeted interventions.
5. T Cell and Innate Lymphoid Cell Subpopulation Shifts in Colitis
[Analysis Visualization Results]...
Analysis Overview
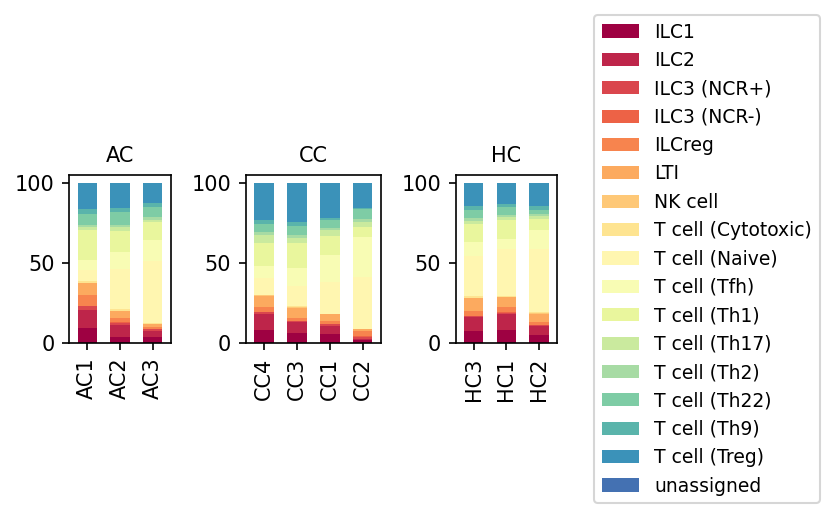
This analysis presents a stacked bar plot visualizing the proportional distribution of various T cell and innate lymphoid cell (ILC) subsets within the overall "T cell" major cell type across individual samples from three conditions: Acute Colitis (AC), Chronic Colitis (CC), and Healthy Control (HC). Each bar represents a single sample, and the colored segments indicate the percentage contribution of specific cell subsets as defined by celltype_subset. The purpose is to identify changes in the cellular composition of the T cell compartment in colitis conditions compared to healthy controls.
Visual Summary
The stacked bar plots illustrate distinct shifts in the proportions of T cell and ILC subsets when comparing colitis conditions (AC and CC) to the healthy control (HC).
- Healthy Control (HC) Samples: In healthy samples (HC1, HC2, HC3), "T cell (Naive)" (light yellow) constitutes a substantial proportion, typically ranging from approximately 30-40% of the total T cell compartment. Regulatory T cells, "T cell (Treg)" (dark blue), are also clearly visible, making up a notable fraction. Innate Lymphoid Cells (ILC1, ILC2, ILC3 (NCR+), ILC3 (NCR-), ILCreg, LTI; depicted in shades of red/orange) are present but in relatively smaller proportions.
- Acute Colitis (AC) Samples: The AC samples (AC1, AC2, AC3) show a marked reduction in the proportional representation of "T cell (Naive)" compared to HC. Concurrently, there is a prominent increase in the combined proportion of ILCs, particularly "ILC1" (dark red), "ILC2" (red), and "ILC3 (NCR+)" (orange-red), which collectively form a larger segment of the immune cell landscape within this compartment. Proportions of effector T helper cells like "T cell (Th1)" (medium yellow) and "T cell (Th17)" (light green) appear maintained or relatively increased compared to the decreased naive cells.
- Chronic Colitis (CC) Samples: Similar to AC, chronic colitis samples (CC1, CC2, CC3, CC4) exhibit a reduction in "T cell (Naive)" proportions. The increased representation of ILCs (ILC1, ILC2, ILC3 (NCR+)) is also observed in CC, indicating a sustained or chronic inflammatory signature. The proportions of various effector T cell subsets, such as "T cell (Th1)" and "T cell (Th17)", also appear to be maintained or potentially elevated in comparison to the healthy state, or relative to the naive T cell decline. "T cell (Treg)" proportions appear relatively stable or slightly decreased proportionally across both colitis conditions compared to HC.
Biological Interpretation
The observed changes in T cell and ILC subset populations strongly align with the inferred context of Inflammatory Bowel Disease (Colitis).
- Shift from Naive to Effector Phenotypes: The consistent decrease in "T cell (Naive)" proportions in both acute and chronic colitis samples suggests a significant immune activation and differentiation process. Naive T cells are typically abundant in healthy states and differentiate into various effector and memory subsets upon encountering antigens during inflammation. This shift is a hallmark of an active immune response within the colon.
- Expansion of Innate Lymphoid Cells (ILCs): The prominent increase in ILC1, ILC2, and ILC3 (NCR+) populations in both AC and CC conditions is a key finding.
- ILC1s are known to produce IFN-γ and are associated with Th1-type immune responses, contributing to tissue inflammation and damage in conditions like IBD [1].
- ILC2s secrete Th2-associated cytokines (IL-5, IL-13) and are involved in allergic inflammation and tissue repair, but also contribute to intestinal pathology in some IBD contexts [2].
- ILC3s, particularly RORγt-dependent NCR+ ILC3s, produce IL-17 and IL-22, which are crucial for maintaining mucosal barrier integrity but also potent drivers of inflammation when dysregulated in IBD [3]. Their expansion suggests an active role in mediating the inflammatory cascade in colitis.
- Role of Effector T Helper Cells: The maintained or relatively increased proportions of effector T helper cells such as "T cell (Th1)", "T cell (Th17)", "T cell (Th2)", and "T cell (Th22)" reflect a sustained pro-inflammatory environment. Th1 cells drive IFN-γ-mediated inflammation, while Th17 cells are central to intestinal inflammation through IL-17 production, both critical pathways in IBD pathogenesis [4].
- Regulatory T Cell (Treg) Dynamics: The relative stability or slight proportional decrease of "T cell (Treg)" in colitis suggests that their suppressive capacity might be overwhelmed by the heightened inflammatory milieu, or that their expansion is insufficient to control the ongoing immune activation. Tregs are crucial for maintaining immune homeostasis and preventing excessive inflammation.
Overall, the data indicate a robust inflammatory immune cell response in the colon during both acute and chronic colitis, characterized by a decrease in naive T cells and a notable expansion of various ILC and effector T helper cell populations, all contributing to the pathogenic processes observed in IBD.
Clinical or Translational Implications
The observed shifts in T cell and ILC populations carry significant clinical and translational implications for Inflammatory Bowel Disease:
- Biomarker Potential: The proportional changes in specific ILC and T cell subsets (e.g., decrease in Naive T cells, increase in ILC1, ILC2, ILC3 (NCR+), and Th1/Th17 cells) could serve as valuable biomarkers for diagnosing inflammatory disease activity, staging of colitis (acute vs. chronic features), or monitoring response to therapeutic interventions.
- Therapeutic Targets: The expansion of pro-inflammatory ILC subsets (ILC1, ILC3) and effector T helper cells (Th1, Th17) highlights these populations as potential therapeutic targets for IBD. Strategies aimed at modulating their activation, proliferation, or cytokine production could offer novel treatment avenues to dampen chronic inflammation.
- Disease Mechanisms: Understanding the precise roles and interactions of these expanded ILC and T cell subsets provides critical insights into the underlying immunopathogenesis of colitis, which can guide the development of more targeted and effective therapies. For instance, therapies targeting IL-17 or IFN-γ pathways, which are products of Th17 and Th1/ILC1 cells respectively, are already being explored or are in use for IBD.
---
References
- ILC1 in IBD: Powell, N., et al. "Interferon-γ-producing innate lymphoid cells are a critical component of TNF-α-driven intestinal inflammation." *J Exp Med*, 2012. PubMed Search: ILC1 IBD IFN-gamma
- ILC2 in IBD: Barnich, N., et al. "Type 2 Innate Lymphoid Cells in Crohn’s Disease." *Front Immunol*, 2021. PubMed Search: ILC2 Crohn's disease
- ILC3 in IBD: Sawa, S., et al. "ILC3: A Key Player in Mucosal Immunity and Inflammation." *Trends Immunol*, 2016. PubMed Search: ILC3 IBD IL-17 IL-22
- Th1/Th17 in IBD: Strober, W., et al. "The immunopathogenesis of inflammatory bowel disease." *Annu Rev Immunol*, 2013. PubMed Search: Th1 Th17 IBD pathogenesis
6. Condition-Specific Shifts in T Cell and ILC Subsets in Colitis
[Analysis Visualization Results]...
Analysis Overview
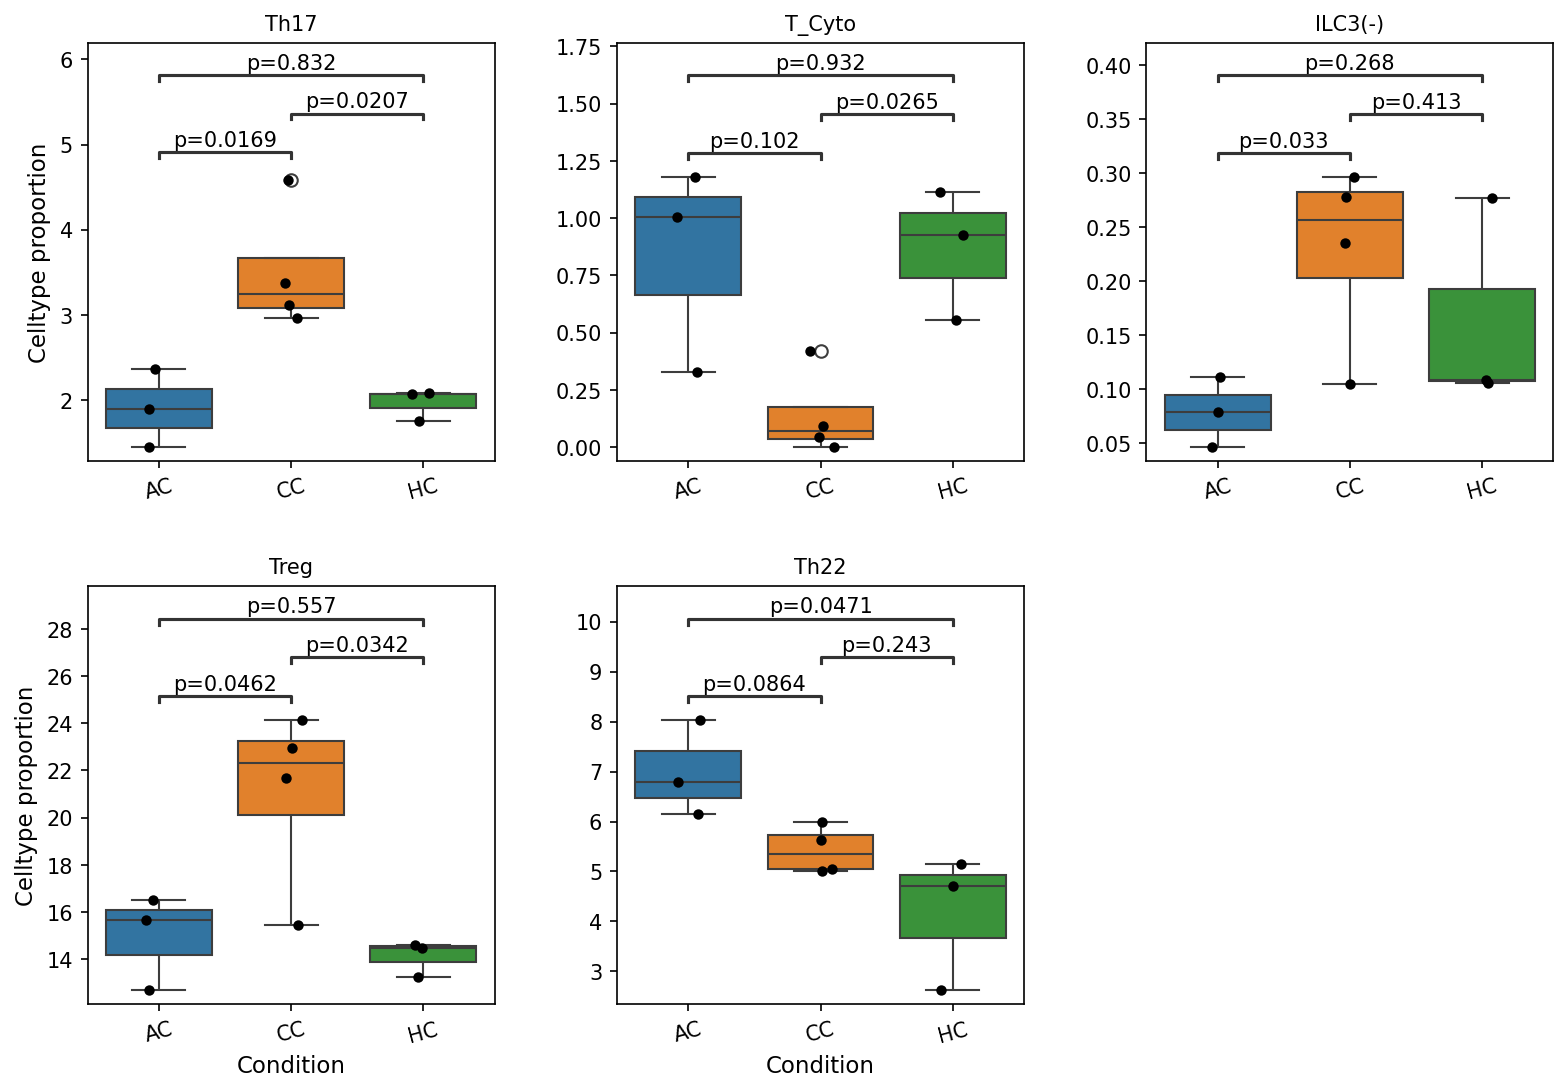
This analysis evaluates the relative proportions of various T cell subsets and ILC3(-) populations across three distinct conditions: Acute Colitis (AC), Chronic Colitis (CC), and Healthy Control (HC). The box plots presented visualize these cell type proportions, with statistical significance (p-values) indicated for pairwise comparisons between conditions. The primary objective is to identify specific immune cell population shifts that characterize the acute and chronic phases of colitis, providing insight into disease progression and immune modulation in the mouse colon.
Visual Summary
The box plots illustrate the celltype proportion for five specific populations: Th17, T_Cyto (Cytotoxic T cells), ILC3(-), Treg (Regulatory T cells), and Th22, across the AC, CC, and HC conditions.
Key observations and statistically significant differences (p < 0.1, focusing on p < 0.05) include:
- Th17 cells: Show significantly higher proportions in Chronic Colitis (CC) compared to both Acute Colitis (AC) (p=0.0169) and Healthy Control (HC) (p=0.0207). There is no significant difference between AC and HC.
- T_Cyto cells: Are significantly decreased in Chronic Colitis (CC) compared to Healthy Control (HC) (p=0.0265). Their proportion in AC is similar to HC.
- ILC3(-) cells: Exhibit a significantly higher proportion in Chronic Colitis (CC) compared to Acute Colitis (AC) (p=0.033). No significant differences are observed when comparing CC or AC to HC.
- Treg cells: Are significantly elevated in Chronic Colitis (CC) compared to both Acute Colitis (AC) (p=0.0462) and Healthy Control (HC) (p=0.0342). AC and HC proportions are similar.
- Th22 cells: Are significantly increased in Acute Colitis (AC) compared to Healthy Control (HC) (p=0.0471). A trend of higher Th22 proportions in AC compared to CC is also observed (p=0.0864).
Biological Interpretation
The observed changes in T cell and ILC populations provide critical insights into the distinct immunological responses associated with acute versus chronic inflammatory states in the colon.
- Chronic Colitis (CC) Profile: The significant increases in Th17 cells and ILC3(-) cells in chronic colitis strongly suggest a persistent pro-inflammatory immune environment. Both Th17 cells and ILC3s are known producers of IL-17 and IL-22, cytokines centrally involved in mucosal immunity and widely implicated in the pathogenesis of Inflammatory Bowel Disease (IBD) through their roles in driving inflammation and tissue damage PubMed search: Th17 IBD pathogenesis. The simultaneous elevation of Treg cells in CC is notable. While Tregs are generally immunosuppressive and crucial for maintaining immune tolerance, their increased presence in a chronically inflamed setting might represent a compensatory mechanism attempting to quell inflammation. Alternatively, these Tregs could be functionally impaired or represent a specific pro-inflammatory subset, as has been described in various chronic inflammatory conditions PubMed search: dysfunctional Treg IBD. The significant decrease in Cytotoxic T cells (T_Cyto) in CC might point to altered immune surveillance or T cell exhaustion, potentially contributing to the persistence of chronic inflammation.
- Acute Colitis (AC) Profile: The significant elevation of Th22 cells in AC compared to HC is a key finding. Th22 cells primarily produce IL-22, a cytokine recognized for its roles in maintaining epithelial barrier integrity and promoting tissue repair and regeneration in the gut PubMed search: IL-22 epithelial repair colitis. Their increased proportion during acute colitis could signify an early, protective, or repair-oriented immune response to acute epithelial damage and inflammation, distinct from the chronic inflammatory signature. The absence of significant changes in Th17 and Treg populations in AC compared to HC further suggests that the robust expansion of these subsets might be a hallmark of disease chronicity rather than acute inflammation.
Clinical or Translational Implications
These findings propose that the distinct immune cell subset profiles observed could serve as valuable tools for differentiating between acute and chronic phases of colitis, with potential ramifications for diagnosis and therapeutic intervention.
- Diagnostic Markers: The pronounced increases in Th17, Treg, and ILC3(-) cell populations, coupled with a decrease in T_Cyto cells, appear to be characteristic signatures of chronic colitis. Conversely, elevated Th22 cell proportions might be indicative of acute colitis. These distinct immunological profiles could be utilized as biomarkers to assist in disease staging and to guide personalized treatment strategies.
Therapeutic Targets
- For chronic colitis, therapies targeting the Th17/ILC3 axis, such as antagonists of IL-17 or IL-22 (with careful consideration of IL-22's dual roles), could be explored.
- Further investigation into the functional status of Tregs in chronic colitis is crucial. If these Tregs are found to be dysfunctional, therapeutic strategies aimed at restoring their suppressive capabilities or targeting specific pro-inflammatory Treg subsets could offer new avenues.
- Understanding the implications of reduced cytotoxic T cells in chronic colitis might lead to the development of therapies that enhance anti-inflammatory immune responses or restore effective immune clearance.
- Disease Mechanisms: These data underscore the dynamic and context-dependent roles of different T cell subsets and ILCs in the progression of colitis. They highlight that acute and chronic inflammation involve distinct immunological programs and cell-state shifts, providing a more granular understanding of immune dysregulation in IBD.
7. Macrophage Subset Population Dynamics Across Colitis Conditions
[Analysis Visualization Results]...
Analysis Overview
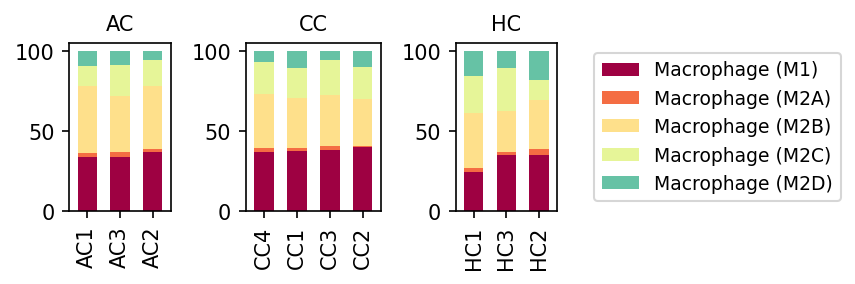
This analysis presents the relative proportions of different macrophage subsets (M1, M2A, M2B, M2C, M2D) within the 'Macrophage' cell population. The data is stratified by three conditions: Acute Colitis (AC), Chronic Colitis (CC), and Healthy Control (HC), across individual samples. This provides insight into how macrophage polarization shifts in the context of colonic inflammation.
Visual Summary
The stacked bar plots illustrate the proportional representation of five distinct macrophage subsets (Macrophage M1, M2A, M2B, M2C, M2D) across individual samples within each condition (AC, CC, HC).
- Healthy Control (HC) Condition: In healthy samples (HC1, HC3, HC2), Macrophage (M1) cells constitute approximately 20-35% of the total macrophage population. Macrophage (M2B) and Macrophage (M2C) are also significantly represented, contributing substantially to the overall M2 compartment. Macrophage (M2A) and Macrophage (M2D) are present in comparatively smaller proportions.
- Acute Colitis (AC) Condition: Samples from acute colitis (AC1, AC3, AC2) consistently show an increase in the relative proportion of Macrophage (M1) cells, rising to approximately 35-40% compared to HC. While Macrophage (M2B) remains a major component, its relative proportion appears to slightly decrease as the M1 fraction expands. Macrophage (M2A) shows a marginal increase or consistent presence.
- Chronic Colitis (CC) Condition: Similar to acute colitis, chronic colitis samples (CC4, CC1, CC3, CC2) maintain a high proportion of Macrophage (M1) cells, generally around 35-40%, indicative of persistent inflammation. The overall distribution of M2 subsets, particularly Macrophage (M2B), remains significant, reflecting the complex and heterogeneous nature of macrophage responses in chronic disease.
Overall, a clear trend emerges: both acute and chronic colitis conditions are characterized by a pronounced increase in the relative proportion of pro-inflammatory Macrophage (M1) cells compared to the healthy control state.
Biological Interpretation
The observed shifts in macrophage subsets provide valuable insights into the immune landscape of Inflammatory Bowel Disease (IBD), specifically colitis, given the colon tissue context.
- Pro-inflammatory Shift in Colitis: The increased proportion of Macrophage (M1) cells in both AC and CC conditions is a hallmark of an active inflammatory response. M1 macrophages are known for their pro-inflammatory functions, including the production of cytokines like TNF-α, IL-1β, and IL-6, which are critical drivers of tissue damage and inflammation in IBD. [See review on M1/M2 macrophages in inflammation: PubMed search for "M1 macrophage inflammatory bowel disease"]
- Complex Role of M2 Macrophages: While M1 macrophages increase, M2 subtypes (M2B, M2C, M2D) still constitute a substantial portion of the macrophage population across all conditions. M2 macrophages are a heterogeneous group generally associated with anti-inflammatory responses, immune regulation, tissue repair, and efferocytosis. Their continued presence in inflamed tissues suggests ongoing attempts at resolving inflammation or repairing tissue, which often co-occurs with active inflammation in chronic conditions. The specific roles of distinct M2 subtypes (M2A, M2B, M2C, M2D) can vary, with some potentially contributing to pro-fibrotic processes or immune suppression in chronic settings.
- Implications for Disease Progression: The sustained elevated M1 proportion in chronic colitis (CC) compared to healthy controls suggests a persistent pro-inflammatory environment that may contribute to chronic tissue damage and disease perpetuation. The relative stability of macrophage subset distribution between acute and chronic colitis implies that the pro-inflammatory shift initiated in the acute phase is largely maintained or inadequately resolved in the chronic phase.
Clinical or Translational Implications
Understanding the dynamics of macrophage subsets holds significant implications for the diagnosis, monitoring, and treatment of colitis.
- Biomarker Potential: The elevated proportion of M1 macrophages could serve as a diagnostic or prognostic biomarker for disease activity in colitis. Monitoring the M1/M2 balance might provide a more nuanced view of the inflammatory state and response to therapy.
- Therapeutic Targeting: Modulating macrophage polarization represents a promising therapeutic strategy. Interventions aimed at dampening M1 activation or promoting the differentiation/repolarization towards specific pro-resolving or regulatory M2 phenotypes could help mitigate inflammation, promote mucosal healing, and potentially alter the course of IBD. [See therapeutic strategies targeting macrophages in IBD: PubMed search for "macrophage polarization therapy colitis"]
- Heterogeneity and Precision Medicine: The presence of multiple M2 subtypes suggests the complexity of macrophage function in vivo. Future research and therapeutic development should consider the specific roles and targets within each macrophage subset to develop more precise and effective treatments for different stages or manifestations of colitis.
8. Macrophage Subset Proportion Shifts Across Colitis Stages
[Analysis Visualization Results]...
Analysis Overview
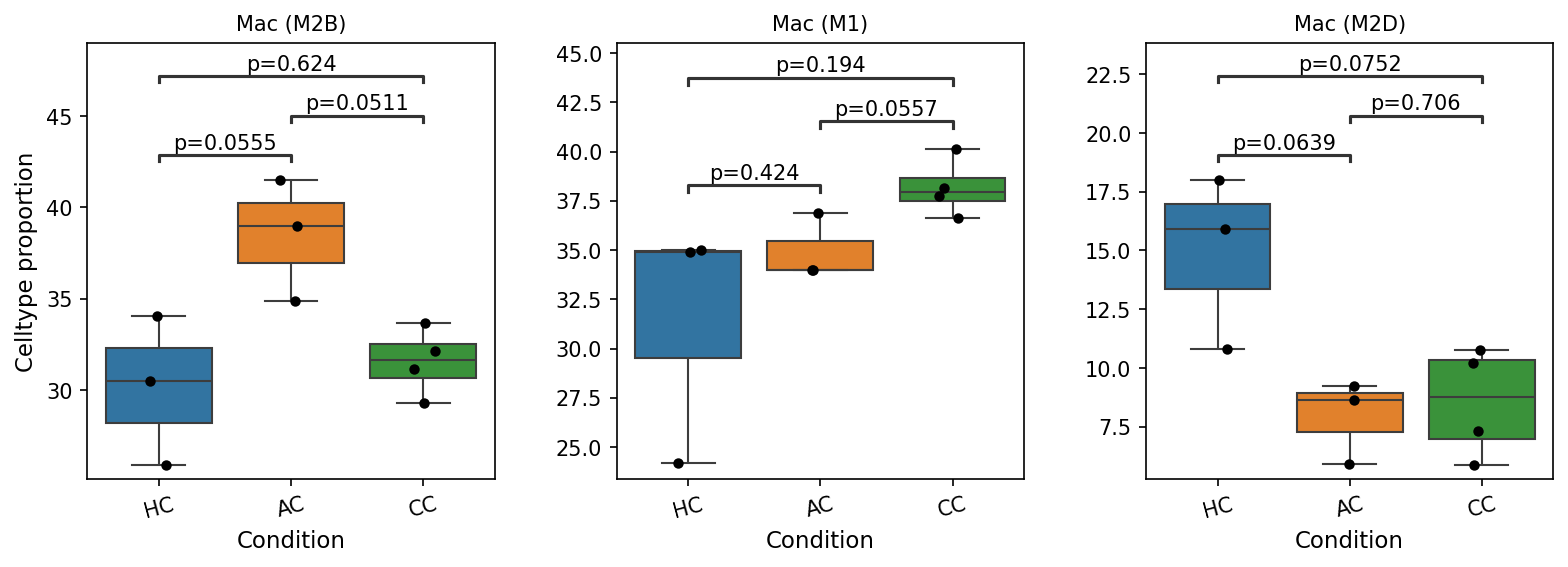
This analysis investigates the proportions of specific macrophage subsets (Mac M2B, Mac M1, and Mac M2D) across three conditions: Healthy Control (HC), Acute Colitis (AC), and Chronic Colitis (CC). Box plots display the distribution of cell type proportions for each subset, and pairwise statistical comparisons highlight significant differences between conditions (p-value < 0.1). This provides insight into how macrophage polarization changes during the progression of colon inflammation.
Visual Summary
The box plots illustrate distinct patterns in the proportions of three macrophage subsets:
- Mac (M2B): The proportion of Mac (M2B) cells is significantly higher in Acute Colitis (AC) compared to Healthy Control (HC) (p=0.0555). Subsequently, its proportion significantly decreases from Acute Colitis (AC) to Chronic Colitis (CC) (p=0.0511). There is no significant difference between HC and CC for this subset.
- Mac (M1): Mac (M1) cells show a significantly increased proportion in Chronic Colitis (CC) when compared to Acute Colitis (AC) (p=0.0557). No statistically significant differences were observed between HC and AC, or between HC and CC, for this subset.
- Mac (M2D): The proportion of Mac (M2D) cells is significantly lower in both Acute Colitis (AC) (p=0.0639) and Chronic Colitis (CC) (p=0.0752) when compared to Healthy Control (HC). There is no significant difference between the AC and CC conditions for Mac (M2D).
Biological Interpretation
Macrophages are critical immune cells in the colon, playing diverse roles in homeostasis and inflammation. Their functional plasticity leads to different polarization states, broadly categorized into pro-inflammatory (M1-like) and anti-inflammatory/resolving (M2-like) phenotypes, with various M2 subtypes. The observed shifts in macrophage subset proportions across conditions strongly suggest dynamic changes in immune responses during colitis:
- Mac (M2B) dynamics: The initial increase of Mac (M2B) in Acute Colitis (AC) might indicate an early, perhaps transient, regulatory or B cell-helper response to acute inflammation. M2B macrophages are known for producing high levels of IL-10 and are often associated with immune regulation and resolution. However, its subsequent decrease as inflammation progresses to Chronic Colitis (CC) suggests that this specific regulatory mechanism may become less dominant or is overwhelmed in the chronic phase.
- Mac (M1) enrichment in chronic colitis: The significant increase of Mac (M1) in Chronic Colitis (CC) compared to Acute Colitis (AC) is a key finding. M1 macrophages are typically characterized by their pro-inflammatory functions, including the production of pro-inflammatory cytokines (e.g., TNF-α, IL-1β, IL-6) and reactive oxygen/nitrogen species, contributing to tissue damage and sustained inflammation. This suggests a shift towards a more persistent pro-inflammatory macrophage phenotype as colitis becomes chronic, which is consistent with the pathophysiology of chronic inflammatory bowel diseases.
- Mac (M2D) reduction in colitis: The consistent reduction of Mac (M2D) in both acute and chronic colitis compared to healthy controls points to a potential deficiency in specific regulatory or pro-resolving functions. M2D macrophages have been implicated in angiogenesis and immune suppression, and their diminished presence might impair tissue repair mechanisms or contribute to dysregulated immune responses in the inflamed colon.
Collectively, these findings reveal a complex macrophage repolarization landscape during colitis. The transition from acute to chronic inflammation appears to be marked by a shift away from certain M2-like regulatory subtypes (M2B, M2D) and towards a more pronounced pro-inflammatory M1 phenotype, contributing to the persistent inflammatory state characteristic of chronic colitis.
Clinical or Translational Implications
Understanding the specific changes in macrophage subset proportions between acute and chronic colitis can have several implications:
- Disease Biomarkers: The distinct patterns of M1, M2B, and M2D macrophage proportions could serve as potential biomarkers for distinguishing between different stages of colitis (acute vs. chronic) or for monitoring disease progression and severity.
- Therapeutic Targets: The shift towards an M1-dominant phenotype in chronic colitis suggests that therapeutic strategies aimed at modulating macrophage polarization, for example, by re-educating M1 cells towards an M2-like phenotype or by enhancing the function of specific M2 subtypes, could be beneficial in managing chronic inflammatory bowel diseases.
- Prognostic Indicators: A lack of specific M2 regulatory subsets (like M2D) or an uncontrolled M1 expansion might indicate a poorer prognosis or a reduced capacity for disease resolution. Further studies could explore if these proportional changes correlate with patient outcomes or responsiveness to therapy.
9. Cell-Cell Interaction Patterns Across Colitis Conditions
[Analysis Visualization Results]...
Analysis Overview
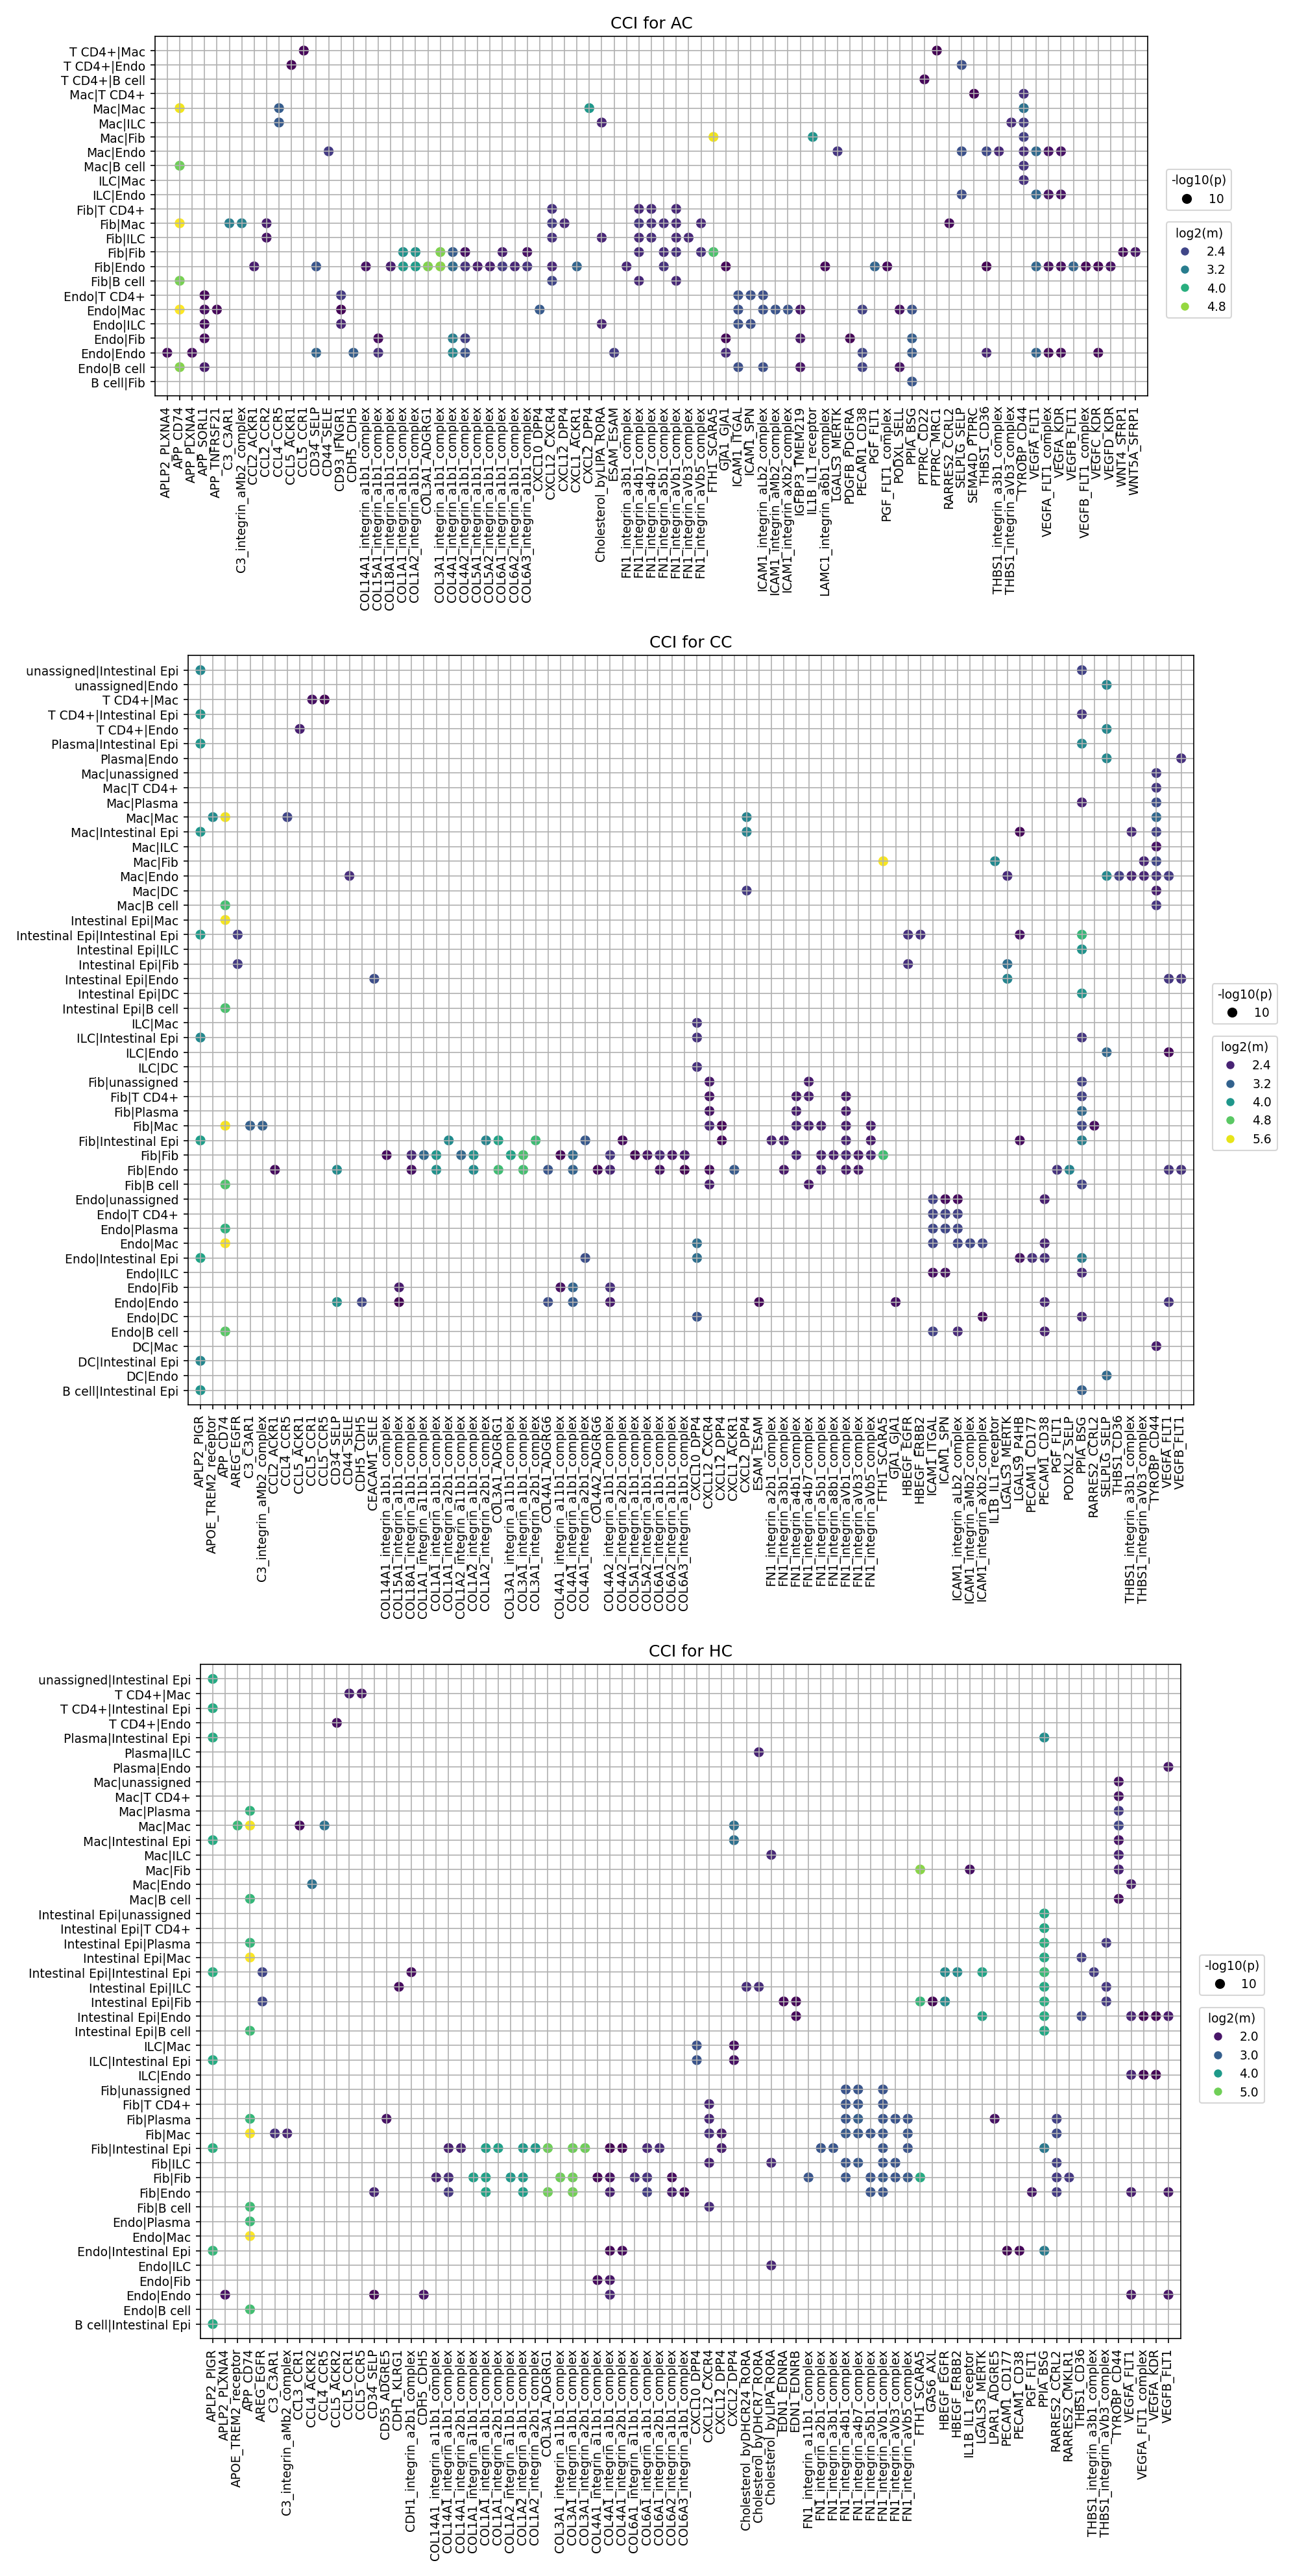
This analysis utilizes CellPhoneDB results to visualize significant cell-cell interaction (CCI) patterns across three conditions: Acute Colitis (AC), Chronic Colitis (CC), and Healthy Control (HC). For each condition, the dot plots display the top 80 cell-cell interactions, prioritizing those with higher statistical significance (larger dot size, representing -log10(p-value)) and stronger mean expression levels of the interacting ligand-receptor pairs (color intensity, representing log2(mean)). The Y-axis indicates the interacting cell type pairs (sender|receiver), and the X-axis lists the specific ligand-receptor complexes. This allows for a comparative assessment of CCI dynamics in different stages of colitis versus a healthy state in mouse colon tissue.
Visual Summary
The visualizations reveal distinct and common cell-cell interaction patterns across the three conditions, with a clear enrichment of specific inflammatory and tissue remodeling pathways in the colitis states (AC and CC) compared to the healthy control (HC).
- General Patterns: Across all conditions, interactions involving integrin complexes (e.g., COL1A1_integrin_a1b1_complex, FN1_integrin_a5b1_complex, ICAM1_integrin_aMb2_complex) and VEGF family members (VEGFA_FLT1, VEGFA_KDR) are frequently observed, particularly among Fibroblasts and Endothelial cells. This highlights their fundamental roles in cell adhesion, extracellular matrix (ECM) remodeling, and angiogenesis, which are essential for tissue homeostasis and repair.
Colitis-Specific Enrichment (AC and CC vs. HC):
- Increased Inflammatory Signaling: Both AC and CC show a higher density and intensity (brighter colors, larger dot sizes) of interactions associated with inflammation. Prominent among these are interactions involving SPP1 (Osteopontin) with its receptors (e.g., SPP1_CD44 and various integrin complexes) and chemokine signaling such as CXCL12_CXCR4. These interactions are notably strong in Macrophage|Macrophage, Macrophage|Fibroblast, and Macrophage|T cell CD4+ pairs in AC and CC.
- Immune Cell Activation and Recruitment: Macrophage and T cell CD4+ interactions become more pronounced in AC and CC. For instance, T cell CD4+|Macrophage and Macrophage|Macrophage interactions are significantly active for inflammatory mediators. In CC, interactions involving Intestinal Epithelial cells with various immune cells (Macrophage, ILC, Dendritic cell, Plasma cell) appear more diverse and intense, suggesting a chronic interplay between the epithelial barrier and the immune system.
- Tissue Remodeling and Fibrosis Markers: Fibroblast|Fibroblast and Fibroblast|Macrophage interactions are consistently strong for integrin complexes and SPP1_CD44 in AC and CC, indicative of active ECM deposition and remodeling processes that can lead to fibrosis in chronic inflammation.
- Healthy Control (HC) Profile: The HC condition displays a sparser pattern with generally lower mean expression levels (darker blue/purple dots) for many interactions compared to AC and CC. While basal integrin-mediated Fibroblast|Fibroblast and Endothelial cell interactions persist, the inflammatory-associated ligand-receptor pairs like SPP1-CD44/integrins and CXCL12-CXCR4 exhibit reduced activity, reflecting a quiescent tissue state.
Biological Interpretation
The observed cell-cell interaction patterns provide significant insights into the pathological mechanisms underlying Colitis.
- Inflammatory Milieu and Immune Cell Dynamics: The robust activity of SPP1 and CXCL12 interactions in AC and CC points to an active inflammatory response. SPP1 is a key cytokine promoting immune cell recruitment, survival, and production of pro-inflammatory cytokines, while CXCL12-CXCR4 is critical for leukocyte trafficking and retention at inflammatory sites. The prominent role of Macrophages and T cells as interacting partners underscores their central role in mediating and perpetuating intestinal inflammation. GeneCards SPP1 | GeneCards CXCL12
- Tissue Remodeling and Fibrosis: The strong and prevalent integrin-mediated interactions, particularly involving Fibroblasts and Macrophages, highlight significant extracellular matrix (ECM) remodeling processes in colitis. Chronic inflammation often leads to fibrosis, characterized by excessive ECM deposition and structural changes. Ligand-receptor pairs such as COL1A1_integrin_a1b1_complex (collagen-integrin) and FN1_integrin_a5b1_complex (fibronectin-integrin) directly mediate cell-ECM adhesion and signaling, which are critical for fibroblast activation and collagen synthesis. SPP1 also contributes to fibrosis by modulating fibroblast activity.
- Angiogenesis and Vascular Changes: VEGFA_FLT1 and VEGFA_KDR interactions (VEGF-receptor signaling) are consistent across conditions but potentially more pronounced in inflammatory states, suggesting ongoing angiogenesis and vascular permeability changes necessary for supporting the heightened metabolic demands of inflamed tissue and facilitating immune cell extravasation. GeneCards VEGFA
- Epithelial-Immune Crosstalk in Chronic Colitis: The increased and diversified interactions involving Intestinal Epithelial cells in CC compared to AC or HC, especially with immune cells (Macrophage, ILC, Dendritic cell, Plasma cell), indicate a chronic state of epithelial dysfunction, repair attempts, and sustained immune surveillance or attack at the epithelial barrier. This could involve interactions mediating immune cell infiltration across the epithelium or signals related to epithelial wound healing and regeneration.
Clinical or Translational Implications
The differential cell-cell interaction patterns identified offer several promising avenues for therapeutic intervention and biomarker discovery in Colitis.
Targeting Inflammatory Axes:
- SPP1-CD44/Integrin Signaling: The robust activation of SPP1 interactions in both acute and chronic colitis suggests SPP1 as a potential therapeutic target. Blocking SPP1 or its receptors (CD44, integrins) could mitigate immune cell activation, recruitment, and fibrotic processes. PubMed on SPP1 in IBD
- CXCL12-CXCR4 Axis: Given its critical role in immune cell trafficking, inhibiting CXCL12-CXCR4 interactions could reduce immune cell infiltration into the inflamed colon, thereby dampening inflammation.
- ICAM1-Integrin Interactions: Blocking ICAM1 or its integrin partners, which are essential for leukocyte adhesion and trans-endothelial migration, could be a strategy to prevent immune cell entry into inflammatory sites. UniProt ICAM1
- Modulating Fibrotic Pathways: The prominent role of Fibroblast-mediated integrin interactions suggests that targeting specific integrin complexes or pathways that drive fibroblast activation and ECM deposition could be effective in preventing or reversing fibrosis, a major complication of chronic colitis.
- Biomarker Potential: The elevated activity of certain CCI pairs (e.g., SPP1-CD44, specific integrin complexes involving macrophages or fibroblasts) in AC and CC could serve as novel diagnostic or prognostic biomarkers for disease activity or progression, potentially detectable in tissue biopsies or even through soluble forms in circulation.
Experimental Validation:
- In vitro Co-culture Models: Specific cell-cell pairs with high interaction strength in colitis (e.g., Macrophage-Fibroblast, Intestinal Epithelial cell-Immune cell) could be recapitulated in co-culture systems to validate the functional consequences of these interactions and test the efficacy of blocking agents.
- In vivo Intervention Studies: The identified ligand-receptor pairs could be targeted using neutralizing antibodies or small molecule inhibitors in mouse models of colitis (like those likely represented by AC/CC conditions) to assess their therapeutic potential in reducing inflammation, preserving barrier function, or preventing fibrosis.
10. Condition-Specific Cell-Cell Interaction Patterns in Colon Inflammation
[Analysis Visualization Results]...
Analysis Overview
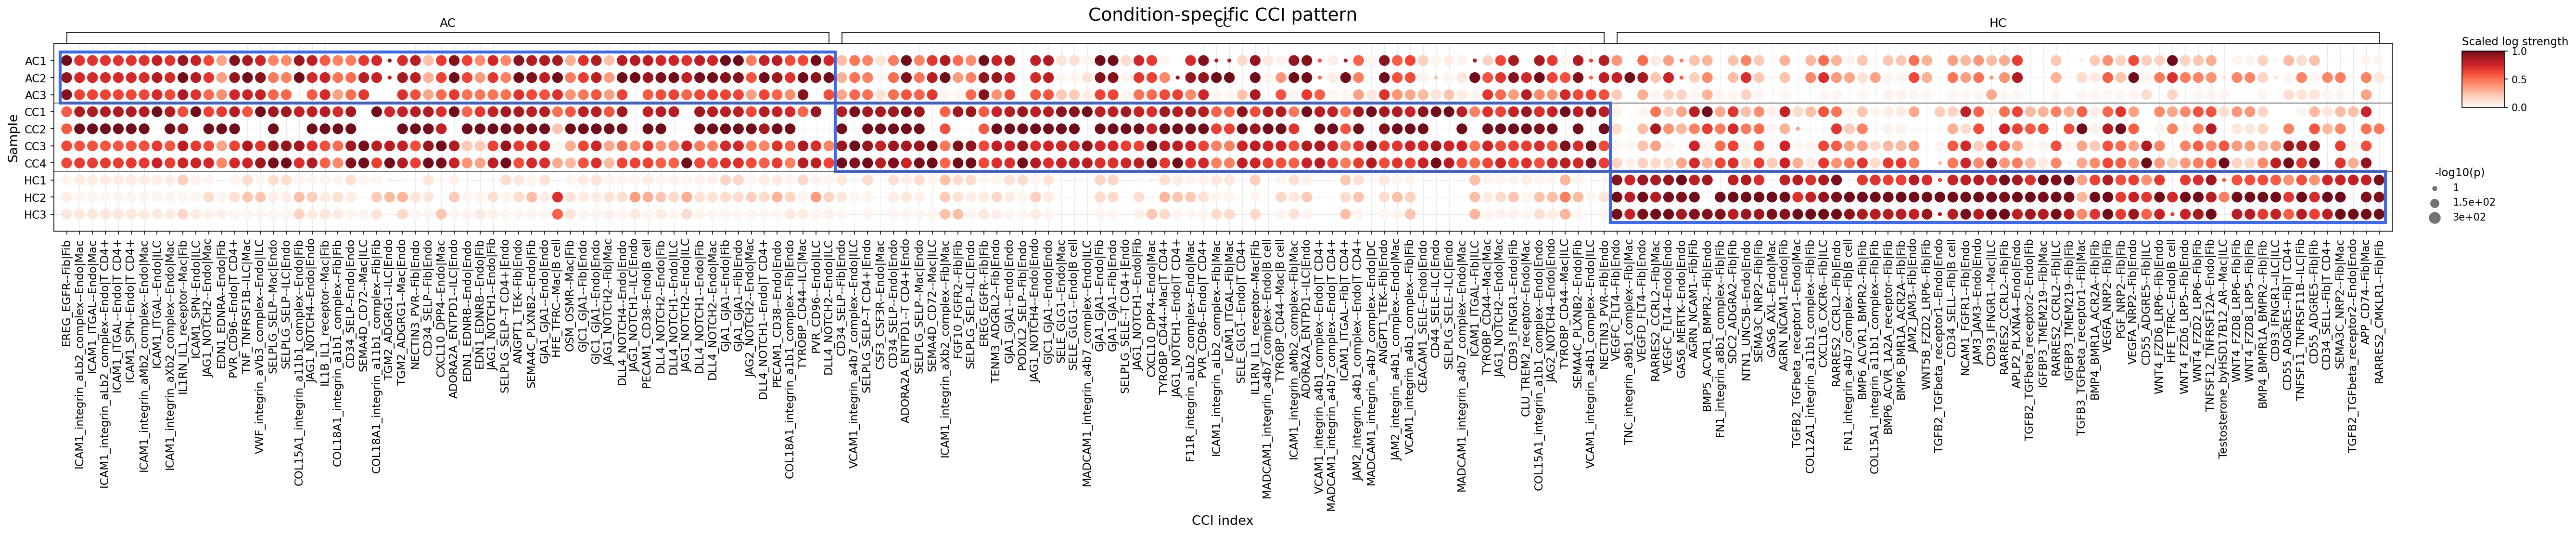
This analysis investigates condition-specific cell-cell interactions (CCI) within the colon tissue, focusing on major immune and stromal cell types (Myeloid cell, T cell, B cell, Stromal cell, Endothelial cell). The goal is to identify interactions that differ significantly between conditions: Acute Colitis (AC), Chronic Colitis (CC), and Healthy Control (HC), using a dot plot visualization. The analysis highlights the most significant interactions (up to 60 per group, selected by minimum p-value) and provides insights into their biological mechanisms and potential therapeutic relevance in the context of Inflammatory Bowel Disease (IBD)/Colitis.
Visual Summary
The dot plot visualizes the strength (scaled log strength, represented by color intensity) and significance (-log10(p-value), represented by dot size) of various ligand-receptor interactions between specified cell types across different samples and conditions.
- Clear Condition-Specific Patterns: There is a distinct pattern differentiating the healthy control (HC) samples from the inflamed conditions (AC and CC).
- Inflammatory Conditions (AC & CC): Samples from Acute Colitis (AC1-AC3) and Chronic Colitis (CC1-CC4) generally exhibit a high number of strong and significant cell-cell interactions, particularly in the large block highlighted by blue boxes on the left side of the plot. These interactions appear extensively activated across both inflammatory conditions.
- Healthy Control (HC): In contrast, the Healthy Control (HC1-HC3) samples show markedly fewer and weaker interactions across most of the ligand-receptor pairs prominent in AC and CC. However, HC samples display a distinct set of active interactions, notably on the far right block highlighted by a blue box.
- Dominant Interaction Types in Colitis: The majority of highly active interactions in AC and CC involve adhesion molecules (e.g., ICAM1, VCAM1, MAdCAM1, FN1 binding to various integrins), Notch signaling (JAG1, DLL4), and cytokine/chemokine-related interactions. These often mediate communication between endothelial cells and immune cells (T cells, Macrophages, ILCs) or between endothelial cells themselves, pointing towards extensive immune cell trafficking and vascular remodeling.
- Distinguishing AC from CC: While AC and CC share many activated interactions, suggesting common inflammatory pathways, subtle differences in the intensity or presence of specific interactions may exist. However, a broad, pan-inflammatory signature is apparent in both.
- Homeostatic Interactions in Healthy Tissue: The interactions prominent in HC samples (e.g., specific TGF-beta and BMP signaling pathways between stromal cells and endothelial cells) likely represent pathways involved in maintaining tissue homeostasis, repair, and baseline immune regulation in a non-inflamed state.
Biological Interpretation
The observed cell-cell interaction patterns provide critical insights into the pathophysiology of colitis. The prominence of certain pathways in inflammatory conditions versus healthy controls underscores their roles in disease development and progression. Below are interpretations of key illustrative interactions:
- MAdCAM1-integrin_a4b7_complex (Endo|T cell) in AC/CC:
- Signaling Pathway/Mechanism: Mucosal vascular addressin cell adhesion molecule 1 (MAdCAM1) is constitutively expressed on venules in the gut lamina propria and is upregulated on endothelial cells (Endo) during inflammation. It acts as a critical ligand for the α4β7 integrin receptor expressed on circulating T cells. This interaction facilitates the specific homing and extravasation of T lymphocytes into the inflamed intestinal tissue.
- Relevance in Colitis: The increased strength and significance of MAdCAM1-α4β7 interactions in AC and CC samples highlight its central role in driving pathogenic T cell infiltration into the gut mucosa, a hallmark of Inflammatory Bowel Disease (IBD) pathogenesis.
- Therapeutic Target: This axis is a validated therapeutic target in IBD. Vedolizumab (Entyvio), a monoclonal antibody that specifically targets the α4β7 integrin, blocks its interaction with MAdCAM1, thereby preventing gut-specific lymphocyte trafficking and reducing inflammation without causing systemic immunosuppression. UniProt: MAdCAM-1
- ICAM1-integrin_aLb2_complex (Endo|T cell) in AC/CC:
- Signaling Pathway/Mechanism: Intercellular Adhesion Molecule 1 (ICAM1) is expressed on endothelial cells and binds to integrin αLβ2 (LFA-1), which is found on T cells. This interaction mediates firm adhesion of T cells to the endothelium and is essential for their transmigration across the vessel wall into inflamed tissues. ICAM1 expression is highly inducible by pro-inflammatory cytokines like TNF-α and IFN-γ.
- Relevance in Colitis: The strong signal for this interaction in AC and CC indicates robust immune cell recruitment, including T cells, into the inflamed colon. This adhesion and subsequent transmigration are crucial steps in perpetuating the inflammatory cascade in IBD.
- Therapeutic Target: While integrins are prime targets, the broad expression of ICAM1 and LFA-1 makes systemic blockade challenging due to potential side effects. However, understanding this interaction highlights the general principle of targeting adhesion molecules to curb immune cell infiltration in inflammatory conditions. PubMed search: ICAM1 integrin T cell inflammation
- DLL4-NOTCH1 (Endo|Endo) in AC/CC:
- Signaling Pathway/Mechanism: Delta-like ligand 4 (DLL4) expressed on one endothelial cell interacts with NOTCH1 receptor on an adjacent endothelial cell. This juxtacrine signaling pathway is a critical regulator of angiogenesis (new blood vessel formation) by controlling endothelial cell tip-stalk cell fate, sprouting, and vessel maturation.
- Relevance in Colitis: Chronic inflammation, as seen in IBD, is often associated with pathological angiogenesis to support the metabolic demands of inflamed tissue and facilitate continuous immune cell entry. Dysregulation of DLL4-NOTCH signaling can contribute to aberrant vascular remodeling and increased vascular permeability in the inflamed colon.
- Therapeutic Target: Modulating DLL4-NOTCH signaling is an area of active research, particularly in oncology and inflammatory diseases. Inhibitors of Notch signaling (e.g., gamma-secretase inhibitors) are being investigated, though their application requires careful consideration due to the pleiotropic roles of Notch in various tissues. PubMed search: DLL4 NOTCH angiogenesis inflammation
- TGFB2-TGFbeta_receptor1 (Endo|Fib) and TGFB3-TGFbeta_receptor1 (Fib|Fib) in HC (and potentially dysregulated in AC/CC):
- Signaling Pathway/Mechanism: Transforming Growth Factor beta (TGF-β) ligands (TGFB2, TGFB3) bind to TGF-β receptor 1 (TGFBR1) on target cells, activating a cascade that regulates cell proliferation, differentiation, apoptosis, and extracellular matrix (ECM) production. In healthy tissue, TGF-β signaling between endothelial cells and fibroblasts, or fibroblasts with themselves, plays a crucial role in maintaining tissue homeostasis, promoting wound healing, and modulating immune responses.
- Relevance in Colitis: The relative prominence of these interactions in healthy controls suggests their role in maintaining tissue integrity and regulating normal physiological processes. While TGF-β can be anti-inflammatory in some contexts, its sustained activation, particularly in chronic inflammation, can drive excessive ECM deposition, leading to fibrosis and stricture formation, a common complication in chronic IBD. Thus, its role shifts from homeostatic in healthy tissue to potentially pathological in chronic disease.
- Therapeutic Target: Targeting TGF-β signaling in fibrotic diseases is an area of intense research. Inhibitors of TGFBR1 have been developed to mitigate fibrosis, which could be relevant for preventing or treating intestinal fibrosis in IBD. However, the multifaceted nature of TGF-β signaling requires careful design to avoid compromising its beneficial roles in immune regulation and tissue repair. GeneCards: TGFB2
Clinical or Translational Implications
The identification of condition-specific cell-cell interactions offers several potential clinical and translational implications for Inflammatory Bowel Disease (Colitis):
- Biomarker Discovery: The specific patterns of activated CCIs in AC and CC conditions, especially those largely absent in HC, could serve as novel biomarkers for diagnosing inflammatory states, monitoring disease activity, or predicting response to therapy.
- Therapeutic Target Validation: The strong signal for interactions like MAdCAM1-α4β7 integrin, a clinically validated target (Vedolizumab), reinforces the utility of this approach for identifying key pathogenic pathways. Other identified inflammatory CCIs, such as those involving ICAM1-integrin or DLL4-NOTCH, represent potential new therapeutic avenues that could be explored to interrupt immune cell trafficking or pathological angiogenesis.
- Understanding Disease Heterogeneity: The ability to resolve CCI patterns at the sample level within AC and CC categories can help dissect the heterogeneity of inflammatory responses and potentially stratify patients for more personalized treatment strategies.
- Anti-Fibrotic Strategies: The shift in TGF-β related interactions from a homeostatic role in healthy tissue to potential dysregulation in chronic inflammation suggests that specific modulation of this pathway could be a strategy to prevent or treat fibrosis, a major complication in chronic IBD.
11. Intestinal Epithelial Cell Condition-Specific Surfaceome Markers in Colon Inflammation

[Analysis Visualization Results]...
Analysis Overview
This analysis identifies condition-specific surfaceome markers within Intestinal Epithelial cells from colon tissue across three conditions: Acute Colitis (AC), Chronic Colitis (CC), and Healthy Control (HC). The dot plot visualizes the mean expression level (color intensity) and the fraction of cells expressing each marker (dot size) for each sample within these conditions. This allows for the identification of surface proteins that are uniquely or differentially expressed in healthy versus inflammatory states, offering insights into epithelial cell function and potential disease mechanisms in Inflammatory Bowel Disease (IBD)/Colitis.
Visual Summary
The dot plot, titled "Intestinal Epithelial cell condition-specific markers," effectively highlights distinct expression patterns of surfaceome genes across the different conditions and individual samples.
- Condition-Specific Expression Patterns: A clear segregation of marker expression is observed across conditions.
- Healthy Control (HC): Samples HC1, HC3, and HC2 exhibit high expression (dark red, large dots) of a cluster of markers positioned primarily on the right side of the plot. These markers appear to be significantly downregulated or absent in the AC and CC samples.
- Chronic Colitis (CC): Samples CC3, CC1, CC4, and CC2 show robust expression of a distinct set of markers located in the middle-left section of the plot. These markers are highly expressed in a large fraction of cells within CC samples and are generally lowly expressed or absent in HC samples.
- Acute Colitis (AC): Samples AC2, AC1, and AC3 also show expression for many of the markers upregulated in CC, but generally with a lower mean expression (lighter red) and/or a smaller fraction of expressing cells (smaller dots) compared to CC. A few markers might be more prominent in AC relative to HC but less so than in CC, suggesting a graded response or a distinct, albeit milder, inflammatory profile compared to chronic disease.
Key Trends:
- The plot reveals distinct sets of surface markers associated with disease (AC/CC) versus healthy (HC) states, underscoring significant changes in the epithelial surfaceome during colon inflammation.
- The high prevalence of many markers (large dot size) in their respective dominant conditions suggests a widespread transcriptional shift across a substantial population of Intestinal Epithelial cells.
- The general pattern suggests a transition from a healthy epithelial signature (HC markers) to an inflammatory/disease-associated signature (AC/CC markers).
Biological Interpretation
The differential expression of these surfaceome markers in Intestinal Epithelial cells (IECs) provides critical insights into their roles in colon homeostasis and inflammation, characteristic of Inflammatory Bowel Disease (IBD).
Markers Upregulated in Colitis (AC/CC)
These markers are indicative of epithelial responses during acute and chronic inflammation, suggesting roles in immune interaction, barrier dysfunction, tissue remodeling, and aberrant regeneration.
Mucin Family Members (e.g., *Muc4*, *Muc3a*):
- Signaling & Mechanism: Mucins are major components of the protective mucus layer. While some mucins (e.g., Muc2) are critical for barrier function, others like Muc4 and Muc3a can be upregulated in inflammation and cancer. Muc4 plays roles in cell signaling, anti-adhesion, and protection from microbial invasion, and its dysregulation can impact gut barrier integrity and host-microbe interactions PubMed Search: Muc4 colon inflammation. Muc3a is also a transmembrane mucin that can be involved in epithelial cell protection and signaling. Their altered expression in colitis may reflect adaptive changes to protect the epithelium from inflammatory damage or could contribute to altered barrier function and immune recognition.
- Therapeutic Potential: Modulating mucin production or glycosylation patterns could impact barrier function and immune cell accessibility. Targeting specific mucins might help restore barrier integrity or reduce inflammation.
Chemokine and Adhesion Molecules (e.g., *Cxcl16*, *Cd44*, *Itgav*, *Cldn15*):
Signaling & Mechanism:
- CXCL16: A chemokine and adhesion molecule. As a chemokine, it recruits immune cells (e.g., NKT cells, macrophages) expressing CXCR6 to the inflamed site. As an adhesion molecule, it mediates cell-cell interactions GeneCards: CXCL16. Upregulation in IECs suggests active immune cell recruitment into the colon lamina propria, exacerbating inflammation.
- CD44: A cell surface glycoprotein involved in cell adhesion, migration, and signaling, acting as a receptor for hyaluronan and other ligands. It plays roles in immune cell activation, inflammation, and tissue repair GeneCards: CD44. Its upregulation in IECs in colitis implies increased cell motility, interaction with the extracellular matrix, and potentially altered inflammatory signaling pathways.
- ITGAV (Integrin alpha V): Integrins are transmembrane receptors that mediate cell-extracellular matrix (ECM) and cell-cell interactions. ITGAV is a subunit of several integrins that bind to ligands containing the RGD motif. It is critical for cell adhesion, migration, and signaling pathways involved in proliferation, survival, and differentiation UniProt: ITGAV. Its upregulation could indicate increased epithelial plasticity, migration for repair, or altered interaction with the inflamed stromal environment.
- CLDN15 (Claudin-15): A tight junction protein. Claudins regulate paracellular permeability. While Cldn15's specific role in IBD is less studied than Cldn2, dysregulation of tight junction components is a hallmark of barrier dysfunction in IBD PubMed Search: claudin IBD barrier. Upregulation might reflect specific adaptive or maladaptive changes in tight junction composition impacting epithelial permeability.
- Therapeutic Potential: Targeting CXCL16-CXCR6 axis could reduce immune cell infiltration. Blocking CD44 or specific integrins (e.g., with biologics like vedolizumab, which targets α4β7 integrin, though ITGAV is different) could modulate inflammation and cell migration. Restoring tight junction integrity by targeting claudin expression or function is a major area of research in IBD.
Growth Factor Receptors (e.g., *Egfr*, *Met*):
Signaling & Mechanism:
- EGFR (Epidermal Growth Factor Receptor): A receptor tyrosine kinase essential for cell proliferation, differentiation, and survival. EGFR signaling is critical for intestinal epithelial regeneration and wound healing, but aberrant activation can drive chronic inflammation and carcinogenesis GeneCards: EGFR.
- MET (Hepatocyte Growth Factor Receptor): Another receptor tyrosine kinase, activated by Hepatocyte Growth Factor (HGF), involved in cell proliferation, survival, migration, and angiogenesis. MET signaling is crucial for tissue repair processes, but also implicated in inflammatory pathologies GeneCards: MET.
- Upregulation of these receptors in colitis suggests heightened proliferative and repair activity in response to tissue damage, but sustained activation can perpetuate inflammation or contribute to dysplastic changes.
- Therapeutic Potential: While essential for repair, chronic or dysregulated activation of EGFR or MET can be detrimental. Modulating their activity, perhaps with specific inhibitors or agonists, might offer a therapeutic window, although care must be taken to avoid impairing essential epithelial regeneration.
Cytokine Receptors and Modulators (e.g., *Il10rb*, *Tnfrsf1a*, *Sigirr*):
Signaling & Mechanism:
- IL10RB (Interleukin-10 Receptor Subunit Beta): A subunit of the receptor for anti-inflammatory cytokine IL-10. Upregulation could indicate an attempt by IECs to respond to IL-10 signaling to dampen inflammation GeneCards: IL10RB. However, in an inflammatory milieu, the efficacy of this anti-inflammatory axis might be compromised.
- TNFRSF1A (Tumor Necrosis Factor Receptor Superfamily Member 1A / TNFR1): The primary receptor for pro-inflammatory cytokine TNF-alpha. Its upregulation makes IECs more sensitive to TNF-alpha, leading to activation of pro-inflammatory and apoptotic pathways, contributing to gut inflammation and damage UniProt: TNFRSF1A.
- SIGIRR (Single Ig And TIR Domain Containing / TIR8): An inhibitory receptor that negatively regulates Toll-like receptor (TLR) and IL-1 receptor (IL-1R) signaling. Upregulation might represent an endogenous feedback mechanism to limit excessive inflammation in IECs by dampening innate immune responses PubMed Search: SIGIRR IBD.
- Therapeutic Potential: Anti-TNF-alpha therapies (e.g., infliximab, adalimumab) directly target TNFRSF1A's ligand and are standard treatments for IBD. Strategies to enhance IL-10 signaling or upregulate SIGIRR could represent novel anti-inflammatory approaches.
Matrix Metalloproteinases and ADAMs (e.g., *Mmp14*, *Adam9*):
Signaling & Mechanism:
- MMP14 (Matrix Metalloproteinase 14 / MT1-MMP): A membrane-bound MMP involved in extracellular matrix (ECM) degradation, activation of other MMPs, and shedding of cell surface proteins. It plays a role in tissue remodeling, cell migration, and inflammation GeneCards: MMP14.
- ADAM9 (A Disintegrin And Metalloproteinase 9): Members of the ADAM family are involved in shedding of cell surface proteins, cell adhesion, and ECM proteolysis. ADAM9 can cleave various substrates, influencing cell signaling and inflammation GeneCards: ADAM9.
- Upregulation of MMPs and ADAMs in colitis indicates active tissue degradation and remodeling, which are central to chronic inflammation and ulceration in IBD.
- Therapeutic Potential: Inhibitors of specific MMPs or ADAMs have been explored as anti-inflammatory or anti-cancer agents, although broad MMP inhibition can have significant side effects. Targeting specific members involved in pathological tissue destruction in IBD might be beneficial.
Markers Upregulated in Healthy Control (HC)
These markers likely represent functions crucial for maintaining intestinal homeostasis, nutrient absorption, barrier integrity, and controlled cell turnover in a healthy state. Their downregulation in colitis suggests a loss of normal epithelial function.
- Solute Carrier Family Members (e.g., *Slc1a5*, *Slc5a8*, *Slc16a1*, *Slc1a1*, *Slc39a5*, *Slc4a4*):
- Signaling & Mechanism: This diverse group of transporters facilitates the uptake and efflux of various essential nutrients, metabolites, and ions across the epithelial cell membrane.
- SLC1A5 (ASCT2): Transports neutral amino acids, crucial for epithelial cell metabolism and growth UniProt: SLC1A5.
- SLC5A8 (SMCT1): A sodium-coupled monocarboxylate transporter that transports short-chain fatty acids (SCFAs) like butyrate, which are vital energy sources for colonocytes and possess anti-inflammatory properties PubMed Search: SLC5A8 butyrate colon.
- SLC16A1 (MCT1): Another monocarboxylate transporter, also involved in SCFA uptake.
- SLC1A1 (EAAT3): An excitatory amino acid transporter, involved in glutamate uptake.
- SLC39A5 (ZIP5): A zinc transporter, zinc is essential for epithelial barrier function, immune responses, and enzyme activity PubMed Search: zinc transporter colon barrier.
- SLC4A4 (NBCe1): A sodium bicarbonate cotransporter, important for pH regulation and electrolyte balance.
- Their robust expression in HC indicates active nutrient absorption and metabolic support for a healthy, functional epithelium. Downregulation in colitis suggests impaired metabolic function and nutrient handling, contributing to epithelial dysfunction.
- Therapeutic Potential: Supporting the function of these transporters (e.g., through dietary interventions with SCFAs) could bolster epithelial health and reduce inflammation. For instance, butyrate supplementation is explored for IBD.
Receptor-type Tyrosine-Protein Phosphatase Kappa (*Ptprk*):
- Signaling & Mechanism: PTPRK is a cell adhesion molecule and a phosphatase that dephosphorylates specific tyrosine residues on target proteins. It is known to regulate cell-cell adhesion, epithelial differentiation, and is often considered a tumor suppressor. In healthy epithelium, it likely contributes to maintaining organized cell structure and differentiation GeneCards: PTPRK. Its loss in colitis may contribute to altered cell adhesion and epithelial dysregulation.
- Therapeutic Potential: Strategies to restore or enhance PTPRK function could potentially improve epithelial integrity and differentiation, which are compromised in IBD.
Leucine-rich Repeats and Immunoglobulin-like Domains (*Lrig1*, *Lrig3*):
- Signaling & Mechanism: LRIG1 and LRIG3 are transmembrane proteins that act as negative regulators of the ERBB family of receptor tyrosine kinases (including EGFR and ERBB3). LRIG1 is a crucial marker of intestinal stem cells and plays a vital role in maintaining stem cell homeostasis and epithelial regeneration PubMed Search: LRIG1 intestinal stem cell. Its expression is essential for balanced epithelial turnover. Their high expression in HC suggests a tightly regulated growth factor signaling environment that ensures proper epithelial regeneration and prevents uncontrolled proliferation. Downregulation in colitis might contribute to dysregulated EGFR signaling and aberrant regeneration.
- Therapeutic Potential: Restoring LRIG1/LRIG3 expression or activity could help re-establish proper epithelial stem cell niche function and control excessive growth factor signaling, promoting controlled tissue repair over aberrant inflammation-driven proliferation.
Dipeptidyl Peptidase 4 (*Dpp4* / *CD26*):
- Signaling & Mechanism: DPP4 is a widely expressed enzyme with diverse roles, including glucose metabolism (inactivating incretins), immune regulation (T cell co-stimulation, chemokine processing), and epithelial cell growth and differentiation. It also has roles in ECM degradation and processing of various bioactive peptides UniProt: DPP4. Its high expression in healthy IECs suggests its importance in normal epithelial physiology, potentially in modulating local immune responses or maintaining metabolic homeostasis.
- Therapeutic Potential: DPP4 inhibitors are used in diabetes. In IBD, its role is complex; some studies suggest its inhibition could be beneficial, while others point to a protective role. Further research is needed to define its precise role in IBD for targeted therapy.
Claudin-2 (*Cldn2*):
- Signaling & Mechanism: Claudin-2 is a tight junction protein that forms a paracellular aqueous channel, contributing to the "leakiness" of the epithelial barrier. While often associated with increased permeability and inflammation in IBD (where it is typically *upregulated* in diseased areas), its strong expression in HC samples in this dataset is noteworthy. In some healthy contexts, specific expression of Cldn2 might facilitate regulated paracellular transport in specific segments of the colon or in particular epithelial cell subsets. However, its prominent role in increased permeability in pathological conditions is well-established PubMed Search: claudin-2 leaky gut IBD. Its presence in HC may reflect a baseline physiological permeability that becomes dysregulated in disease.
- Therapeutic Potential: In IBD, efforts often focus on reducing Cldn2 to tighten the epithelial barrier. If its upregulation in disease is pathological, then therapies aimed at inhibiting Cldn2 or its pore-forming function could be beneficial.
Clinical or Translational Implications
The identification of condition-specific surfaceome markers in Intestinal Epithelial cells holds significant translational potential for Inflammatory Bowel Disease.
- Biomarker Discovery: Markers highly expressed in AC/CC (e.g., Muc4, Cxcl16, Cd44, Egfr, Met, Tnfrsf1a, Adam9, Mmp14) could serve as novel diagnostic or prognostic biomarkers for disease activity or progression, detectable directly on epithelial cells via biopsy or potentially through shed extracellular vesicles. Conversely, the reduction of HC-specific markers (e.g., Slc5a8, Ptprk, Lrig1) could indicate a loss of epithelial homeostasis and integrity, serving as markers of disease severity or remission.
Therapeutic Target Identification:
- Pro-inflammatory pathways: Upregulated receptors like EGFR, MET, and TNFRSF1A, along with chemokines like CXCL16, represent established or emerging therapeutic targets. Inhibitors of EGFR/MET are used in cancer and could be repurposed or refined for chronic inflammation, carefully balancing anti-inflammatory effects with regeneration needs. Anti-TNF-alpha therapies are already cornerstones of IBD treatment, validating the importance of TNFRSF1A signaling.
- Barrier Restoration: The altered expression of mucins (Muc4, Muc3a) and tight junction components (Cldn15) highlights opportunities to develop therapies that restore the protective mucus layer and epithelial barrier function. Similarly, modulating cell adhesion molecules like CD44 and ITGAV could dampen inflammatory cell recruitment and aberrant tissue remodeling.
- Epithelial Homeostasis: The downregulation of critical nutrient transporters (e.g., Slc5a8, Slc16a1) suggests that nutritional support and therapies aimed at enhancing epithelial metabolic function could be beneficial. Targets like Lrig1, essential for stem cell function, could be explored for regenerative medicine approaches to restore healthy epithelial turnover.
- Drug Development: Understanding the specific signaling pathways associated with these surfaceome markers can guide the development of small molecule inhibitors, antibodies, or gene therapies that precisely target disease-driving mechanisms while minimizing off-target effects on healthy tissue function. For instance, specific inhibition of ADAMs or MMPs might reduce pathological tissue destruction.
In conclusion, this analysis of the Intestinal Epithelial cell surfaceome provides a rich resource for understanding the molecular changes underpinning colon inflammation and for identifying promising new avenues for IBD therapeutic intervention and biomarker development.
12. Macrophage Condition-Specific Surfaceome Markers in Colon Tissue
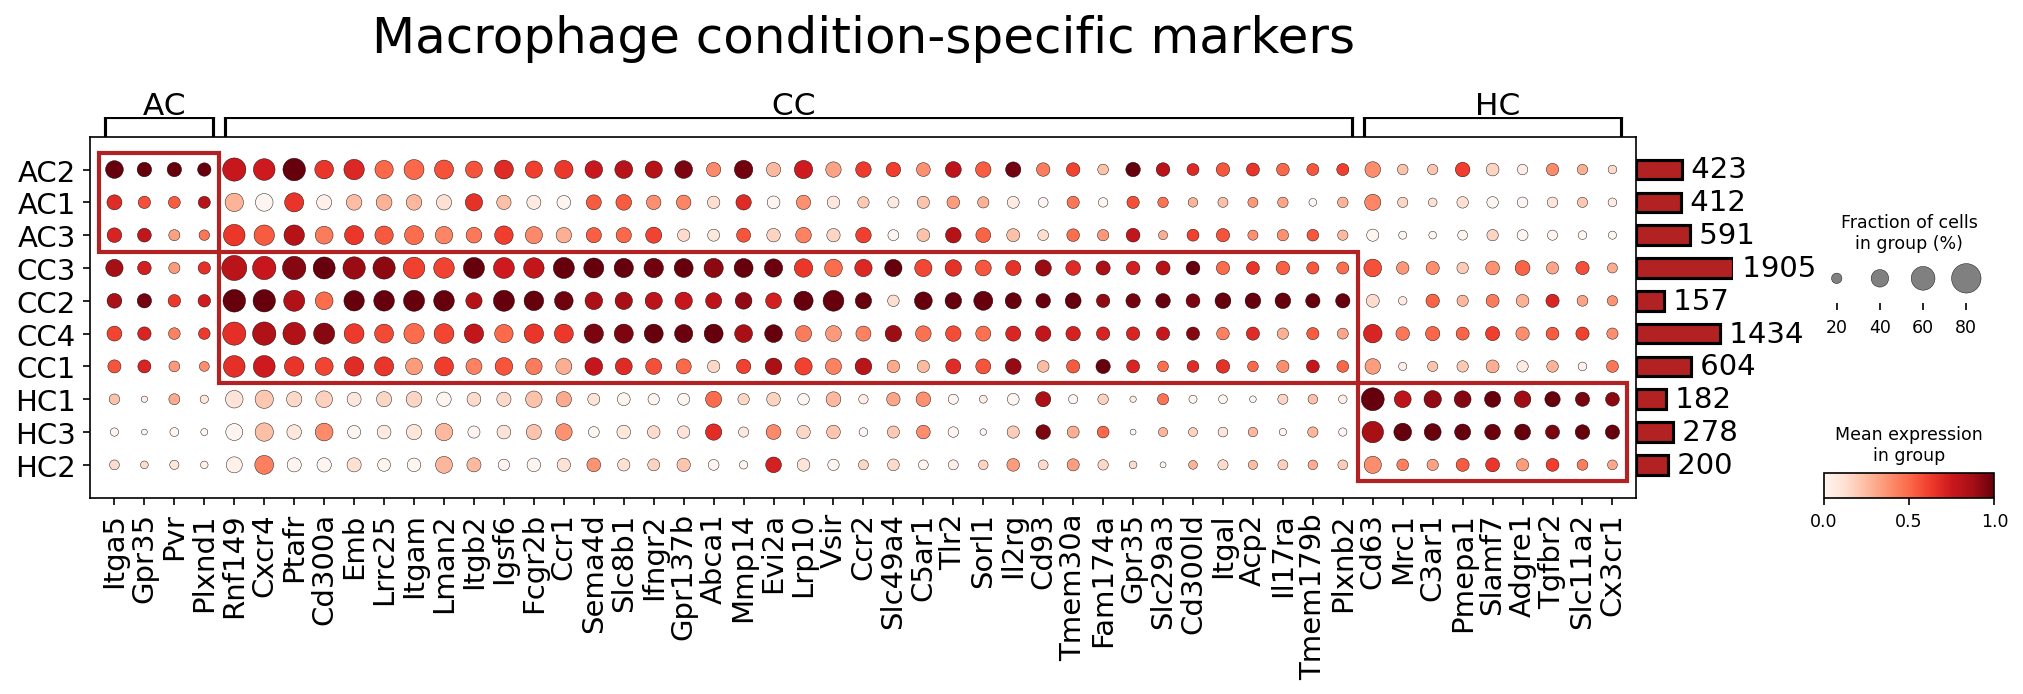
[Analysis Visualization Results]...
Analysis Overview
This analysis identifies condition-specific surfaceome markers expressed by Macrophage cells in mouse colon tissue across three conditions: Acute Colitis (AC), Chronic Colitis (CC), and Healthy Control (HC). The dot plot visualizes the mean expression level (color intensity) and the fraction of cells expressing the marker (dot size) for a curated set of surfaceome genes. This provides insight into how macrophage surface phenotypes differ during acute and chronic inflammation compared to a healthy state, highlighting potential functional changes and therapeutic targets.
Visual Summary
The dot plot clearly differentiates macrophage surface marker profiles across the AC, CC, and HC conditions.
- Healthy Control (HC) Macrophages: These samples (HC1, HC2, HC3) exhibit high and prevalent expression of a distinct set of markers, notably Mrc1, C3ar1, Pmepa1, Slamf7, Adgre1, Tgfbr2, Slc11a2, and Cx3cr1. These genes likely represent a homeostatic or resting macrophage phenotype in the healthy colon.
- Acute Colitis (AC) Macrophages: Samples from Acute Colitis (AC1, AC2, AC3) show a specific upregulation of Itga5, Gpr35, Pvr, Plxnd1, and Rnf149. While some CC-associated markers (e.g., *Cxcr4*, *Cd300a*) are also present, their expression tends to be less consistent or lower in AC compared to CC.
- Chronic Colitis (CC) Macrophages: Macrophages in Chronic Colitis (CC1, CC2, CC3, CC4) display a broad and robust upregulation of a large panel of surface markers. Key examples include Cxcr4, Cd300a, Emb, Itgam, Lman2, Itgb2, Fcgr2b, Ccr1, Sema4d, Ifngr2, Mmp14, Ccr2, C5ar1, Tlr2, Il17ra, and Itgal. This indicates a highly activated and phenotypically diverse macrophage population characteristic of chronic inflammation.
- Distinct Phenotypes: The visual separation of marker clusters (highlighted by red boxes) strongly suggests distinct macrophage activation states and functions associated with each condition. HC macrophages are characterized by markers linked to tissue homeostasis and immune regulation, while AC and especially CC macrophages show signatures of active immune responses, cell migration, and tissue remodeling.
Biological Interpretation
The observed condition-specific surfaceome markers on macrophages provide critical insights into their roles in colon health and Inflammatory Bowel Disease (IBD)/Colitis pathogenesis.
Markers Associated with Healthy/Homeostatic Macrophages (HC)
- Mrc1 (Mannose Receptor, CD206)
- Signaling/Mechanism: Mrc1 is a C-type lectin receptor expressed by resident macrophages, particularly M2-like macrophages. It recognizes glycosylated ligands on pathogens and self-antigens, mediating endocytosis, phagocytosis, and antigen presentation. It plays a role in resolving inflammation and maintaining tissue homeostasis.
- IBD Relevance: Its high expression in healthy colon macrophages suggests a homeostatic, potentially anti-inflammatory, or tissue-repairing role. Dysregulation (e.g., loss) of Mrc1-expressing macrophages might contribute to inflammatory conditions.
- Therapeutic Potential: Enhancing M2-like macrophage functions or Mrc1-mediated clearance mechanisms could be beneficial for resolving inflammation.
- Reference: GeneCards: MRC1
- Cx3cr1 (CX3C Chemokine Receptor 1)
- Signaling/Mechanism: Cx3cr1 is the receptor for the chemokine fractalkine (CX3CL1), mediating adhesion and migration of specific immune cell subsets, including tissue-resident macrophages in the gut. It's crucial for gut macrophage patrols and interaction with epithelial cells.
- IBD Relevance: Cx3cr1+ macrophages are considered vital for maintaining gut immune homeostasis. Dysregulation of the CX3CL1-CX3CR1 axis can contribute to both protective and pathogenic roles depending on the context of inflammation. High expression in HC suggests its role in maintaining mucosal integrity.
- Therapeutic Potential: Modulating CX3CL1-CX3CR1 signaling could influence macrophage trafficking and activation. However, specific targeting requires careful consideration due to its dual roles.
- Reference: PubMed: CX3CR1 in IBD
- Tgfbr2 (Transforming Growth Factor Beta Receptor 2)
- Signaling/Mechanism: Tgfbr2 is a receptor for TGF-β, a pleiotropic cytokine crucial for immune suppression, cell differentiation, and tissue repair. TGF-β signaling in macrophages can promote an M2 phenotype and suppress pro-inflammatory responses, maintaining immune tolerance.
- IBD Relevance: High Tgfbr2 expression in HC macrophages points to their role in maintaining immune tolerance and epithelial barrier function. Disrupted TGF-β signaling in IBD can exacerbate inflammation and impair healing.
- Therapeutic Potential: Targeting the TGF-β pathway to enhance its anti-inflammatory and pro-healing effects in macrophages could be a strategy, though systemic TGF-β modulation is complex due to its diverse roles.
- Reference: GeneCards: TGFBR2
Markers Associated with Acute Colitis (AC) Macrophages
- Itga5 (Integrin Alpha-5)
- Signaling/Mechanism: Itga5 forms a heterodimer with Itgb1 (integrin beta-1) to create the fibronectin receptor. This integrin mediates cell adhesion to the extracellular matrix (ECM), cell migration, and cell-cell interactions. It is involved in mechanosensing and signal transduction affecting cell survival, proliferation, and differentiation.
- IBD Relevance: Macrophage migration into inflamed tissue is crucial during acute inflammation. Upregulation of integrins like Itga5 suggests increased adhesive and migratory capacity of macrophages, enabling their recruitment and retention at sites of acute inflammation.
- Therapeutic Potential: Inhibiting specific integrins involved in immune cell trafficking (e.g., vedolizumab targeting α4β7) is a proven strategy in IBD. Itga5, if confirmed to be a critical mediator of pathogenic macrophage recruitment in acute colitis, could be a candidate for targeted adhesion inhibition.
- Reference: UniProt: ITGA5
- Pvr (Poliovirus Receptor, CD155)
- Signaling/Mechanism: PVR is a cell adhesion molecule that interacts with specific receptors (e.g., TIGIT, CD226) on immune cells, modulating immune responses. It acts as an immune checkpoint ligand; binding to TIGIT on T cells can suppress T cell activity, while binding to CD226 can activate T cells and NK cells. In macrophages, it can also regulate phagocytosis and cytokine production.
- IBD Relevance: Upregulated PVR in acute colitis macrophages could indicate active immune modulation, potentially attempting to resolve or control the acute inflammatory burst, or contributing to immune exhaustion depending on its interaction partners.
- Therapeutic Potential: PVR and its interacting receptors (TIGIT/CD226) are emerging immune checkpoint targets in cancer and autoimmune diseases. Modulating this axis might influence the balance of pro- versus anti-inflammatory responses in colitis, though its specific role in acute colitis macrophages needs further elucidation.
- Reference: GeneCards: PVR
Markers Associated with Chronic Colitis (CC) Macrophages
- Cxcr4 (CXC Chemokine Receptor 4)
- Signaling/Mechanism: Cxcr4 is a receptor for the chemokine CXCL12 (SDF-1). This axis is critical for cell migration, homing, and retention in various tissues, including immune cell trafficking to sites of inflammation or tissue damage. It's often associated with chronic inflammation and fibrosis.
- IBD Relevance: High Cxcr4 expression indicates a strong migratory potential and recruitment of macrophages to the chronically inflamed colon. It can promote macrophage survival and activation, contributing to ongoing inflammation and tissue remodeling.
- Therapeutic Potential: Inhibitors of Cxcr4 (e.g., Plerixafor) are used in other contexts (e.g., stem cell mobilization). Targeting the CXCL12-CXCR4 axis could potentially reduce macrophage infiltration and severity of chronic colitis.
- Reference: PubMed: CXCR4 and IBD
- Ccr2 (CC Chemokine Receptor 2)
- Signaling/Mechanism: Ccr2 is a receptor for chemokines like CCL2 (MCP-1), CCL7, CCL8, and CCL12. It is a critical mediator of monocyte/macrophage recruitment from the bloodstream into inflamed tissues. High expression is characteristic of "inflammatory" monocytes and macrophages.
- IBD Relevance: A robust Ccr2 expression in chronic colitis macrophages is a hallmark of ongoing inflammatory monocyte infiltration, which fuels chronic inflammation, tissue damage, and perpetuates the disease.
- Therapeutic Potential: Ccr2 antagonists have been developed and tested in various inflammatory diseases, showing promise in reducing immune cell infiltration. This is a strong candidate for therapeutic intervention in IBD to limit macrophage accumulation.
- Reference: GeneCards: CCR2
- Tlr2 (Toll-like Receptor 2)
- Signaling/Mechanism: Tlr2 is a pattern recognition receptor (PRR) that recognizes a wide range of microbial components (e.g., bacterial lipoproteins, peptidoglycan) and endogenous danger signals. Its activation triggers downstream signaling pathways (e.g., MyD88 pathway) leading to the production of pro-inflammatory cytokines and chemokines.
- IBD Relevance: In the context of chronic colitis, Tlr2 upregulation suggests increased responsiveness to microbial dysbiosis or barrier dysfunction, driving persistent inflammation in the gut.
- Therapeutic Potential: Modulating Tlr2 activity (antagonists) could dampen chronic inflammation driven by microbial signals in IBD, though care must be taken not to compromise essential immune surveillance.
- Reference: PubMed: TLR2 and IBD
- Ifngr2 (Interferon Gamma Receptor 2)
- Signaling/Mechanism: Ifngr2 is a subunit of the interferon-gamma (IFN-γ) receptor complex. IFN-γ is a potent pro-inflammatory cytokine that activates macrophages, leading to increased antigen presentation, phagocytosis, and cytokine production, crucial for host defense but also implicated in chronic inflammation.
- IBD Relevance: Upregulated Ifngr2 indicates that macrophages in chronic colitis are highly responsive to IFN-γ, suggesting an ongoing Th1-mediated inflammatory response that perpetuates tissue damage.
- Therapeutic Potential: Neutralizing IFN-γ or blocking its receptor could be a strategy to reduce chronic inflammation driven by this cytokine axis in IBD, though IFN-γ has protective roles as well.
- Reference: UniProt: IFNGR2
- Mmp14 (Matrix Metalloproteinase 14)
- Signaling/Mechanism: Mmp14 (MT1-MMP) is a membrane-bound matrix metalloproteinase involved in degrading extracellular matrix components (e.g., collagen, fibronectin). It plays a crucial role in tissue remodeling, cell migration, and activation of other MMPs, and is involved in both pathological and physiological processes.
- IBD Relevance: Elevated Mmp14 expression suggests active tissue degradation and remodeling in chronic colitis, contributing to architectural changes, fibrosis, and impaired healing. It can also facilitate immune cell migration through tissue barriers.
- Therapeutic Potential: MMP inhibitors have been explored for various inflammatory diseases. Targeting Mmp14 could potentially reduce tissue damage and fibrotic complications in chronic IBD, but specific targeting is needed to avoid broad MMP inhibition side effects.
- Reference: GeneCards: MMP14
- Itgam (Integrin Alpha-M, CD11b) / Itgb2 (Integrin Beta-2, CD18)
- Signaling/Mechanism: These two subunits form the macrophage-1 antigen (Mac-1, also known as CR3), a leukocyte integrin. Mac-1 mediates adhesion of leukocytes to endothelial cells, facilitates transmigration into tissues, and acts as a receptor for various ligands including complement component iC3b, ICAMs, and fibrinogen. It's critical for phagocytosis, inflammation, and immune cell recruitment.
- IBD Relevance: High expression of Itgam/Itgb2 is a strong indicator of activated and migratory macrophages/monocytes involved in acute and chronic inflammation. It drives recruitment and interaction with other cells and the ECM in the inflamed gut.
- Therapeutic Potential: Blocking CD11b/CD18 can reduce leukocyte recruitment and inflammation. Anti-integrin therapies (e.g., vedolizumab for α4β7) are approved for IBD, demonstrating the validity of targeting integrins. Mac-1 could be another target to limit macrophage infiltration.
- Reference: UniProt: ITGAM, UniProt: ITGB2
- C5ar1 (Complement C5a Receptor 1, CD88)
- Signaling/Mechanism: C5ar1 is a G-protein coupled receptor for the anaphylatoxin C5a, a potent chemoattractant and activator of immune cells. C5a-C5ar1 signaling triggers rapid inflammation, degranulation, and production of pro-inflammatory mediators.
- IBD Relevance: Upregulation of C5ar1 suggests active complement system activation in chronic colitis, contributing to macrophage recruitment and activation, thereby amplifying the inflammatory cascade.
- Therapeutic Potential: C5ar1 antagonists have shown promise in preclinical models of inflammatory diseases. Blocking C5a-C5ar1 signaling could mitigate severe inflammation in IBD.
- Reference: PubMed: C5aR1 and Colitis
- Il17ra (Interleukin 17 Receptor A)
- Signaling/Mechanism: Il17ra is a subunit of the receptor for IL-17 cytokines (e.g., IL-17A, IL-17F), primarily produced by Th17 cells and ILC3s. IL-17 signaling promotes inflammation by inducing neutrophil recruitment, cytokine production, and antimicrobial peptide release.
- IBD Relevance: Macrophage responsiveness to IL-17 (indicated by high Il17ra) suggests their participation in the IL-17-mediated inflammatory network, a known driver of chronic inflammation and tissue damage in IBD.
- Therapeutic Potential: Therapies targeting IL-17 or its receptor are approved for other inflammatory conditions (e.g., psoriasis, psoriatic arthritis) and are under investigation for IBD, with potential to reduce macrophage-mediated inflammation.
- Reference: GeneCards: IL17RA
Clinical or Translational Implications
The distinct macrophage surfaceome profiles across healthy, acute, and chronic colitis states offer valuable translational insights:
- Biomarker Discovery: The identified condition-specific markers (e.g., Mrc1 and Cx3cr1 for HC; Itga5 for AC; Cxcr4, Ccr2, Tlr2, Mmp14 for CC) could serve as diagnostic or prognostic biomarkers for IBD, helping to distinguish disease states (e.g., active vs. quiescent, acute vs. chronic) or predict disease progression. These could potentially be assessed via biopsies or advanced imaging techniques.
Therapeutic Target Identification:
- Inflammation Control: The consistent upregulation of chemokine receptors (e.g., Cxcr4, Ccr2) and Toll-like receptors (e.g., Tlr2) in chronic colitis macrophages strongly supports their role in driving and sustaining inflammation. Targeting these receptors with specific antagonists could reduce pathogenic macrophage recruitment and activation in IBD. For instance, CCR2 antagonists have shown efficacy in pre-clinical models of colitis.
- Tissue Remodeling: Mmp14 overexpression points to active extracellular matrix degradation in chronic colitis. Inhibiting Mmp14 could mitigate tissue damage and fibrosis, which are significant complications in chronic IBD.
- Immune Modulation: Receptors like Ifngr2 and Il17ra indicate that macrophages in chronic colitis are highly responsive to pro-inflammatory cytokines. Therapies that block these cytokine pathways (e.g., anti-IFNγ or anti-IL-17 biologics) could reduce macrophage-driven inflammation.
- Adhesion and Migration: Integrins like Itga5, Itgam, Itgb2 are crucial for macrophage adhesion and migration. Building upon the success of existing anti-integrin therapies (e.g., vedolizumab), further investigation into the specific integrin profiles of pathogenic macrophages could identify novel targets to limit immune cell infiltration.
- Stratification of Patients: The different marker profiles observed in AC versus CC suggest that patients with acute flares might benefit from different macrophage-targeting strategies compared to those with chronic, established disease. This highlights the potential for precision medicine approaches in IBD based on the specific macrophage phenotypes.
- Experimental Validation: These markers serve as strong candidates for further experimental validation (e.g., using flow cytometry, immunohistochemistry on patient samples, or genetic knockdown/overexpression in animal models) to confirm their functional roles and therapeutic utility in IBD.
13. Fibroblast Condition-Specific Surfaceome Markers in Colitis
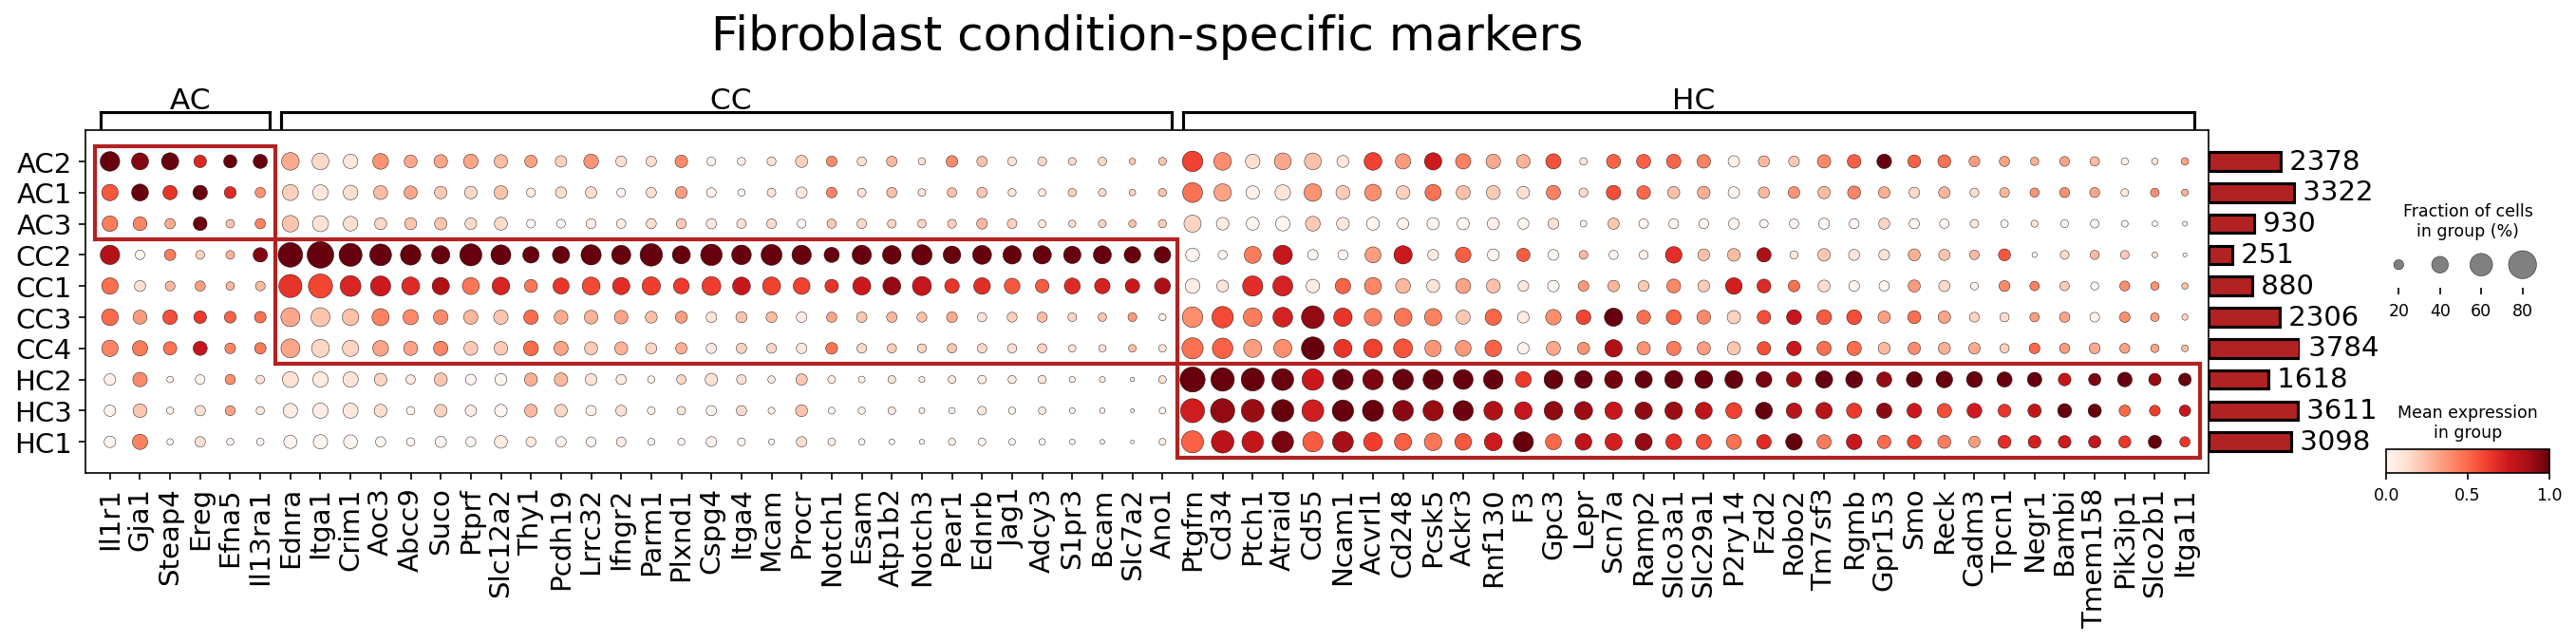
[Analysis Visualization Results]...
Analysis Overview
This analysis investigates the expression patterns of surfaceome markers in Fibroblast cells across three conditions: Acute Colitis (AC), Chronic Colitis (CC), and Healthy Control (HC), derived from mouse Colon tissue. The goal is to identify markers that are differentially expressed in a condition-specific manner, shed light on the underlying biological mechanisms, and evaluate their potential as therapeutic targets for Inflammatory Bowel Disease (Colitis). The analysis utilized a dot plot to visualize both the mean expression level (color intensity) and the fraction of cells expressing each marker (dot size) for each sample within the respective conditions. Only surfaceome markers were considered, with a maximum of 40 markers per condition selected for plotting.
Visual Summary
The dot plot effectively illustrates distinct expression signatures for Fibroblasts across the different conditions.
- Healthy Control (HC) Fibroblasts: A cluster of markers, including Ptgfrn, Cd34, Pik3ip1, Ramp2, Slc29a1, Fzd2, Robo2, and Gpr153, exhibit relatively high expression and prevalence in HC samples (HC1, HC2, HC3). These markers are generally downregulated or absent in the AC and CC conditions, suggesting a healthy or homeostatic fibroblast phenotype.
- Acute Colitis (AC) Fibroblasts: Samples from the AC group (AC1, AC2, AC3) show a distinct upregulation of several markers, most notably Il1r1, Gja1, Steap4, Ereg, Efna5, Pdgfrb, Itga5, Aoc3, and Osmr. These genes generally display higher expression levels and larger dot sizes in AC compared to CC and HC, indicating an activated inflammatory state.
- Chronic Colitis (CC) Fibroblasts: The CC samples (CC1, CC2, CC3, CC4) exhibit a profound and widespread upregulation of numerous surfaceome markers. Prominent among these are genes associated with extracellular matrix (ECM) remodeling and fibrosis, such as Spp1, Col4a1, Col4a2, Fn1, Itgb1, and Itga5. Additionally, markers involved in cell adhesion, immune modulation, and growth factor signaling like Pla2r1, Sema4c, Ifngr2, Sdc1, Mcam, Notch1, Cd248, F3, and Lepr are highly expressed. This broad signature reflects a highly activated, pro-inflammatory, and pro-fibrotic fibroblast phenotype characteristic of chronic inflammation.
- Differential Expression Patterns: While some markers show clear condition specificity (e.g., Il1r1 in AC, Spp1 in CC, Ptgfrn in HC), others display more nuanced patterns, sometimes being elevated in both acute and chronic conditions but to different degrees (e.g., Itga5, Sdc1).
Biological Interpretation
Healthy Control (HC) Fibroblast Markers
The surfaceome markers expressed in healthy colon fibroblasts suggest a role in maintaining tissue homeostasis and regulating basal cellular functions, distinct from inflammatory activation.
- Ptgfrn (Prostaglandin F2 Receptor Negative Regulator): This gene encodes a protein that regulates prostaglandin F2 alpha receptor signaling. High expression in HC may indicate a mechanism to dampen or fine-tune pro-inflammatory prostaglandin pathways, contributing to an anti-inflammatory or quiescent state in healthy tissue. GeneCards: PTGFRN
- Cd34: A transmembrane glycoprotein expressed on quiescent fibroblasts in various tissues. In the colon, CD34-positive fibroblasts are often associated with normal tissue structure and might represent a less activated stromal compartment. Its downregulation in colitis suggests a shift away from this quiescent state during inflammation. PubMed: CD34 stromal cells gut
- Pik3ip1 (PI3K Interacting Protein 1): Known to inhibit PI3K signaling. High expression in healthy fibroblasts suggests a mechanism to restrain pro-proliferative and pro-survival pathways, maintaining tissue homeostasis and preventing excessive activation or expansion of fibroblasts. GeneCards: PIK3IP1
- Ramp2 (Receptor Activity Modifying Protein 2): Involved in modulating G-protein coupled receptor activity, particularly for the calcitonin receptor-like receptor (CLR), which binds adrenomedullin (AM). AM signaling can have anti-inflammatory and vasodilatory effects, thus higher RAMP2 in HC may contribute to maintaining vascular tone and an anti-inflammatory microenvironment. GeneCards: RAMP2
Acute Colitis (AC) Fibroblast Markers
The upregulated markers in AC fibroblasts indicate an acute response to inflammation, characterized by enhanced cytokine sensing, cellular communication, and early tissue repair mechanisms.
- Il1r1 (Interleukin 1 Receptor Type 1): The primary receptor for pro-inflammatory cytokines IL-1α and IL-1β. Its strong upregulation in AC fibroblasts suggests that these cells become highly responsive to key inflammatory signals during the acute phase, driving local inflammation and immune cell recruitment. UniProt: P14779 (IL1R1_MOUSE)
- Ereg (Epiregulin): A member of the epidermal growth factor (EGF) family, involved in cell proliferation, migration, and angiogenesis. Upregulation during acute colitis may signify an early attempt at tissue repair and mucosal regeneration, albeit in an inflammatory context. GeneCards: EREG
- Pdgfrb (Platelet-derived growth factor receptor beta): A key receptor for PDGF, which is a potent mitogen and chemoattractant for fibroblasts. Its expression indicates activation of fibroblasts and their potential involvement in early proliferative and migratory responses during acute inflammation, preceding fibrotic remodeling. GeneCards: PDGFRB
- Aoc3 (Amine Oxidase, Copper Containing 3, VAP-1): An adhesion molecule and an enzyme involved in leukocyte extravasation. Upregulation on AC fibroblasts can facilitate the recruitment of immune cells to the inflamed site, exacerbating acute inflammation. GeneCards: AOC3
- Osmr (Oncostatin M Receptor): Oncostatin M (OSM) is a cytokine involved in inflammation, tissue remodeling, and fibrosis. High OSMR expression on AC fibroblasts indicates their responsiveness to OSM, which can promote fibroblast activation and contribute to the inflammatory milieu. GeneCards: OSMR
Chronic Colitis (CC) Fibroblast Markers
The extensive upregulation of markers in CC fibroblasts points to a sustained pro-inflammatory, pro-fibrotic, and ECM-remodeling phenotype, characteristic of chronic disease.
- Spp1 (Secreted Phosphoprotein 1, Osteopontin): A matricellular protein and cytokine involved in inflammation, immune cell recruitment, and tissue remodeling. Its strong and widespread upregulation in CC fibroblasts is a hallmark of chronic inflammation and fibrosis, promoting immune cell adhesion and survival, and driving ECM deposition. UniProt: Q62372 (SPP1_MOUSE)
- Col4a1 / Col4a2 (Collagen Type IV Alpha 1 / Alpha 2): Components of basement membranes. Their increased expression suggests ongoing remodeling and deposition of ECM, a central feature of fibrosis in chronic inflammatory conditions like IBD. GeneCards: COL4A1, GeneCards: COL4A2
- Fn1 (Fibronectin 1): An extracellular matrix glycoprotein crucial for cell adhesion, migration, and wound healing. Its robust upregulation in CC fibroblasts highlights their active role in ECM synthesis and organization, contributing to fibrotic pathology. UniProt: P11276 (FINC_MOUSE)
- Itgb1 (Integrin Beta 1) & Itga5 (Integrin Alpha 5): Integrins are cell surface receptors that mediate cell-ECM interactions. Itgb1 pairs with various alpha subunits, including Itga5, to bind fibronectin. Their co-upregulation in CC indicates enhanced fibroblast adhesion, migration, and mechanosensing of the altered fibrotic ECM, critical for maintaining and propagating the fibrotic response. GeneCards: ITGB1, GeneCards: ITGA5
- Mcam (Melanoma Cell Adhesion Molecule, CD146): An adhesion molecule expressed on various cell types, including stromal cells. It's involved in angiogenesis and leukocyte extravasation, suggesting its role in sustaining inflammation and vascular changes in chronic colitis. GeneCards: MCAM
- Notch1: A receptor in the highly conserved Notch signaling pathway, which regulates cell fate decisions, proliferation, and differentiation. Aberrant Notch signaling in fibroblasts has been implicated in promoting fibrosis in various organs, including the gut. Its upregulation suggests activation of pro-fibrotic signaling. PubMed: Notch signaling fibrosis
- Sdc1 (Syndecan-1): A heparan sulfate proteoglycan. While present in HC, its strong upregulation in CC suggests a role in chronic inflammation and fibrosis, potentially by binding and presenting growth factors and chemokines, or modulating ECM interactions. GeneCards: SDC1
Clinical or Translational Implications
The identification of condition-specific surfaceome markers on fibroblasts provides valuable insights into the pathophysiology of Inflammatory Bowel Disease (Colitis) and highlights potential therapeutic targets.
Targeting Acute Inflammation:
- IL1R1: Given its central role in sensing pro-inflammatory cytokines, blocking IL1R1 signaling could attenuate acute inflammatory responses. Therapeutic agents targeting IL-1 (e.g., anakinra, canakinumab) are available for other inflammatory conditions, and their application or new IL1R1 antagonists could be explored for acute colitis. PubMed: IL-1 blockade IBD
- Aoc3 (VAP-1): Inhibitors of AOC3/VAP-1 are being investigated for inflammatory diseases to reduce leukocyte trafficking to inflamed sites. Targeting VAP-1 on fibroblasts in acute colitis could help limit immune cell infiltration and subsequent tissue damage. PubMed: VAP-1 inhibitor inflammation
- Pdgfrb: While important for repair, excessive PDGF signaling contributes to pathological fibroblast activation. Tyrosine kinase inhibitors targeting PDGF receptors (e.g., imatinib, nintedanib) are used in fibrotic diseases and could be investigated for modulating fibroblast activity in acute inflammation. PubMed: PDGF receptor inhibitor fibrosis
Addressing Chronic Inflammation and Fibrosis:
- Spp1 (Osteopontin): Spp1 is a major driver of fibrosis and chronic inflammation. Modulating Spp1 activity or its receptors (e.g., integrin alphaVbeta3) could represent a strategy to reduce chronic inflammation and prevent or reverse fibrosis in IBD. Neutralizing antibodies or receptor antagonists could be explored. PubMed: Osteopontin inhibitor IBD
- Collagens (Col4a1/2), Fibronectin (Fn1), and Integrins (Itgb1/Itga5): These markers represent core components and mediators of ECM remodeling and fibrosis. While direct targeting of ECM components is challenging, strategies aimed at inhibiting their synthesis or the activity of associated integrins could mitigate fibrotic progression. Anti-integrin therapies (e.g., vedolizumab, targeting α4β7 integrin) are already used in IBD, and targeting α5β1 integrin specifically on fibroblasts could be a novel approach. PubMed: Integrin inhibitors fibrosis
- Notch1: Inhibiting Notch signaling has shown promise in preclinical models of fibrosis. Developing fibroblast-specific Notch inhibitors could be a strategy to curb pro-fibrotic pathways in chronic colitis. PubMed: Notch inhibitor IBD fibrosis
- Mcam (CD146): As an adhesion molecule involved in angiogenesis and inflammation, targeting MCAM could reduce pathological neovascularization and leukocyte recruitment, which contribute to chronic disease pathology.
Restoring Homeostasis:
- Understanding the factors that lead to the downregulation of Ptgfrn, Cd34, and Pik3ip1 in disease states could offer insights into restoring a healthy fibroblast phenotype. Therapies that promote fibroblast quiescence or re-establish anti-inflammatory mechanisms could be beneficial for long-term management of IBD.
These findings suggest that a targeted approach focusing on fibroblast-specific surfaceome markers could lead to novel diagnostic or prognostic biomarkers and therapeutic interventions that specifically modulate fibroblast behavior in different stages of Inflammatory Bowel Disease.
14. T cell CD4+ Condition-Specific Surfaceome Markers in Colitis
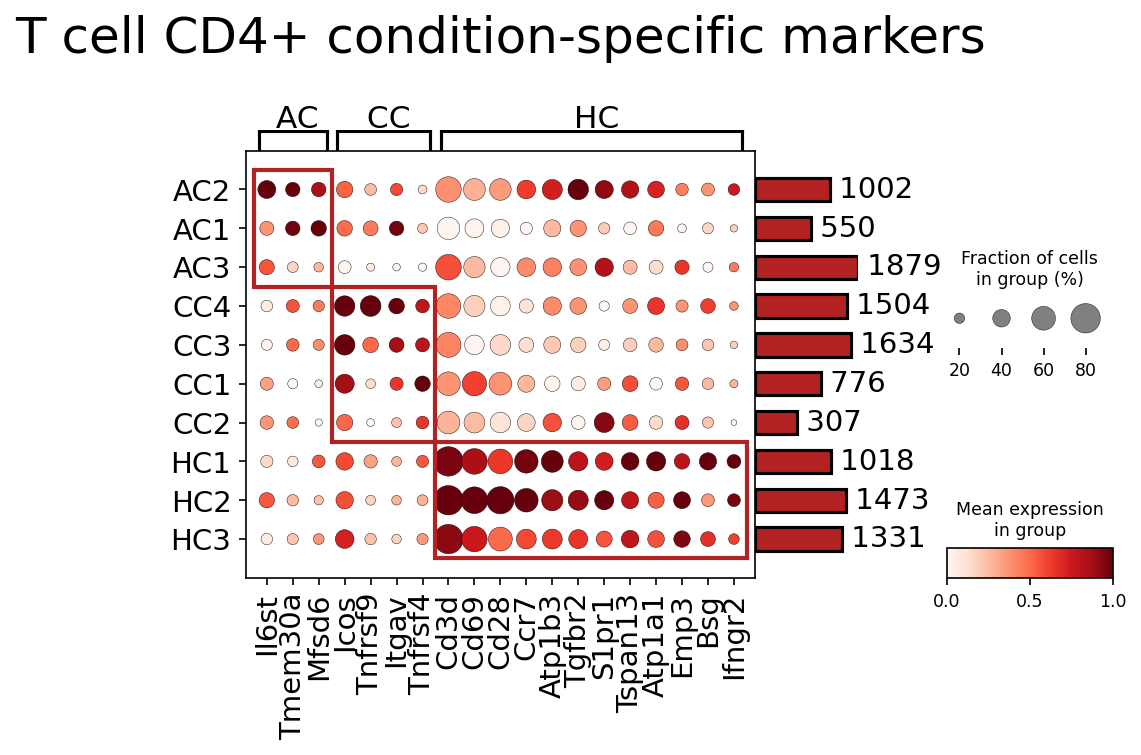
[Analysis Visualization Results]...
Analysis Overview
This analysis presents a dot plot illustrating the expression of selected surfaceome markers in CD4+ T cells across different conditions (Acute Colitis (AC), Chronic Colitis (CC), and Healthy Control (HC)) and individual samples. The markers shown are specifically identified as condition-specific, meaning they exhibit distinct expression patterns in one or more conditions compared to others, after filtering for surfaceome proteins and applying significance cutoffs. The plot's size of the dot reflects the fraction of cells expressing the marker, while the color intensity indicates the mean expression level within that cell group. This visualization helps to identify key surface molecules that characterize CD4+ T cell states in different stages of colon inflammation.
Visual Summary
The dot plot clearly segregates the samples into three main conditions: AC, CC, and HC, based on their CD4+ T cell surfaceome marker expression profiles.
- Healthy Control (HC) Samples (HC1, HC2, HC3): These samples exhibit high and prevalent expression of a cluster of markers including Cd3d, Cd69, Cd28, Ccr7, Atp1b3, Tgfbr2, S1pr1, Tspan13, Atp1a1, Emp3, Bsg, and Ifngr2. This profile likely represents homeostatic or quiescent CD4+ T cells, along with central memory T cells, involved in immune surveillance and regulatory functions. Ccr7 and S1pr1 show particularly strong expression in HC.
- Acute Colitis (AC) Samples (AC2, AC1, AC3): These samples are characterized by the prominent expression of Il6st, Tmem30a, and Mfsd6. These markers are largely absent or expressed at very low levels in CC and HC samples, suggesting their specific upregulation during acute inflammatory phases.
- Chronic Colitis (CC) Samples (CC4, CC3, CC1, CC2): These samples show a distinct set of highly expressed markers, notably Icos, Tnfrsf9, Itgav, and Tnfrsf4. These markers are either low or absent in AC and HC, highlighting their association with chronic inflammatory processes. Several markers like Cd3d, Cd69, Cd28 also remain highly expressed, similar to HC, but with a unique additional signature.
Overall, the plot reveals distinct surface protein signatures on CD4+ T cells that differentiate acute, chronic, and healthy states in the colon, suggesting different functional roles and activation states of these cells in IBD pathogenesis.
Biological Interpretation
The distinct expression patterns of surfaceome markers provide insights into the functional alterations of CD4+ T cells in the context of Inflammatory Bowel Disease (Colitis).
Markers Enriched in Acute Colitis (AC)
The following markers are notably upregulated in CD4+ T cells from acute colitis samples:
Il6st (IL-6 Signal Transducer, gp130)
- Signaling Pathways/Mechanisms: Il6st is a critical component of receptors for the IL-6 family of cytokines (e.g., IL-6, IL-11, LIF, OSM). In CD4+ T cells, its activation, typically by IL-6 binding to IL-6Rα and subsequent association with Il6st, initiates the JAK/STAT (primarily STAT3) signaling pathway. This pathway is a key driver of Th17 cell differentiation, a T cell subset strongly implicated in inflammatory and autoimmune diseases like IBD. Il6st signaling also promotes T cell survival and proliferation in inflammatory environments [PubMed search: IL6ST JAK STAT3 Th17 IBD].
- Therapeutic Potential (IBD): Targeting the IL-6/JAK/STAT3 pathway is a validated therapeutic strategy for IBD. High Il6st expression suggests increased responsiveness to IL-6 family cytokines during acute flares, driving acute inflammation.
- Related Therapeutic Agents: JAK inhibitors (e.g., tofacitinib, upadacitinib, filgotinib) are approved for ulcerative colitis and/or Crohn's disease, acting downstream of Il6st to block inflammatory signaling. Monoclonal antibodies targeting IL-6 or IL-6R are also used in other inflammatory conditions.
Tmem30a (Transmembrane Protein 30a, CDC50A)
- Signaling Pathways/Mechanisms: Tmem30a is a β-subunit of P4-ATPase flippases (e.g., ATP8A1), which are responsible for maintaining lipid asymmetry in cell membranes by transporting aminophospholipids. While its specific function in CD4+ T cells is not fully elucidated, maintaining membrane lipid asymmetry is crucial for membrane integrity, trafficking, and cell signaling. Alterations in lipid composition and dynamics can impact T cell activation, differentiation, and migration during inflammation.
- Therapeutic Potential (IBD): Its role as a direct therapeutic target is less established. However, if altered lipid metabolism in T cells contributes to acute inflammation, modulating flippase activity could be a novel approach, though currently speculative.
- Related Therapeutic Agents: No direct therapeutic agents targeting Tmem30a for IBD are currently known.
Mfsd6 (Major Facilitator Superfamily Domain Containing 6)
- Signaling Pathways/Mechanisms: Mfsd6 is a member of the Major Facilitator Superfamily, a large group of transmembrane transporters that move various substrates across membranes. The specific substrate and function of Mfsd6 in CD4+ T cells remain largely uncharacterized. However, MFS transporters are often involved in nutrient uptake or waste export, which are critical for the high metabolic demands of rapidly activated T cells during acute inflammation.
- Therapeutic Potential (IBD): As with Tmem30a, Mfsd6 is not a direct, established therapeutic target. Its potential as a target would depend on identifying a critical metabolic pathway it controls in pathogenic T cells in acute colitis.
- Related Therapeutic Agents: None specifically.
Markers Enriched in Chronic Colitis (CC)
The following markers are notably upregulated in CD4+ T cells from chronic colitis samples:
Icos (Inducible T-cell COStimulator)
- Signaling Pathways/Mechanisms: Icos is a CD28-superfamily costimulatory receptor expressed on activated T cells, particularly T follicular helper (Tfh) and Th17 cells. Binding to its ligand, ICOSL, provides critical costimulation, promoting T cell proliferation, survival, and production of cytokines (e.g., IL-4, IL-10, IL-17, IL-21). The ICOS-ICOSL axis is essential for sustained T cell responses and is a key driver of chronic inflammation and humoral immunity [GeneCards: ICOS]. Its high expression in CC suggests ongoing, robust T cell activation.
- Therapeutic Potential (IBD): Blocking the ICOS-ICOSL pathway is a promising strategy to dampen chronic T cell-mediated inflammation, especially by inhibiting pathogenic Tfh and Th17 responses.
- Related Therapeutic Agents: Monoclonal antibodies targeting ICOS or ICOSL are in clinical development for autoimmune diseases and cancer.
- Tnfrsf9 (Tumor Necrosis Factor Receptor Superfamily Member 9, 4-1BB, CD137)
- Signaling Pathways/Mechanisms: Tnfrsf9 is a costimulatory receptor on activated T cells (CD4+ and CD8+). Upon binding to its ligand, 4-1BBL, it enhances T cell proliferation, survival, and effector functions, particularly during chronic antigen stimulation. This pathway is crucial for maintaining memory T cell responses and boosting cytokine production (e.g., IFN-γ, IL-2). Its upregulation in CC indicates prolonged T cell activation and persistence in chronic inflammation [UniProt: TNFRSF9].
- Therapeutic Potential (IBD): While 4-1BB agonists are used in cancer to boost immunity, Tnfrsf9 antagonists could be beneficial in chronic autoimmune inflammation to suppress overactive T cells.
- Related Therapeutic Agents: Currently, Tnfrsf9 antagonists are less commonly pursued in clinical trials for autoimmune diseases compared to agonists in oncology.
Itgav (Integrin Alpha V, CD51)
- Signaling Pathways/Mechanisms: Itgav is a subunit that forms various integrin heterodimers (e.g., αvβ1, αvβ3, αvβ5, αvβ6, αvβ8). These integrins mediate cell adhesion to extracellular matrix (ECM) components like vitronectin, fibronectin, and osteopontin. They are crucial for T cell migration, extravasation into inflamed tissues, T cell activation, and cytokine production. In IBD, integrins play a significant role in immune cell trafficking to the gut. Itgav-containing integrins can also activate latent TGF-β, contributing to both immune regulation and fibrosis in chronic inflammation [PubMed search: ITGAV T cell trafficking IBD].
- Therapeutic Potential (IBD): Targeting specific integrins is an established strategy in IBD (e.g., vedolizumab targets α4β7). While Itgav is broadly expressed, selectively inhibiting specific αv integrin partners (e.g., αvβ6) implicated in gut inflammation and fibrosis could be beneficial.
- Related Therapeutic Agents: Vedolizumab (anti-α4β7) is approved for IBD. Other integrin-targeted therapies, including those targeting αv integrins, are under investigation for fibrotic and inflammatory conditions.
- Tnfrsf4 (Tumor Necrosis Factor Receptor Superfamily Member 4, OX40, CD134)
- Signaling Pathways/Mechanisms: Tnfrsf4 is a costimulatory receptor expressed on activated CD4+ T cells, including Th1, Th2, and Tfh cells. Its interaction with OX40L (TNFSF4) provides potent survival and proliferation signals to T cells, enhances cytokine production, and promotes the development of memory T cells. The OX40-OX40L pathway is crucial for sustaining chronic immune responses and breaking T cell tolerance, making it a key player in autoimmune diseases [GeneCards: TNFRSF4]. Its significant upregulation in CC signifies its role in maintaining persistent T cell-mediated inflammation.
- Therapeutic Potential (IBD): Blocking the OX40-OX40L pathway is a promising therapeutic strategy to reduce the survival and pathogenic activity of chronically activated CD4+ T cells, thereby mitigating chronic inflammation in IBD.
- Related Therapeutic Agents: Monoclonal antibodies targeting OX40 or OX40L are in clinical development for various autoimmune and inflammatory diseases, including IBD.
Markers Predominantly Expressed in Healthy Control (HC) and/or Basal T cell Function
These markers are generally indicative of normal T cell function, homeostasis, or immune surveillance, often downregulated or altered in colitis.
Cd3d (CD3 Delta)
- Signaling Pathways/Mechanisms: Cd3d is an integral component of the T cell receptor (TCR) complex, essential for TCR surface expression and signal transduction. It is fundamental for antigen recognition and initiating downstream signaling pathways that lead to T cell activation, proliferation, and effector functions. Its high expression across HC and CC reflects the core identity and functional capacity of T cells.
- Therapeutic Potential (IBD): Cd3d itself is not a direct therapeutic target due to its pan-T cell expression. However, therapies that modulate downstream TCR signaling (e.g., calcineurin inhibitors) are used to suppress T cell activity in autoimmune conditions.
- Related Therapeutic Agents: Calcineurin inhibitors (e.g., cyclosporine, tacrolimus) indirectly affect TCR signaling.
Cd69 (CD69 antigen)
- Signaling Pathways/Mechanisms: Cd69 is an early activation marker of lymphocytes, rapidly induced upon TCR stimulation. It plays a role in retaining lymphocytes in lymphoid organs and inflamed tissues by antagonizing S1PR1-mediated egress and contributing to tissue residency. Its expression in both HC and CC suggests presence of activated/resident T cells, possibly responding to commensals or chronic inflammation.
- Therapeutic Potential (IBD): Cd69 is primarily a marker. Modulating lymphocyte trafficking via S1P receptor (S1PR1) modulators is a therapeutic strategy for IBD, which indirectly relates to Cd69's function.
- Related Therapeutic Agents: S1P receptor modulators (e.g., ozanimod) indirectly affect cell egress mechanisms linked to Cd69.
Cd28 (CD28 antigen)
- Signaling Pathways/Mechanisms: Cd28 is a crucial costimulatory receptor on T cells that binds to B7 family ligands (CD80, CD86) on antigen-presenting cells. It provides the essential "second signal" for full T cell activation, proliferation, survival, and cytokine production (e.g., IL-2). Its high expression in HC and CC indicates functionally competent T cells capable of receiving costimulatory signals necessary for immune responses.
- Therapeutic Potential (IBD): Blocking CD28 costimulation is an established strategy to suppress T cell activation in autoimmune diseases.
- Related Therapeutic Agents: Abatacept (CTLA4-Ig), which blocks CD28 interaction by binding CD80/CD86, is used in autoimmune diseases like rheumatoid arthritis.
Ccr7 (Chemokine (C-C motif) Receptor 7)
- Signaling Pathways/Mechanisms: Ccr7 is a chemokine receptor expressed on naive and central memory T cells, mediating their homing to secondary lymphoid organs via interaction with CCL19 and CCL21. Its high expression in HC reflects normal immune surveillance and T cell recirculation. Its lower expression in AC and CC suggests T cells have migrated out of lymphoid organs into inflamed tissues or are primarily effector/effector memory cells.
- Therapeutic Potential (IBD): While not a direct target for treating inflammation in the gut, modulating Ccr7 could alter lymphocyte trafficking patterns.
- Related Therapeutic Agents: None specifically for IBD.
Atp1b3 (ATPase Na+/K+ Transporting Subunit Beta 3)
- Signaling Pathways/Mechanisms: A beta subunit of the Na+/K+-ATPase, crucial for maintaining cellular ion gradients and membrane potential, which are fundamental for T cell viability and function. Its presence indicates essential physiological activity.
- Therapeutic Potential (IBD): Not a primary therapeutic target.
- Related Therapeutic Agents: None specifically.
Tgfbr2 (Transforming Growth Factor Beta Receptor 2)
- Signaling Pathways/Mechanisms: A receptor for TGF-β, a pleiotropic cytokine with roles in immune regulation (e.g., Treg differentiation, inhibition of effector T cells) and tissue homeostasis/fibrosis. High expression in HC indicates responsiveness to TGF-β, crucial for immune tolerance in the gut.
- Therapeutic Potential (IBD): TGF-β signaling is complex in IBD. Modulating Tgfbr2 directly is challenging due to TGF-β's dual roles. Strategies to enhance Treg function or selectively target pro-fibrotic TGF-β signaling are explored.
- Related Therapeutic Agents: None directly targeting Tgfbr2 for IBD due to its pleiotropic effects.
S1pr1 (Sphingosine-1-Phosphate Receptor 1)
- Signaling Pathways/Mechanisms: S1pr1 is a G protein-coupled receptor vital for lymphocyte egress from lymphoid organs into the circulation by sensing S1P gradients. High expression in HC reflects normal T cell trafficking. Its downregulation in AC and CC is a common mechanism in inflammation, contributing to immune cell accumulation in the colon [GeneCards: S1PR1].
- Therapeutic Potential (IBD): Modulating S1pr1 is a well-established therapeutic strategy to prevent lymphocyte egress from lymphoid organs, thereby reducing circulating lymphocytes and infiltration into inflamed tissues.
- Related Therapeutic Agents: S1P receptor modulators like ozanimod and etrasimod are approved for ulcerative colitis.
Tspan13 (Tetraspanin 13)
- Signaling Pathways/Mechanisms: A member of the tetraspanin family, involved in organizing membrane microdomains and influencing cell adhesion, migration, and signaling by interacting with other membrane proteins. Its specific function in CD4+ T cells and IBD needs further elucidation, but generally tetraspanins modulate T cell activation and trafficking.
- Therapeutic Potential (IBD): Not a direct or established therapeutic target.
- Related Therapeutic Agents: None specifically.
Atp1a1 (ATPase Na+/K+ Transporting Subunit Alpha 1)
- Signaling Pathways/Mechanisms: The catalytic alpha subunit of the Na+/K+-ATPase. Essential for maintaining ion gradients, cell volume, and membrane potential, which are critical for T cell function and viability. Also acts as a signal transducer.
- Therapeutic Potential (IBD): Not a primary therapeutic target.
- Related Therapeutic Agents: None specifically.
Emp3 (Epithelial Membrane Protein 3)
- Signaling Pathways/Mechanisms: A member of the PMP22 family, generally involved in cell proliferation, differentiation, and apoptosis. Its specific role in CD4+ T cells in the colon is not well-characterized but might relate to membrane properties or cell-cell interactions.
- Therapeutic Potential (IBD): Not a direct or established therapeutic target.
- Related Therapeutic Agents: None specifically.
Bsg (Basigin, CD147, EMMPRIN)
- Signaling Pathways/Mechanisms: A widely expressed transmembrane glycoprotein in the immunoglobulin superfamily. It induces matrix metalloproteinases (MMPs) in stromal cells, contributing to ECM remodeling, cell adhesion, and migration. In T cells, it's involved in activation and adhesion. Relevant to tissue damage and remodeling in inflammation [UniProt: CD147].
- Therapeutic Potential (IBD): Could be a potential target if its roles in MMP induction or T cell activation are pathologically elevated.
- Related Therapeutic Agents: No established Bsg-targeting agents for IBD, but MMP inhibitors are explored for chronic inflammatory conditions.
Ifngr2 (Interferon Gamma Receptor 2)
- Signaling Pathways/Mechanisms: A subunit of the IFN-γ receptor (IFNGR), forming a functional receptor with Ifngr1. IFN-γ is a potent pro-inflammatory cytokine driving Th1 responses, crucial for host defense but also central to autoimmune/inflammatory diseases. IFN-γ binding activates JAK/STAT signaling (JAK1/JAK2 and STAT1), inducing IFN-γ-inducible genes. Its expression implies responsiveness to IFN-γ, relevant for both healthy immune surveillance and inflammatory conditions.
- Therapeutic Potential (IBD): IFN-γ is a key cytokine in IBD pathogenesis. Blocking IFN-γ or its receptor could reduce Th1-driven inflammation.
- Related Therapeutic Agents: No direct Ifngr2-targeted therapies for IBD. Therapies targeting upstream cytokines (e.g., IL-12/IL-23 inhibitors like ustekinumab) or downstream JAK inhibitors affect IFN-γ signaling.
Clinical or Translational Implications
The identification of condition-specific surfaceome markers on CD4+ T cells offers significant clinical and translational insights for Inflammatory Bowel Disease.
- Biomarkers of Disease State: The distinct marker profiles for AC, CC, and HC suggest that these surface proteins could serve as valuable biomarkers to differentiate between acute flares, chronic active disease, and remission or healthy states. This could aid in diagnosis, prognostication, and monitoring treatment response.
- Targeting Acute Inflammation: The strong upregulation of Il6st in AC highlights the critical role of IL-6 family cytokine signaling in acute exacerbations. This reinforces the rationale for using therapies that block the JAK/STAT pathway, which is downstream of Il6st, during acute inflammatory phases.
- Targeting Chronic Inflammation: The robust expression of costimulatory molecules like Icos, Tnfrsf9 (4-1BB), Itgav, and Tnfrsf4 (OX40) in CC points to sustained T cell activation and tissue-retaining mechanisms as central to chronic colitis. These pathways represent highly relevant therapeutic targets for developing novel drugs that dampen chronic T cell responses, similar to existing biologics that target other immune cell interactions or trafficking (e.g., vedolizumab for integrins).
- Understanding T Cell Homeostasis: Markers like Ccr7 and S1pr1, predominantly expressed in HC, are crucial for normal T cell trafficking and immune surveillance. Their downregulation in colitis conditions underscores mechanisms of lymphocyte accumulation in inflamed tissues, reinforcing the clinical utility of S1P receptor modulators in IBD.
- Precision Medicine: Characterizing these surfaceome markers at single-cell resolution enables a more precise understanding of specific T cell subsets and their contributions to different disease stages. This knowledge can guide the development of more targeted therapies with improved efficacy and reduced off-target effects.
In summary, this analysis identifies specific surface proteins that differentiate CD4+ T cell responses in acute and chronic colitis, providing a basis for developing new diagnostic tools and therapeutic strategies for IBD.
15. Gene Ontology Enrichment in Macrophages across Colitis Conditions
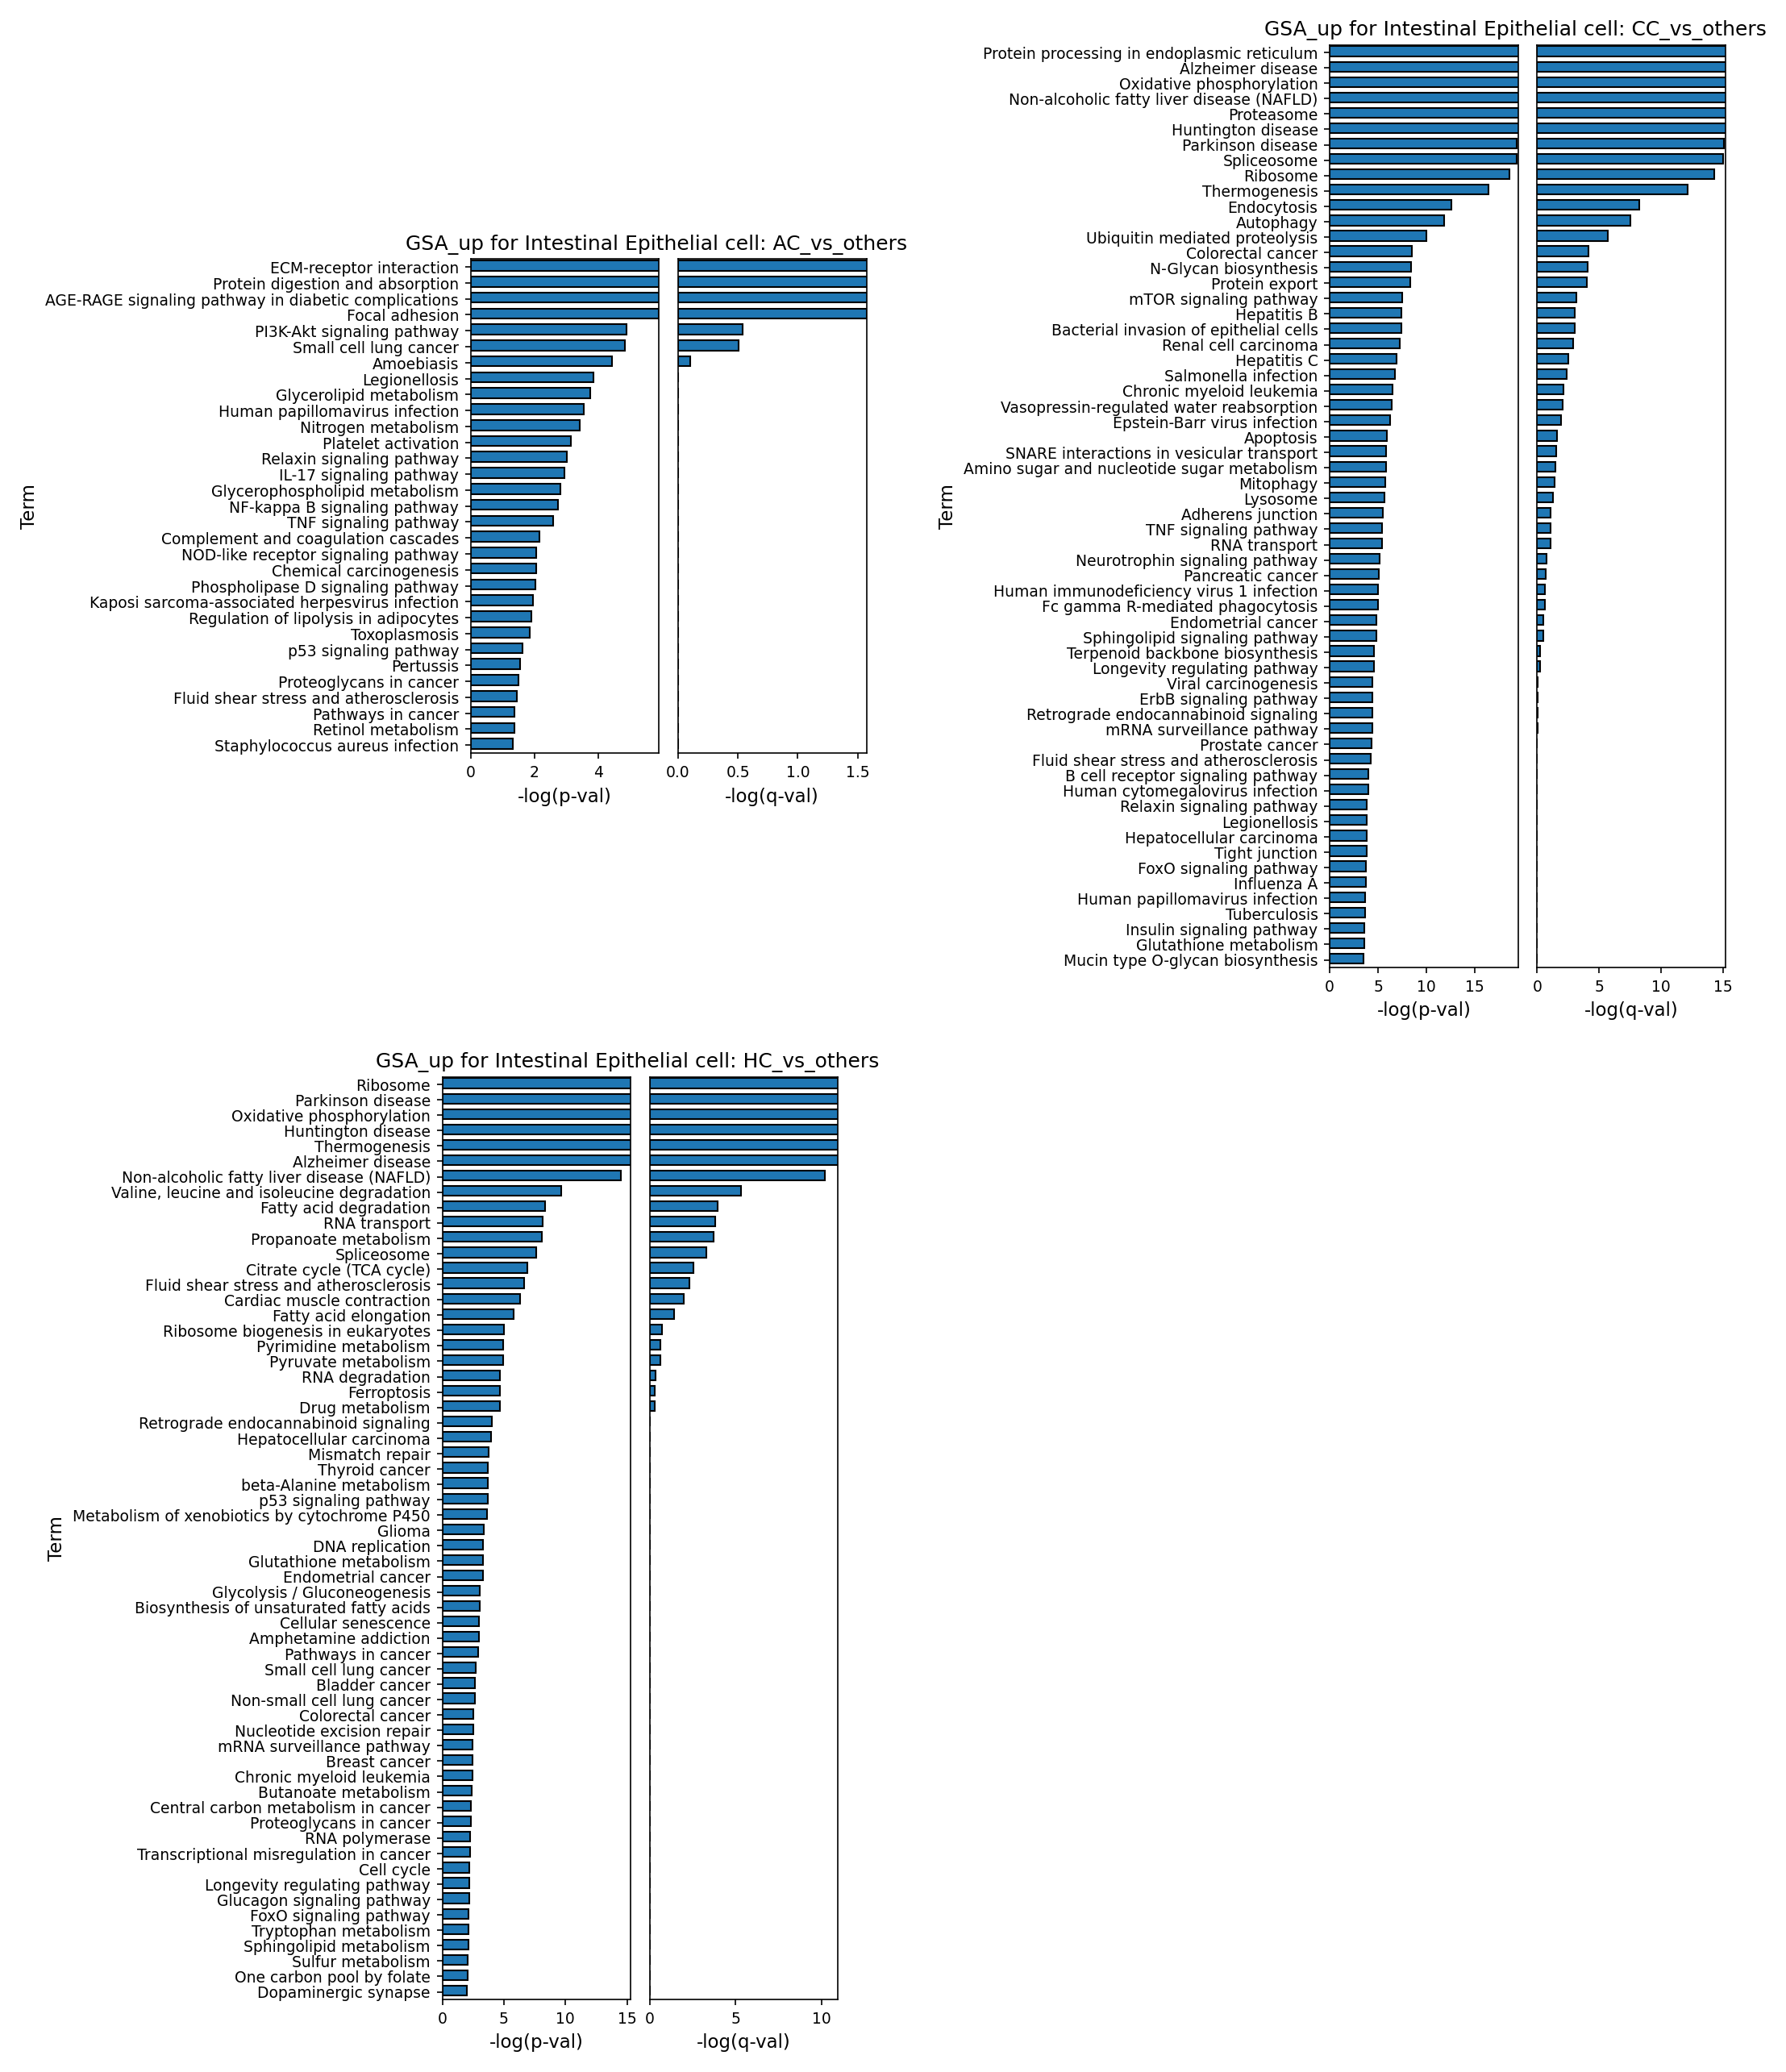
[Analysis Visualization Results]...
Analysis Overview
This analysis presents Gene Ontology (GO) enrichment results (GSA_up) for Macrophages, comparing each condition (Acute Colitis (AC), Chronic Colitis (CC), and Healthy Control (HC)) against the combined "other" conditions. The goal is to identify biological pathways and processes that are significantly upregulated in Macrophages in each specific condition, providing insights into their functional state during different phases of colitis. The results are visualized as bar plots, displaying the top enriched terms ranked by their -log(p-value) and corresponding -log(q-value).
Visual Summary
The bar plots display the top 60 Gene Ontology terms significantly enriched (upregulated) in Macrophages for AC, CC, and HC conditions, each compared against the remaining conditions. The x-axis represents the -log(p-value) and -log(q-value), indicating the statistical significance of the enrichment.
- AC_vs_others: This plot shows a strong and broad enrichment of terms related to inflammatory signaling, immune responses, and pathogen recognition. Many terms have high -log(p-value) and -log(q-value), indicating robust statistical significance.
- CC_vs_others: This plot also displays many significantly enriched terms, but with a noticeable shift compared to AC. While some inflammatory terms persist, there's a stronger emphasis on cellular metabolic processes, protein handling, and various cell death pathways. The significance levels (-log(q-value)) remain high for many top terms.
- HC_vs_others: In contrast to the colitis conditions, the HC plot shows a considerably weaker and less specific enrichment profile. While "Ribosome" shows a very high -log(p-value), the corresponding -log(q-value) for many terms is much lower, or even negligible for most terms not shown. This suggests that fewer pathways are distinctly upregulated in healthy macrophages compared to the combined disease states, or that their upregulation is less pronounced.
Biological Interpretation
The Gene Ontology analysis highlights distinct functional states of Macrophages during acute colitis, chronic colitis, and homeostatic conditions in the colon.
Macrophage Activation in Acute Colitis (AC vs. others)
Macrophages in acute colitis exhibit a strong pro-inflammatory and immune-activated phenotype. Key enriched pathways include:
- Inflammatory Signaling: TNF signaling pathway and NF-kappa B signaling pathway are central to acute inflammatory responses, driving the expression of pro-inflammatory cytokines and chemokines [PubMed Search].
- Innate Immunity: Pathways like C-type lectin receptor signaling pathway and Toll-like receptor signaling pathway underscore robust innate immune activation, crucial for pathogen recognition and initiating immune cascades.
- Cytokine Signaling: IL-17 signaling pathway points to interactions with T helper 17 (Th17) cells, mediating inflammatory responses often associated with host defense and autoimmunity.
- Cell Death: Apoptosis is also enriched, which can be involved in removing damaged cells or regulating immune responses during acute inflammation.
- Pathogen Response: Multiple terms related to viral (e.g., Measles, Epstein-Barr virus infection, Influenza A) and bacterial infections (e.g., Tuberculosis, Salmonella infection) are enriched, suggesting a generalized macrophage response to perceived microbial threats, which is common in gut inflammation.
This profile is highly consistent with the initial, aggressive immune response characteristic of acute inflammatory bowel disease.
Macrophage Reprogramming in Chronic Colitis (CC vs. others)
Macrophages in chronic colitis display a shift towards sustained cellular activity, metabolic reprogramming, and mechanisms involved in tissue remodeling and chronic inflammation. Notable pathways include:
- Metabolic and Cellular Processes: Highly enriched terms like Ribosome, Spliceosome, Oxidative phosphorylation, Proteasome, and Protein processing in endoplasmic reticulum suggest increased protein synthesis, energy production, and cellular maintenance to cope with prolonged stress and maintain an activated state.
- Cellular Stress and Turnover: Autophagy, Necroptosis, and Ferroptosis indicate active cellular recycling and specific forms of regulated cell death, all implicated in the sustained tissue damage and immune dysregulation of chronic inflammation [PubMed Search].
- Immune Effector Functions: Fc gamma R-mediated phagocytosis and Leukocyte transendothelial migration highlight ongoing effector functions of macrophages, including immune complex processing and sustained immune cell infiltration into inflamed tissues.
- Hypoxia Response: HIF-1 signaling pathway is often upregulated in hypoxic environments, which are common in chronically inflamed tissues [PubMed Search].
This profile reflects macrophages adapted to a persistent inflammatory environment, characterized by metabolic shifts and involvement in tissue pathology and repair, which is typical for chronic IBD.
Macrophage Homeostasis in Healthy Controls (HC vs. others)
Macrophages from healthy controls show a distinct and generally weaker pattern of pathway enrichment when compared to the combined disease states.
- Baseline Cellular Activity: The highest enrichment is for Ribosome, indicating active protein synthesis, likely reflecting the baseline cellular maintenance and homeostatic functions of resident macrophages.
- General Stress/Signaling: Pathways like MAPK signaling pathway and FOXO signaling pathway appear, which are general cellular regulators involved in stress responses, cell survival, and metabolism, potentially representing their role in maintaining gut homeostasis.
- Less Specific Inflammation: While some inflammatory-related terms (e.g., IL-17 signaling pathway, NOD-like receptor signaling pathway) appear, their statistical significance (low -log(q-value)) is considerably lower than in AC or CC. This suggests that specific inflammatory pathways are not a dominant feature of healthy macrophage function or are active at a much lower, regulatory level.
- Unexpected Term: The enrichment of "Fluid shear stress and atherosclerosis" is less directly interpretable for colon macrophages, though it could potentially relate to general mechanosensing pathways or be an artifact given its relatively low significance compared to other conditions.
The overall low significance for most terms in HC compared to disease conditions suggests that the healthy state is characterized by the absence of widespread, strongly upregulated inflammatory pathways that define colitis, emphasizing a more quiescent or homeostatic role for macrophages.
Clinical or Translational Implications
The differential Gene Ontology enrichment in Macrophages across acute, chronic, and healthy states provides critical insights into the pathogenesis and progression of Colitis (Inflammatory Bowel Disease).
- Stage-Specific Therapies: The distinct inflammatory and metabolic profiles of macrophages in acute vs. chronic colitis suggest that therapeutic interventions could be tailored to the disease stage. For instance, in acute flares, therapies targeting early inflammatory pathways like TNF-NFkB may be most effective. In chronic disease, targeting metabolic reprogramming, autophagy, or specific cell death pathways (e.g., ferroptosis or necroptosis) in macrophages could mitigate ongoing tissue damage and inflammation.
- Biomarker Discovery: The identified pathways and the genes within them could serve as potential biomarkers for distinguishing between acute and chronic colitis, assessing disease activity, or predicting response to therapy.
- Understanding Disease Mechanisms: The shift from acute, antigen-driven inflammation to chronic, metabolically reprogrammed, and tissue-remodeling states of macrophages highlights their dynamic role in IBD. This deepens our understanding of how macrophage function contributes to the persistence of inflammation and tissue pathology.
16. Gene Set Enrichment Analysis Across Colitis Conditions and Cell Types
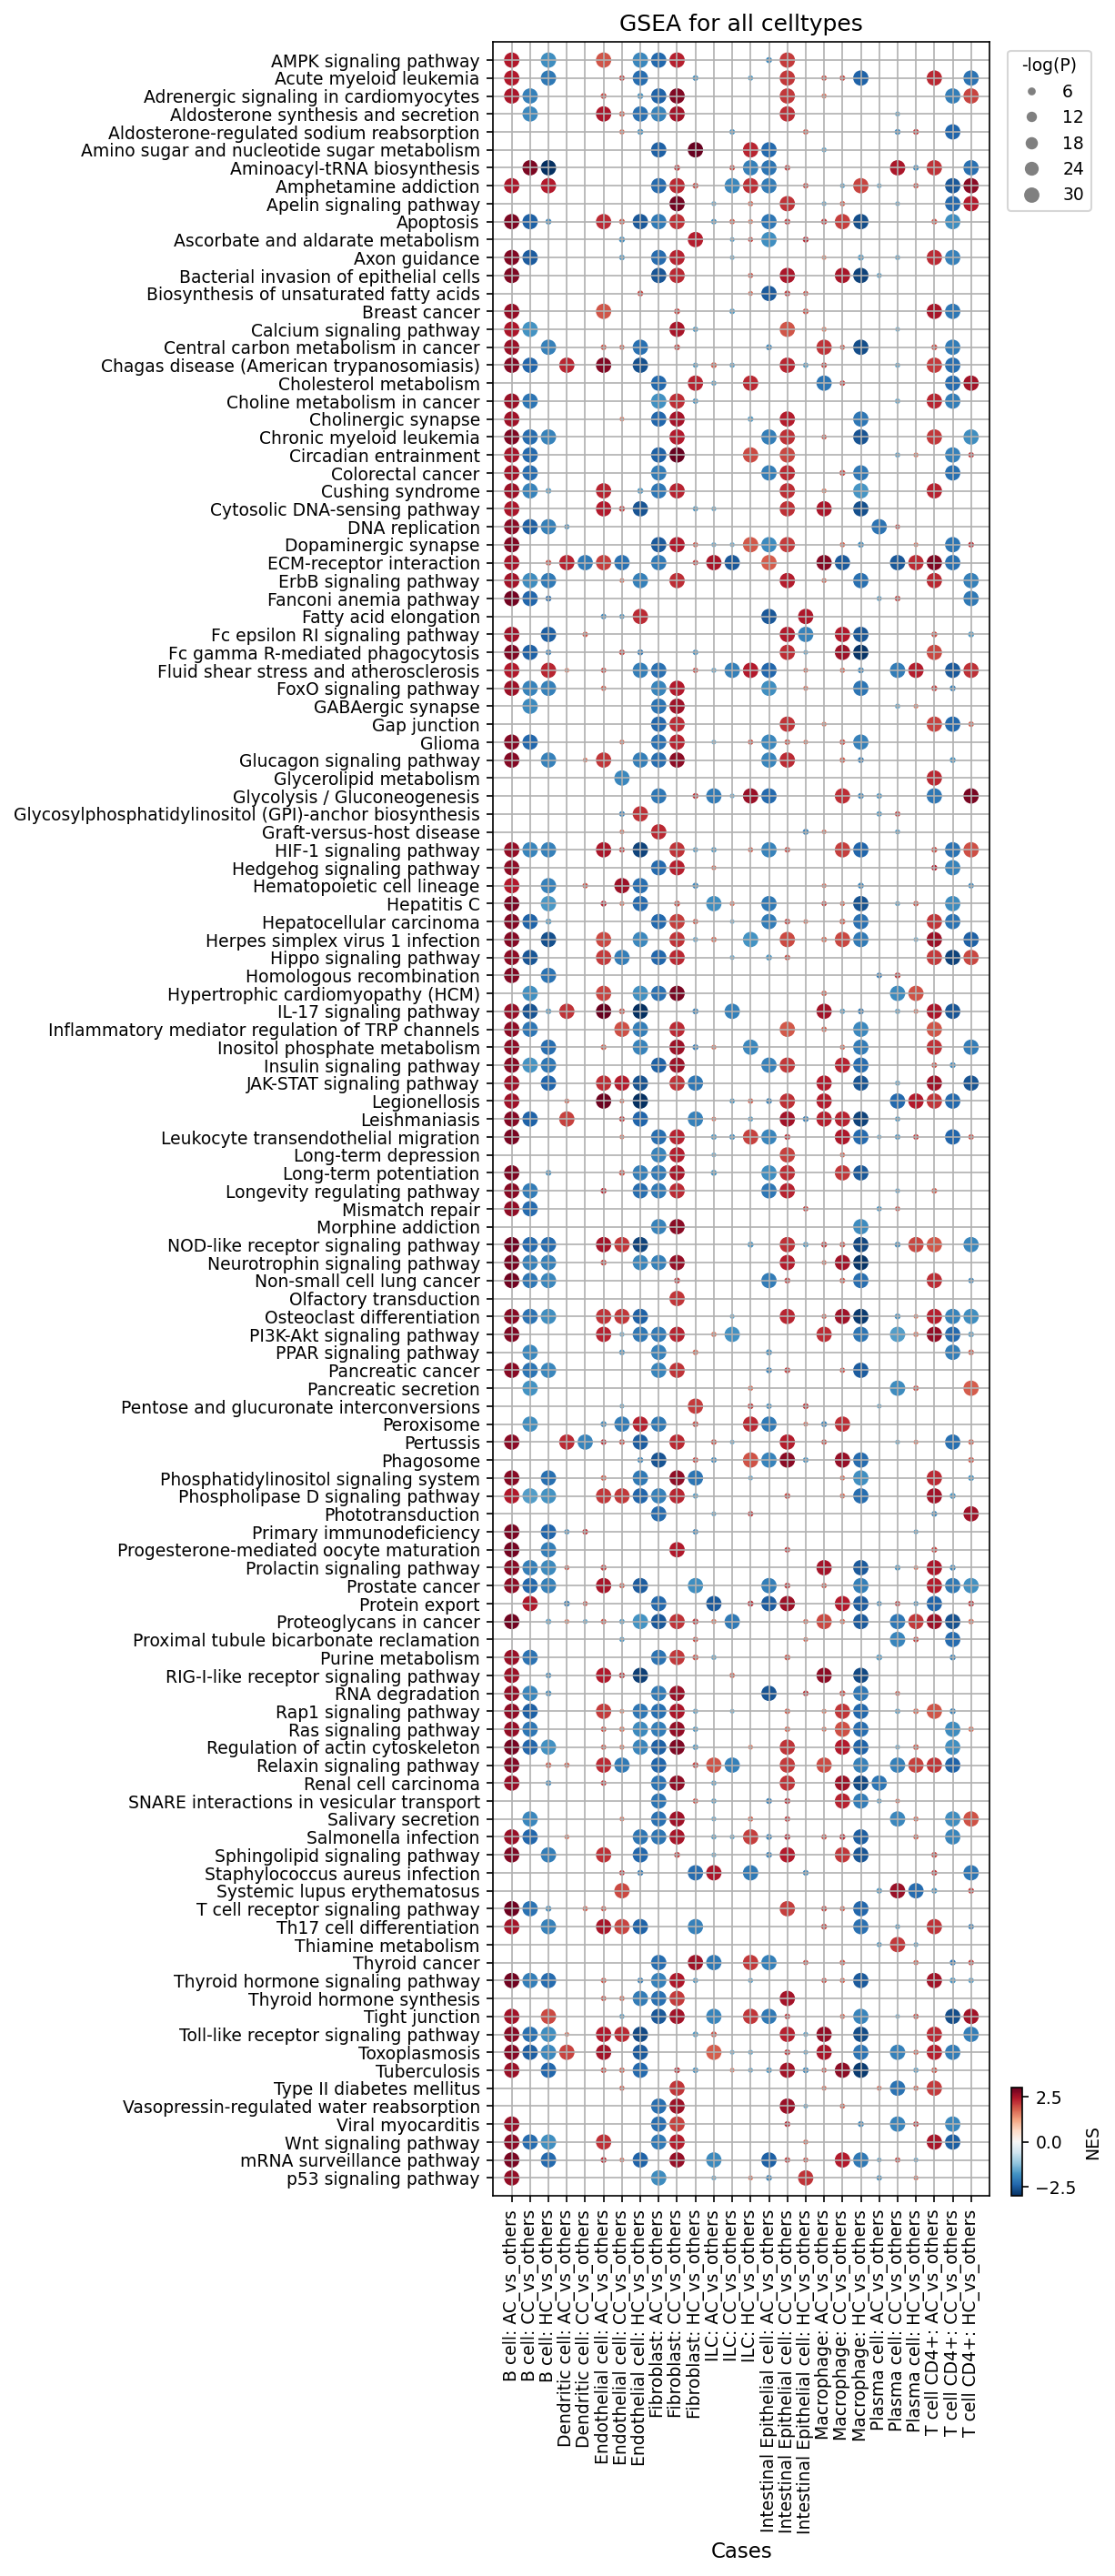
[Analysis Visualization Results]...
Analysis Overview
This analysis presents Gene Set Enrichment Analysis (GSEA) results as a dot plot, illustrating the enrichment or depletion of various Kyoto Encyclopedia of Genes and Genomes (KEGG) pathways across different cell types and experimental conditions. The dataset comprises single-cell RNA-seq data from mouse Colon tissue under three conditions: Acute Colitis (AC), Chronic Colitis (CC), and Healthy Control (HC). Each column represents a specific cell type and condition, with the condition compared against "all others" (e.g., AC_vs_others compares Acute Colitis against Chronic Colitis and Healthy Control combined). The size of each dot indicates the statistical significance (-log(p-val)), while the color reflects the Normalized Enrichment Score (NES), with red indicating pathway upregulation (positive NES) and blue indicating pathway downregulation (negative NES).
Visual Summary
The dot plot reveals a landscape of dynamic pathway activity changes across different cell types in the context of colitis.
- Widespread Inflammatory Signaling: A prominent pattern is the consistent upregulation (red dots, often large indicating high significance) of key inflammatory and immune-related pathways in myeloid cells (Macrophages, Dendritic cells), T cells (T cell CD4+), and Innate Lymphoid Cells (ILCs) under both AC_vs_others and CC_vs_others conditions. These pathways include "Toll-like receptor signaling pathway," "IL-17 signaling pathway," "NOD-like receptor signaling pathway," "JAK-STAT signaling pathway," and "Leukocyte transendothelial migration."
- Metabolic Reprogramming: Several metabolic pathways, such as "Glycolysis / Gluconeogenesis," exhibit upregulation (red) in immune cells (Macrophages, T cells, ILCs, Dendritic cells) during AC and CC conditions, suggesting active metabolic shifts associated with immune cell activation. Conversely, pathways like "AMPK signaling pathway" often show downregulation (blue) in these same cell types in AC/CC.
- Tissue Damage and Remodeling: "Apoptosis" and "p53 signaling pathway" are notably upregulated in Intestinal Epithelial cells and Fibroblasts during both AC_vs_others and CC_vs_others, indicating cell stress and death within these structural cell types. "ECM-receptor interaction" and "Focal adhesion" pathways are enriched (red) in Fibroblasts and Endothelial cells in AC/CC, pointing towards active extracellular matrix remodeling and tissue repair/fibrosis processes.
- Bacterial Response: "Bacterial invasion of epithelial cells" is consistently upregulated (red) in Intestinal Epithelial cells, Macrophages, Dendritic cells, and Fibroblasts in both AC_vs_others and CC_vs_others, suggesting an ongoing host response to microbial presence or dysbiosis.
- Healthy State Signatures: In contrast to AC and CC, the HC_vs_others columns often show either depletion (blue) or no significant enrichment for many of the inflammatory pathways. Interestingly, pathways like "PPAR signaling pathway" and "Thiamine metabolism" show enrichment (red) in Intestinal Epithelial cells and Fibroblasts in HC_vs_others, potentially representing homeostatic functions or pathways involved in maintaining a healthy colon environment.
Biological Interpretation
The observed GSEA patterns strongly align with the inferred biological context of Inflammatory Bowel Disease (Colitis) in the colon.
- Immune Cell Activation: The robust upregulation of "Toll-like receptor signaling," "NOD-like receptor signaling," and "IL-17 signaling" pathways in myeloid cells, T cells, and ILCs in both acute and chronic colitis conditions is a hallmark of immune activation and chronic inflammation in the gut PubMed search: Toll-like receptor signaling IBD, PubMed search: IL-17 signaling IBD. This indicates an active immune response, likely driven by pathogen-associated molecular patterns (PAMPs) and danger-associated molecular patterns (DAMPs) released during inflammation and tissue damage. The enrichment of "Leukocyte transendothelial migration" further supports the ongoing recruitment of immune cells to the inflammatory site.
- Metabolic Reprogramming in Inflammation: The shift towards "Glycolysis / Gluconeogenesis" in activated immune cells during colitis is consistent with metabolic reprogramming, where immune cells (e.g., macrophages, T cells) adapt their metabolism to support proliferation and effector functions in inflammatory environments PubMed search: metabolic reprogramming immune cells inflammation. The downregulation of "AMPK signaling" in these cells might reflect a shift away from energy conservation towards biosynthesis.
- Epithelial Barrier Dysfunction and Tissue Remodeling: The activation of "Apoptosis" and "p53 signaling" in Intestinal Epithelial cells in AC and CC conditions suggests increased epithelial cell turnover and damage, which is characteristic of IBD-related barrier dysfunction PubMed search: apoptosis intestinal epithelium IBD. Concurrently, the enrichment of "ECM-receptor interaction" and "Focal adhesion" in Fibroblasts indicates active tissue remodeling, which can lead to fibrosis, a common complication in chronic colitis PubMed search: ECM remodeling IBD fibrosis.
- Host-Microbe Interactions: The consistent upregulation of the "Bacterial invasion of epithelial cells" pathway highlights the critical role of the gut microbiota and host-microbe interactions in colitis pathogenesis. This may reflect either direct bacterial invasion or an exaggerated immune response to commensal bacteria in a compromised epithelial barrier.
- Healthy Homeostasis: The enrichment of "PPAR signaling pathway" in healthy Intestinal Epithelial cells is notable, as PPARs (Peroxisome Proliferator-Activated Receptors) are known to play roles in lipid metabolism and have anti-inflammatory properties, suggesting their importance in maintaining gut homeostasis PubMed search: PPAR signaling colon health. Their relative depletion or absence in colitis conditions could imply a disruption of these protective mechanisms.
Clinical or Translational Implications
The comprehensive GSEA results provide valuable insights into potential therapeutic targets and biomarkers for Inflammatory Bowel Disease.
- Targeting Immune Pathways: The strong and consistent activation of pathways like TLR, NOD-like, IL-17, and JAK-STAT signaling across multiple immune cell types in both acute and chronic colitis suggests these pathways as prime candidates for therapeutic intervention. Drugs modulating these pathways (e.g., JAK inhibitors) are already used or under investigation for IBD.
- Restoring Epithelial Integrity: The signs of epithelial apoptosis and p53 activation underscore the importance of strategies aimed at enhancing epithelial barrier function and promoting cell survival/repair.
- Modulating Fibrosis: Pathways related to ECM remodeling in fibroblasts indicate potential targets to prevent or mitigate fibrosis in chronic colitis.
- Metabolic Reprogramming as a Therapeutic Angle: Understanding the specific metabolic shifts in immune cells during colitis could lead to novel immunometabolic therapeutic approaches, for instance, by targeting specific enzymes in glycolysis or fatty acid synthesis pathways to dampen inflammatory responses.
- Probiotics and Microbiota Modulation: The enrichment of bacterial invasion pathways reinforces the importance of managing gut dysbiosis and exploring microbiota-modulating therapies.
- Biomarker Discovery: Pathways that show distinct enrichment patterns in HC_vs_others versus AC/CC_vs_others, such as "PPAR signaling," could serve as potential biomarkers for disease activity or response to treatment, helping to distinguish healthy states from inflammatory ones.
17. Discussion
The comprehensive single-cell analysis reveals a profound reprogramming of the colon's cellular landscape in Inflammatory Bowel Disease (Colitis), moving from a homeostatic healthy state (HC) to highly activated acute (AC) and chronic (CC) inflammatory milieus. This reprogramming involves dynamic shifts in cell type composition, distinct activation states of immune and stromal cells, and altered communication networks that collectively drive disease pathology.
Immune Cell Dynamics and Activation: The immune compartment undergoes dramatic changes. Naive T cells consistently decrease in both acute and chronic colitis, indicating widespread activation and differentiation. Acute colitis is characterized by an increase in Th22 cells, suggesting an early, potentially protective or repair-oriented response, along with a general expansion of Innate Lymphoid Cells (ILCs). As inflammation progresses to the chronic phase, there is a significant shift towards pro-inflammatory Th17 and ILC3(-) cells, alongside an unexpected increase in regulatory T cells (Treg). The presence of elevated Tregs in a chronically inflamed setting may suggest a compensatory but ultimately overwhelmed or dysfunctional suppressive mechanism, a common phenomenon in chronic inflammatory diseases. A striking feature of chronic colitis is the dramatic expansion of B cell populations, often becoming the predominant cell type, which strongly implicates a significant humoral immune component and potentially the formation of tertiary lymphoid structures in sustaining chronic inflammation. Macrophages also exhibit a clear pro-inflammatory shift, with a sustained increase in M1 macrophage proportions in both acute and chronic colitis, consistent with their role in driving inflammation. However, the dynamics within M2 subsets are more nuanced; M2B macrophages initially increase in acute colitis but then decrease in the chronic phase, while M2D macrophages are reduced in both colitis conditions, suggesting an impaired capacity for immune regulation and resolution in established disease.
Epithelial Barrier Dysfunction and Stromal Remodeling: Intestinal Epithelial Cells (IECs) suffer progressive loss and damage from healthy to acute to chronic colitis, reflecting compromised barrier integrity. In the healthy state, IECs are characterized by markers of nutrient absorption (e.g., SLC5A8, SLC16A1) and stem cell homeostasis (LRIG1). In contrast, inflamed IECs in colitis upregulate mucin family members (e.g., MUC4), chemokines (CXCL16), adhesion molecules (CD44, ITGAV), growth factor receptors (EGFR, MET), and pro-inflammatory cytokine receptors (TNFRSF1A). This signature indicates active immune cell recruitment, dysregulated epithelial proliferation and repair, and increased sensitivity to inflammatory mediators, all contributing to ongoing barrier dysfunction. Fibroblasts, the key stromal cells, transition from a quiescent, homeostatic phenotype (marked by CD34, PTGFRN, PIK3IP1) to an activated state. Acute colitis fibroblasts show early inflammatory responses with increased IL1R1, EREG, PDGFRB, AOC3, and OSMR, suggesting heightened sensitivity to cytokines and engagement in early tissue repair. Chronic colitis fibroblasts, however, display a profound pro-fibrotic and pro-inflammatory phenotype, characterized by robust upregulation of extracellular matrix (ECM) components (SPP1, Collagens, FN1), adhesion molecules (Integrins, MCAM), and signaling molecules (Notch1, SDC1). This extensive reprogramming underlies their central role in mediating fibrosis, a major complication of chronic IBD.
Dysregulated Cell-Cell Communication and Pathway Activation: Cell-cell interaction analysis highlights extensive communication changes in colitis. Inflammatory (e.g., SPP1-CD44/integrin, CXCL12-CXCR4, ICAM1-integrin) and tissue remodeling (integrin-collagen/fibronectin, DLL4-NOTCH1) interactions are highly upregulated in both acute and chronic colitis, particularly involving macrophages, T cells, endothelial cells, and fibroblasts. The MAdCAM1-α4β7 integrin axis, critical for T cell gut-homing, is markedly active in colitis, a known pathogenic pathway in IBD. Gene Set Enrichment Analysis (GSEA) reinforces these observations, showing widespread activation of core inflammatory pathways (e.g., Toll-like receptor, IL-17, NOD-like receptor, JAK-STAT signaling) across multiple immune cell types in colitis. Concomitantly, immune cells undergo metabolic reprogramming (e.g., upregulation of glycolysis). In structural cells, epithelial apoptosis and fibroblast-driven ECM remodeling pathways are prominently activated, coupled with persistent host responses to microbial presence (Bacterial invasion of epithelial cells pathway). In contrast, healthy controls show enrichment of homeostatic pathways such as PPAR signaling, which are disrupted in colitis.
In summary, acute colitis exhibits an initial, rapid immune and tissue repair response that, in chronic colitis, transitions into a sustained inflammatory state characterized by B cell dominance, persistent pro-inflammatory macrophage and T cell responses, extensive fibroblast-mediated fibrosis, and profound epithelial dysfunction. These stage-specific molecular and cellular signatures offer critical insights into disease progression and identify multiple points of therapeutic intervention.
Hypotheses:
- The shift from Th22-dominant responses in acute colitis to Th17/ILC3(-)/Treg-dominant responses in chronic colitis dictates the differential clinical course and responsiveness to anti-inflammatory therapies.
- The dramatic B cell expansion and altered B cell interactions in chronic colitis contributes to disease pathogenesis through specific mechanisms such as autoantibody production or cytokine secretion, driving sustained inflammation and supporting tertiary lymphoid structures.
- A sustained increase in pro-inflammatory M1 macrophages, coupled with a decrease in regulatory M2B/M2D macrophages in chronic colitis, creates an environment conducive to chronic tissue damage and impaired resolution.
- Dysregulation of epithelial stem cell maintenance (e.g., loss of LRIG1 expression) and nutrient transport (e.g., SLC5A8) contributes to compromised barrier function and impaired repair in colitis.
- Fibroblast activation in chronic colitis, marked by increased expression of SPP1, collagens, fibronectin, and specific integrins, directly drives intestinal fibrosis, a major complication of IBD.
Potential therapeutic targets:
- IL-6 Signal Transducer (Il6st) / JAK/STAT pathway: Upregulated in CD4+ T cells in acute colitis, driving Th17 differentiation and T cell survival, key to acute inflammatory responses. Evidence: High Il6st expression on CD4+ T cells in AC, strong enrichment of JAK-STAT signaling in GSEA for immune cells in colitis, and a known role in Th17 differentiation. JAK inhibitors (tofacitinib, upadacitinib, filgotinib) are established IBD therapies. Validation: Test JAK inhibitors or IL-6/IL-6R antibodies in acute colitis models to confirm reduction in T cell activation and inflammation.
- MAdCAM1-α4β7 Integrin Axis: Crucial for T cell homing and extravasation into inflamed intestinal tissue, highly active in both acute and chronic colitis, a central pathogenic pathway in IBD. Evidence: Prominent MAdCAM1-integrin_a4b7_complex interactions in condition-specific CCI analysis involving Endothelial and T cells. This is a clinically validated therapeutic target in IBD (Vedolizumab). Validation: Further validate with flow cytometry/immunohistochemistry on patient samples. Assess efficacy of α4β7 integrin antagonists in mouse models of colitis to confirm reduction in T cell infiltration.
- ICOS-ICOSL Pathway: ICOS is a costimulatory receptor highly expressed on activated CD4+ T cells in chronic colitis, promoting T cell proliferation and cytokine production, critical for sustained chronic inflammation. Evidence: High Icos expression on CD4+ T cells in CC. Identified as a key pathway in chronic T cell activation and humoral immunity. Validation: Evaluate ICOS/ICOSL blocking antibodies in chronic colitis models to assess reduction in T cell proliferation, cytokine production, and disease severity.
- OX40-OX40L Pathway: OX40 (Tnfrsf4) is a costimulatory receptor highly expressed on activated CD4+ T cells in chronic colitis, enhancing T cell survival and effector functions, crucial for maintaining chronic immune responses. Evidence: High Tnfrsf4 expression on CD4+ T cells in CC. Known role in sustaining chronic immune responses and breaking T cell tolerance. Validation: Test OX40/OX40L blocking antibodies in chronic colitis models to assess reduction in pathogenic CD4+ T cell survival and activity.
- CXCR4-CXCL12 Axis: CXCR4 is highly expressed on macrophages in chronic colitis, mediating their recruitment, homing, and retention in inflamed tissue, thereby contributing to ongoing inflammation and tissue remodeling. Evidence: High Cxcr4 expression on macrophages in CC. Identified role in immune cell trafficking and chronic inflammation. (PubMed: CXCR4 and IBD) Validation: Use CXCR4 antagonists (e.g., Plerixafor) in chronic colitis models to evaluate reduced macrophage infiltration and inflammation.
- CCR2-CCL2 Axis: CCR2 is a critical mediator of inflammatory monocyte/macrophage recruitment from the bloodstream into chronically inflamed tissues, fueling chronic inflammation and tissue damage. Evidence: High Ccr2 expression on macrophages in CC. Known role in monocyte/macrophage recruitment and chronic inflammation. (GeneCards: CCR2) Validation: Test CCR2 antagonists in chronic colitis models to limit macrophage accumulation and assess impact on disease severity.
- SPP1 (Osteopontin) / CD44-Integrin Axis: SPP1 is a major matricellular protein and cytokine strongly upregulated in fibroblasts (and macrophages) in chronic colitis, promoting immune cell adhesion, survival, and driving ECM deposition and fibrosis. Evidence: High Spp1 expression on fibroblasts in CC (and in macrophage-fibroblast interactions from CCI analysis). Identified role in chronic inflammation and fibrotic processes. (PubMed on SPP1 in IBD) Validation: Use SPP1 neutralizing antibodies or CD44/integrin antagonists in chronic colitis models to reduce inflammation and fibrosis.
- IL1R1 (Interleukin 1 Receptor Type 1): Strongly upregulated in acute colitis fibroblasts, making these cells highly responsive to pro-inflammatory cytokines IL-1α/β, which drives local acute inflammation. Evidence: High Il1r1 expression on fibroblasts in AC. Known as the primary receptor for pro-inflammatory IL-1α/β. (UniProt: P14779 (IL1R1_MOUSE)) Validation: Test IL-1 antagonists (e.g., anakinra, canakinumab) or IL1R1 blocking agents in acute colitis models to reduce early inflammatory responses.
- MMP14 (Matrix Metalloproteinase 14): Upregulated in macrophages in chronic colitis, actively degrading extracellular matrix components and involved in tissue remodeling, contributing to tissue damage and fibrosis. Evidence: High Mmp14 expression on macrophages in CC. Known role in ECM degradation, tissue remodeling, and cell migration. (GeneCards: MMP14) Validation: Investigate specific MMP14 inhibitors in chronic colitis models to mitigate tissue damage and fibrotic complications.
Follow-up validation ideas:
- Flow Cytometry/Immunohistochemistry: Validate changes in T cell (Th17, Th22, Treg, T_Cyto) and macrophage (M1, M2B, M2D) subset proportions and surface marker expression (e.g., CD34, IL1R1, SPP1 on fibroblasts; ICOS, OX40, S1PR1 on CD4+ T cells; CXCR4, CCR2, TLR2 on macrophages; LRIG1, TNFRSF1A on IECs) in human IBD patient biopsies across disease stages.
- Spatial Transcriptomics/Proteomics: Map the spatial distribution and interactions of key immune and stromal cell populations (e.g., MAdCAM1-α4β7, ICAM1-integrin, SPP1-CD44 interactions) in inflamed vs. healthy colon tissue to confirm cell-cell communication patterns.
- In vitro/Ex vivo Co-culture Models: Establish co-culture systems involving IECs, fibroblasts, macrophages, and T cells from IBD patients or mouse models to functionally validate predicted cell-cell interactions and the impact of specific markers (e.g., MAdCAM1, SPP1, IL1R1) on inflammatory responses, fibrosis, or epithelial barrier function.
- Perturbation Assays (in vivo/in vitro): Use genetic (CRISPR/shRNA) or pharmacological interventions (e.g., small molecule inhibitors, neutralizing antibodies) to target specific candidate genes (e.g., SPP1, IL1R1, CXCR4, CCR2, OX40, S1PR1, EGFR, MET, MMP14) in colitis models to assess their impact on inflammation, immune cell infiltration, epithelial repair, and fibrosis.
- Organoid Models: Utilize colon organoids derived from healthy or IBD patients to assess the impact of inflammatory cytokines on IEC marker expression (e.g., SLC5A8, LRIG1, MUC4, TNFRSF1A) and barrier function.
Limitations:
This study is based on a mouse model, and further validation in human IBD cohorts is essential to confirm the translatability of these findings. The single-cell RNA sequencing data provides correlative insights into cellular changes and gene expression; direct functional assays are needed to establish causality for observed population shifts, gene expression changes, and cell-cell interactions. While robust, the interpretation of condition abbreviations (AC, CC) as acute and chronic colitis is an inference based on contextual evidence. The tissue dissociation process inherent to single-cell analysis may introduce stress-induced artifacts or alter certain cell-cell interactions. Finally, the focus on surfaceome markers, while valuable, may overlook crucial intracellular signaling or metabolic changes.
18. Query List
- Show and save UMAPs for condition, sample, major cell type, minor cell type, and celltype_subset in two columns.
- Show major cell type scores on UMAP and save the result.
- Show and save a marker expression dot plot for celltype_subset. SET target_cell = None and var_group_rotation = 45. Leave all other arguments at their default values.
- Show and save a population bar plot of minor cell types.
- Show and save a population bar plot of T cell subsets.
- Show and save box plots of T cell subset populations with statistically significant differences between conditions, if any. Choose ncols based on the total number of panels.
- Show and save a population bar plot of macrophage subsets.
- Show and save box plots of macrophage subset populations with statistically significant differences between conditions, if any. Choose ncols based on the total number of panels.
- Show and save cell-cell interaction patterns. Select at most 80 cell-cell interactions per group.
- Find cell-cell interactions involving major immune and stromal cells that differ significantly between conditions, show them as a dot plot, and save the result. Set max_n_items_per_group to 60. For each interaction identified under each condition, using the provided dataset context, describe the associated signaling pathways and mechanisms and, where relevant, its potential as a therapeutic target and related therapeutic agents.
- Show marker expressions for Intestinal Epithelial cell in a dot plot, and save the result. Use only surfaceome markers, with at most 50 markers per condition. For each marker identified under each condition, using the provided dataset context, describe the associated signaling pathways and biological mechanisms within the tissue and, where relevant, its potential as a therapeutic target for Inflammatory Bowel Disease (Colitis) and related therapeutic agents.
- Show marker expressions for Macrophage in a dot plot, and save the result. Use only surfaceome markers, with at most 40 markers per condition. For each marker identified under each condition, using the provided dataset context, describe the associated signaling pathways and biological mechanisms within the tissue and, where relevant, its potential as a therapeutic target for Inflammatory Bowel Disease (Colitis) and related therapeutic agents.
- Show marker expressions for Fibroblast in a dot plot, and save the result. Use only surfaceome markers, with at most 40 markers per condition. For each marker identified under each condition, using the provided dataset context, describe the associated signaling pathways and biological mechanisms within the tissue and, where relevant, its potential as a therapeutic target for Inflammatory Bowel Disease (Colitis) and related therapeutic agents.
- Show marker expressions for T cell CD4+ in a dot plot, and save the result. Use only surfaceome markers, with at most 40 markers per condition. For each marker identified under each condition, using the provided dataset context, describe the associated signaling pathways and biological mechanisms within the tissue and, where relevant, its potential as a therapeutic target for Inflammatory Bowel Disease (Colitis) and related therapeutic agents.
- Show Gene Ontology (GSA) analysis results for Macrophage as a bar plot, and save the result.
- Show Gene Set Enrichment Analysis results as a dot plot, and save it. Set the color map to RdBu_r, n_pws_to_show to 120, and target_cells to None.