Single-Cell Atlas Reveals Cellular and Molecular Mechanisms of Inflammatory Bowel Disease in the Human Colon
This report presents a comprehensive single-cell analysis of human colon tissue, characterizing cellular heterogeneity and condition-specific responses in Inflammatory Bowel Disease (IBD). Key findings include significant shifts in immune cell populations, particularly the infiltration of activated T cells, B cells, plasma cells, and M1-like macrophages in inflamed tissues. Epithelial cells show profound transcriptional reprogramming, including barrier dysfunction and enhanced immune signaling, while fibroblasts exhibit an activated, pro-fibrotic phenotype. These changes are orchestrated by complex cell-cell interactions and pathway activations, even in non-inflamed regions, underscoring the dynamic and pervasive nature of IBD pathogenesis.
Contents
- Dataset overview
- UMAP Visualization of Colon Single-Cell Atlas by Condition, Sample, and Cell Type Hierarchies
- Major Cell Type Score Visualization on UMAP
- Marker Expression Dot Plot for Colon Cell Subsets
- Cell Type Population Shifts in Colon Tissue Across Inflammatory Conditions
- Population Dynamics of T Cell Subsets and Innate Lymphoid Cells in Colon Inflammation
- Condition-Associated Shifts in T Cell Subset Proportions in Human Colon
- Macrophage Subset Population Shifts in Colon Inflammation
- Differential Macrophage Subset Proportions in Colon across Inflammatory Conditions
- Cell-Cell Interaction Patterns in Healthy, Inflamed, and Non-inflamed Colon Tissue
- Condition-Specific Cell-Cell Interaction Patterns in Human Colon: Implications for IBD
- Condition-Specific Surfaceome Markers in Intestinal Epithelial Cells
- Macrophage Condition-Specific Surfaceome Markers in Colon Tissue
- Fibroblast Condition-Specific Surfaceome Marker Expression Analysis
- CD4+ T Cell Surfaceome Marker Expression Across Colon Conditions
- Gene Ontology (GSA) Analysis of Macrophage States in Colon Inflammation
- Gene Set Enrichment Analysis (GSEA) Across Colon Cell Types and Inflammatory Conditions
- Discussion
- Query List
0. Dataset overview
Dataset Summary
- 데이터 크기: 88,167개 세포 x 18,151개 유전자로 구성된 단일 세포 RNA 시퀀싱 데이터입니다.
- 데이터 유형: 인간 대장(Colon) 조직에서 얻은 AnnData 객체입니다.
- 관측치 (obs) 칼럼: 세포 유형, 유전자 수, UMI 수, 피험자, 건강 상태, 위치, 샘플, 군집 등 다양한 세포 및 샘플 정보가 포함되어 있습니다.
- 유전자 (var) 칼럼: 유전자 관련 메트릭스 (예: mt 유전자 여부, 세포별 발현 수)를 제공합니다.
- 조건: 'Non-inflamed', 'Inflamed', 'Healthy' 세 가지 조건이 있습니다. DEG, GSEA, GSA 분석의 참조 조건은 'Healthy'입니다.
- 세포 유형 계층: 'celltype_major', 'celltype_minor', 'celltype_subset'의 세 가지 상세 수준으로 분류된 세포 유형 정보를 포함합니다.
- 종양 식별: 종양 기원 세포 식별은 요청되지 않았습니다 (False).
- CNV 추정치: CNV (Copy Number Variation) 추정치는 제공되지 않습니다 (False).
Precomputed Results
다음과 같은 사전 계산된 분석 결과가 포함되어 있습니다:
- 세포-세포 상호작용 (CCI): 조건 및 샘플별 CellPhoneDB 결과 (uns['CCI'], uns['CCI_sample']).
- 차등 발현 유전자 (DEG): 각 세포 유형(celltype_minor)별로 조건 간 또는 참조 조건 ('Healthy') 대비 차등 발현 유전자 결과 (uns['DEG'], uns['DEG_vs_ref']).
- 유전자 세트 농축 분석 (GSEA): 각 세포 유형(celltype_minor)별로 조건 간 또는 참조 조건 대비 GSEA 결과 (uns['GSEA'], uns['GSEA_vs_ref']).
- 유전자 온톨로지 (GSA/GO): 각 세포 유형(celltype_minor)별로 조건 간 또는 참조 조건 대비 GO 분석 결과 (uns['GSA_up'], uns['GSA_vs_ref_up']).
Inferred Biological Context
- 추론된 질병: 데이터의 조건 ('Inflamed', 'Non-inflamed', 'Healthy') 및 조직 ('Colon') 정보를 기반으로 염증성 장 질환 (IBD) 관련 연구 데이터로 추론됩니다.
1. UMAP Visualization of Colon Single-Cell Atlas by Condition, Sample, and Cell Type Hierarchies
[Analysis Visualization Results]...
Analysis Overview
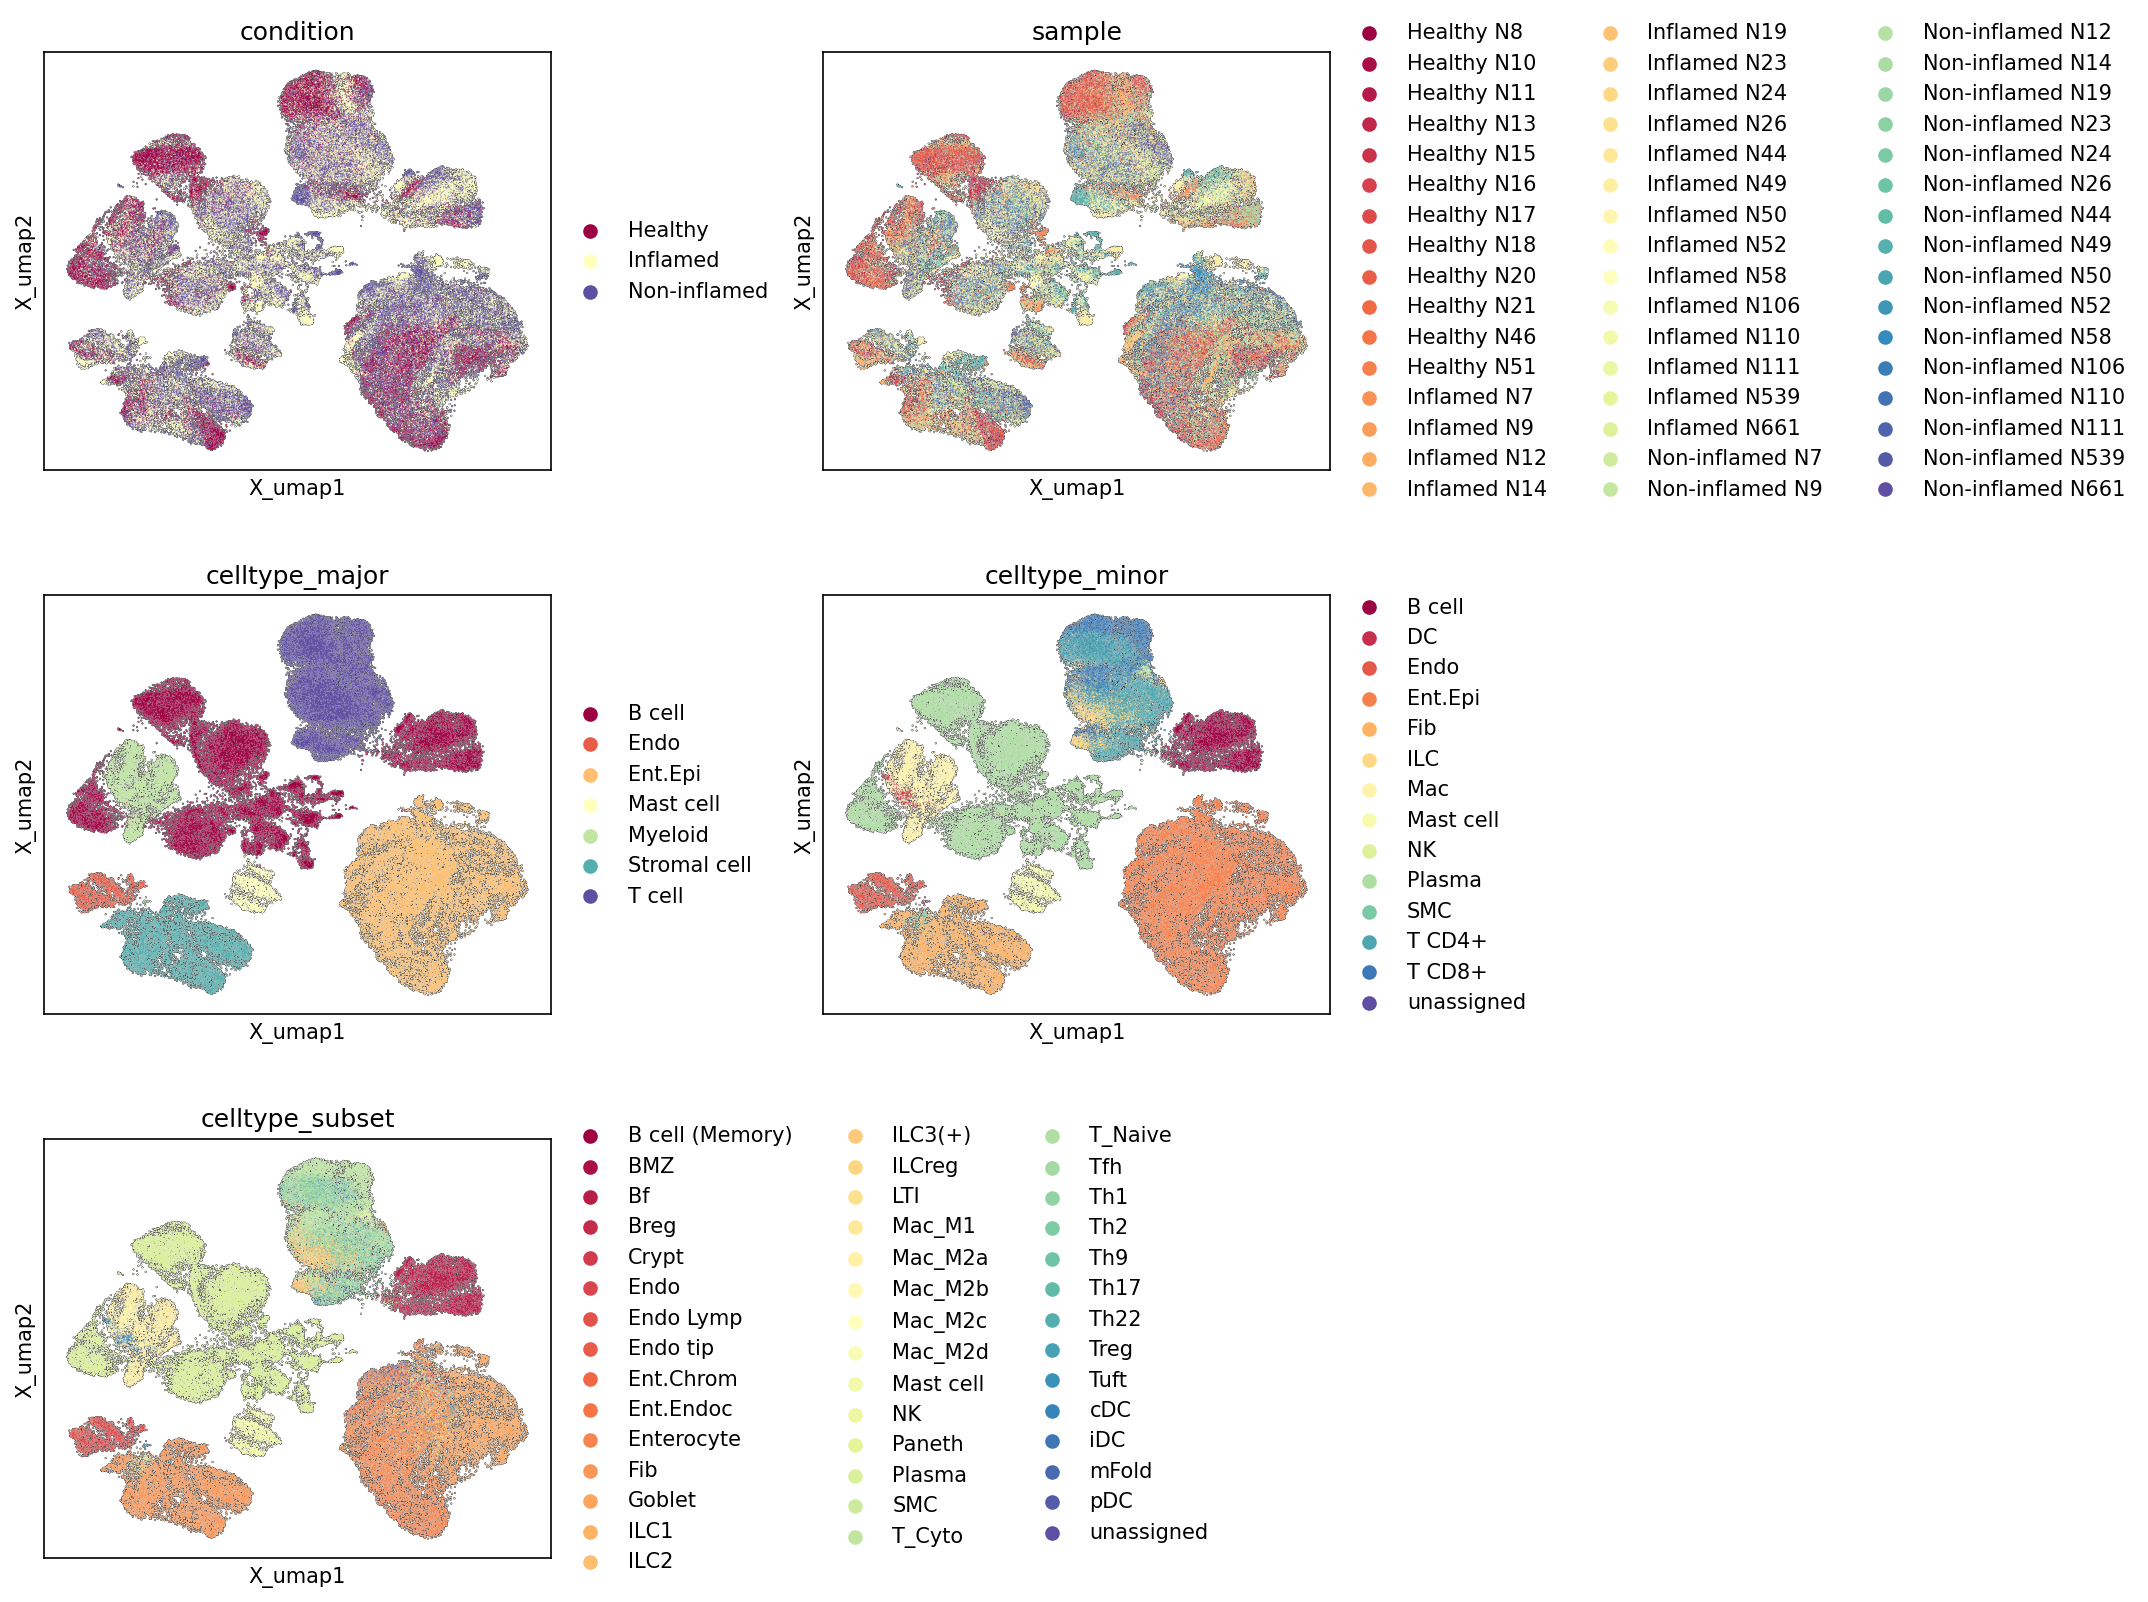
This analysis presents Uniform Manifold Approximation and Projection (UMAP) plots for single-cell RNA-sequencing data from human colon tissue. The UMAPs visualize the cellular landscape, colored by various metadata features: experimental condition (Healthy, Inflamed, Non-inflamed), individual sample, major cell type, minor cell type, and cell type subset. The primary goal is to assess the overall data structure, the separation of biological conditions, potential sample-specific effects, and the quality and resolution of cell type annotations across different hierarchical levels.
Visual Summary
Condition
The UMAP colored by condition shows a notable separation of cells based on their inflammatory status. 'Healthy' cells (dark red) tend to form distinct clusters or reside in specific regions, particularly some of the larger, more diffuse clusters. 'Inflamed' cells (light yellow) are broadly distributed across the UMAP, often mixing with 'Healthy' and 'Non-inflamed' cells but also showing enrichment in certain areas, suggesting condition-specific cellular states or compositions. 'Non-inflamed' cells (dark blue) also show a widespread distribution, with some distinct regions and considerable overlap with both 'Healthy' and 'Inflamed' cells, especially in areas where cell types are broadly represented. This pattern suggests that inflammation induces transcriptional changes that are somewhat distinct, but also highlights shared cellular populations across conditions.
Sample
The sample UMAP reveals good mixing of individual samples across most of the cellular landscape. While some minor sample-specific enrichments might be present in smaller clusters, there are no overt large-scale batch effects where cells from a single sample form isolated, distinct clusters independent of condition or cell type. This indicates that the data integration and dimensionality reduction steps have largely mitigated sample-specific technical variations, allowing for robust biological comparisons.
Cell Type Hierarchies (Major, Minor, Subset)
The UMAPs colored by celltype_major, celltype_minor, and celltype_subset demonstrate a clear and hierarchical organization of cell populations:
- Celltype_major: Major cell types (e.g., T cell, Intestinal Epithelial cell, Myeloid cell, B cell) form well-defined and largely distinct clusters. For instance, T cells (purple) form a large, distinct aggregate, as do Intestinal Epithelial cells (orange) and Stromal cells (light blue). This indicates a good separation of broad cellular identities.
- Celltype_minor: As expected, the celltype_minor annotation further refines these major clusters. For example, the broad T cell cluster from celltype_major now resolves into distinct T cell CD4+ and T cell CD8+ populations, which are still clustered together but show internal structure. Macrophages (Mac) form a distinct cluster within the Myeloid compartment. Plasma cells, a subset of B cells, separate from general B cells. Most minor cell types exhibit clear, interpretable clusters, demonstrating effective resolution at this level.
- Celltype_subset: This highest-resolution annotation further dissects the minor cell type clusters into very specific subsets. For instance, Macrophages (Mac) differentiate into various M1, M2a, M2b, M2c, M2d subtypes. T cells subdivide into cytotoxic T cells (T_Cyto), naive T cells (T_Naive), and various T helper (Th1, Th2, Th9, Th17, Th22), T follicular helper (Tfh), and regulatory T cells (Treg). Intestinal Epithelial cells resolve into Crypt cell, Goblet cell, Tuft cell, Paneth cell, Enterocyte, and Enteroendocrine cell populations. This detailed clustering confirms the high resolution of the single-cell data and the robustness of the cell type annotations. A small proportion of cells are labeled as 'unassigned' (dark purple) across all cell type levels, indicating either rare populations not clearly defined or cells of ambiguous transcriptional profile.
Biological Interpretation
The UMAP visualizations provide crucial insights into the cellular heterogeneity and condition-specific responses in the human colon, particularly in the context of inflammation.
- Inflammation-driven Cellular Remodeling: The separation of condition suggests that inflammatory processes in the colon lead to distinct changes in cellular states or compositions. While there's significant overlap, especially between 'Healthy' and 'Non-inflamed' (which might represent adjacent non-inflamed areas in IBD patients or individuals without active disease), the 'Inflamed' state likely involves the activation, expansion, or recruitment of specific cell populations that drive the inflammatory phenotype. This aligns with the understanding of Inflammatory Bowel Disease (IBD), where the immune and stromal cell compartments undergo significant remodeling during active inflammation.
- High-Resolution Cell Type Identification: The clear hierarchical clustering from celltype_major to celltype_subset demonstrates the high quality of the single-cell data and the robustness of the cell type annotations. The ability to resolve fine-grained cell subsets, such as specific macrophage polarization states (M1, M2 subtypes) or diverse T helper cell lineages (Th1, Th2, Th17, Treg), is critical for understanding the precise cellular contributions to colon homeostasis and disease. For instance, the presence of distinct T helper subsets suggests a complex immune response, and the identification of various epithelial cell types indicates comprehensive sampling of the intestinal lining.
- Absence of Major Batch Effects: The effective mixing of sample across the UMAP indicates that any technical variation between samples has been successfully accounted for during data processing. This is vital for ensuring that observed differences between conditions or cell types are genuinely biological rather than artifacts of sample collection or sequencing.
Annotation Notes
The comprehensive and granular cell type annotations across major, minor, and subset levels are a strong asset of this dataset. The clear separation of these annotations in the UMAPs supports their validity and utility for downstream differential expression and pathway analyses. The small fraction of 'unassigned' cells is typical in single-cell datasets and does not detract from the overall high quality of the primary annotations.
2. Major Cell Type Score Visualization on UMAP
[Analysis Visualization Results]...
Analysis Overview
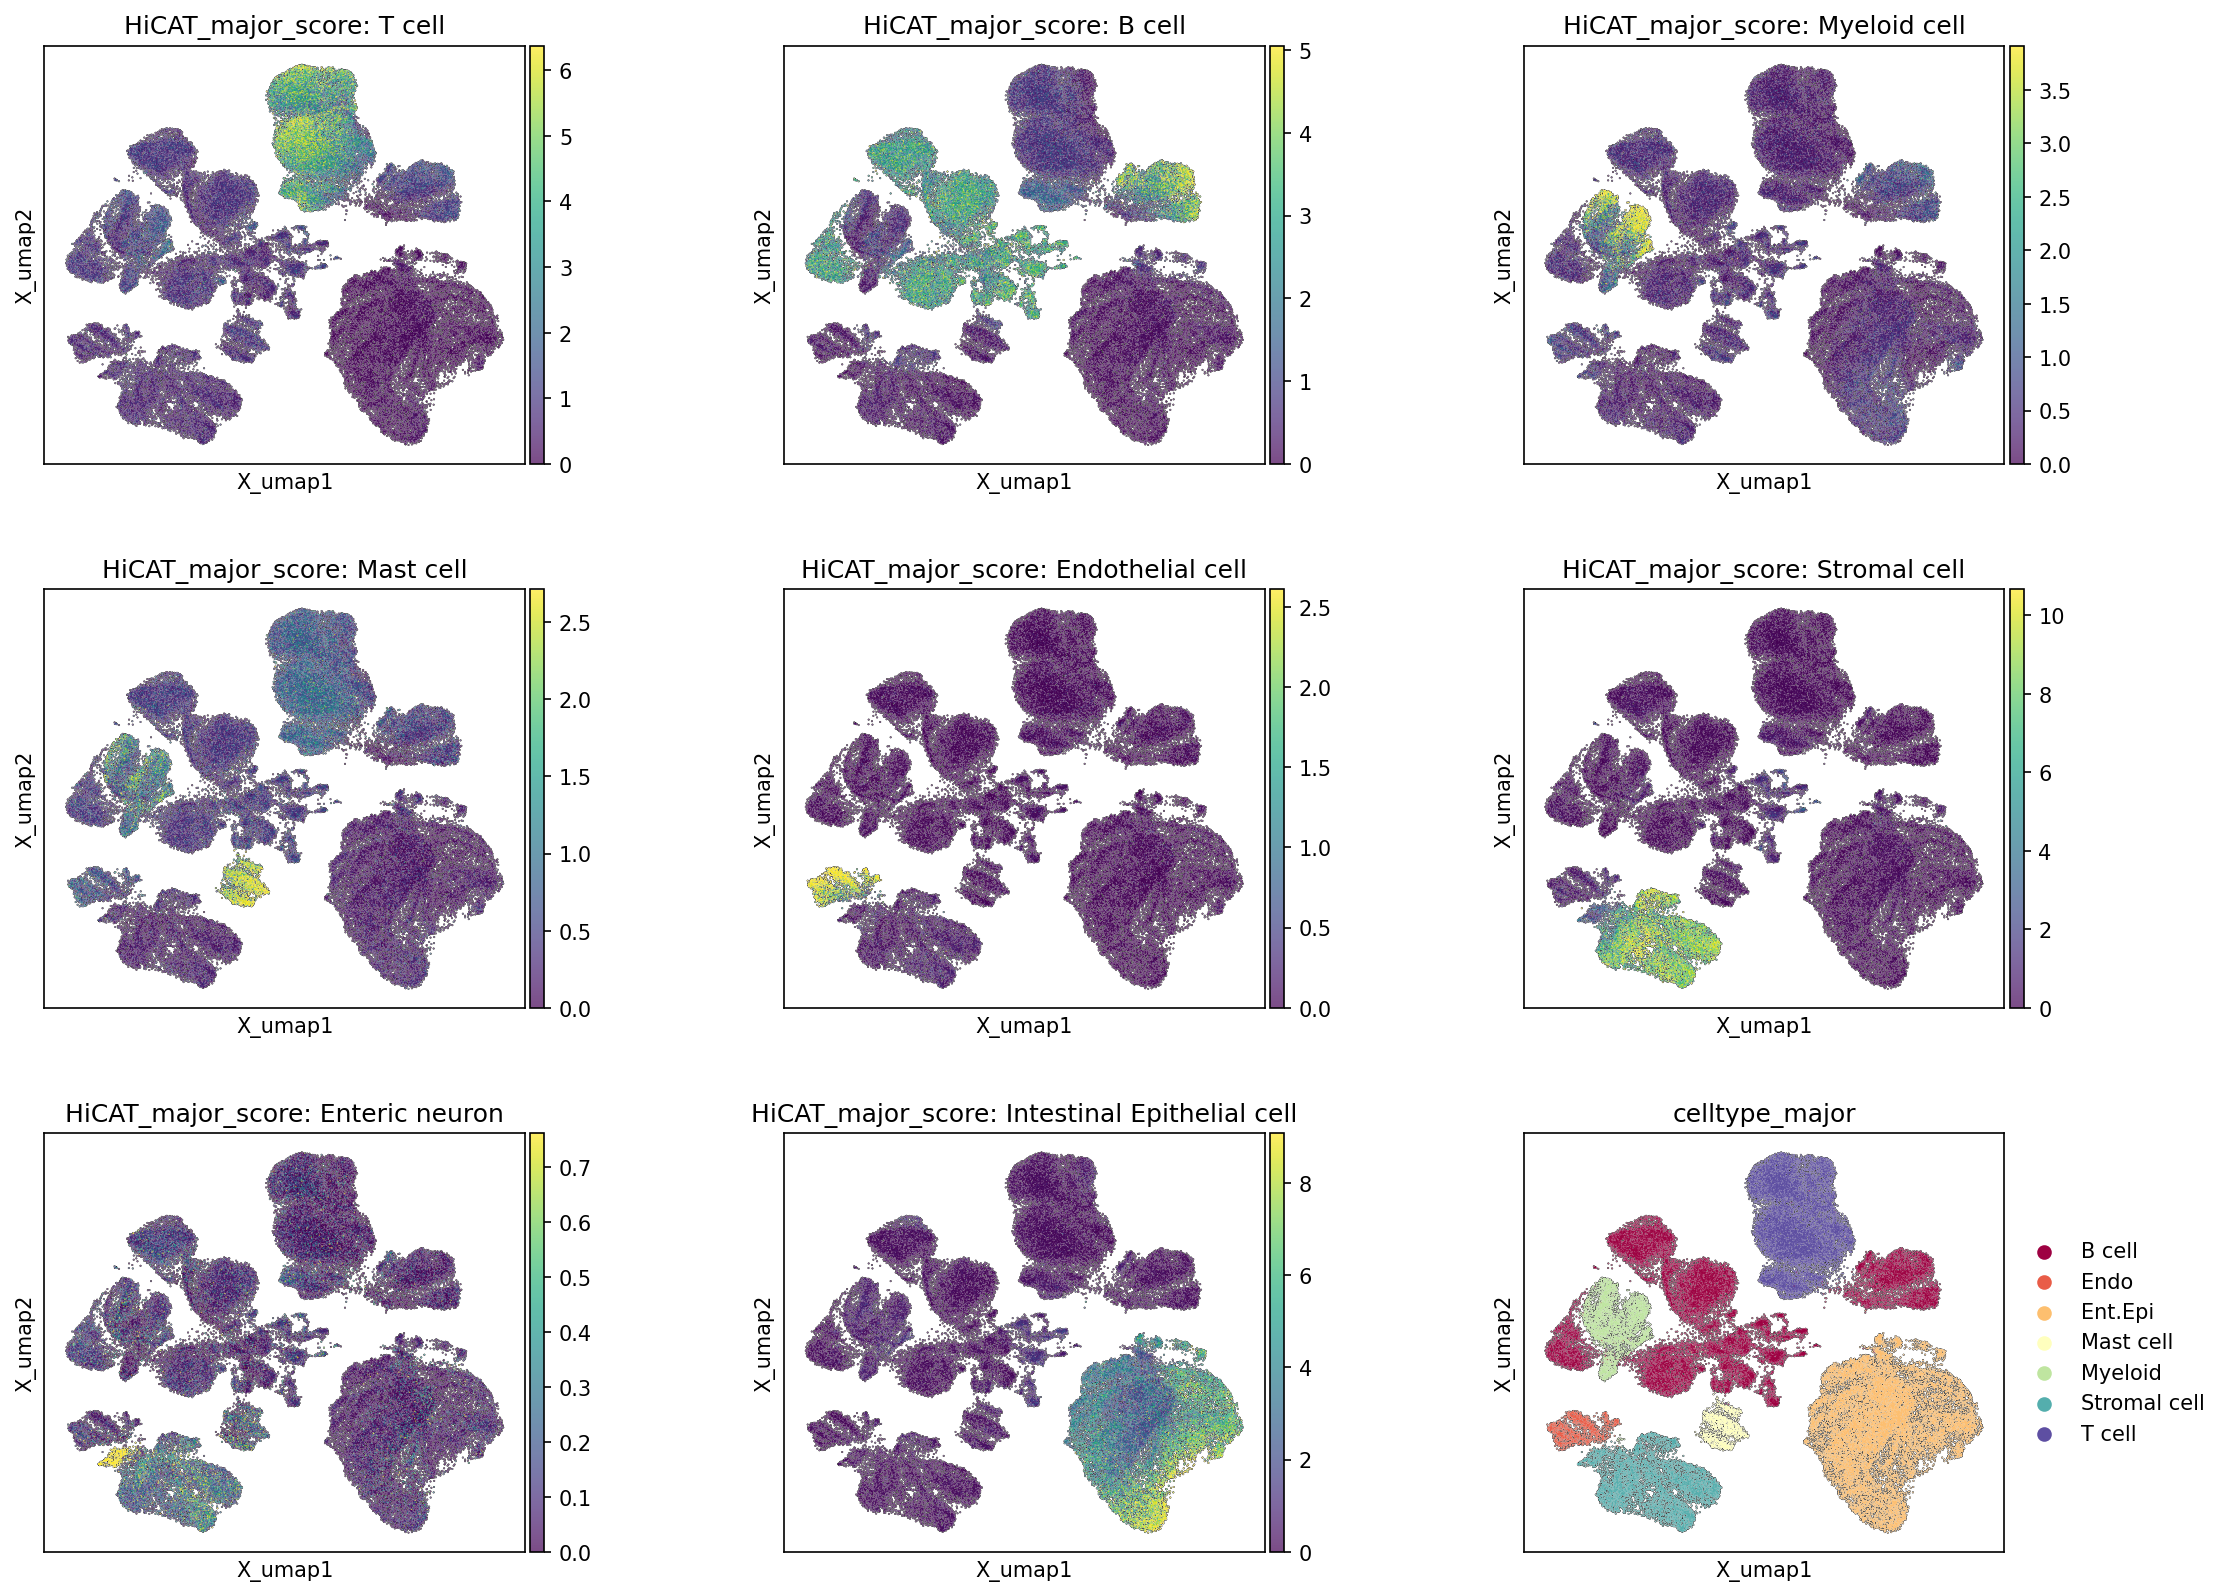
This analysis presents Uniform Manifold Approximation and Projection (UMAP) plots, visualizing the global transcriptional landscape of 88,167 cells from human colon tissue. Each plot (except the last one) displays a 'HiCAT_major_score' for a specific major cell type, indicating the likelihood or transcriptional similarity of cells to that particular cell type. The final plot shows the assigned celltype_major annotation. These visualizations are crucial for assessing the quality of cell type annotation and understanding the distribution and distinctness of different cell populations within the dataset.
Visual Summary
The UMAP projections reveal a well-structured dataset with several distinct clusters, suggesting successful dimensionality reduction and separation of cell populations.
- HiCAT_major_score: T cell: This score is highly concentrated in the top-middle and left-middle clusters of the UMAP, with high scores (yellow) corresponding well to these regions.
- HiCAT_major_score: B cell: High scores for B cells are visible in the upper-left cluster and a smaller cluster directly below it, clearly delineating these populations.
- HiCAT_major_score: Myeloid cell: Myeloid cell scores are elevated in a cluster towards the upper-left and another cluster in the lower-left region, indicating distinct myeloid populations.
- HiCAT_major_score: Mast cell: High Mast cell scores are observed in a relatively small, distinct cluster in the lower-middle region of the UMAP.
- HiCAT_major_score: Endothelial cell: Endothelial cell scores are prominently high in a cluster in the lower-left region, showing good separation.
- HiCAT_major_score: Stromal cell: Stromal cell scores show a very strong signal in a large, well-defined cluster located in the lower-left quadrant.
- HiCAT_major_score: Enteric neuron: This score shows high intensity in a very small, distinct cluster in the lower-middle-left area.
- HiCAT_major_score: Intestinal Epithelial cell: This score is intensely high in the large, crescent-shaped cluster occupying the entire bottom-right portion of the UMAP.
- celltype_major: The final UMAP plot, colored by the celltype_major annotation, shows distinct clustering that largely mirrors the high-score regions observed in the individual HiCAT_major_score plots. For instance, the T cell cluster (dark purple) aligns with high T cell scores, the Intestinal Epithelial cell cluster (light orange) aligns with high Intestinal Epithelial cell scores, and so on for B cells, Myeloid cells, Stromal cells, Mast cells, and Endothelial cells.
Overall, there is a strong visual concordance between the HiCAT major scores and the assigned celltype_major annotations. Each major cell type score largely illuminates the spatial location of its corresponding annotated cluster, demonstrating good separation and distinctiveness of these major cell populations.
Biological Interpretation
The high concordance between the HiCAT major cell type scores and the celltype_major annotations provides strong evidence for the robust identification and delineation of major cell populations in the human colon single-cell RNA-seq dataset.
- Clear Cell Type Delineation: The distinct clustering and concentrated high scores for each major cell type (e.g., T cell, B cell, Myeloid cell, Intestinal Epithelial cell, Stromal cell) indicate that these populations possess unique transcriptional profiles, allowing for their clear separation in the UMAP embedding. This is fundamental for subsequent cell-type-specific analyses.
- Tissue-Specific Cell Representation: The presence and relative proportions of these major cell types align with expectations for human colon tissue. The intestinal epithelium is a major component, reflected by the large cluster of Intestinal Epithelial cells. The substantial presence of immune cells (T cells, B cells, Myeloid cells, Mast cells) is expected given the colon's role as a mucosal immune site, especially in the context of inflammatory conditions (as inferred from conditions). Stromal cells (e.g., fibroblasts, smooth muscle cells) and Endothelial cells are crucial structural and vascular components of the colon wall. The detection of Enteric neurons, though a smaller population, highlights the complexity of the colonic microenvironment.
- Annotation Confidence: The strong alignment of the HiCAT scores with the celltype_major labels reinforces confidence in the quality of the automated or manual annotation process for these major cell types. Where scores are high, the cells are consistently assigned the corresponding major cell type, and vice versa.
- Potential for Granular Analysis: While major cell types are well-defined, areas where scores might be moderately high for more than one cell type (though not prominently visible here) or where a single major cluster might show internal heterogeneity could suggest the presence of minor cell subsets or transitional states, warranting deeper investigation at the celltype_minor or celltype_subset level.
Annotation Notes
The UMAP plots showing HiCAT major scores alongside the celltype_major annotation serve as an excellent validation of the cell type assignment.
- Validation of Major Cell Type Annotations: The high consistency between the gene expression-based scores (HiCAT scores) and the assigned celltype_major labels strongly supports the accuracy and biological relevance of the major cell type annotations. Cells annotated as a particular major type consistently exhibit high scores for that specific type.
- Distinctness of Clusters: The visualizations confirm that the major cell types form well-separated clusters in the UMAP space, implying that their transcriptional profiles are sufficiently distinct to allow for robust identification. This enhances the reliability of downstream cell-type-specific differential expression or pathway analyses.
- No Obvious Misannotations at Major Level: There are no prominent regions where cells strongly score for one major cell type but are annotated as another, suggesting a high-quality major cell type annotation.
- Future Refinements: While major types are clear, further analyses using minor or subset scores could help resolve heterogeneity within these major clusters and validate finer-grained annotations, such as those listed in celltype_minor and celltype_subset. For instance, the 'Myeloid cell' cluster might encompass macrophages, dendritic cells, etc., and their individual scores would further dissect this population.
3. Marker Expression Dot Plot for Colon Cell Subsets
[Analysis Visualization Results]...
Analysis Overview
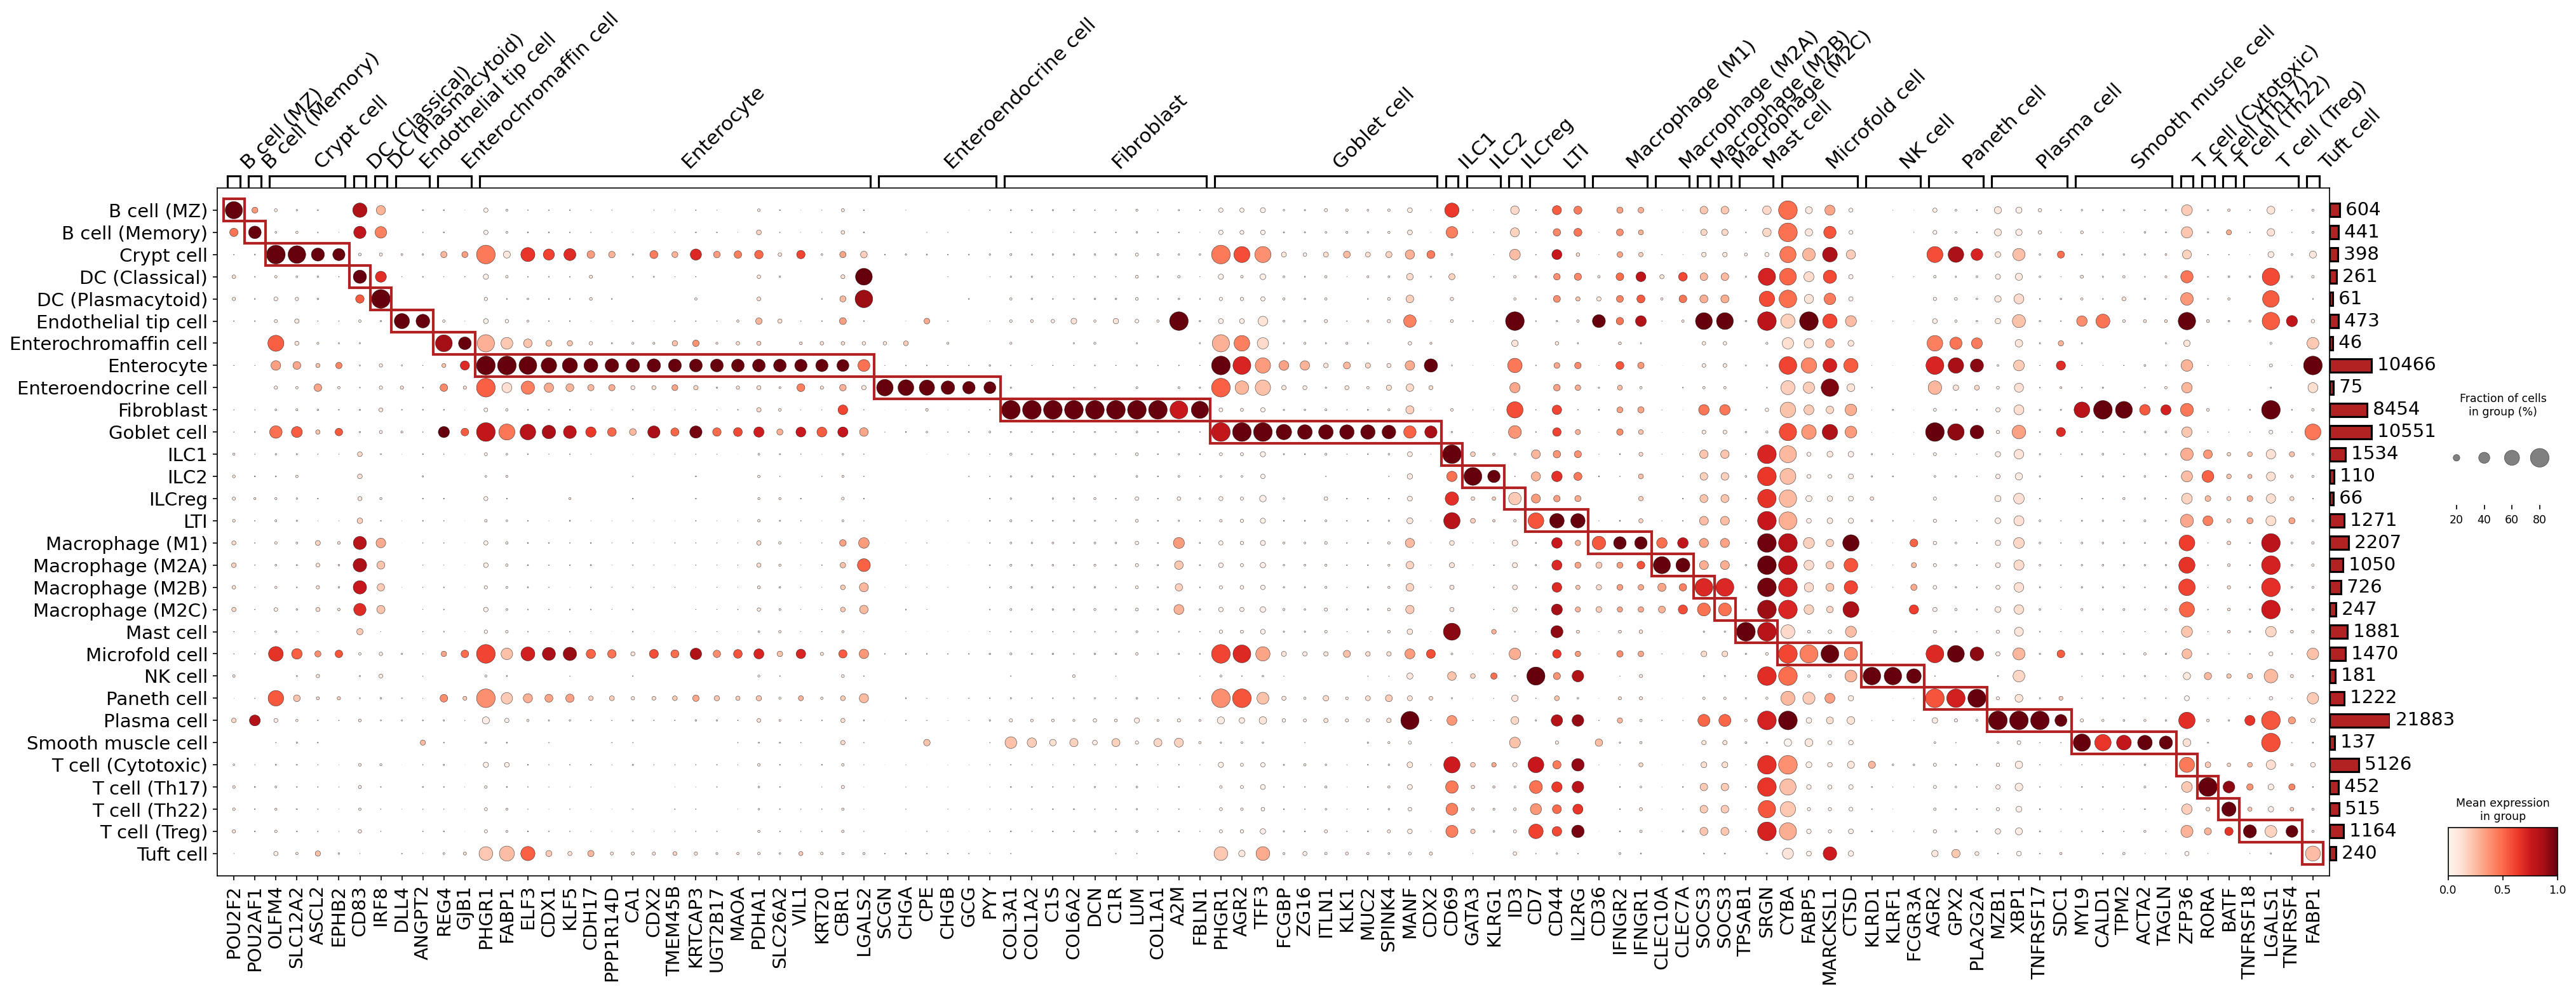
This analysis presents a marker expression dot plot for various celltype_subset populations identified in human colon single-cell RNA-seq data. The primary objective is to visually confirm and assess the distinct molecular identities of these cell subsets based on the expression patterns of their top marker genes. The dot plot illustrates both the mean expression level of each gene (color intensity) and the fraction of cells within a given subset that express that gene (dot size). Markers were selected with a focus on surfaceome genes to potentially aid in experimental validation, with genes common across three or more cell groups removed to highlight specificity.
Visual Summary
The dot plot displays a robust diagonal pattern, with prominent red boxes encircling clusters of highly expressed and prevalently expressed genes within corresponding cell types. This diagonal enrichment strongly indicates that each celltype_subset largely expresses a unique set of marker genes, affirming their distinct identities.
Key visual features include:
- Distinct Clusters: Most celltype_subset populations exhibit clear, enriched expression of specific marker genes, forming distinct blocks along the diagonal. This pattern is particularly strong for specialized epithelial cells (e.g., Enterocyte, Goblet cell, Paneth cell), stromal cells (Fibroblast, Smooth muscle cell), and immune cells (e.g., Macrophage subtypes, Plasma cell, Mast cell).
- Expression and Prevalence: The color intensity (mean expression) and dot size (fraction of cells expressing) provide a comprehensive view of marker gene activity. Many core markers show both high expression levels (dark red) and high prevalence (large dot size) within their respective cell types, as expected for good identity markers.
- Cell Counts: The bar plot on the right indicates the number of cells belonging to each celltype_subset. Notable cell numbers include Paneth cells (21883 cells), Enterocytes (10466 cells), Goblet cells (10551 cells), and Fibroblasts (8454 cells), reflecting major cell populations in the colon. The high count for Paneth cells is particularly striking for colon tissue.
- Shared Markers: While most markers are specific, some genes show expression across related cell types, or occasional off-diagonal signals, which could indicate shared biological functions, progenitor states, or broad expression within a cell lineage. For instance, some enteroendocrine markers are shared between Enterochromaffin and Enteroendocrine cells.
Biological Interpretation
The marker gene expression patterns broadly align with known cell type identities in the human colon, supporting the annotation of these celltype_subset populations.
Epithelial Lineage
- Enterocytes are characterized by robust expression of genes like FABP1, ELF3, KLF5, CDH17, CDX2, and KRT20, which are crucial for nutrient absorption and epithelial structure. GeneCards: FABP1
- Goblet cells are clearly identified by MUC2 and ZG16, consistent with their role in mucin production. GeneCards: MUC2
- Paneth cells show high expression of MMP7 and LYG, reflecting their role in host defense. The remarkably high cell count for Paneth cells in this dataset for colon tissue warrants further consideration for their functional implications or potential regional specificity.
- Enterochromaffin and Enteroendocrine cells express neuroendocrine markers like CHGA, CPE, CHGB, GCG, and PYY, consistent with their hormone-producing functions.
- Crypt cells are marked by REG4 and GJB1, supporting their role in intestinal regeneration.
Immune Cell Lineage
- B cell (MZ) and B cell (Memory) subsets express POU2F2 and POU2AF1, core B cell transcription factors.
- Plasma cells exhibit strong expression of canonical markers such as SDC1 (CD138), MZB1, XBP1, and TNFRSF17 (BCMA), confirming their antibody-secreting phenotype. GeneCards: SDC1
- Macrophage subtypes (M1, M2A, M2B, M2C, M2D) show common macrophage markers like SPP1, MARCKSL1, CTSD, with further sub-differentiation indicated by markers like FCGR3A (M2A) and specific interferon-regulated genes (IFNGR1/2 for M2C/M2D), reflecting their diverse roles in immunity and tissue repair.
- Mast cells are distinctly marked by TPSAB1 (Tryptase alpha/beta 1) and SRGN (Serglycin), consistent with their pro-inflammatory and immunomodulatory roles. GeneCards: TPSAB1
- Dendritic cells (DC), both Classical and Plasmacytoid, express markers like CD83.
- ILC1, ILC2, ILCreg, LTI subsets exhibit markers such as KLRD1 (ILC1) and GATA3 (ILC2), consistent with their roles in innate immunity.
Stromal and Endothelial Cells
- Fibroblasts are characterized by extracellular matrix components and associated genes such as DCN, LUM, COL1A1, and FBLN1. GeneCards: COL1A1
- Smooth muscle cells express ACTA2, MYL9, and CALD1, reflecting their contractile function. GeneCards: ACTA2
- Endothelial tip cells show strong expression of ANGPT2, a known marker for angiogenic endothelial cells. GeneCards: ANGPT2
Annotation Notes
The marker expression patterns observed in this dot plot largely provide strong support for the assigned celltype_subset annotations within the colon tissue. The specificity and high expression of many canonical markers across a broad range of cell types affirm the quality of the cell type identification.
However, certain aspects warrant note:
- Paneth Cell Abundance: The exceptionally high number of Paneth cells (21883) in a colon dataset is a significant observation. While Paneth cells are present in the colon, they are typically more abundant in the small intestine. This could indicate a specific regional sampling, an inflammatory context influencing their expansion, or potential considerations for cell clustering and annotation stringency.
- T Cell Subtype Specificity: While T cell subtypes (e.g., T cell (Th17), T cell (Th22), T cell (Treg)) show some distinguishing markers (e.g., RORA for Th17, TNFRSF4 for Treg), their defining markers are sometimes less distinct or fewer in number compared to other major cell types in this plot. This could be due to the surfaceome_only=True parameter in the marker finding configuration, which might exclude key intracellular transcription factors (like FOXP3 for Tregs) that definitively mark these subsets.
- Marker Selection Parameters: The rem_mkrs_common_in_N_groups_or_more=3 parameter ensures that only relatively specific markers are displayed. While beneficial for highlighting unique identities, it means genes broadly expressed across immune cell types (e.g., pan-T cell or pan-myeloid markers) would be omitted, which is important context for this interpretation.
4. Cell Type Population Shifts in Colon Tissue Across Inflammatory Conditions
[Analysis Visualization Results]...
Analysis Overview
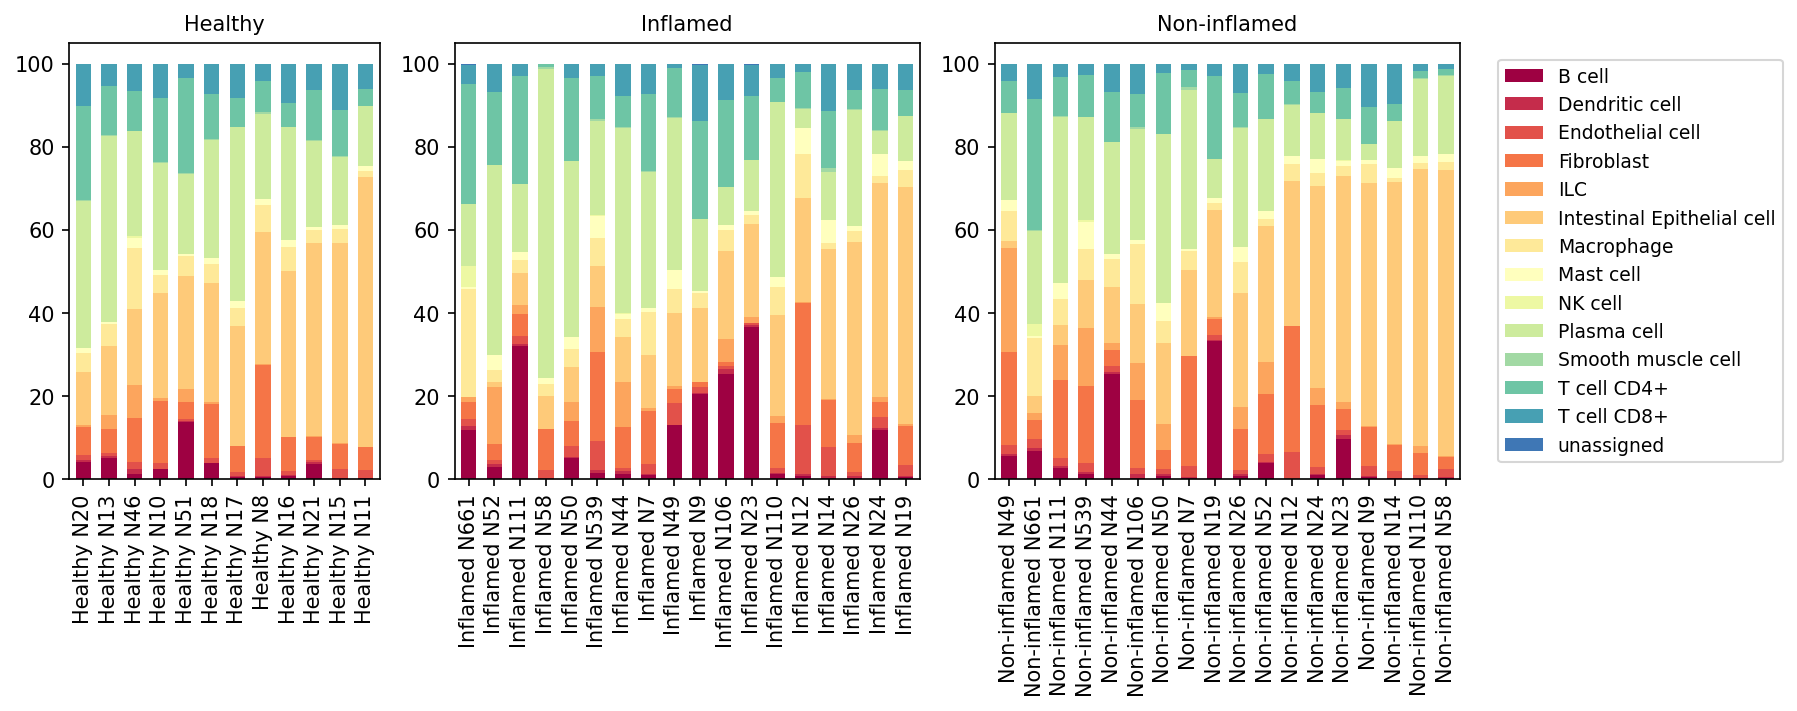
This analysis presents a population bar plot illustrating the relative proportions of minor cell types within individual samples across three conditions: Healthy, Inflamed, and Non-inflamed colon tissue. Each bar represents a single sample, with stacked segments showing the percentage contribution of each identified cell type. This visualization provides insight into how the cellular composition of the colon microenvironment changes in response to inflammatory states, consistent with the inferred context of Inflammatory Bowel Disease (IBD).
Visual Summary
The stacked bar plots reveal distinct patterns of cell type composition across the different conditions:
- Healthy Condition: Samples from healthy individuals are characterized by a predominant proportion of Intestinal Epithelial cells (light orange/yellow), typically constituting over 50% of the total cellularity. Immune cell populations such as T cells (CD4+ and CD8+), Macrophages, B cells, and Plasma cells are present but in relatively lower proportions, reflecting a state of immune homeostasis.
- Inflamed Condition: A striking shift is observed in inflamed samples. There is a marked decrease in the relative proportion of Intestinal Epithelial cells, suggesting epithelial damage or displacement by infiltrating immune cells. Concurrently, there is a substantial increase in various immune cell populations:
- B cells (dark red/burgundy) and Plasma cells (light green) show a prominent expansion in many inflamed samples, often becoming a significant component of the tissue.
- T cells (CD4+ and CD8+) also appear elevated compared to healthy tissue, indicating robust adaptive immune responses.
- Dendritic cells (red) exhibit a noticeable increase in proportion in several inflamed samples.
- Fibroblasts (orange) also show a relative increase in some inflamed samples, potentially reflecting stromal remodeling.
- Non-inflamed Condition: The "Non-inflamed" condition displays considerable heterogeneity. While some samples in this group maintain a cellular composition closer to "Healthy" tissue, with a higher proportion of Intestinal Epithelial cells, others show an intermediate phenotype. Several "Non-inflamed" samples exhibit elevated proportions of immune cells, particularly B cells, Plasma cells, and T cells, albeit generally less pronounced or consistent than in "Inflamed" samples. This suggests ongoing immune activation or histological inflammation even in macroscopically non-inflamed areas.
- Overall Trends: The most prominent feature is a clear shift from an Intestinal Epithelial cell-dominated landscape in healthy tissue to an immune cell-infiltrated environment in inflamed tissue, with the "Non-inflamed" samples representing a spectrum between these two states. The "unassigned" cell type (dark blue) consistently represents a minor proportion across all samples, indicating robust cell type annotation.
Biological Interpretation
The observed shifts in cell population proportions provide crucial insights into the underlying biological processes in the colon, particularly in the context of inflammation inferred as Inflammatory Bowel Disease (IBD).
- Immune Cell Infiltration as a Hallmark of Inflammation: The significant expansion of B cells, Plasma cells, and T cells in inflamed colon tissue is a direct biological manifestation of active inflammation. In IBD, the gut immune system is dysregulated, leading to chronic activation of adaptive immune responses. Increased B cells and plasma cells indicate local humoral immunity and antibody production, which are central to IBD pathogenesis PubMed search: IBD B cell plasma cell gut inflammation. The proliferation of CD4+ and CD8+ T cells points to effector T cell responses driving tissue damage.
- Epithelial Barrier Compromise: The relative reduction in Intestinal Epithelial cells in inflamed samples is consistent with the known pathology of IBD, where the epithelial barrier is compromised due to inflammation-induced damage, increased cell turnover, and crypt architectural distortion. The presence of immune cells can directly induce apoptosis or impair proliferation of epithelial cells, contributing to barrier dysfunction PubMed search: IBD epithelial barrier dysfunction.
- Stromal Remodeling: The apparent increase in Fibroblasts in inflamed and some non-inflamed samples suggests activation of stromal compartments. Fibroblasts play critical roles in tissue repair, fibrosis, and immune cell recruitment, which are key aspects of chronic inflammation and remodeling in IBD GeneCards: Fibroblast.
- Heterogeneity of "Non-inflamed" Tissue: The variable cellular composition in "Non-inflamed" samples is highly relevant. It suggests that even macroscopically uninvolved or quiescent areas in IBD patients can harbor subclinical inflammation or ongoing immune dysregulation, a phenomenon well-documented in IBD. This microscopic inflammation can be predictive of disease relapse and indicates a widespread inflammatory predisposition rather than strictly localized lesions.
Clinical or Translational Implications
These findings have several important clinical and translational implications for IBD:
- Biomarkers of Disease Activity: The observed shifts in immune cell proportions, particularly B cells, Plasma cells, and T cells, could serve as histological or molecular biomarkers for assessing disease activity and severity. Quantification of these cell types in biopsies could supplement endoscopic and clinical assessments.
- Therapeutic Targets: The prominent role of B cells and plasma cells in inflamed tissue highlights these cell populations as potential therapeutic targets. Therapies that modulate B cell function or survival, or interfere with plasma cell differentiation/survival (e.g., anti-CD20, plasma cell depleting agents), might be beneficial in specific IBD subtypes or patients PubMed search: IBD B cell therapy. Similarly, strategies targeting specific T cell subsets remain a focus for IBD treatments.
- Monitoring Disease Progression/Remission: Understanding the cellular landscape in "Non-inflamed" tissue is crucial. The presence of immune cell infiltration in these areas suggests that complete clinical remission might not equate to full histological remission at the cellular level. Monitoring these subtle changes could help predict relapse or identify patients at higher risk for disease progression, guiding more aggressive or sustained therapeutic approaches.
- Understanding IBD Pathogenesis: The population changes reinforce the multifaceted nature of IBD, involving both innate and adaptive immune cells, as well as structural cells of the gut. Further studies delving into the functional states and interactions of these altered cell populations will be critical for a comprehensive understanding of disease mechanisms.
5. Population Dynamics of T Cell Subsets and Innate Lymphoid Cells in Colon Inflammation
[Analysis Visualization Results]...
Analysis Overview
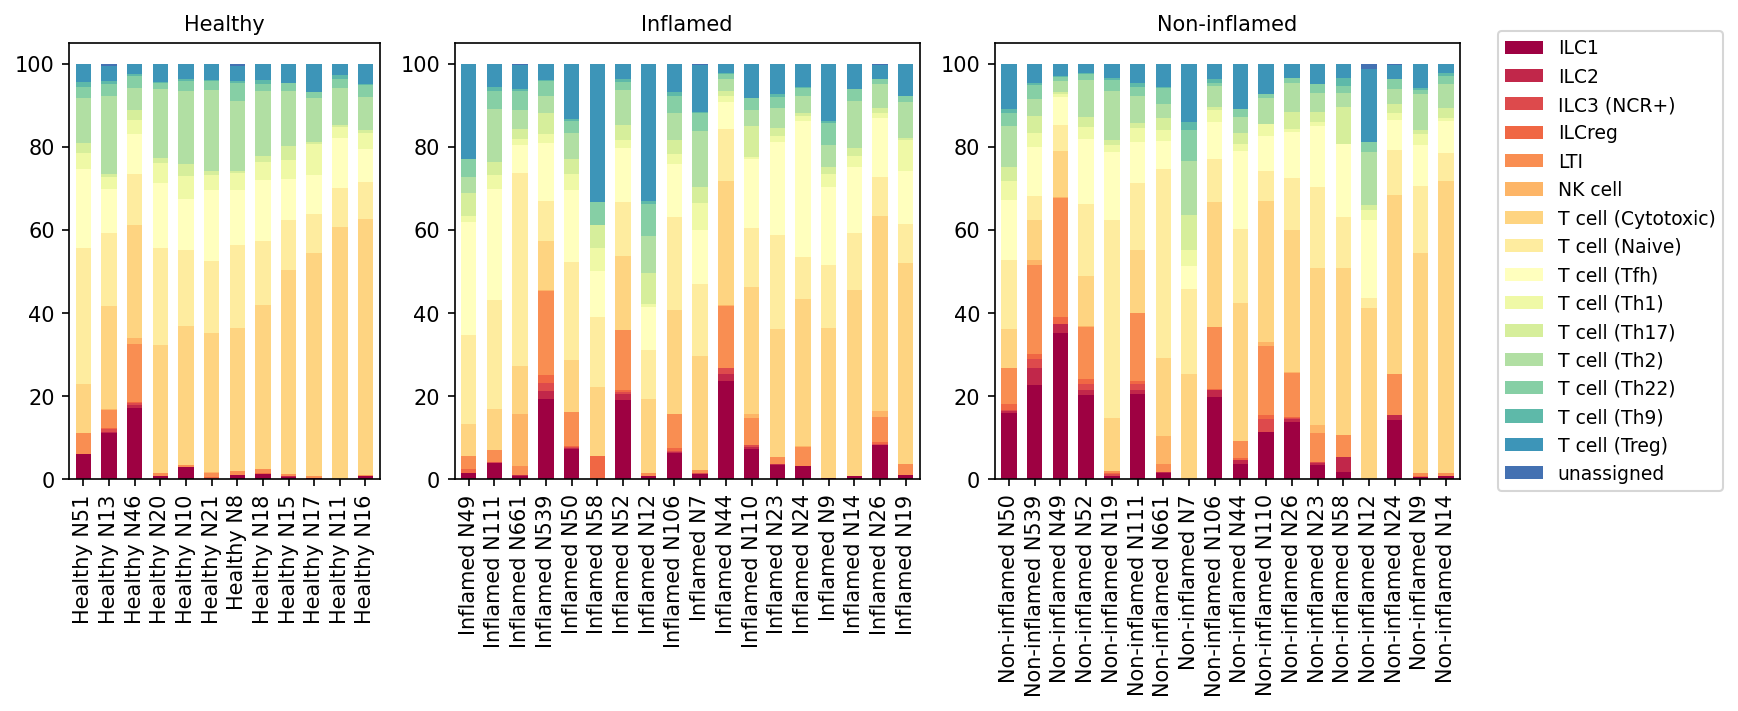
This analysis presents a population bar plot illustrating the relative proportions of various T cell subsets, as well as Innate Lymphoid Cells (ILCs) and NK cells, across individual samples from human colon tissue. Samples are grouped by their clinical condition: 'Healthy', 'Inflamed', and 'Non-inflamed'. The plot focuses on the 'T cell' major cell type, further stratified into 'subset' level annotations, providing insight into the immune cell landscape under different inflammatory states.
Visual Summary
The visualization reveals distinct patterns in the composition of T cell and related lymphoid cell subsets across the three conditions:
- Healthy Condition: Samples from healthy individuals generally exhibit a relatively stable composition. T cell (Cytotoxic) and T cell (Naive) subsets collectively form a significant portion of the population. Innate Lymphoid Cells (ILC1, ILC2, ILC3 (NCR+), ILCreg, LTI) and NK cells are present but typically in lower proportions compared to other conditions. T cell (Treg) populations are consistently observed as a minor fraction.
- Inflamed Condition: The most striking feature in inflamed samples is a notable increase in the proportion of Innate Lymphoid Cells (ILC1, ILC2, ILC3 (NCR+), ILCreg) and NK cells in many individuals. This increase often comes at the relative expense of T cell (Cytotoxic) and T cell (Naive) populations, which appear to occupy a smaller relative percentage in samples with high ILC/NK cell infiltration. There is also considerable heterogeneity among inflamed samples, with some showing more pronounced shifts than others.
- Non-inflamed Condition: Samples categorized as 'Non-inflamed' show a mixed picture, suggesting heterogeneity. Some non-inflamed samples largely resemble healthy samples in their T cell and ILC distribution, with low proportions of ILCs/NK cells. However, a significant number of 'Non-inflamed' samples exhibit an elevated presence of ILCs (particularly ILC1, ILC2, ILC3 (NCR+)) and NK cells, similar to what is observed in inflamed samples, although often less pronounced or in a subset of cells. This suggests that some 'Non-inflamed' tissues might still harbor an altered immune environment, potentially reflecting areas of quiescent disease or subclinical inflammation.
- Overall Trends: A general trend observed is an increased presence of ILCs (specifically ILC1, ILC2, ILC3 (NCR+)) and NK cells in both 'Inflamed' and a subset of 'Non-inflamed' samples compared to 'Healthy'. The proportion of "unassigned" cells is consistently very low across all samples and conditions, indicating robust cell type annotation.
Biological Interpretation
The observed shifts in T cell and ILC populations are highly relevant to the inferred biological context of Inflammatory Bowel Disease (IBD) in the colon:
- Innate Lymphoid Cell (ILC) Dysregulation in IBD: The increased proportions of ILC1, ILC2, and ILC3 (NCR+) in inflamed and some non-inflamed colon samples align well with current understanding of IBD pathogenesis.
- ILC1s and ILC3s are critical producers of pro-inflammatory cytokines such as IFN-γ and IL-17/IL-22, respectively, and are strongly implicated in driving chronic inflammation in Crohn's disease and ulcerative colitis PubMed search: ILC1 ILC3 IBD colon inflammation. Their elevated presence suggests an active inflammatory response or a primed state in the non-inflamed samples.
- ILC2s are associated with type 2 immune responses, typically driven by cytokines like IL-5 and IL-13, and their role in IBD is more complex, sometimes protective but also contributing to pathology in specific contexts.
- NK Cells and Inflammation: The increase in NK cells can contribute to immune pathology through cytotoxicity and cytokine production (e.g., IFN-γ), playing a role in tissue damage during chronic inflammation.
- T Cell Subsets in IBD: While T cell (Cytotoxic) and T cell (Naive) remain major components, their relative decrease in highly inflamed samples suggests an expansion of other immune populations.
- Various T helper (Th) subsets (Th1, Th17, Th2) are also present. Th1 and Th17 cells are well-established drivers of inflammation in IBD PubMed search: Th17 Th1 IBD pathogenesis. Their specific changes within the overall T cell compartment require further quantitative analysis, but their presence is consistent with a chronic inflammatory state.
- Tregs are crucial for maintaining immune tolerance and suppressing inflammation. While their overall proportion appears minor, their function or specific localization could be critical in IBD, as their dysfunction or insufficient numbers relative to effector T cells can exacerbate disease. The current visualization does not suggest a dramatic, consistent increase or decrease across all conditions, highlighting the need for more detailed analysis of their relative numbers and function.
- Heterogeneity in Non-inflamed Samples: The variability in ILC/NK cell populations within 'Non-inflamed' samples is particularly insightful. It suggests that even clinically non-inflamed areas in IBD patients (or individuals at risk) may harbor subclinical immune alterations, representing a state of ongoing immune dysregulation or preparation for future flares. This highlights the complex and often patchy nature of inflammation in the colon.
Clinical or Translational Implications
The findings have several clinical and translational implications for understanding and managing Inflammatory Bowel Disease:
- Biomarkers of Disease Activity/Risk: The observed increases in specific ILC subsets (ILC1, ILC3 (NCR+)) and NK cells could serve as potential biomarkers for active inflammation or even predict disease flares in patients with IBD. Monitoring these cell populations in biopsy samples from seemingly non-inflamed areas might help identify patients at higher risk of disease progression or recurrence.
- Therapeutic Targets: Given their significant role in driving inflammation, ILCs represent attractive therapeutic targets. Strategies aimed at modulating ILC function or depleting specific pro-inflammatory ILC subsets could offer novel treatment avenues for IBD, particularly for patients who do not respond to conventional therapies targeting T cells PubMed search: ILC therapeutics IBD.
- Understanding Disease Progression: The immune landscape of 'Non-inflamed' samples is critical. Identifying specific immune profiles (e.g., elevated ILCs) in these regions could provide insights into the mechanisms underlying quiescent disease and help distinguish between true remission and subclinical activity, guiding more personalized treatment strategies.
- Disease Heterogeneity: The substantial inter-sample variability within each condition, especially 'Inflamed' and 'Non-inflamed', underscores the highly heterogeneous nature of IBD. This highlights the importance of single-cell resolution studies to capture the full spectrum of immune responses and inform patient-specific approaches.
6. Condition-Associated Shifts in T Cell Subset Proportions in Human Colon
[Analysis Visualization Results]...
Analysis Overview
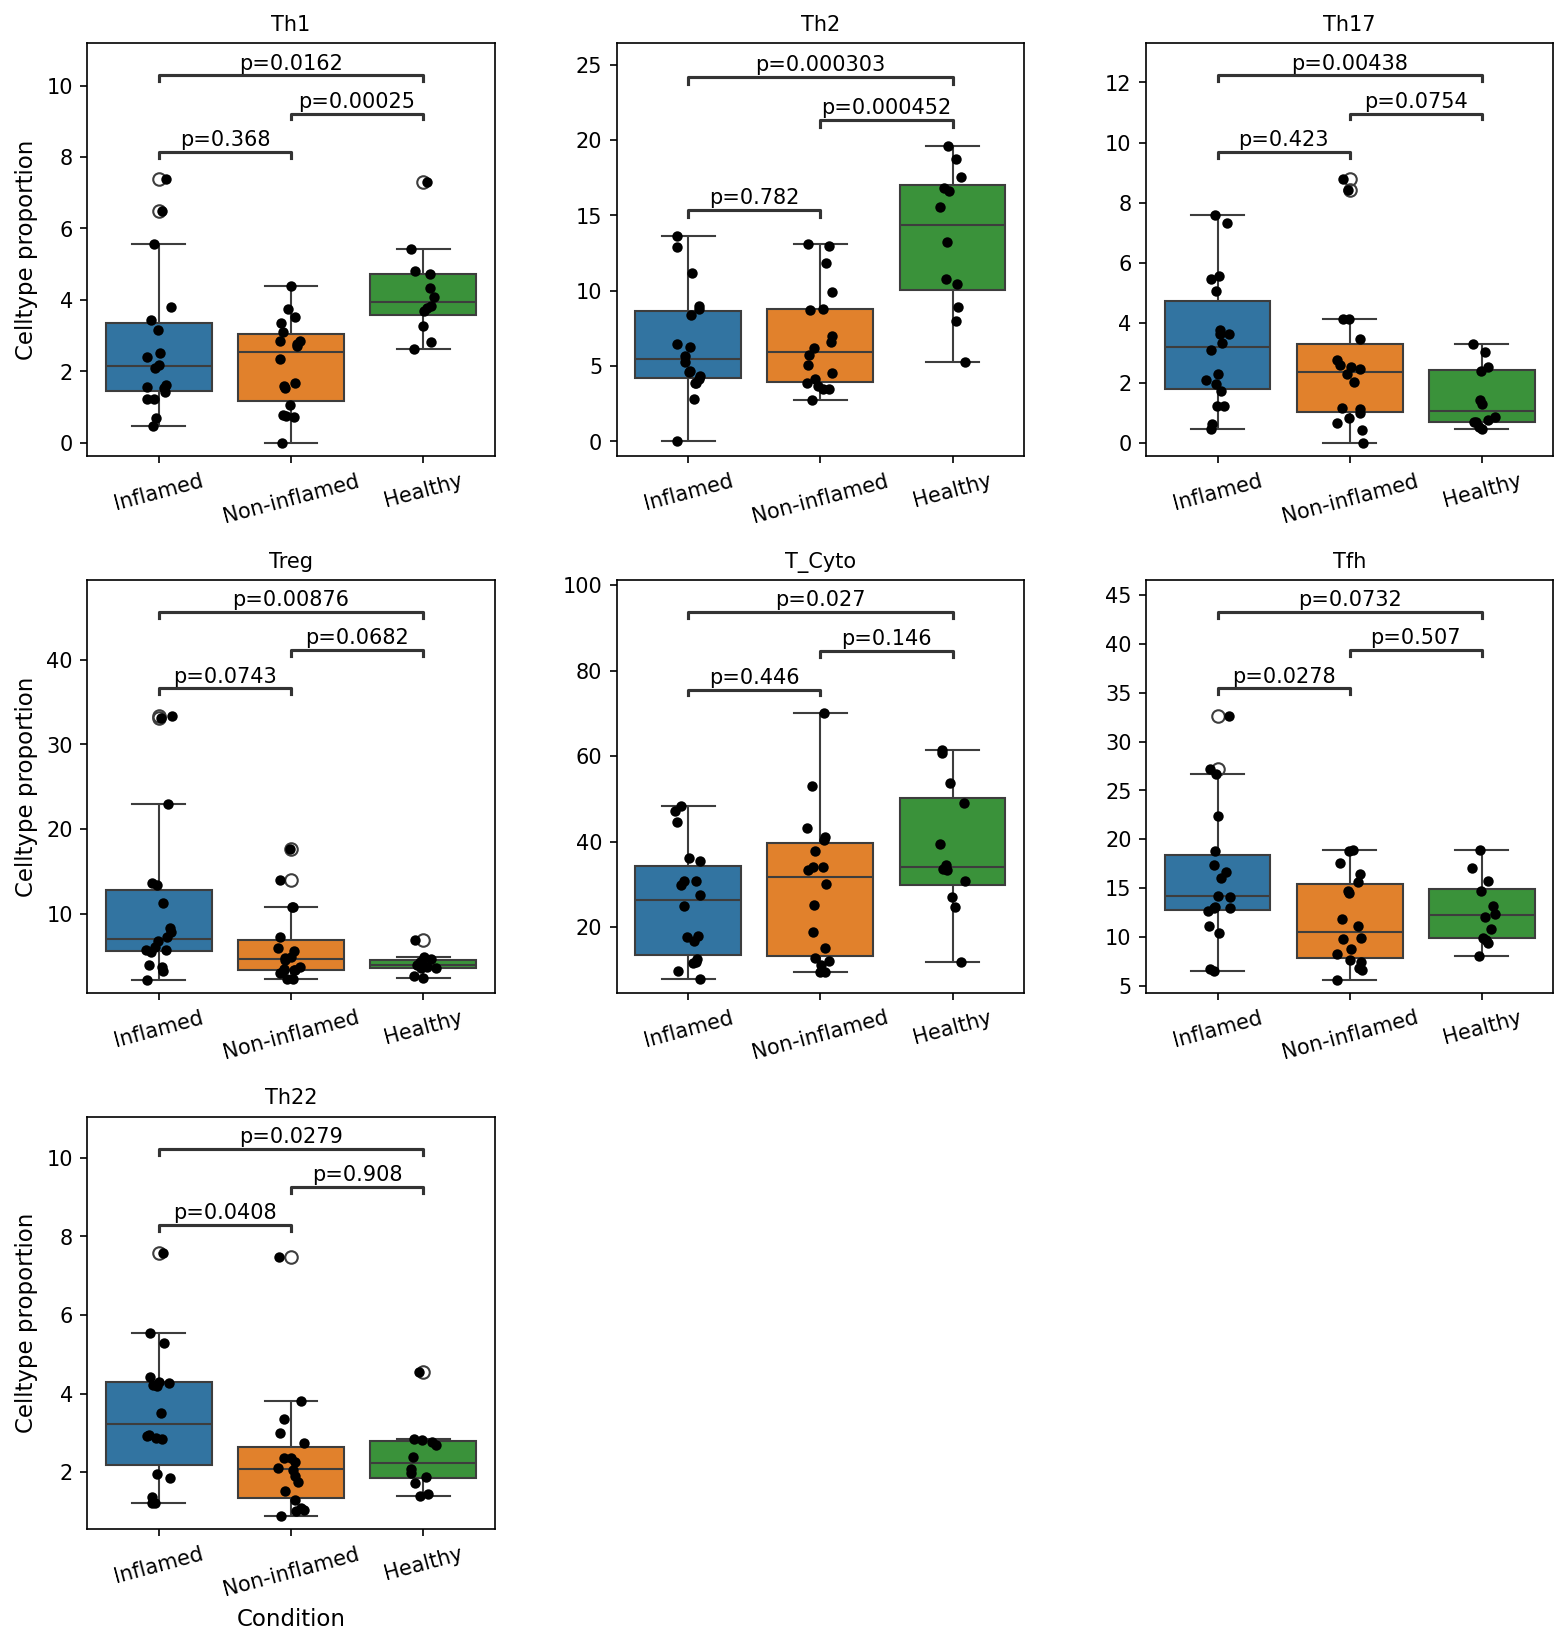
This analysis investigates the proportional representation of various T cell subsets (specifically T helper cell subtypes and cytotoxic T cells) across different conditions—Inflamed, Non-inflamed, and Healthy—within human colon tissue. Box plots illustrate the distribution of each T cell subset's proportion per condition, with statistical significance indicated for pairwise comparisons. The primary goal is to identify T cell population shifts that characterize inflammatory states, particularly relevant to Inflammatory Bowel Disease (IBD). The p-value cutoff for significance was set at 0.1.
Visual Summary
The box plots reveal distinct patterns of T cell subset proportions across the Inflamed, Non-inflamed, and Healthy conditions:
- Th1 cells: Proportions of Th1 cells are significantly lower in both Inflamed (median ~2.5%) and Non-inflamed (median ~2.5%) conditions compared to Healthy colon tissue (median ~4.5%). The difference between Inflamed and Healthy is highly significant (p=0.0162), as is the difference between Non-inflamed and Healthy (p=0.00025). No significant difference is observed between Inflamed and Non-inflamed.
- Th2 cells: Similar to Th1, Th2 cell proportions are significantly reduced in Inflamed (median ~6%) and Non-inflamed (median ~6%) conditions compared to Healthy tissue (median ~15%). The comparisons of Inflamed vs Healthy (p=0.000303) and Non-inflamed vs Healthy (p=0.000452) are both highly significant.
- Th17 cells: In contrast, Th17 cell proportions are significantly elevated in the Inflamed condition (median ~3.5%) compared to Healthy tissue (median ~1.5%, p=0.00438). There is also a marginal increase in Th17 cells in Non-inflamed tissue (median ~2.5%) compared to Healthy (p=0.0754). No significant difference is observed between Inflamed and Non-inflamed.
- Treg cells (Regulatory T cells): Treg proportions are significantly higher in the Inflamed condition (median ~7.5%) compared to Healthy tissue (median ~4%, p=0.00876). A marginal increase is also noted in Inflamed versus Non-inflamed tissue (median ~5.5%, p=0.0743).
- T_Cyto cells (Cytotoxic T cells): The proportion of cytotoxic T cells is significantly lower in Inflamed colon (median ~30%) compared to Healthy colon (median ~45%, p=0.027). No significant differences were found between Inflamed and Non-inflamed, or Non-inflamed and Healthy.
- Tfh cells (Follicular helper T cells): Tfh cell proportions are significantly higher in the Inflamed condition (median ~15%) compared to Non-inflamed (median ~10%, p=0.0278) and marginally higher compared to Healthy tissue (median ~12%, p=0.0732).
- Th22 cells: Proportions of Th22 cells are significantly increased in Inflamed tissue (median ~3.5%) compared to both Non-inflamed (median ~2%, p=0.0408) and Healthy (median ~2%, p=0.0279) conditions.
In summary, inflammatory conditions in the colon are associated with a reduction in Th1, Th2, and Cytotoxic T cell populations, alongside a notable increase in Th17, Treg, Tfh, and Th22 cell populations. These shifts are most pronounced when comparing Inflamed tissue to Healthy tissue, and in some cases, Inflamed tissue also differs significantly from Non-inflamed tissue.
Biological Interpretation
The observed shifts in T cell subset proportions provide key insights into the immune landscape of the inflamed colon, strongly aligning with known immunological changes in Inflammatory Bowel Disease (IBD).
- Shift towards Pro-inflammatory T helper responses:
- Decreased Th1 and Th2 cells: The significant reduction of both Th1 and Th2 cell proportions in inflamed and non-inflamed colon relative to healthy tissue is notable. While Th1 and Th2 responses are crucial for adaptive immunity, their downregulation could suggest a diversion of T cell differentiation pathways towards other helper subsets or their migration out of the tissue. In some contexts of chronic inflammation like IBD, the immune response shifts from a classical Th1/Th2 paradigm to more complex Th17/Th22 dominated responses.
- Increased Th17 and Th22 cells: The robust increase in Th17 and Th22 cell proportions in the Inflamed colon is a hallmark of chronic inflammation in IBD. Th17 cells are potent producers of pro-inflammatory cytokines such as IL-17, which are critical drivers of tissue damage and recruitment of neutrophils in intestinal inflammation. Th22 cells produce IL-22, a cytokine with dual roles, contributing to both mucosal barrier integrity and inflammatory responses, often associated with tissue repair or pathology in chronic inflammation [1]. This points to a highly activated inflammatory axis in the inflamed colon.
- Regulatory and Other Helper T cell dynamics:
- Increased Treg cells: The higher proportion of Treg cells in the Inflamed colon could represent a compensatory mechanism to control excessive inflammation. Tregs are essential for maintaining immune tolerance and suppressing effector T cell responses [2]. However, in chronic inflammatory settings like IBD, the function of these Tregs may be impaired, or their numbers might be insufficient to counteract the overwhelming pro-inflammatory signals.
- Increased Tfh cells: The elevated Tfh cell proportion in Inflamed tissue suggests enhanced B cell activation and potentially increased antibody production, which can contribute to local immune complex formation or autoantibody development observed in some IBD patients. Tfh cells provide crucial help to B cells in germinal centers, driving antibody class switching and affinity maturation.
- Decreased Cytotoxic T cells (T_Cyto): The significant reduction in cytotoxic T cells in the Inflamed colon compared to Healthy tissue is intriguing. While cytotoxic T cells are important for clearing infected or malignant cells, their diminished presence in the inflamed gut could imply tissue exhaustion, migration, or a shift in the primary immune effector mechanisms during chronic inflammation. Alternatively, this population might be highly activated and transiently present, or undergoing apoptosis, leading to an overall lower detected proportion.
Clinical or Translational Implications
These findings have several potential clinical and translational implications for managing Inflammatory Bowel Disease:
- Biomarker Potential: The distinct shifts in T cell subset proportions (e.g., increased Th17, Th22, Treg, Tfh, and decreased Th1, Th2, T_Cyto in inflammation) could serve as potential biomarkers for disease activity, severity, or response to therapy in IBD. Monitoring these cell populations in peripheral blood or tissue biopsies might offer insights into the inflammatory state.
- Therapeutic Targets: The dominant role of Th17 and Th22 cells in inflamed colon reinforces their established importance as therapeutic targets in IBD. Therapies aimed at neutralizing their effector cytokines (e.g., anti-IL-17, anti-IL-23/IL-12 which drives Th17 differentiation) or inhibiting their differentiation pathways are already in development or clinical use for IBD and other autoimmune diseases.
- Understanding Immune Dysregulation: The increase in Tregs in the face of active inflammation highlights the complex balance between pro-inflammatory and regulatory responses. Further studies on the functional capacity of these Tregs in inflamed tissue are warranted, as dysfunctional Tregs could contribute to chronic inflammation despite their increased numbers. Similarly, understanding the implications of increased Tfh cells could provide insights into B cell-mediated pathology in IBD.
- Disease Subtyping and Prognosis: Variations in these T cell signatures might correlate with specific IBD subtypes (Crohn's disease vs. Ulcerative Colitis) or predict disease course, helping to personalize treatment strategies.
References
- IL-22 in IBD: A PubMed search for "IL-22 Inflammatory Bowel Disease" provides extensive literature on its dual role. https://pubmed.ncbi.nlm.nih.gov/?term=IL-22+Inflammatory+Bowel+Disease
- Treg in IBD: Information on regulatory T cells and their role in immune tolerance and IBD pathogenesis can be found via PubMed. https://pubmed.ncbi.nlm.nih.gov/?term=Regulatory+T+cells+Inflammatory+Bowel+Disease
7. Macrophage Subset Population Shifts in Colon Inflammation
[Analysis Visualization Results]...
Analysis Overview
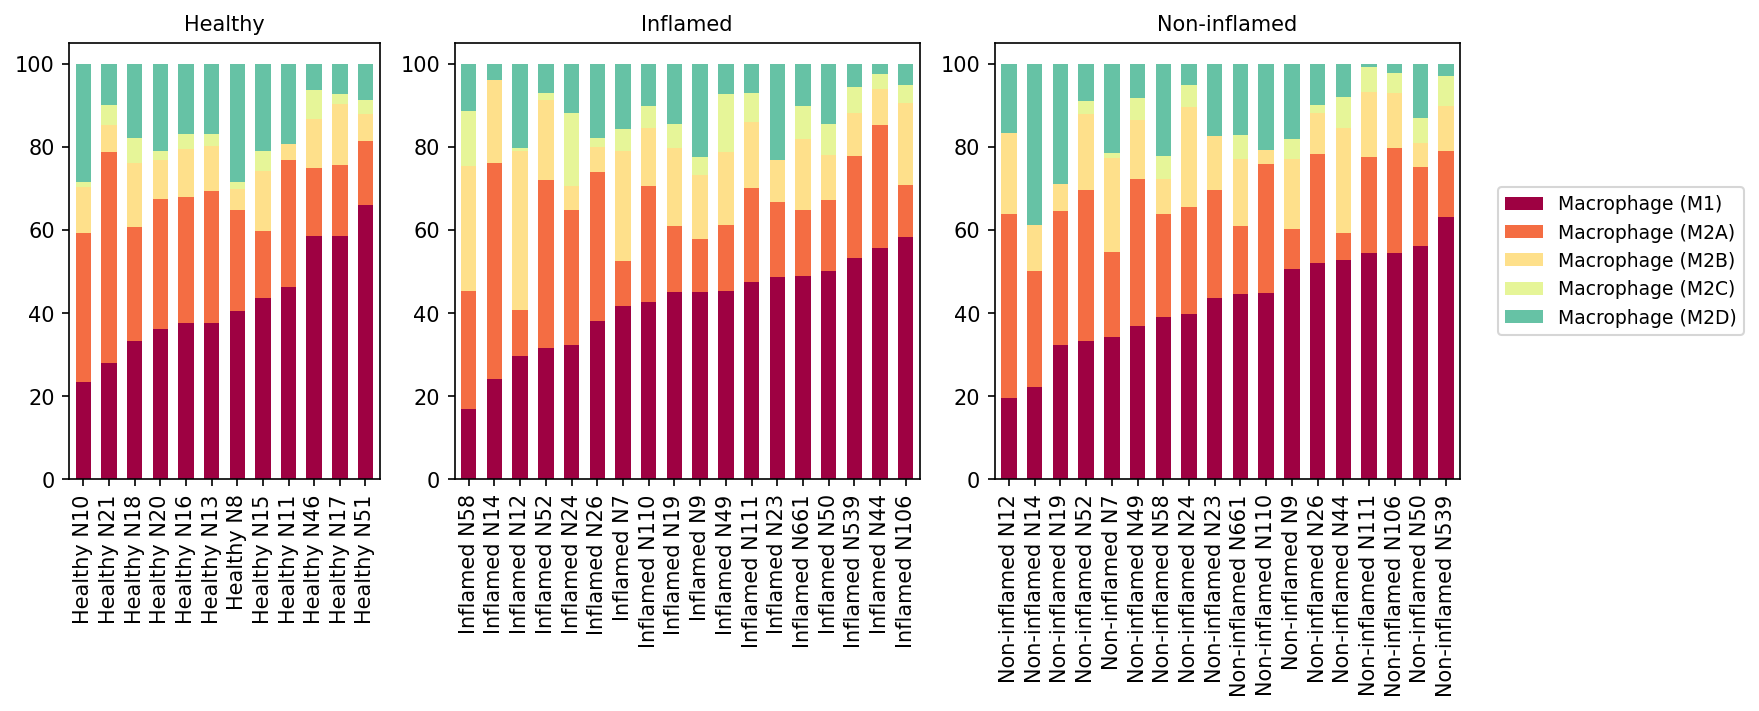
This analysis presents a population bar plot illustrating the relative proportions of various macrophage subsets (Macrophage M1, M2A, M2B, M2C, M2D) across individual samples from human colon tissue. Samples are grouped by their clinical condition: Healthy, Inflamed, and Non-inflamed. The plot aims to reveal shifts in macrophage polarization that may be associated with inflammatory states, particularly within the context of Inflammatory Bowel Disease (IBD) as inferred from the dataset.
Visual Summary
The visualization displays the percentage contribution of each macrophage subset to the total macrophage population within each sample.
- Macrophage (M1) Dominance in Inflamed and Non-inflamed Conditions: A striking observation is the significantly increased proportion of Macrophage (M1) cells (represented in maroon) in both "Inflamed" and "Non-inflamed" conditions compared to "Healthy" samples. In many "Inflamed" samples, M1 macrophages constitute 50-80% of the total macrophage population. While the healthy colon also contains M1 macrophages, their average proportion appears lower and more variable.
- Relative Reduction of M2 Subsets: Correspondingly, the proportions of several M2 macrophage subsets (M2A, M2B, M2C, M2D) appear to be relatively reduced in the "Inflamed" and "Non-inflamed" groups compared to "Healthy" samples, particularly M2D (teal), which occupies a larger fraction in Healthy samples. Macrophage (M2A) (orange) remains a considerable component in all conditions but appears proportionally smaller next to the expanded M1 population in diseased states.
- Similarity between Inflamed and Non-inflamed Profiles: Interestingly, the macrophage subset distribution in "Non-inflamed" samples often mirrors that of "Inflamed" samples, showing a sustained high proportion of M1 macrophages relative to healthy tissue.
Biological Interpretation
Macrophages are critical immune cells with diverse functions in the colon, ranging from immune surveillance and pathogen clearance to tissue repair and immune regulation. They can polarize into different functional phenotypes, commonly classified as M1 (pro-inflammatory) and M2 (anti-inflammatory, reparative, regulatory).
The observed shift towards a higher proportion of Macrophage (M1) in both "Inflamed" and "Non-inflamed" colon tissue strongly suggests a fundamental alteration in the immunological landscape associated with inflammatory processes. M1 macrophages are characterized by their ability to produce pro-inflammatory cytokines (e.g., TNF-α, IL-1β, IL-6, IL-12) and are crucial for initiating and sustaining immune responses against pathogens or cellular damage [PubMed: Macrophage polarization in inflammatory diseases]. Their enrichment in "Inflamed" tissue is consistent with their role in perpetuating chronic inflammation, a hallmark of IBD.
The finding that "Non-inflamed" colon samples also exhibit an elevated M1 macrophage population is particularly significant in the context of IBD. This could indicate that even macroscopically quiescent or non-inflamed regions in IBD patients are not truly "healthy" at a cellular level, potentially harboring a pre-activated or subclinical pro-inflammatory immune environment. This persistent pro-inflammatory skew, even in the absence of overt inflammation, might contribute to the chronic and relapsing nature of IBD. Conversely, the relative decrease in M2 subsets (which are typically associated with resolving inflammation and promoting tissue repair) could imply an impaired capacity for immune resolution and mucosal healing in IBD.
Clinical or Translational Implications
The distinct macrophage polarization profile observed in "Inflamed" and "Non-inflamed" conditions holds several potential clinical implications for IBD:
- Biomarker for Disease Activity: The proportion of M1 macrophages could serve as a valuable cellular biomarker for active inflammation or even subclinical inflammatory burden in IBD patients, potentially more sensitive than endoscopic assessment alone.
- Therapeutic Targeting: Understanding these shifts could inform novel therapeutic strategies. Modulating macrophage polarization, for example, by inhibiting M1 activation or promoting M2 differentiation, might offer new avenues for treating IBD [PubMed: Macrophage polarization and inflammatory bowel disease].
- Monitoring Treatment Response and Relapse Risk: Tracking macrophage subset ratios could provide insights into treatment efficacy and help predict the risk of relapse in patients in remission, especially in "Non-inflamed" areas. Persistent M1 dominance in "Non-inflamed" tissue might indicate a higher risk of future flare-ups.
- Personalized Medicine: Differences in macrophage responses between individuals could also contribute to the heterogeneous disease course of IBD, suggesting potential for personalized approaches based on a patient's macrophage polarization profile.
8. Differential Macrophage Subset Proportions in Colon across Inflammatory Conditions
[Analysis Visualization Results]...
Analysis Overview
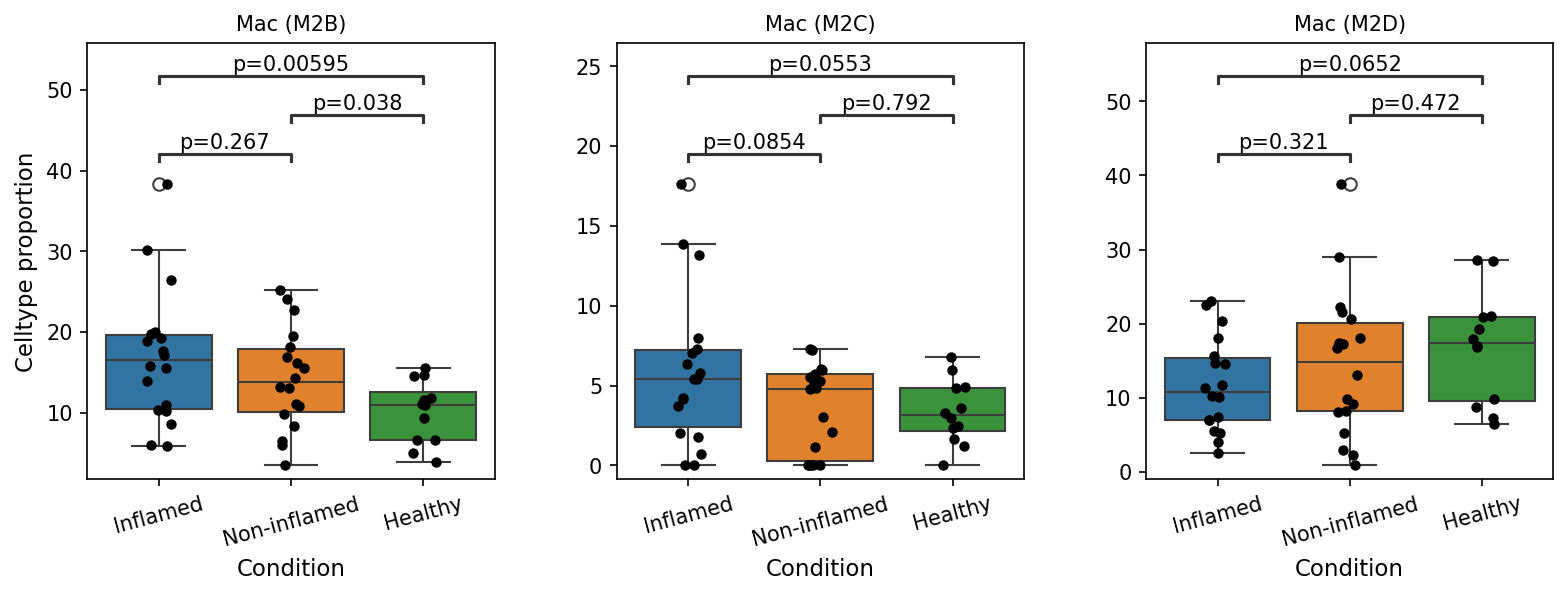
This analysis presents box plots illustrating the celltype proportion of specific macrophage subsets (M2B, M2C, and M2D) in human colon tissue across three conditions: Inflamed, Non-inflamed, and Healthy. The goal is to identify statistically significant differences in the abundance of these subsets between the conditions, particularly in the context of Inflammatory Bowel Disease (IBD), as inferred from the dataset. Statistical significance was determined using a p-value cutoff of 0.1.
Visual Summary
The box plots display the distribution of celltype proportions for three macrophage subsets: Mac (M2B), Mac (M2C), and Mac (M2D), across the three conditions. Individual data points are overlaid on each box plot as a stripplot. P-values indicate the significance of differences between specific condition pairs.
Mac (M2B)
- The proportion of Mac (M2B) cells is significantly higher in both Inflamed (p=0.00595) and Non-inflamed (p=0.038) conditions compared to Healthy.
- There is no statistically significant difference in Mac (M2B) proportion between Inflamed and Non-inflamed conditions (p=0.267).
- The median proportion for M2B appears highest in the Inflamed group, followed by Non-inflamed, and lowest in Healthy.
Mac (M2C)
- The proportion of Mac (M2C) cells is significantly higher in the Inflamed condition compared to both Non-inflamed (p=0.0854) and Healthy (p=0.0553) conditions.
- There is no statistically significant difference in Mac (M2C) proportion between Non-inflamed and Healthy conditions (p=0.792).
- The median proportion for M2C is highest in the Inflamed group.
Mac (M2D)
- The proportion of Mac (M2D) cells is significantly lower in the Inflamed condition compared to Healthy (p=0.0652).
- There is no statistically significant difference in Mac (M2D) proportion between Inflamed and Non-inflamed (p=0.321) or between Non-inflamed and Healthy (p=0.472).
- The median proportion for M2D appears lowest in the Inflamed group, with similar higher proportions in Non-inflamed and Healthy conditions.
Biological Interpretation
Macrophages are critical immune cells with diverse functions, broadly categorized into M1 (pro-inflammatory) and M2 (anti-inflammatory, pro-resolving, tissue repair) phenotypes, though in vivo, they often exhibit a spectrum of mixed phenotypes. The M2 subtype itself is heterogeneous, with various subsets (e.g., M2a, M2b, M2c, M2d) playing distinct roles. The observed shifts in macrophage subset proportions in the colon tissue across inflammatory conditions provide insights into the underlying immune responses in IBD.
- Increased Mac (M2B) in Inflamed and Non-inflamed conditions: M2B macrophages are known to be induced by immune complexes and Toll-like receptor (TLR) agonists. They produce both pro-inflammatory cytokines (e.g., IL-6, TNF-α) and anti-inflammatory cytokines (e.g., IL-10), indicating a complex regulatory role. Their elevation in both Inflamed and even Non-inflamed tissues (relative to Healthy) suggests a persistent alteration in macrophage composition even in seemingly quiescent areas of IBD, potentially involved in initiating or sustaining immune dysregulation, or attempting to resolve chronic inflammation. The lack of significant difference between Inflamed and Non-inflamed might imply a sustained M2B response once the disease process is established, regardless of acute flare-up.
- PubMed search: M2b macrophages IBD
- Increased Mac (M2C) in Inflamed condition: M2C macrophages are typically induced by glucocorticoids and IL-10, characterized by high expression of CD163 and CD206, and are involved in apoptotic cell clearance, immune suppression, and tissue remodeling. The significant increase of M2C in actively Inflamed tissue suggests their recruitment or differentiation to manage tissue damage, clear debris, and potentially dampen excessive inflammation. However, in chronic inflammatory conditions like IBD, sustained M2C activation can also contribute to fibrosis and impaired resolution of inflammation.
- GeneCards: CD163
- PubMed search: M2c macrophages IBD
- Decreased Mac (M2D) in Inflamed condition: M2D macrophages, also known as tumor-associated macrophages (TAM)-like or "regulatory" macrophages, are typically induced by IL-6 and adenosine, expressing high levels of CXCR4 and contributing to angiogenesis and immune tolerance. Their significant *decrease* in actively Inflamed colon tissue is an interesting finding. This might suggest a shift away from a pro-angiogenic or immune-tolerogenic macrophage phenotype during acute inflammation, possibly favoring other macrophage subsets or representing a failure to maintain this phenotype in the highly inflammatory microenvironment. This could imply a disruption of immune-regulatory pathways typically associated with M2D.
- GeneCards: CXCR4
- PubMed search: M2d macrophages IBD
Clinical or Translational Implications
The differential shifts in macrophage subsets observed between healthy, non-inflamed, and inflamed colon tissues highlight the dynamic role of these cells in IBD pathogenesis.
- Biomarkers of Disease Activity: The significant increase of Mac (M2B) in both Inflamed and Non-inflamed states suggests M2B cells might serve as markers reflecting the overall disease status, not just acute flares. Mac (M2C), specifically elevated during active inflammation, could be a more specific indicator of active inflammatory processes. Conversely, the decrease in Mac (M2D) during inflammation could reflect a distinct pathological state. Monitoring these shifts could offer valuable insights into disease progression or response to therapy.
- Therapeutic Targets: Understanding the specific functions of these macrophage subsets in IBD could lead to targeted therapeutic strategies. For instance, modulating the balance between pro- and anti-inflammatory roles of M2B and M2C macrophages, or influencing the differentiation and survival of M2D cells, might offer novel approaches to managing inflammation and promoting tissue repair in IBD.
- Understanding IBD Heterogeneity: The distinct patterns for M2B, M2C, and M2D subsets emphasize the functional diversity within M2 macrophages and underscore the importance of sub-typing macrophages rather than broadly categorizing them. This fine-grained understanding is crucial for developing personalized medicine approaches for IBD, considering the varied clinical presentations and responses to treatment.
9. Cell-Cell Interaction Patterns in Healthy, Inflamed, and Non-inflamed Colon Tissue
[Analysis Visualization Results]...
Analysis Overview
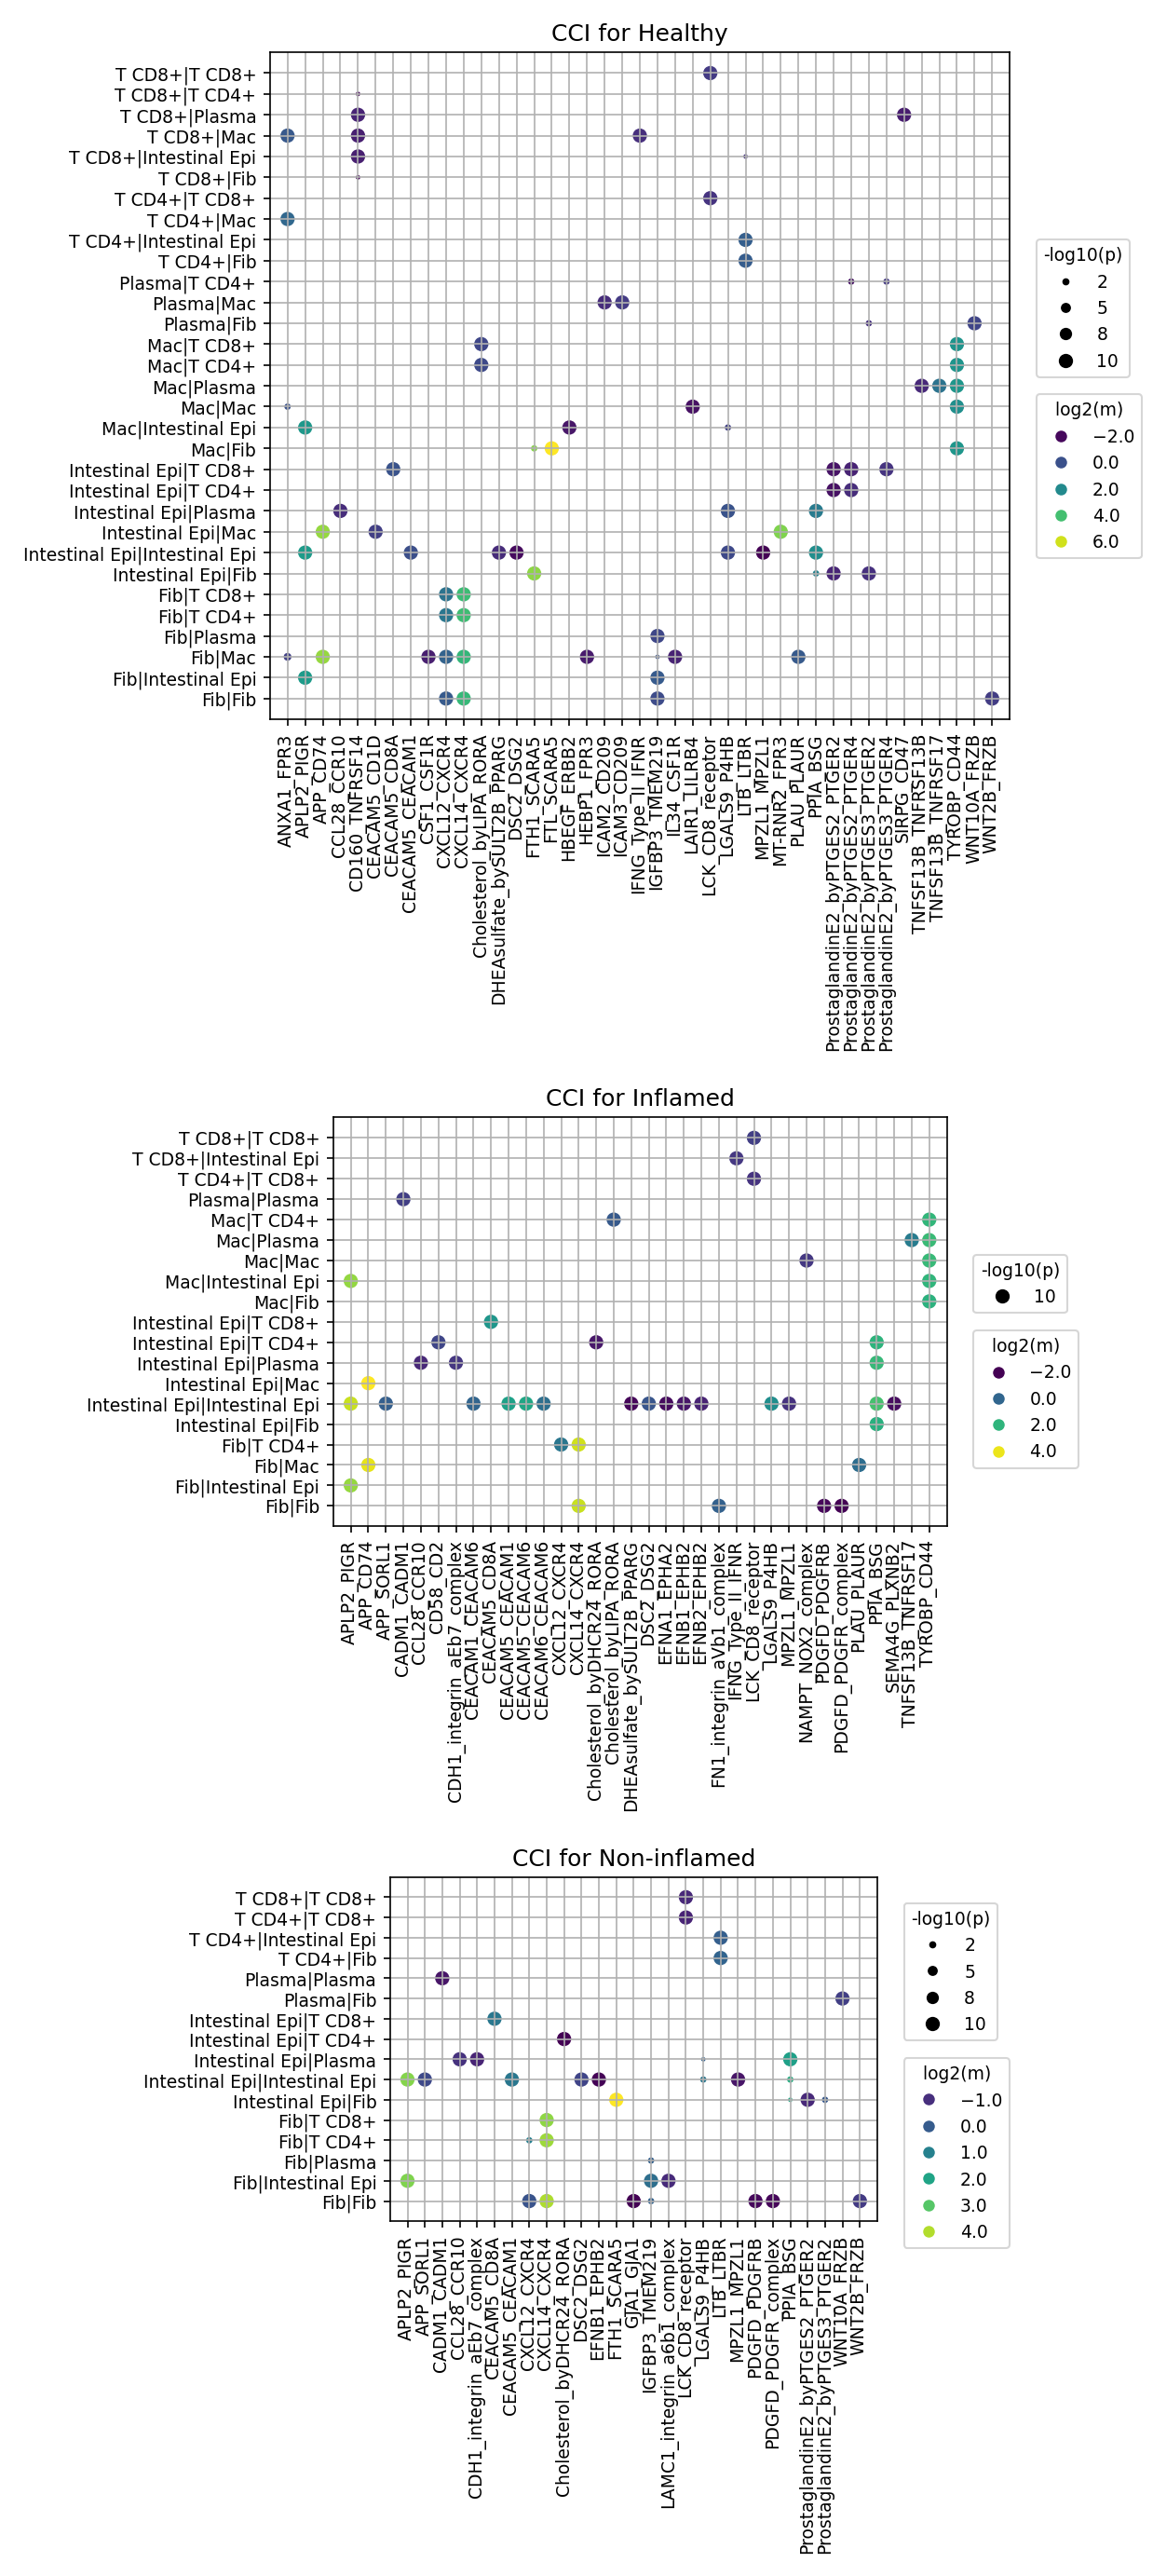
This analysis visualizes cell-cell interaction (CCI) patterns across different conditions (Healthy, Inflamed, Non-inflamed) in human colon tissue, derived from single-cell RNA sequencing data. The results, generated using CellPhoneDB, highlight significant ligand-receptor interactions between various cell types. Each dot plot displays the top 80 most significant cell-cell communication events (cell pair - ligand-receptor pair combinations) for each condition, ordered by an unspecified metric which typically prioritizes significance and/or strength. The size of each dot corresponds to the negative logarithm of the interaction p-value (-log10(p)), indicating statistical significance, while the color intensity represents the log2(mean) expression level of the interacting ligand-receptor pair, reflecting interaction strength.
Visual Summary
The three dot plots provide a comprehensive view of cell-cell communication dynamics across the three distinct conditions:
- General Patterns: Each plot features cell-cell pairs on the y-axis and specific ligand-receptor interactions on the x-axis. The interaction landscape is highly dynamic, with distinct patterns emerging in each condition.
- Healthy Condition: This plot serves as a baseline, showing a diverse set of interactions that likely contribute to colon homeostasis and immune surveillance. Key interactions involve Intestinal Epithelial cells (Intestinal Epi) communicating with T cells, Macrophages (Mac), and other Intestinal Epithelial cells, as well as Fibroblasts (Fib) interacting with immune cells.
- Inflamed Condition: This plot exhibits a marked increase in the number, significance (larger dot sizes), and strength (more vibrant yellow/green colors) of interactions compared to the Healthy state. Several prominent interactions, particularly those involving Macrophages, Fibroblasts, and Intestinal Epithelial cells, appear highly active. This suggests a robust inflammatory response and significant tissue remodeling.
- Non-inflamed Condition: The interaction profile for the Non-inflamed condition appears distinct from both Healthy and Inflamed. While some interactions persist, the overall intensity and number seem reduced compared to the Inflamed state, suggesting a quiescent or resolved inflammatory phase. However, certain unique or proportionally stronger interactions are visible, potentially indicating ongoing tissue repair or a specific immunoregulatory state.
Biological Interpretation
The observed cell-cell interaction patterns provide significant biological insights into the dynamics of colon inflammation, particularly in the context of Inflammatory Bowel Disease (IBD).
Key Findings Across Conditions:
- Inflamed Colon Exhibits Enhanced Pro-inflammatory and Remodeling Interactions:
- SPP1-CD44 (Osteopontin-CD44 Axis): This interaction is notably strong and highly significant in the Inflamed condition, involving multiple cell pairs such as Mac|Intestinal Epi, Mac|Mac, Mac|Fib, Fib|Intestinal Epi, and T CD4+|Intestinal Epi. SPP1 (Osteopontin) is a well-established cytokine involved in inflammation, immune cell recruitment, and tissue fibrosis, making its upregulation a hallmark of active inflammation. GeneCards: SPP1, GeneCards: CD44
- CXCL12-CXCR4 Axis: This chemokine signaling pathway, critical for immune cell trafficking and retention, shows strong activity in the Inflamed colon, particularly within Mac|Mac, T CD8+|Intestinal Epi, and T CD4+|Intestinal Epi interactions. This suggests increased recruitment and positioning of immune cells in the inflamed microenvironment. GeneCards: CXCL12, GeneCards: CXCR4
- Prostaglandin E2 (by PTGES2)-PTGER2 Signaling: Interactions involving Prostaglandin E2, a potent lipid mediator of inflammation, are highly significant and strong in the Inflamed state, especially in Mac|Mac, Intestinal Epi|Intestinal Epi, and Plasma|Mac pairs. This highlights the role of prostaglandins in orchestrating local inflammatory responses. PubMed Search: Prostaglandin E2 inflammation colon
- PDGFA-PDGFRA (Platelet-Derived Growth Factor Axis): Prominent in Fib|Fib, Fib|Intestinal Epi, and Mac|Fib interactions in the Inflamed condition, this pathway is crucial for fibroblast activation, proliferation, and extracellular matrix remodeling, suggesting ongoing fibrosis and tissue repair processes that can become pathological in chronic inflammation. GeneCards: PDGFA, GeneCards: PDGFRA
- CEACAM Interactions: Carcinoembryonic antigen-related cell adhesion molecules (e.g., CEACAM1, CEACAM5) show dynamic patterns. While present in all conditions, their specific partners and strengths change, indicating altered adhesion and immune modulatory roles during inflammation (e.g., CEACAM5-CEACAM1 in Intestinal Epi|Intestinal Epi, Mac|Mac, Mac|Intestinal Epi).
- Cell Type Specific Contributions to Inflammation:
- Macrophages and Fibroblasts: These cell types emerge as central orchestrators of inflammation and remodeling in the Inflamed colon, engaging in numerous highly significant and strong interactions, particularly with each other and with Intestinal Epithelial cells.
- Intestinal Epithelial Cells: The Intestinal Epithelial barrier actively participates in inflammation, interacting extensively with both immune and stromal cells, reflecting its role in both sensing and responding to inflammatory signals.
- Plasma Cells and T cells: These adaptive immune cells show condition-specific interactions, indicating their involvement in humoral and cellular immunity, respectively, during colon inflammation. The TNFSF13B-TNFRSF13B (BAFF-BAFFR) axis, critical for B cell survival and plasma cell maintenance, is observed in Intestinal Epi|Plasma and Plasma|Plasma interactions in both Healthy and Inflamed conditions, suggesting its ongoing role in humoral immunity.
- Non-inflamed Condition Reveals Distinct Metabolic and Maintenance Signals:
- The Non-inflamed condition, while showing fewer strong inflammatory signals compared to the Inflamed state, highlights specific interactions. Notably, Cholesterol-related interactions (Cholesterol_byDHCR24_RORA, Cholesterol_byLIPA_RORA) appear in Intestinal Epi|Intestinal Epi and Intestinal Epi|Plasma pairs. This might suggest metabolic adaptations or distinct homeostatic mechanisms during a non-inflammatory or quiescent state.
- The persistence of certain interactions like Prostaglandin E2 signaling (e.g., Fib|Fib, Fib|T CD4+) in the Non-inflamed state, albeit at different strengths or with different partners, suggests that some pathways involved in modulating inflammation or tissue repair might still be active, perhaps in a resolution or maintenance capacity.
Clinical or Translational Implications
The differential cell-cell interaction patterns observed across Healthy, Inflamed, and Non-inflamed conditions in colon tissue offer potential avenues for clinical and translational applications related to IBD:
- Therapeutic Target Identification:
- Highly upregulated and significant interactions in the Inflamed state, such as SPP1-CD44, CXCL12-CXCR4, and PDGFA-PDGFRA, represent promising therapeutic targets for mitigating inflammation and fibrosis in IBD. Blocking these interactions could reduce immune cell infiltration, inflammatory signaling, and pathological tissue remodeling.
- Interactions involving Prostaglandin E2 signaling could be targeted to reduce pro-inflammatory mediator production, aligning with existing anti-inflammatory strategies.
- Biomarker Discovery:
- The specific ligand-receptor pairs and the cell types engaged in these interactions during inflammation could serve as biomarkers for disease activity, prognosis, or response to therapy in IBD. For instance, increased SPP1-CD44 interactions in specific cell populations might indicate active inflammatory flares or fibrosis.
- Understanding Disease Pathogenesis:
- These findings deepen our understanding of the complex cellular crosstalk driving IBD pathogenesis. The interplay between epithelial, immune, and stromal cells via specific signaling axes provides a framework for investigating disease mechanisms at a multicellular level. For example, the strong communication between Macrophages, Fibroblasts, and Intestinal Epithelial cells underscores their coordinated roles in driving chronic inflammation and tissue damage.
- Experimental Validation:
- The identified ligand-receptor pairs and cell-cell communication networks provide clear hypotheses for experimental validation. *In vitro* co-culture experiments, *ex vivo* organoid models, or *in vivo* animal models using specific inhibitors or genetic knockouts for these pathways could confirm their functional relevance in IBD pathology and explore their therapeutic potential.
10. Condition-Specific Cell-Cell Interaction Patterns in Human Colon: Implications for IBD
[Analysis Visualization Results]...
Analysis Overview
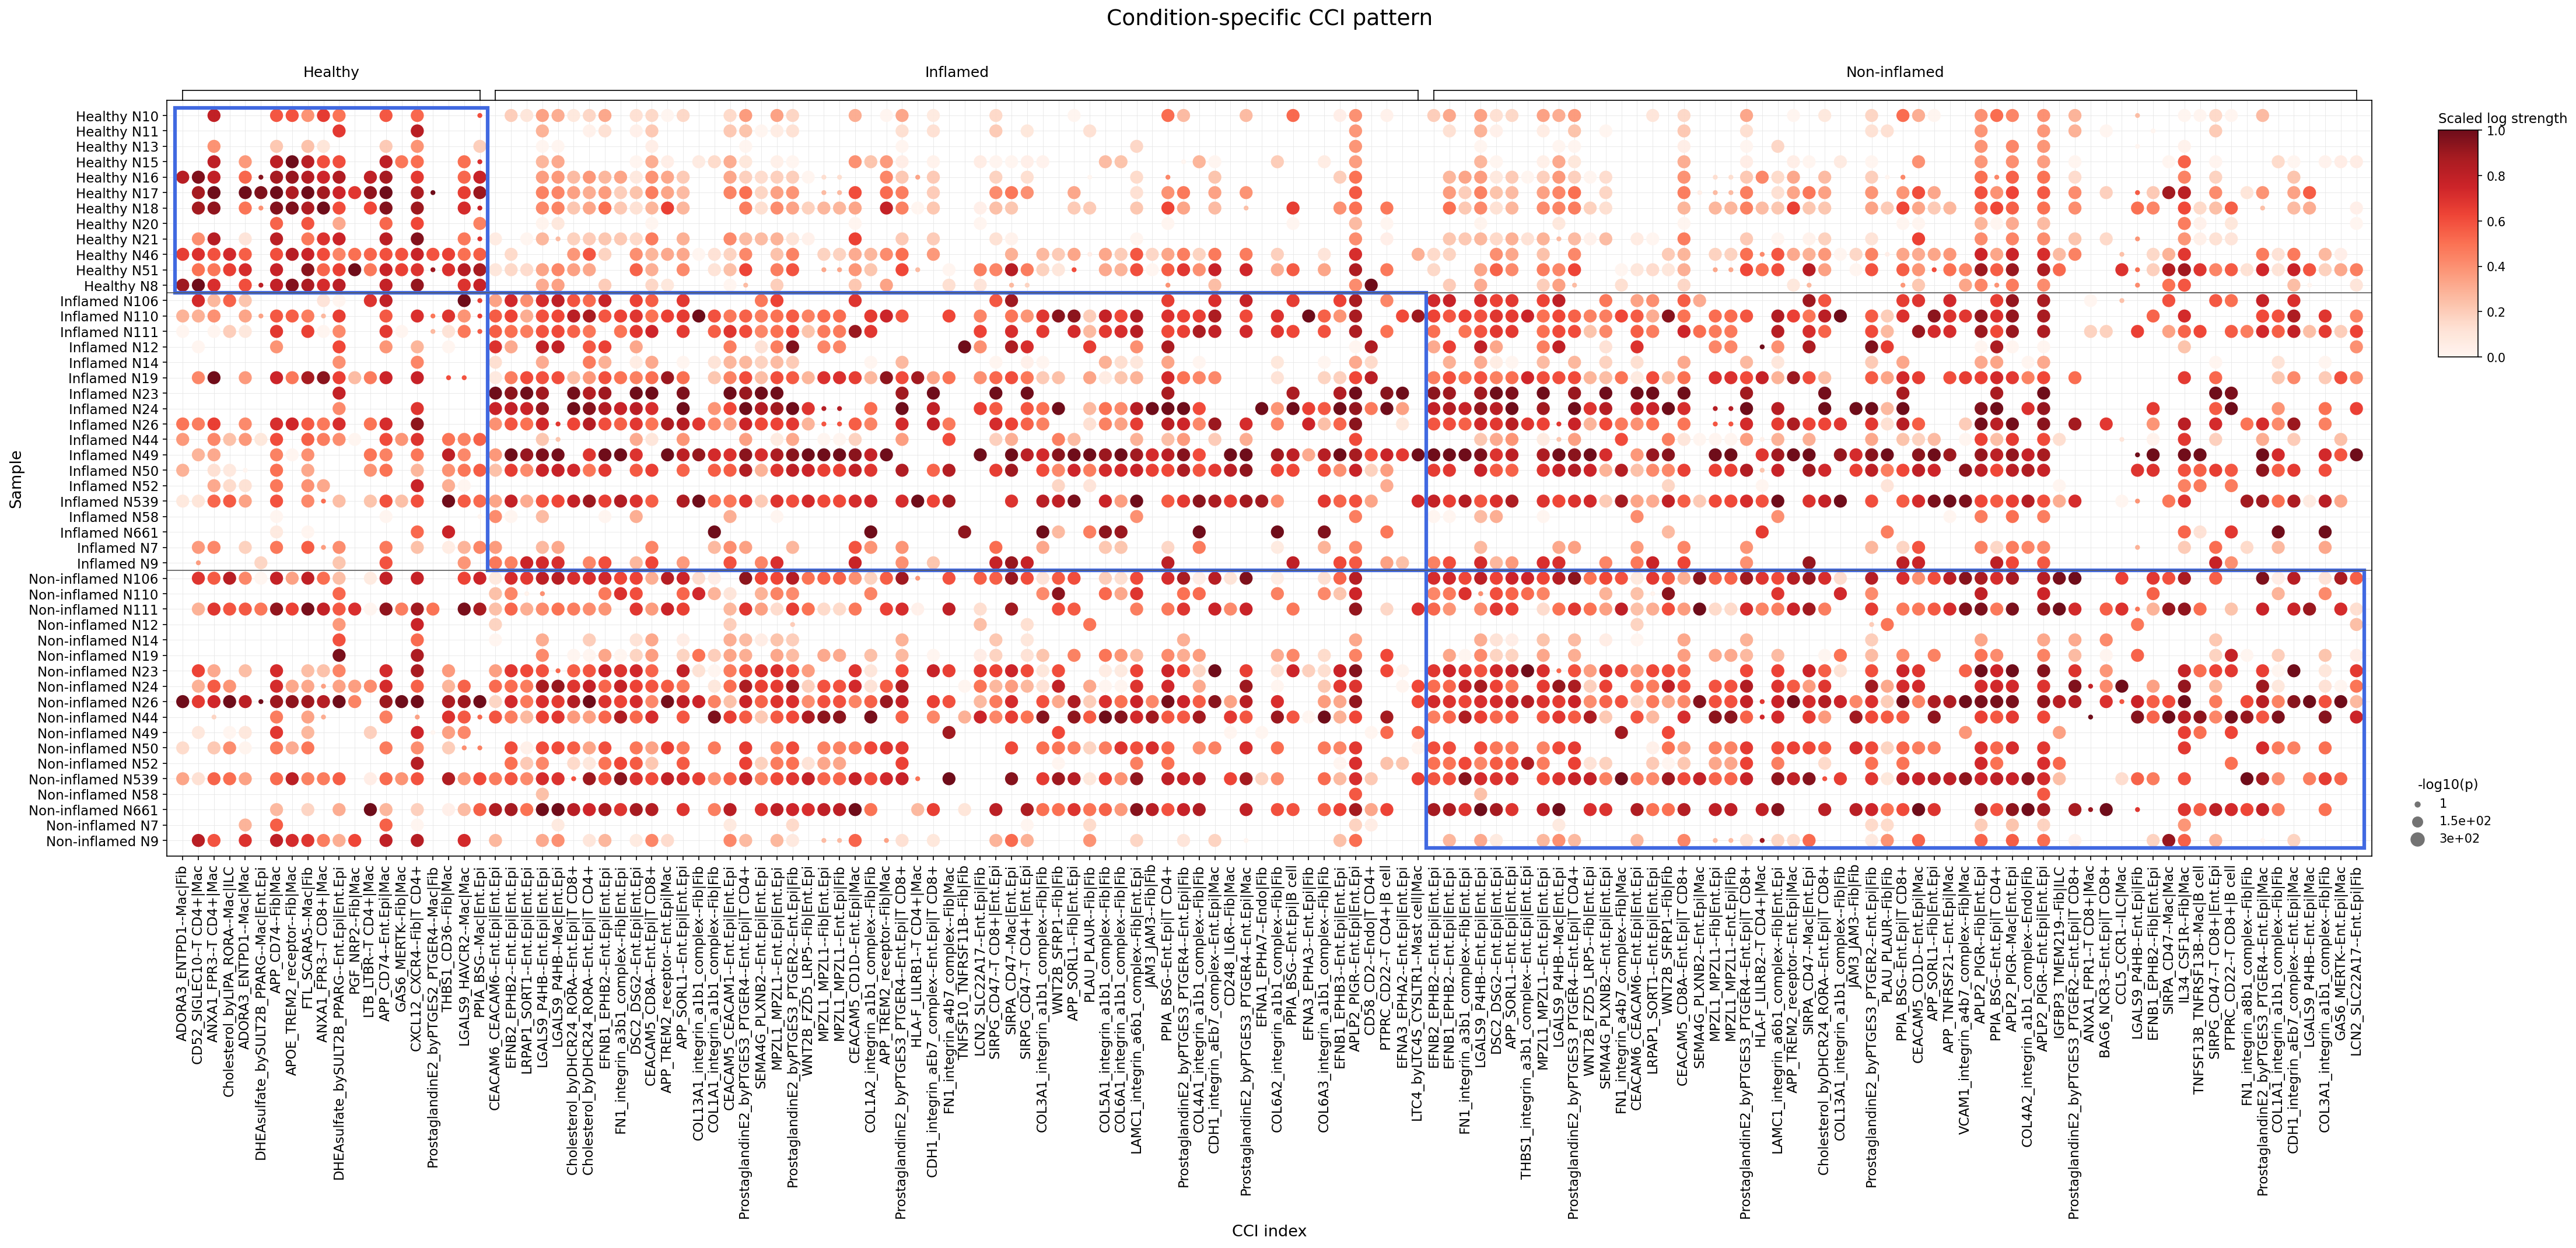
This analysis investigates condition-specific cell-cell interaction (CCI) patterns using CellPhoneDB, comparing 'Healthy', 'Inflamed', and 'Non-inflamed' conditions in human colon tissue. The dot plot visualizes the strength and significance of interactions between major immune and stromal cell types (B cell, T cell, Myeloid cell, Mast cell, Stromal cell, Intestinal Epithelial cell, Endothelial cell) across individual samples. Each dot represents a unique ligand-receptor pair interaction between two cell types (e.g., ADORA3_ENTPD1--Mac|Fib). The color intensity of each dot indicates the scaled log strength of the interaction, while the size of the dot represents its statistical significance (-log10(p-value)). The goal is to identify CCIs that are differentially regulated across inflammatory states, providing insights into potential mechanisms driving Inflammatory Bowel Disease (IBD) pathogenesis.
Visual Summary
The dot plot reveals distinct patterns of cell-cell interactions across the three conditions: Healthy, Inflamed, and Non-inflamed.
- Overall Pattern: A general increase in the number and strength of significant interactions is observed in both the 'Inflamed' and 'Non-inflamed' conditions compared to 'Healthy' samples. The 'Healthy' condition generally shows sparser, less intense interactions for many pairs compared to the other two conditions.
- Healthy Condition (Leftmost blue box): This group displays a cluster of strong and significant interactions, particularly involving chemokine signaling (e.g., CXCL12-CXCR4--Fib|T CD4+), adhesion molecules (e.g., VCAM1_integrin_a4b1_complex--Fib|Mac), and lipid metabolism-related interactions (e.g., Cholesterol_by_LIPA_RORA--Mac|Ent.Epi, DHEA_sulfate_by_SULT2B_PPARG--Mac|Ent.Epi). These interactions likely represent baseline homeostatic processes within the healthy colon microenvironment, potentially supporting immune surveillance and tissue integrity.
- Inflamed Condition (Middle section): Samples from the 'Inflamed' condition exhibit a broad and robust activation of numerous CCIs. There is a noticeable enrichment of strong and significant interactions involving Prostaglandin E2 (PGE2) signaling (e.g., ProstaglandinE2_by_PTGES3_PTGER4--Ent.Epi|T CD8+, ProstaglandinE2_by_PTGES3_PTGER2--Ent.Epi|T CD4+). Additionally, various integrin-mediated adhesion pathways (e.g., FN1_integrin_a6b7_complex--Fib|Ent.Epi, COL1A1_integrin_a1b1_complex--Fib|Fib, VCAM1_integrin_a4b1_complex--Fib|Mac), and interactions involving CEACAM6 are highly active. This pattern suggests a heightened state of immune activation, cell trafficking, and tissue remodeling characteristic of active inflammation.
- Non-inflamed Condition (Rightmost blue box, bottom right): The 'Non-inflamed' samples also show a substantial number of strong and significant CCIs, often overlapping with those observed in the 'Inflamed' group. Many ProstaglandinE2 and integrin-mediated interactions remain highly active. However, there are also some distinct clusters, or interactions that are more consistently strong across 'Non-inflamed' samples compared to 'Inflamed' (e.g., COL6A1_integrin_a1b1_complex--Fib|Fib, LAMC1_integrin_a6b7_complex--Fib|T CD8+). This suggests that 'Non-inflamed' might represent a state of ongoing low-grade inflammation or a resolving phase where certain inflammatory circuits persist.
Biological Interpretation
The differential CCI patterns highlight key biological processes modulated during colon inflammation, consistent with the inferred context of Inflammatory Bowel Disease (IBD).
- Prostaglandin E2 (PGE2) Signaling in Inflammation:
- Interactions: ProstaglandinE2_by_PTGES3_PTGER4--Ent.Epi|T CD8+, ProstaglandinE2_by_PTGES3_PTGER2--Ent.Epi|T CD4+, and similar interactions involving Enterocytes (Ent.Epi) and T cells are strongly elevated in both 'Inflamed' and 'Non-inflamed' conditions.
- Mechanisms: Prostaglandin E2 (PGE2), synthesized by prostaglandin E synthases (like PTGES3) and acting through G protein-coupled receptors (PTGER2/EP2, PTGER4/EP4), is a potent lipid mediator with complex roles in inflammation. In the context of IBD, PGE2 can both promote and resolve inflammation depending on the specific receptor activated and cellular context. EP2 and EP4 receptors are often associated with anti-inflammatory or immunosuppressive effects, while EP1 and EP3 can be pro-inflammatory. Their sustained activation could reflect an attempt to modulate inflammation or a persistent inflammatory signal [Source: PubMed search for "PGE2 IBD EP2 EP4"].
- Cell types: Enterocytes play a critical role in gut barrier function and can produce inflammatory mediators. T cells are central to adaptive immunity, and PGE2 can modulate their proliferation, cytokine production, and differentiation. The observed interactions suggest active communication between epithelial cells and T cells via PGE2, potentially influencing the inflammatory milieu.
- Integrin-Mediated Adhesion and Immune Cell Trafficking:
- Interactions: Numerous integrin-ligand pairs, such as FN1_integrin_a6b7_complex--Fib|Ent.Epi, COL1A1_integrin_a1b1_complex--Fib|Fib, LAMC1_integrin_a6b7_complex--Fib|T CD8+, and VCAM1_integrin_a4b1_complex--Fib|Mac, are highly prominent in 'Inflamed' and 'Non-inflamed' conditions.
- Mechanisms: Integrins are heterodimeric cell surface receptors that mediate cell-cell and cell-extracellular matrix (ECM) adhesion. They are crucial for immune cell recruitment to inflammatory sites, tissue remodeling, and maintaining epithelial barrier integrity.
- FN1 (Fibronectin) and Integrin_a6b7: Integrin α6β7 is key for lymphocyte homing to the gut, binding to MAdCAM-1 on endothelial cells and fibronectin (FN1) in the ECM. Its upregulation signifies increased immune cell recruitment and retention in inflamed tissues [Source: UniProt: Integrin alpha-6, Integrin beta-7].
- COL1A1 (Collagen Type I) and Integrin_a1b1: Collagen is a major ECM component. Interactions with integrins like α1β1 are important for fibroblast activation, tissue repair, and fibrosis, which are common features in chronic IBD [Source: GeneCards: COL1A1].
- VCAM1 (Vascular Cell Adhesion Molecule 1) and Integrin_a4b1: VCAM1 is expressed on activated endothelial cells and stromal cells and mediates adhesion of leukocytes (e.g., macrophages, lymphocytes) via integrin α4β1, facilitating their extravasation into inflamed tissues. Its robust activity in inflamed states points to active immune cell infiltration [Source: GeneCards: VCAM1].
- Cell types: Fibroblasts, Enterocytes, and Macrophages play crucial roles in tissue structure, repair, and immune responses. The enhanced integrin signaling indicates significant alterations in cell adhesion and migration dynamics within the inflamed colon.
- Chemokine Signaling and Immune Cell Homing:
- Interaction: CXCL12_CXCR4--Fib|T CD4+ shows strong activity, particularly noticeable in 'Healthy' samples but also present in 'Inflamed' and 'Non-inflamed'.
- Mechanisms: The CXCL12-CXCR4 axis is a critical chemokine signaling pathway involved in immune cell trafficking, tissue repair, and angiogenesis. While essential for homeostatic functions, dysregulation can contribute to chronic inflammation and fibrosis in IBD [Source: PubMed search for "CXCL12 CXCR4 IBD"]. Its consistent presence across conditions highlights its fundamental role in colon immunity.
- CEACAM6 Homotypic and Heterotypic Interactions:
- Interaction: CEACAM6_CEACAM6--Ent.Epi|Ent.Epi and CEACAM6_CEACAM5--Ent.Epi|Ent.Epi are highly active, especially in 'Inflamed' and 'Non-inflamed' conditions.
- Mechanisms: Carcinoembryonic antigen-related cell adhesion molecule 6 (CEACAM6) is a glycoprotein involved in cell adhesion, signaling, and immune modulation. It is often overexpressed in various cancers and inflammatory conditions, including IBD. CEACAM6 can promote cell survival and dampen inflammatory responses, but its persistent high activity in inflammation might also contribute to pathological epithelial changes [Source: GeneCards: CEACAM6].
- Galectin-9 (LGALS9) Signaling:
- Interactions: LGALS9_P4HB--Ent.Epi|Mac and LGALS9_P4HB--Ent.Epi|Ent.Epi show increased activity in inflamed and non-inflamed states.
- Mechanisms: Galectin-9 (LGALS9) is a secreted β-galactoside-binding lectin that modulates immune responses by inducing apoptosis in activated T cells and regulating cytokine production. Its interaction with P4HB (Protein Disulfide Isomerase) could mediate various cellular processes including ECM remodeling and redox regulation, influencing immune cell function and tissue repair in the inflammatory context [Source: UniProt: LGALS9].
Clinical or Translational Implications
The identified condition-specific cell-cell interactions offer several potential clinical and translational implications for IBD:
- Therapeutic Targeting of Integrins: The widespread and strong activation of integrin-mediated interactions in inflamed and non-inflamed conditions suggests these pathways are central to IBD pathogenesis.
- Mechanism: Blocking key integrins can prevent immune cell trafficking to the gut and reduce inflammation.
- Therapeutic Agents: Vedolizumab (targeting α4β7 integrin) and Natalizumab (targeting α4 integrin) are established therapies for IBD, highlighting the clinical relevance of this pathway. The current findings reinforce the importance of these adhesion molecules in the human colon inflammatory landscape. Further investigation into the specific integrin subunits and their cell-type specific interactions, such as those involving FN1_integrin_a6b7 or COL1A1_integrin_a1b1, could reveal novel targets or guide personalized therapy. [Source: PubMed search for "integrin inhibitors IBD vedolizumab natalizumab"]
- Modulation of Prostaglandin Signaling: The significant role of PGE2 signaling in both inflamed and non-inflamed states points to its complex regulation in IBD.
- Mechanism: Targeting specific PGE2 receptors (PTGER2, PTGER4) could offer a nuanced approach to modulate inflammation without completely inhibiting beneficial PGE2 effects. For example, EP4 agonists or antagonists are being explored in various inflammatory contexts.
- Therapeutic Agents: While broad COX inhibitors are often associated with gastrointestinal side effects, selective modulators of PGE2 receptors could be developed. This finding encourages further research into the precise roles of different PGE2 receptors in IBD pathogenesis and resolution.
- CXCL12-CXCR4 Axis as a Therapeutic Target: While baseline in healthy, its continued presence in inflamed/non-inflamed may suggest its role in chronic inflammation or fibrosis.
- Mechanism: Inhibiting CXCR4 could disrupt immune cell homing and reduce inflammation and fibrosis.
- Therapeutic Agents: CXCR4 antagonists (e.g., Plerixafor) are used in other contexts (e.g., hematopoietic stem cell mobilization), and their potential in IBD is under investigation, particularly in severe or fibrotic disease. [Source: PubMed search for "CXCR4 antagonists IBD"]
- CEACAM6 and Epithelial Homeostasis: The prominent CEACAM6 interactions suggest its role in epithelial changes during inflammation.
- Mechanism: Modulating CEACAM6 could potentially influence epithelial barrier integrity, cell survival, and inflammatory signaling.
- Therapeutic Agents: Research into CEACAM6-specific inhibitors or antibodies is ongoing, particularly in cancer, but could have implications for IBD given its role in gut epithelial health and inflammation.
These findings underscore the complex interplay between immune and stromal cells in IBD pathogenesis and highlight specific ligand-receptor pairs as promising avenues for therapeutic intervention or as biomarkers for disease activity and response to treatment.
11. Condition-Specific Surfaceome Markers in Intestinal Epithelial Cells
[Analysis Visualization Results]...
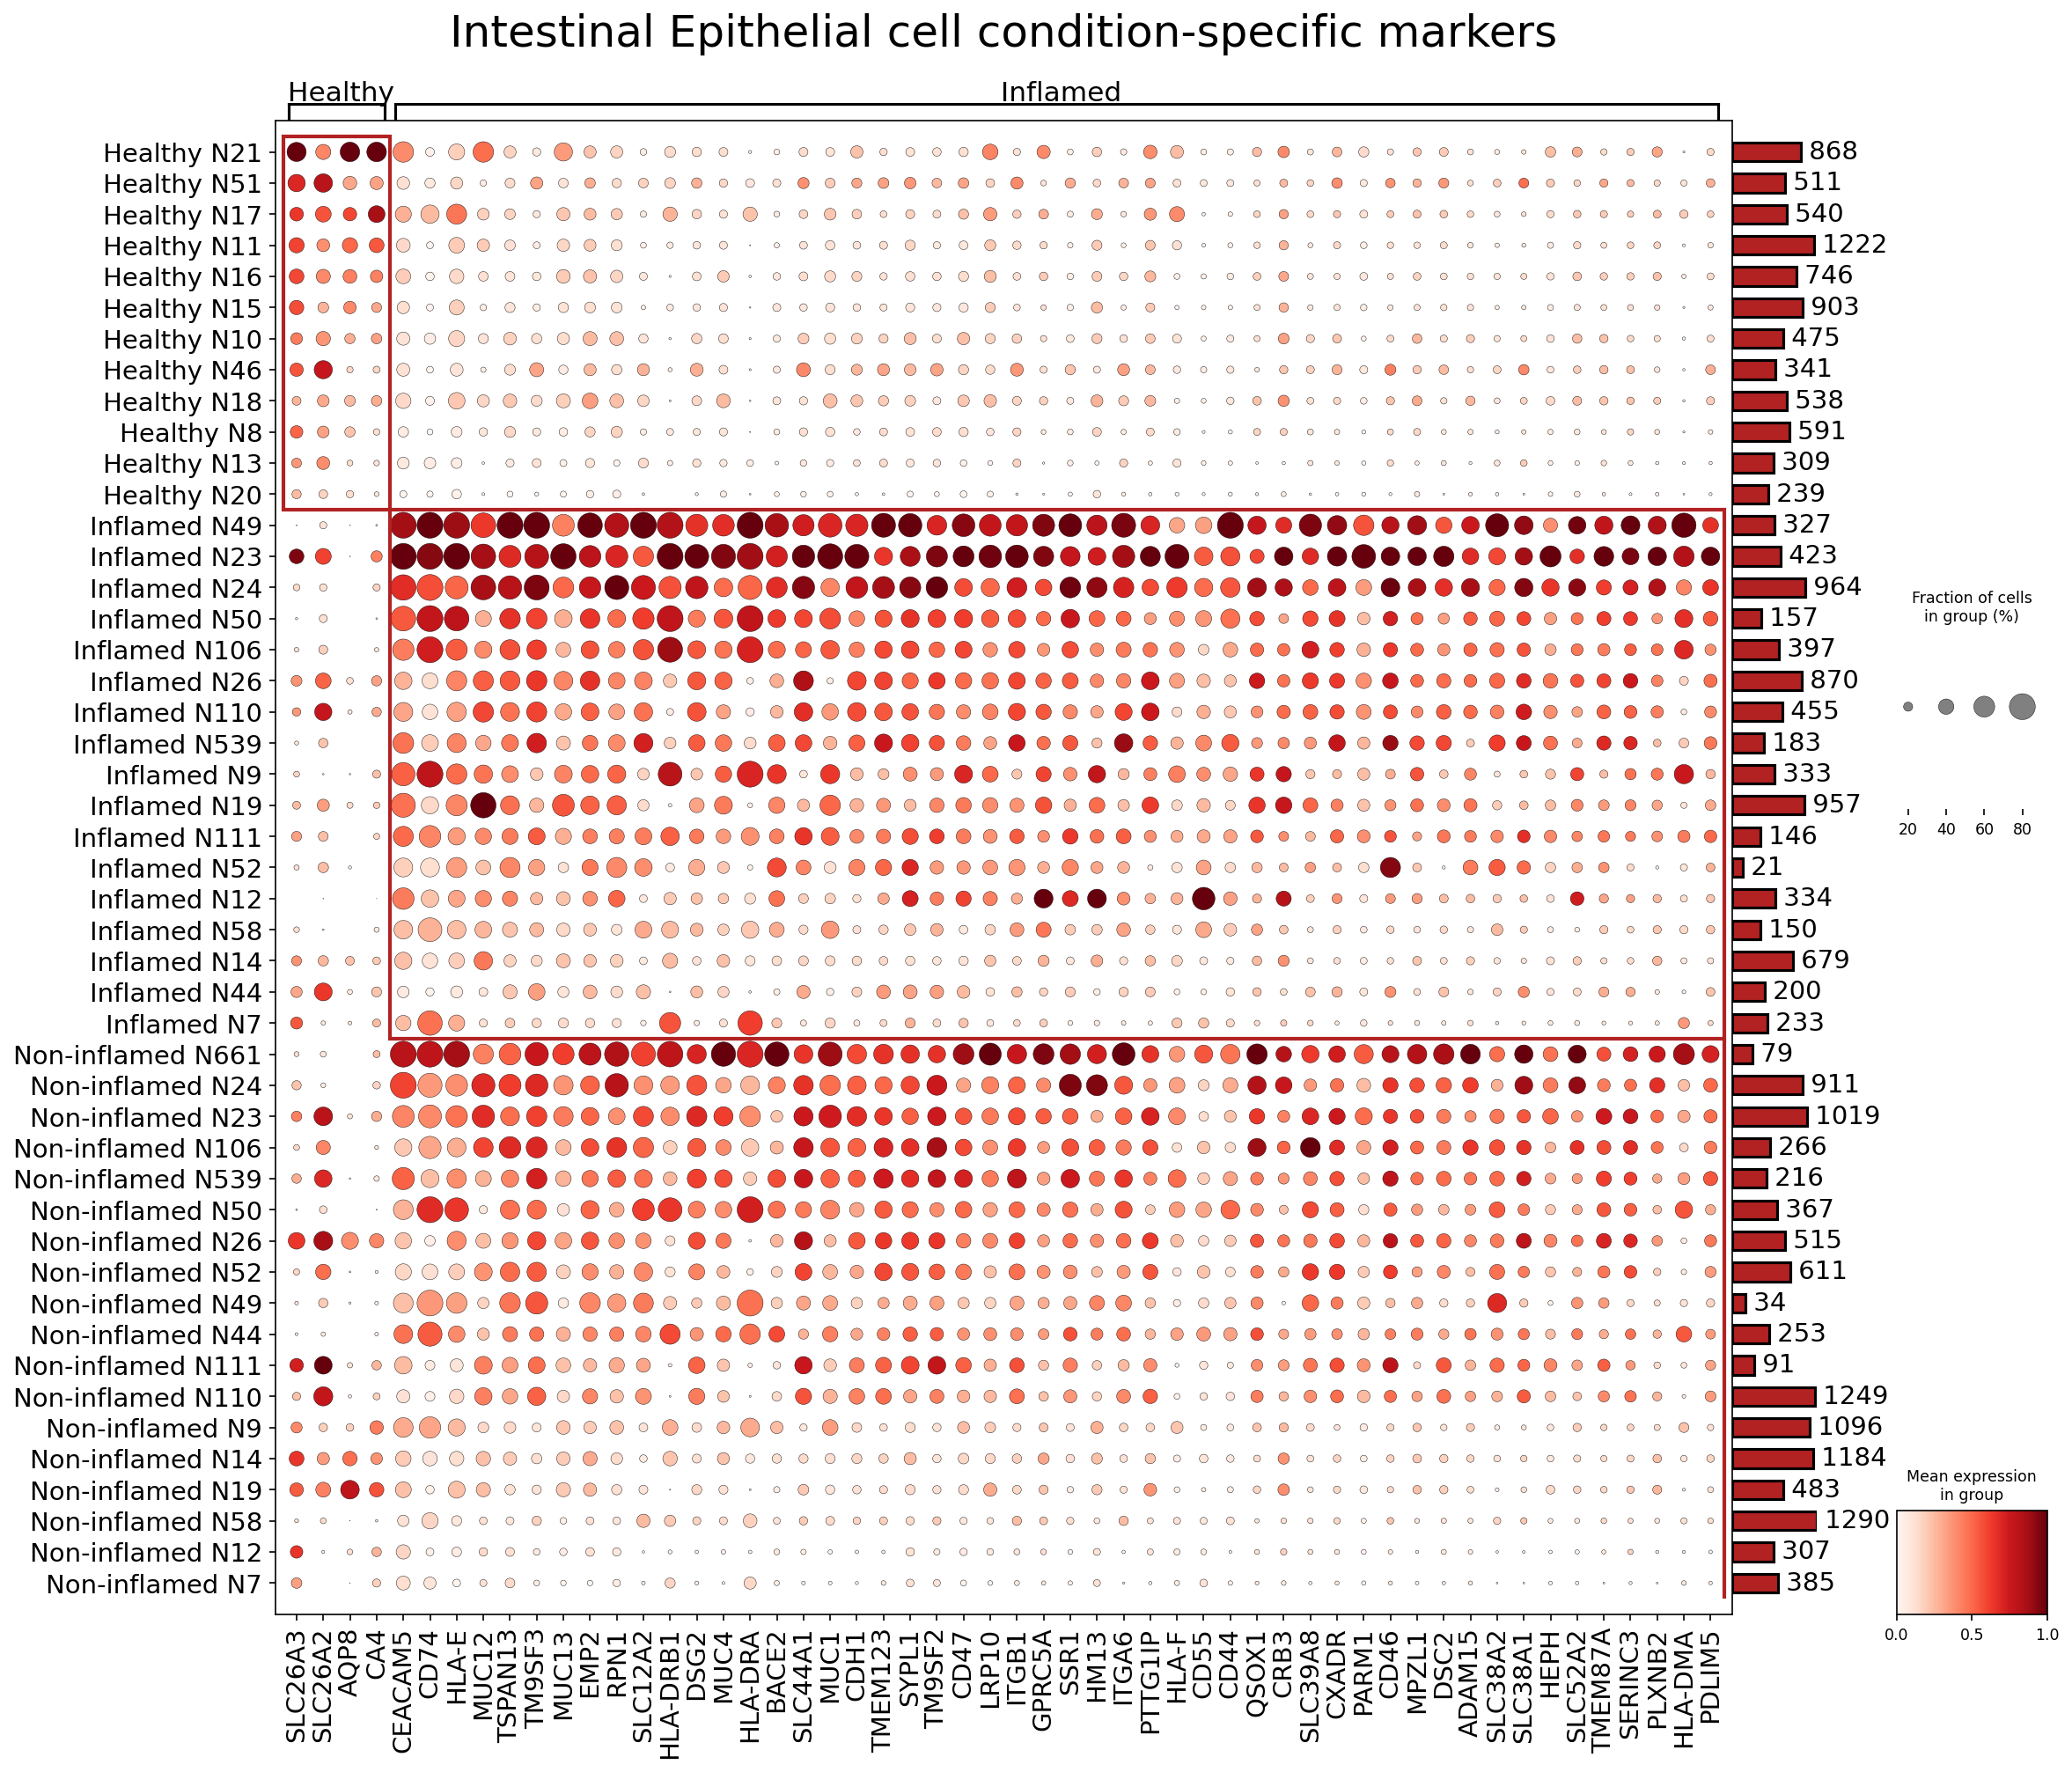
Analysis Overview
This analysis identifies and visualizes surfaceome marker expression in Intestinal Epithelial cells across different conditions: Healthy, Inflamed, and Non-inflamed. The dot plot displays the mean expression level (color intensity) and the fraction of cells expressing a given marker (dot size) for selected surface markers. The primary goal is to highlight markers that differentiate the inflammatory state, providing insights into altered epithelial cell biology during intestinal inflammation, such as in Inflammatory Bowel Disease (IBD).
Visual Summary
The dot plot clearly segregates samples based on their inflammatory condition.
- Inflamed Condition: Intestinal Epithelial cells from 'Inflamed' samples exhibit a distinct and strong expression profile for a large set of surface markers. These markers are characterized by large dot sizes (high fraction of expressing cells) and dark red colors (high mean expression) across many samples in this group. This suggests a widespread and robust transcriptional change in epithelial cells during inflammation.
- Healthy Condition: 'Healthy' samples generally show very low to no expression for many of the markers highly expressed in the 'Inflamed' state. A few markers, like SLC26A3 and SLC26A2, show some expression in Healthy samples, which appears to be reduced or altered in Inflamed conditions.
- Non-inflamed Condition: Samples labeled 'Non-inflamed' show an intermediate or mixed expression pattern. For some markers, their expression resembles the 'Healthy' state, while for others, there's an upregulation, though often less pronounced than in the 'Inflamed' group. This could indicate a spectrum of subclinical inflammation or recovery states within the 'Non-inflamed' group.
Overall, the most striking observation is the profound shift in the surfaceome of Intestinal Epithelial cells in the 'Inflamed' state, characterized by the marked upregulation of numerous cell adhesion molecules, immune-related proteins, and mucins.
Biological Interpretation
The observed differential expression of surfaceome markers in Intestinal Epithelial cells provides critical insights into the molecular mechanisms underlying intestinal inflammation, particularly relevant to Inflammatory Bowel Disease (IBD).
Markers Upregulated in Inflamed Intestinal Epithelial Cells
- Immune Presentation and Regulation (HLA-DRB1, HLA-DRA, CD74, CD46):
- HLA-DRB1 and HLA-DRA are components of the Major Histocompatibility Complex (MHC) Class II, and CD74 (invariant chain) is involved in MHC class II assembly and antigen presentation. Their strong upregulation in inflamed Intestinal Epithelial cells suggests that these cells acquire or enhance antigen-presenting capabilities during inflammation. This can contribute to sustained immune responses by presenting antigens to CD4+ T cells, thereby propagating inflammation in the gut.
- GeneCards: HLA-DRB1
- GeneCards: CD74
- CD46 is a complement regulatory protein expressed on host cells, protecting them from complement-mediated damage. Its upregulation could be a protective mechanism by epithelial cells attempting to mitigate inflammation-induced damage, or it might be involved in immune evasion by pathogens or altered host-microbe interactions.
- GeneCards: CD46
- Cell Adhesion and Barrier Integrity (CEACAM5, CDH1, DSG2, ITGB1, ITGA6, CD44, CRB3, CXADR):
- CEACAM5 (Carcinoembryonic antigen-related cell adhesion molecule 5) is a cell adhesion protein often associated with inflammation and cancer. Its upregulation can impact epithelial barrier function and cell-cell interactions, potentially contributing to immune cell recruitment and modulating inflammatory signals.
- GeneCards: CEACAM5
- CDH1 (E-cadherin) is a crucial cell-cell adhesion molecule forming adherens junctions, vital for maintaining epithelial barrier integrity. While typically expressed, altered expression or localization in inflammation can disrupt the barrier, increasing gut permeability and antigen exposure. The observed upregulation might reflect an attempt at repair or restructuring of the barrier, or a response to inflammatory signals.
- GeneCards: CDH1
- DSG2 (Desmoglein 2) is a desmosomal cadherin involved in strong cell-cell adhesion, particularly in tissues subject to mechanical stress like the gut. Its altered expression could reflect a remodeling of desmosomes under inflammatory conditions, potentially impacting epithelial strength and integrity.
- GeneCards: DSG2
- ITGB1 (Integrin Beta 1) and ITGA6 (Integrin Alpha 6) form integrin heterodimers (e.g., alpha6beta1, alpha6beta4) that mediate cell adhesion to the extracellular matrix (ECM) components like laminin. Upregulation of these integrins suggests increased epithelial interaction with the underlying basement membrane, potentially influencing cell migration, proliferation, and response to mechanical cues in the inflamed environment. This can be critical for wound healing or, conversely, contribute to fibrosis.
- GeneCards: ITGB1
- GeneCards: ITGA6
- CD44 is a transmembrane glycoprotein that acts as a receptor for hyaluronan and is involved in cell adhesion, migration, and lymphocyte activation. Its upregulation in inflamed epithelial cells can modulate immune cell trafficking and retention within the inflamed mucosa, and contribute to inflammatory signaling.
- GeneCards: CD44
- CRB3 (Crumbs Homolog 3) plays a role in epithelial cell polarity and barrier function. Changes in its expression might indicate disruptions in epithelial cell organization and apical-basal polarity, which are hallmarks of inflamed epithelia.
- GeneCards: CRB3
- CXADR (CAR/Coxsackievirus and Adenovirus Receptor) is involved in cell adhesion, tight junction formation, and also serves as a receptor for certain viruses. Its altered expression can impact epithelial barrier function and susceptibility to viral infections.
- GeneCards: CXADR
- Mucins (MUC1, MUC4, MUC12, MUC13):
- Mucins are heavily glycosylated proteins that form a protective mucus layer over epithelial surfaces. The differential expression of transmembrane mucins like MUC1, MUC4, MUC12, and MUC13 in inflamed epithelial cells is significant. MUC1 and MUC4 are often aberrantly expressed in inflammatory conditions and cancers, affecting cell signaling, adhesion, and immune evasion. MUC12 and MUC13 are also implicated in gut homeostasis and inflammation. Their upregulation could represent an adaptive response to enhance the protective mucus barrier, or conversely, altered mucin profiles might contribute to dysbiosis and immune dysregulation in IBD.
- GeneCards: MUC1
- GeneCards: MUC13
- Other Notable Markers in Inflamed Cells:
- CD47: An integrin-associated protein acting as a "don't eat me" signal, preventing phagocytosis. Its upregulation could allow inflamed epithelial cells to evade immune clearance, contributing to tissue damage persistence or altered epithelial turnover.
- GeneCards: CD47
- ADAM15 (ADAM Metallopeptidase Domain 15): A disintegrin and metalloprotease involved in cell adhesion, migration, and shedding of cell surface proteins. Its upregulation could contribute to ECM remodeling and altered cell signaling in the inflammatory milieu.
- GeneCards: ADAM15
- SLC44A1 (Solute Carrier Family 44 Member 1): Involved in choline transport. Altered expression of solute carriers reflects metabolic adaptations or stress responses in inflamed epithelial cells.
- GeneCards: SLC44A1
- SLC38A1/SLC38A2 (Solute Carrier Family 38 Member 1/2): Involved in amino acid transport. Changes in amino acid metabolism are common in inflammation and can affect epithelial repair and immune cell function.
- GeneCards: SLC38A1
Markers Relatively Higher in Healthy/Non-inflamed Intestinal Epithelial Cells (or decreased in Inflamed)
- Transporters (SLC26A3, SLC26A2, AQP8, CA4):
- SLC26A3 (DRA - Downregulated in Adenoma) and SLC26A2 are anion exchangers critical for fluid and electrolyte balance in the colon, involved in chloride and bicarbonate transport. Their relatively higher expression in healthy cells and reduction in inflamed cells points to impaired epithelial function in IBD, leading to osmotic dysregulation and potentially diarrhea.
- GeneCards: SLC26A3
- AQP8 (Aquaporin 8) is a water channel protein. Its reduced expression in inflamed cells would further contribute to altered water transport and fluid balance, a common feature of IBD.
- GeneCards: AQP8
- CA4 (Carbonic Anhydrase 4) is involved in acid-base balance and carbon dioxide metabolism. Its reduced expression in inflammation may reflect broader metabolic disturbances or impaired physiological functions of the epithelial cells.
- GeneCards: CA4
These findings collectively highlight a profound reprogramming of Intestinal Epithelial cell surface characteristics during inflammation, impacting immune interactions, barrier integrity, and homeostatic functions.
Clinical or Translational Implications
The identified condition-specific surfaceome markers in Intestinal Epithelial cells offer several potential avenues for clinical and translational applications in IBD:
Diagnostic and Prognostic Biomarkers:
- Genes like HLA-DRB1/DRA, CEACAM5, MUCs, and adhesion molecules (CDH1, DSG2, ITGB1, ITGA6, CD44) show significant differential expression in inflamed tissue. These could serve as valuable biomarkers for diagnosing active inflammation, assessing disease severity, or monitoring therapeutic response.
- The reduced expression of functional transporters like SLC26A3/2 and AQP8 could indicate epithelial dysfunction and serve as markers for impaired barrier function, potentially predicting disease flares or complications like diarrhea.
- Surface markers are particularly attractive as biomarkers because they can be assessed via immunohistochemistry on biopsies, flow cytometry on dissociated cells, or even non-invasively through imaging techniques targeting specific surface proteins.
Therapeutic Targets:
- Immune Modulation: Upregulated MHC class II molecules (HLA-DRB1/DRA, CD74) on epithelial cells present an opportunity to dampen chronic immune activation. Strategies could involve blocking their function or targeting these cells for immunomodulation to reduce their antigen-presenting capacity.
- Barrier Restoration: The altered expression of cell adhesion molecules (CEACAM5, CDH1, DSG2, Integrins) highlights dysfunctional epithelial barrier. Therapeutic approaches could aim to strengthen tight and adherens junctions or modulate integrin signaling to restore barrier integrity. For example, agents that block specific integrins (e.g., vedolizumab targeting α4β7 integrin on immune cells) are already used in IBD, and epithelial integrins could be a novel target.
- Mucin-based Therapies: Dysregulated mucins (MUC1, MUC4, MUC12, MUC13) suggest potential for therapies that either restore a healthy mucus layer or target aberrant mucins to improve gut barrier function and reduce inflammation.
- "Don't Eat Me" Signal Inhibition: Targeting CD47, which allows inflamed epithelial cells to evade immune clearance, could enhance the removal of damaged or overly activated epithelial cells, facilitating tissue repair and reducing chronic inflammation.
- Functional Restoration: Strategies to restore the function of transporters like SLC26A3/2 and AQP8 could help alleviate symptoms such as diarrhea by improving fluid and electrolyte balance in the colon.
Drug Development:
- Many of these surface proteins are amenable to targeting with biologics (e.g., monoclonal antibodies) or small molecule inhibitors. The specific detection of these markers on Intestinal Epithelial cells during inflammation provides a rationale for developing cell-type-specific therapies that could minimize off-target effects. For example, antibodies against specific integrins or CEACAMs could be explored.
- PubMed Search: "Therapeutic targets inflammatory bowel disease epithelial cells"
Further research validating the functional roles of these markers in IBD pathogenesis and exploring their druggability would be crucial for advancing these findings into novel diagnostic tools and therapeutic interventions.
12. Macrophage Condition-Specific Surfaceome Markers in Colon Tissue
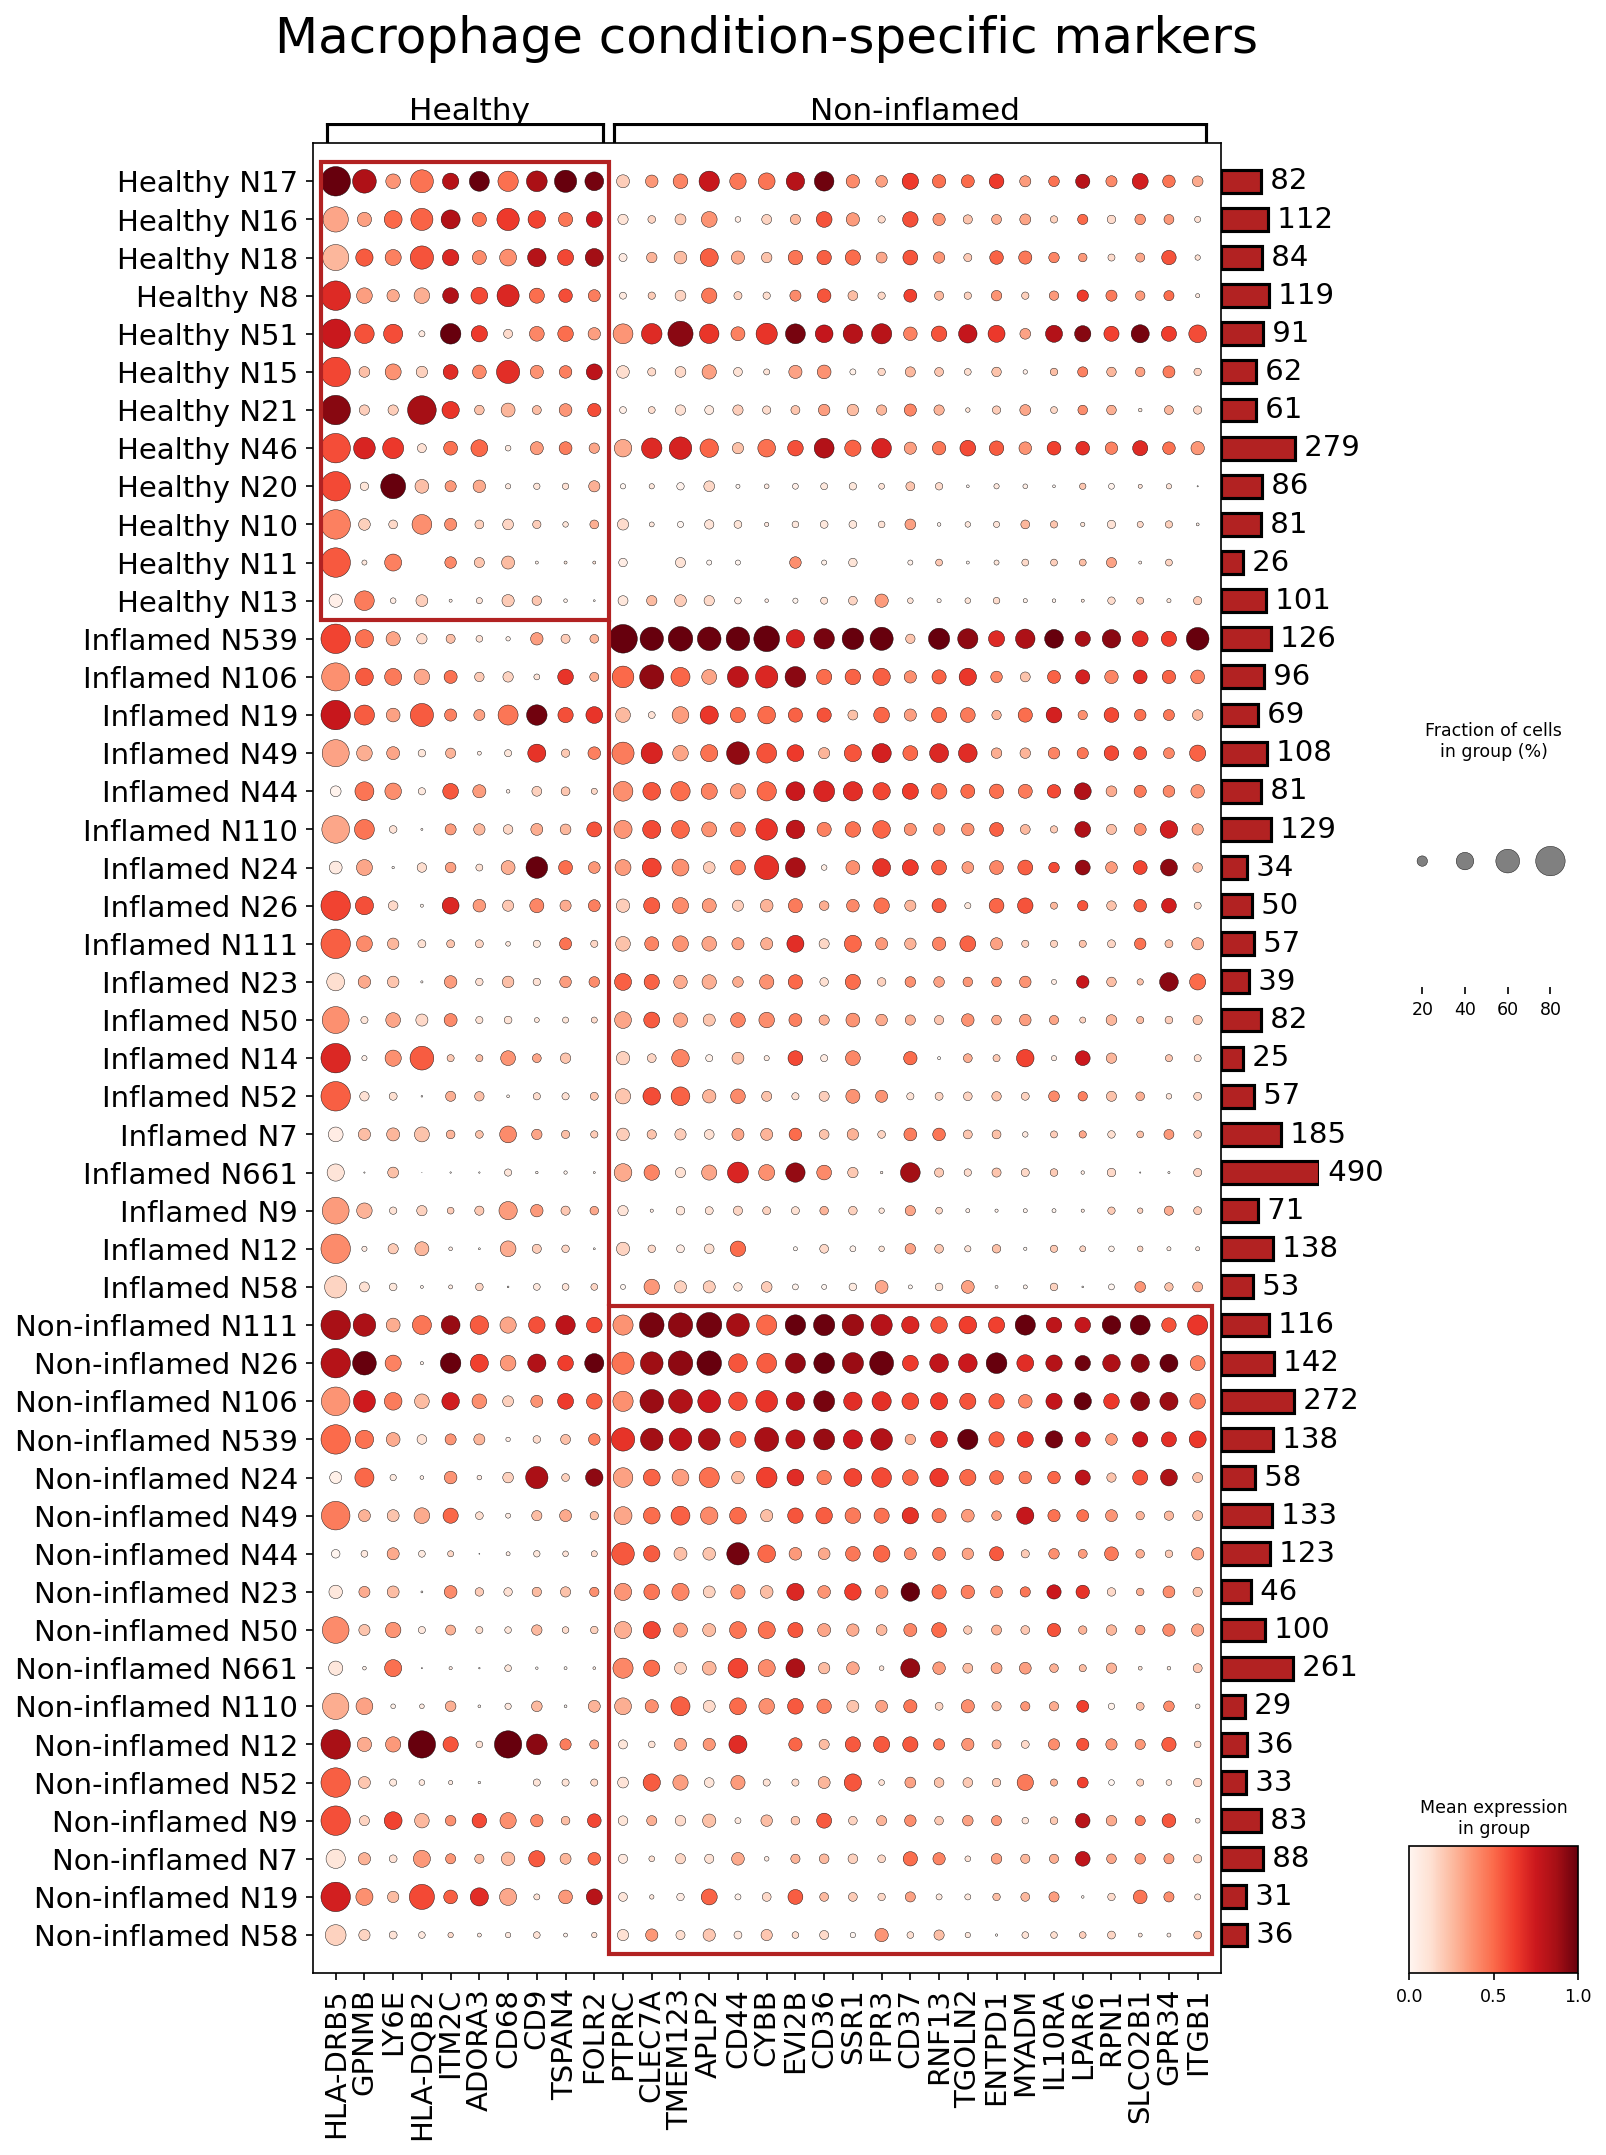
[Analysis Visualization Results]...
Analysis Overview
This analysis identifies and visualizes surfaceome markers specific to macrophages in human colon tissue across three conditions: Healthy, Inflamed, and Non-inflamed. The dot plot displays the mean expression level (color intensity) and the fraction of cells expressing the marker (dot size) for individual samples within each condition. This approach helps pinpoint cell surface proteins that characterize macrophage states in different pathological contexts, particularly relevant to Inflammatory Bowel Disease (IBD).
Visual Summary
The dot plot, titled "Macrophage condition-specific markers," effectively illustrates distinct surfaceome profiles for macrophages under Healthy, Inflamed, and Non-inflamed conditions.
- Healthy Macrophage Markers: The leftmost section highlights markers enriched in healthy samples. Genes such as HLA-DRB5, GPNMB, LY6E, ITM2C, ADORA3, CD68, CD9, TSPAN4, and HLA-DQB2 are consistently expressed at high levels and in a large fraction of cells within the Healthy group. These markers are largely absent or expressed at very low levels in the Inflamed and Non-inflamed samples, suggesting a specific homeostatic or quiescent macrophage phenotype. HLA-DRB5 and HLA-DQB2, both MHC Class II molecules, show particularly strong and consistent expression across healthy individuals.
- Non-inflamed Macrophage Markers: The middle section identifies markers specific to the Non-inflamed condition. FPR2, FOLR2, and PTPRC are presented in this group. Among these, FOLR2 (Folate Receptor Beta) shows a strikingly specific expression pattern, being highly expressed in most Non-inflamed samples but minimal in Healthy and Inflamed samples. FPR2 and PTPRC also show expression in Healthy samples, indicating that while they are found to be markers for Non-inflamed (likely when compared against *the rest*), FOLR2 is the most distinguishing feature for this group.
- Inflamed Macrophage Markers: The rightmost section displays a rich set of markers highly expressed in inflamed samples. Key genes like CLEC7A, CD44, CYBB, CD36, ENTPD1, IL10RA, and ITGB1 show strong, pervasive expression across the majority of Inflamed samples, while being largely absent or low in Healthy samples. This profile indicates a highly activated and functionally distinct macrophage state associated with inflammation. There is a clear shift from the healthy marker profile to this inflammatory one.
In summary, the plot reveals a clear distinction in macrophage surfaceome composition depending on the tissue's inflammatory state. Healthy macrophages are characterized by MHC Class II molecules, while inflamed macrophages exhibit markers associated with active inflammation, oxidative stress, and cell adhesion. Macrophages from non-inflamed tissue show a more unique, albeit sparser, profile with FOLR2 being a prominent distinguishing marker.
Biological Interpretation
The distinct surfaceome marker profiles observed across the Healthy, Inflamed, and Non-inflamed conditions provide critical insights into macrophage functional states in the colon, particularly in the context of Inflammatory Bowel Disease (IBD). Macrophages are central players in gut homeostasis and pathology, responding to microbial stimuli and influencing inflammatory cascades.
Healthy Macrophage Markers:
The markers enriched in healthy colon macrophages suggest a role in maintaining immune surveillance and tissue integrity.
- HLA-DRB5 and HLA-DQB2 (MHC Class II molecules): High expression of these genes is characteristic of antigen-presenting cells (APCs) like macrophages, enabling them to present peptide antigens to CD4+ T cells. In a healthy colon, this is crucial for immune surveillance, recognizing commensal bacteria, and preventing over-responsiveness, thereby maintaining immune tolerance and homeostasis. GeneCards: HLA-DRB5
- CD68: A well-known pan-macrophage marker, involved in phagocytosis and lysosomal activity. Its consistent high expression confirms the identity and basic scavenger functions of macrophages in the healthy colon. GeneCards: CD68
- GPNMB: Glycoprotein NMB is associated with tissue repair and anti-inflammatory roles, often linked to M2-like macrophage phenotypes. Its presence in healthy macrophages may indicate their involvement in maintaining tissue integrity and rapidly resolving minor perturbations to preserve gut homeostasis. GeneCards: GPNMB
- ADORA3 (Adenosine A3 Receptor): Part of the adenosine signaling pathway, which is a critical modulator of immune responses. In many contexts, ADORA3 activation contributes to anti-inflammatory effects and tissue protection. Its presence could support a role in dampening spurious inflammation in healthy tissue. GeneCards: ADORA3
- TSPAN4 (Tetraspanin-4): Tetraspanins are membrane proteins that organize molecular complexes and influence cell adhesion, migration, and signaling. TSPAN4 could contribute to stable macrophage interactions within the tissue microenvironment in a non-inflammatory state. GeneCards: TSPAN4
Non-inflamed Macrophage Markers:
Macrophages in the non-inflamed condition, potentially representing a state of remission or a pre-inflammatory stage, show a specific profile.
- FOLR2 (Folate Receptor Beta): Highly specific to non-inflamed macrophages, FOLR2 is often expressed by activated macrophages, particularly those with M2-like characteristics, involved in efferocytosis, tissue repair, and resolution of inflammation. Its upregulation here suggests macrophages transitioning towards or maintaining a reparative/anti-inflammatory phenotype, distinct from acute inflammation. GeneCards: FOLR2
- FPR2 (Formyl Peptide Receptor 2): While also present in healthy conditions, its identification as a non-inflamed marker (compared to all other conditions) highlights its nuanced role. FPR2 can mediate both pro- and anti-inflammatory responses, including resolution. In the non-inflamed state, it might be poised to respond to microbial signals in a controlled manner or to contribute to pro-resolving pathways. GeneCards: FPR2
Inflamed Macrophage Markers:
The extensive list of markers in inflamed macrophages signifies an activated, pro-inflammatory phenotype, characteristic of IBD pathogenesis.
- CLEC7A (Dectin-1): A C-type lectin receptor recognizing β-glucans from fungi and endogenous ligands. Upregulation indicates robust innate immune activation, initiating downstream signaling (e.g., NF-κB) leading to cytokine production and phagocytosis, critical for host defense but also contributing to excessive inflammation in IBD. GeneCards: CLEC7A
- CD44: A cell adhesion molecule and receptor for hyaluronic acid. Increased CD44 expression in inflamed macrophages promotes cell-cell and cell-matrix interactions, critical for macrophage recruitment to inflammatory sites and potentially driving tissue damage and fibrosis. GeneCards: CD44
- CYBB (NOX2/gp91phox): A subunit of NADPH oxidase, responsible for generating reactive oxygen species (ROS). Its high expression indicates an active oxidative burst, essential for killing pathogens but also a major contributor to oxidative stress and tissue damage in chronic inflammation like IBD. GeneCards: CYBB
- CD36: A scavenger receptor involved in lipid metabolism, efferocytosis, and inflammatory signaling. Its upregulation suggests macrophages are active in clearing cellular debris and potentially altering lipid metabolism in the inflamed microenvironment, contributing to inflammatory responses. GeneCards: CD36
- ENTPD1 (CD39): An ectonucleotidase that hydrolyzes ATP and ADP to AMP, regulating purinergic signaling. CD39 upregulation in inflamed macrophages may reflect an attempt to control the inflammatory milieu by generating anti-inflammatory adenosine (via subsequent CD73 activity), a crucial immunomodulatory pathway. GeneCards: ENTPD1
- IL10RA (Interleukin-10 Receptor Alpha): Part of the receptor for IL-10, a potent anti-inflammatory cytokine. Increased expression suggests that these macrophages are responsive to IL-10, possibly as part of an endogenous feedback mechanism to temper inflammation. Dysregulation of IL-10 signaling is implicated in IBD. GeneCards: IL10RA
- ITGB1 (Integrin Beta-1, CD29): A cell adhesion molecule crucial for cell migration and interaction with the extracellular matrix. Its upregulation indicates increased macrophage recruitment and adhesion to the inflamed tissue, facilitating their participation in the inflammatory response and tissue remodeling. GeneCards: ITGB1
Clinical or Translational Implications
The identification of condition-specific macrophage surfaceome markers has significant clinical and translational implications for Inflammatory Bowel Disease (IBD). These markers can serve as diagnostic biomarkers, tools for monitoring disease activity, or novel therapeutic targets.
Diagnostic and Prognostic Biomarkers:
- Markers like HLA-DRB5 and HLA-DQB2 characterize healthy macrophage function. Their downregulation in inflamed tissues might indicate a loss of normal immune regulation.
- The robust inflammatory signature, including CLEC7A, CD44, CYBB, and ITGB1, could be used as indicators of active inflammation in the colon. These could potentially be assessed via biopsy, endoscopic imaging, or circulating cell analysis to gauge disease severity and progression.
- FOLR2 as a specific marker for non-inflamed macrophages suggests a unique subset associated with quiescent or resolving disease. This could be a marker for patients in remission or those responding well to therapy, allowing for more precise disease monitoring.
Therapeutic Targets and Agents:
- CLEC7A (Dectin-1): Given its role in activating innate immunity and cytokine production, inhibiting CLEC7A could dampen excessive inflammation in IBD. Therapeutic agents targeting Dectin-1 could modulate macrophage activation, potentially reducing pro-inflammatory cytokine release.
- CD44: As a key mediator of immune cell trafficking and adhesion, blocking CD44 or its interactions with hyaluronic acid could reduce macrophage infiltration into the inflamed colon, thereby alleviating inflammation. Anti-CD44 antibodies or small molecule inhibitors are being investigated for various inflammatory conditions.
- CYBB (NADPH Oxidase): Inhibiting NADPH oxidase activity could reduce oxidative stress and tissue damage in the inflamed gut. While non-specific inhibition might have side effects on host defense, targeted strategies to modulate macrophage-specific oxidative bursts could be beneficial.
- ENTPD1 (CD39): Modulating purinergic signaling via CD39 holds therapeutic promise. Enhancing CD39 activity could promote the conversion of pro-inflammatory ATP to anti-inflammatory adenosine, helping to resolve inflammation. Agonists or activators of CD39 are potential candidates.
- IL10RA: Given IL-10's potent anti-inflammatory role and its known defects in some IBD patients, enhancing IL-10 receptor signaling in macrophages could be a therapeutic strategy. This could involve IL-10 mimetics or therapies that increase IL10RA expression or function.
- ITGB1 (Integrin Beta-1): Integrins are established therapeutic targets in IBD (e.g., vedolizumab targets α4β7 integrin). Targeting ITGB1 or its alpha partners could interfere with macrophage recruitment and retention in the inflamed tissue, offering another avenue to block immune cell trafficking.
- FOLR2: The specificity of FOLR2 for non-inflamed macrophages could enable targeted delivery of anti-inflammatory drugs to this specific macrophage subset, potentially promoting resolution and preventing relapse with fewer systemic side effects.
Overall, these findings highlight the heterogeneity of macrophage populations in IBD and underscore the potential of surfaceome markers for precision medicine approaches, including patient stratification and the development of targeted therapies.
13. Fibroblast Condition-Specific Surfaceome Marker Expression Analysis
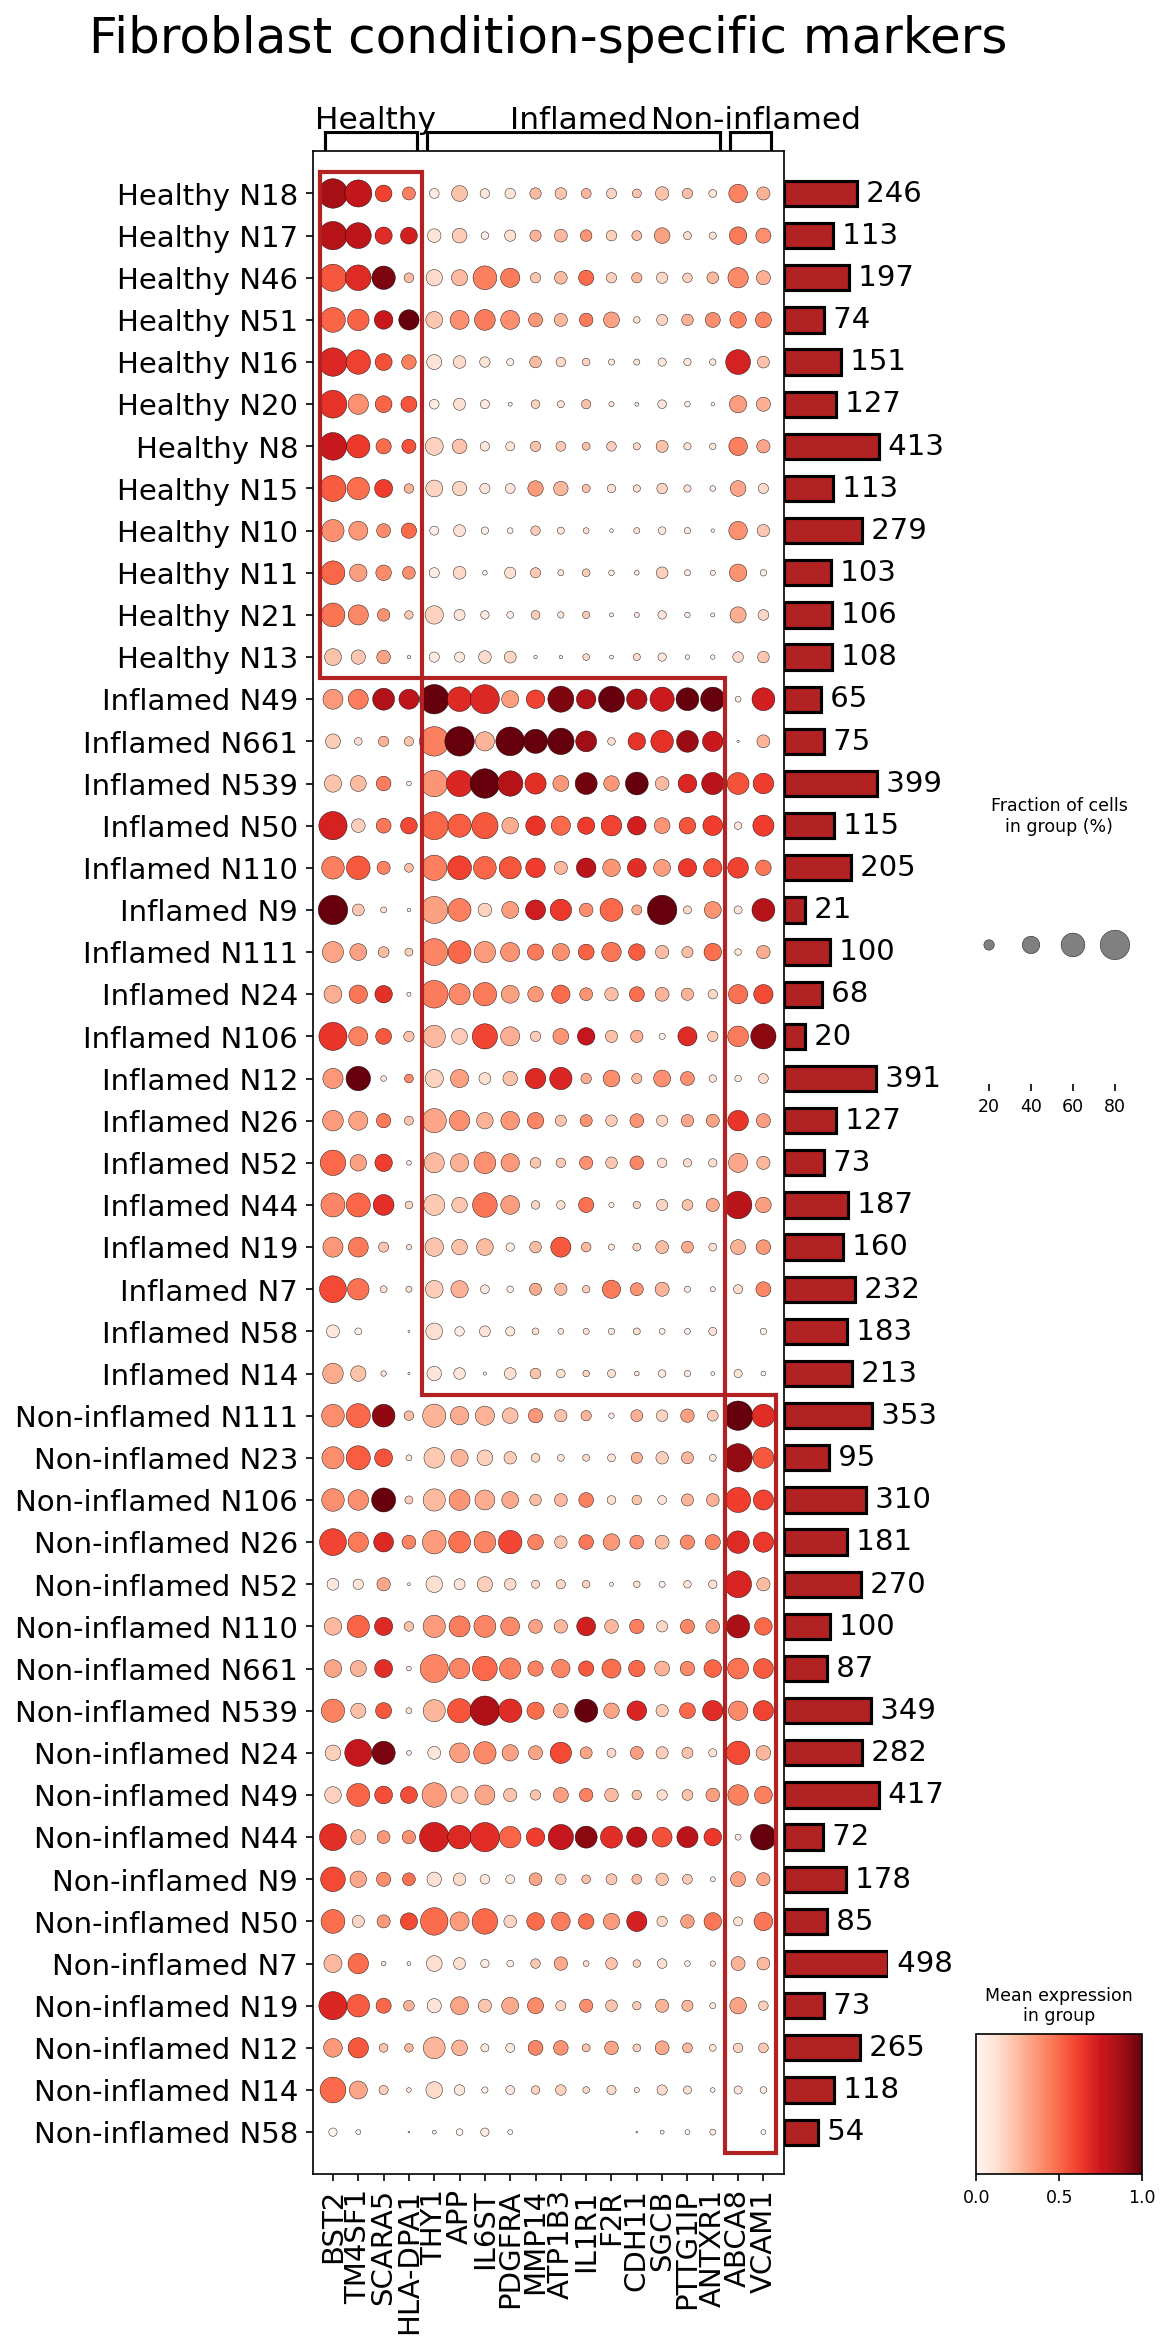
[Analysis Visualization Results]...
Analysis Overview
This analysis identifies and visualizes surfaceome marker expression in Fibroblast cells from human colon tissue across three conditions: Healthy, Inflamed, and Non-inflamed. The dot plot displays the mean expression level (color intensity) and the fraction of cells expressing the marker (dot size) for selected surface markers in individual samples within each condition. The goal is to identify markers that are differentially expressed, particularly those associated with inflammatory states, to gain biological insights and potentially identify therapeutic targets. The analysis focuses on surface markers, which are critical for cell-cell communication and accessible to therapeutic intervention.
Visual Summary
The dot plot effectively illustrates the expression patterns of 24 surface markers across 48 individual samples (rows) categorized by condition (Healthy, Inflamed, Non-inflamed).
Condition-Specific Expression Patterns:
- Inflamed Condition: Several markers show markedly higher expression and/or prevalence in cells from Inflamed samples compared to Healthy and Non-inflamed samples. Notable examples include IL6ST, THY1, VCAM1, MMP14, F2R, CDH11, and APP. These markers are often characterized by larger, darker red dots within the "Inflamed" section.
- Healthy Condition: Markers like BST2, TM4SF1, and SCARA5 appear to have relatively higher expression or prevalence in Healthy samples, though the differences are less dramatic than those observed in the Inflamed group for other markers.
- Non-inflamed Condition: This group generally shows an intermediate expression pattern, with some markers (e.g., PDGFRA, ATP1B3, IL1R1, PTG1IP, ABCA8) showing moderate expression across all conditions, including Non-inflamed. Some markers upregulated in Inflamed samples also show a trend of increased expression in some Non-inflamed samples compared to Healthy, suggesting a potential gradient of inflammatory activation.
- Marker Heterogeneity and Prevalence: The size of the dots indicates the fraction of cells expressing the marker, while color intensity reflects mean expression. For instance, IL6ST in Inflamed samples shows both high prevalence (large dots) and high expression (dark red), indicating widespread and strong upregulation within fibroblasts in this state. Conversely, some markers show high expression in a smaller fraction of cells, suggesting potential heterogeneity within the fibroblast population.
- Sample-Level Variability: There is noticeable variability among individual samples within each condition, particularly in the Inflamed group. While some Inflamed samples show strong upregulation of inflammation-associated markers (e.g., Inflamed N49, N661, N539), others show more moderate responses (e.g., Inflamed N110, N9). This suggests inter-individual differences in disease activity or fibroblast responses.
- General Fibroblast Markers: Some markers like ANTXR1 appear to be expressed across most samples and conditions, potentially representing more general fibroblast characteristics rather than condition-specific changes. PDGFRA is another classic fibroblast marker with broad expression but also shows some variability.
Biological Interpretation
Fibroblasts are crucial stromal cells in the colon, playing key roles in tissue homeostasis, wound healing, and pathogenesis of inflammatory and fibrotic diseases like Inflammatory Bowel Disease (IBD). The differential expression of surfaceome markers in colon fibroblasts across conditions provides insights into their activation states and involvement in disease progression.
Markers Upregulated in Inflamed Fibroblasts (Potential IBD-Associated)
Several markers show increased expression and/or prevalence in fibroblasts from Inflamed colon samples, pointing to their involvement in the inflammatory response and tissue remodeling characteristic of IBD.
- IL6ST (Glycoprotein 130 / GP130): This gene encodes the common signal-transducing subunit of receptors for the IL-6 cytokine family. Upregulation of IL6ST suggests enhanced responsiveness of fibroblasts to inflammatory cytokines like IL-6, which is a key driver of chronic inflammation and fibrosis in IBD. Activation of the IL-6/GP130 signaling pathway in fibroblasts can promote their proliferation, differentiation into myofibroblasts, and production of extracellular matrix (ECM) components, contributing to fibrosis.
- Signaling Pathway: IL-6/JAK/STAT3 pathway.
- Biological Mechanism: Mediates inflammatory signaling, promotes fibroblast activation, proliferation, and differentiation, contributing to inflammation and fibrosis in the colon.
- Therapeutic Target Potential: High. Targeting IL-6 signaling (e.g., with IL-6R antibodies like tocilizumab or sarilumab, which block upstream ligand binding, or potentially direct GP130 modulation) is an established strategy for inflammatory diseases.
- Related Therapeutic Agents: Tocilizumab, Sarilumab (target IL-6R, which signals via GP130) GeneCards: IL6ST
- THY1 (CD90): A glycosylphosphatidylinositol-anchored protein highly expressed on activated fibroblasts, particularly myofibroblasts. Its upregulation is often associated with pro-fibrotic phenotypes, contributing to ECM deposition and tissue stiffness in chronic inflammation and fibrosis.
- Signaling Pathway: Involved in cell adhesion, migration, and signaling, often through interaction with integrins and other surface molecules. Can modulate TGF-β signaling.
- Biological Mechanism: Marks activated fibroblasts/myofibroblasts, plays a role in cell adhesion, migration, and fibrosis development. In IBD, increased THY1 expression on fibroblasts might contribute to exaggerated wound healing and fibrotic stricture formation.
- Therapeutic Target Potential: Moderate. Targeting THY1+ fibroblasts could mitigate fibrosis.
- Related Therapeutic Agents: Research is ongoing for anti-THY1 strategies in fibrotic diseases. UniProt: P04216 (THY1_HUMAN)
- VCAM1 (CD106): Vascular Cell Adhesion Molecule 1. An adhesion molecule primarily expressed on activated endothelial cells but also on fibroblasts. Its upregulation facilitates the recruitment and extravasation of inflammatory leukocytes (e.g., lymphocytes, monocytes) into the inflamed tissue by binding to integrins (e.g., VLA-4/α4β1 integrin) on these immune cells.
- Signaling Pathway: Cell adhesion, immune cell trafficking.
- Biological Mechanism: Promotes immune cell infiltration into the inflamed colon, exacerbating chronic inflammation. Fibroblast-expressed VCAM1 can directly contribute to immune cell retention and activation within the stromal compartment.
- Therapeutic Target Potential: High. Blockade of adhesion molecules like VCAM1 or its leukocyte ligands (integrins) is a proven strategy in IBD.
- Related Therapeutic Agents: Natalizumab and Vedolizumab (target α4 integrin or α4β7 integrin, respectively, which are ligands for VCAM1) PubMed search: VCAM1 IBD therapy
- MMP14 (Matrix Metalloproteinase 14 / MT1-MMP): A membrane-anchored matrix metalloproteinase involved in the degradation and remodeling of the extracellular matrix. Upregulation of MMP14 in fibroblasts indicates active tissue remodeling, which is characteristic of chronic inflammation and fibrotic processes in IBD, where it can contribute to both tissue destruction and pathological repair.
- Signaling Pathway: ECM degradation and remodeling, activation of other MMPs, growth factor release.
- Biological Mechanism: Facilitates tissue invasion, cell migration, and degradation of ECM components, playing a role in inflammation, wound healing, and fibrosis. Excessive MMP14 activity can contribute to tissue damage and fibrotic stricture formation in IBD.
- Therapeutic Target Potential: Moderate. MMP inhibitors have been explored for various diseases, but specificity and side effects are challenges.
- Related Therapeutic Agents: Broad-spectrum MMP inhibitors have been developed, but specific MMP14 inhibitors are a focus of ongoing research. GeneCards: MMP14
- F2R (Protease-Activated Receptor 1 / PAR1): A G protein-coupled receptor activated by thrombin. Thrombin is generated during coagulation, which is often activated in inflammation. Activation of PAR1 on fibroblasts can promote inflammatory responses, proliferation, and ECM production, linking coagulation pathways to inflammation and fibrosis in IBD.
- Signaling Pathway: Thrombin signaling, G protein-coupled receptor cascades, inflammatory responses.
- Biological Mechanism: Mediates pro-inflammatory and pro-fibrotic effects in response to thrombin, linking coagulation to chronic inflammation and tissue remodeling in the colon.
- Therapeutic Target Potential: Under investigation. PAR1 antagonists are being developed for various indications, and their role in IBD could be explored.
- Related Therapeutic Agents: Vorapaxar (thrombin PAR1 antagonist for cardiovascular events) GeneCards: F2R
- CDH11 (Cadherin-11): A classical cadherin involved in homotypic cell-cell adhesion. Upregulation of CDH11 in fibroblasts has been linked to increased cell motility, invasive behavior, and the promotion of fibrosis, particularly in chronic inflammatory settings like rheumatoid arthritis and potentially IBD.
- Signaling Pathway: Cell adhesion, cytoskeletal organization, cell migration.
- Biological Mechanism: Facilitates fibroblast-fibroblast interactions and promotes a migratory, activated fibroblast phenotype, contributing to fibrotic tissue remodeling.
- Therapeutic Target Potential: Emerging. CDH11 inhibitors are being explored for fibrotic diseases.
- Related Therapeutic Agents: Research compounds are in development. UniProt: P55287 (CDH11_HUMAN)
- APP (Amyloid Beta Precursor Protein): While best known for its role in Alzheimer's disease, APP and its cleavage products can modulate cell adhesion, proliferation, and neuroinflammation. In the context of inflammatory diseases, APP can be upregulated and contribute to cell adhesion and inflammatory signaling.
- Signaling Pathway: Diverse roles in cell adhesion, signaling, and potentially inflammatory modulation.
- Biological Mechanism: While less clear in colon fibrosis compared to CNS, APP can be involved in cellular stress responses and inflammatory processes, potentially influencing fibroblast function.
- Therapeutic Target Potential: Unlikely as a primary IBD target, given its pleiotropic roles, but its expression in fibroblasts might reflect a general stress or activation state. GeneCards: APP
Markers with Varied Expression
- PDGFRA (Platelet-Derived Growth Factor Receptor Alpha): A receptor tyrosine kinase. PDGF signaling is a potent mitogen for fibroblasts and plays a critical role in wound healing and fibrosis. While generally expressed on fibroblasts, its variable expression might reflect different activation states or subsets of fibroblasts, potentially indicating varying responsiveness to growth factors in different inflammatory contexts.
- Signaling Pathway: PDGF/MAPK/PI3K pathways, cell proliferation, migration, survival, and ECM production.
- Biological Mechanism: Essential for fibroblast proliferation and activation during tissue repair and fibrosis. Increased PDGFRA signaling drives fibrotic processes.
- Therapeutic Target Potential: High. PDGFRA is a well-established target for fibrotic diseases (e.g., imatinib for GIST, though not specifically for IBD fibrosis yet).
- Related Therapeutic Agents: Imatinib, Nintedanib (broad tyrosine kinase inhibitor with anti-fibrotic effects) PubMed search: PDGFRA fibrosis therapy
- IL1R1 (Interleukin 1 Receptor Type 1): The primary receptor for IL-1α and IL-1β, key pro-inflammatory cytokines. Its expression on fibroblasts indicates their direct responsiveness to IL-1-mediated inflammation. While not exclusively upregulated in the inflamed group, its presence allows fibroblasts to contribute to and perpetuate the inflammatory cascade.
- Signaling Pathway: IL-1/NF-κB pathway, leading to production of pro-inflammatory mediators.
- Biological Mechanism: Enables fibroblasts to respond to IL-1 cytokines, contributing to inflammation and tissue damage.
- Therapeutic Target Potential: High. Targeting IL-1 signaling is a validated approach in some inflammatory diseases.
- Related Therapeutic Agents: Anakinra (IL-1R antagonist) GeneCards: IL1R1
- ANTXR1 (Anthrax Toxin Receptor 1 / TEM8): A cell surface receptor with roles in angiogenesis, cell adhesion, and cell migration. It is often expressed in stromal cells and can be involved in tumor angiogenesis and progression. Its consistent expression across conditions might suggest a basal role in colon fibroblast function, potentially modulated in disease.
- Signaling Pathway: Cell adhesion, migration, angiogenesis.
- Biological Mechanism: Involved in maintaining tissue architecture and potentially in pathological angiogenesis or matrix interactions in chronic inflammation.
- Therapeutic Target Potential: Moderate, primarily in cancer and angiogenesis, but its role in IBD fibrosis could be explored. UniProt: Q9H6X2 (ANTXR1_HUMAN)
Markers with Higher Expression in Healthy/Non-inflamed Fibroblasts
- BST2 (Bone Marrow Stromal Antigen 2 / CD317): Also known as tetherin, an interferon-inducible protein with antiviral activity and roles in immune regulation. Its relatively higher expression in Healthy samples might indicate a role in maintaining immune homeostasis or a baseline antiviral defense, which might be modulated or suppressed in chronic inflammation.
- Signaling Pathway: Interferon signaling, innate immunity.
- Biological Mechanism: Involved in antiviral defense and potentially in regulating immune responses, contributing to basal tissue integrity.
- Therapeutic Target Potential: Low for IBD. GeneCards: BST2
- TM4SF1 (Transmembrane 4 L Six Family Member 1): A member of the L6 gene family, involved in cell proliferation, migration, and invasion, often associated with cancer progression. Its observed pattern in Healthy/Non-inflamed samples might suggest a role in normal tissue maintenance or basal proliferative activity, which could be altered in inflammation.
- Signaling Pathway: Cell surface adhesion, signaling complexes, cell proliferation.
- Biological Mechanism: Involved in cell growth and motility. Its altered expression could indicate changes in fibroblast phenotype.
- Therapeutic Target Potential: Low for IBD. GeneCards: TM4SF1
- SCARA5 (Scavenger Receptor Class A Member 5): A type I transmembrane protein involved in various cellular processes including cell adhesion, growth, and immune responses. Its role in fibroblasts is less characterized, but scavenger receptors can bind to diverse ligands, including modified self-components, and participate in innate immunity.
- Signaling Pathway: Ligand binding, cell adhesion.
- Biological Mechanism: Potentially involved in tissue surveillance or cellular debris clearance.
- Therapeutic Target Potential: Low for IBD. GeneCards: SCARA5
Clinical or Translational Implications
The identification of differentially expressed surfaceome markers on colon fibroblasts in inflamed conditions offers promising avenues for clinical translation, particularly in the context of IBD.
- Biomarkers for Disease Activity and Fibrosis: Upregulated markers like IL6ST, THY1, VCAM1, MMP14, F2R, and CDH11 could serve as biomarkers for fibroblast activation, inflammation severity, or the propensity for fibrosis in IBD. These could potentially be assessed in tissue biopsies to better stratify patients or monitor treatment response.
- Novel Therapeutic Targets:
- Targeting Inflammatory Signaling: The strong upregulation of IL6ST underscores the importance of IL-6 signaling in IBD-associated fibroblast activation. Existing anti-IL-6R therapies could be particularly effective in modulating fibroblast function, or novel therapies directly targeting GP130 could be explored.
- Blocking Immune Cell Recruitment: VCAM1 is a well-established adhesion molecule. Therapies that block VCAM1 itself or its leukocyte integrin partners are already used in IBD (e.g., Vedolizumab targets α4β7 integrin, a VCAM1 ligand specific to the gut). Direct VCAM1 blockade on fibroblasts could offer a complementary strategy to reduce immune cell infiltration and activation within the inflamed stroma.
- Anti-Fibrotic Strategies: Markers like THY1, MMP14, F2R, and CDH11 are implicated in fibroblast activation, ECM remodeling, and fibrosis. Developing specific inhibitors for these molecules on fibroblasts could offer targeted anti-fibrotic treatments, which are a major unmet need in IBD patients developing strictures. For instance, specific MMP14 inhibitors could mitigate pathological tissue degradation and remodeling. CDH11 inhibitors are also emerging as anti-fibrotic agents in other diseases and warrant investigation in IBD.
- Modulating Growth Factor Responses: While PDGFRA is a general fibroblast marker, its expression levels and signaling could be critical for driving fibrotic responses. Modulating PDGFRA activity, perhaps through specific inhibitors or by targeting upstream PDGF ligands, represents another therapeutic avenue.
- Understanding Fibroblast Heterogeneity: The variable expression patterns, even within the "Inflamed" group, suggest that not all fibroblasts are uniformly activated. Further characterization of fibroblast subsets based on these surface markers could lead to more refined targeting strategies that impact specific pathogenic fibroblast populations.
In summary, the surfaceome markers identified in this analysis provide a rich resource for understanding fibroblast-mediated inflammation and fibrosis in the colon, offering several promising targets for the development of new diagnostic and therapeutic approaches for IBD.
14. CD4+ T Cell Surfaceome Marker Expression Across Colon Conditions

[Analysis Visualization Results]...
Analysis Overview
This analysis presents a dot plot visualizing the expression of selected surfaceome markers within CD4+ T cells across individual samples from healthy, inflamed, and non-inflamed colon tissues. The purpose is to identify condition-specific surface markers that could provide insights into CD4+ T cell states during inflammation, potentially serving as diagnostic biomarkers or therapeutic targets in Inflammatory Bowel Disease (IBD). The plot displays five markers: EMP3, LY6E, PTGER4, CD63, and KLRB1. Dot size represents the fraction of cells expressing the marker within a given sample, while dot color intensity indicates the mean expression level of the marker in those cells. The bar plots on the right show the total number of CD4+ T cells detected in each sample.
Visual Summary
The dot plot reveals distinct expression patterns for surfaceome markers on CD4+ T cells across different conditions (Healthy, Inflamed, Non-inflamed) and individual samples.
Overall Marker Prevalence and Expression:
- EMP3 shows moderate to high expression and prevalence in many Healthy and Non-inflamed samples, with some variability. In Inflamed samples, its prevalence and expression appear more varied, sometimes lower.
- LY6E is broadly expressed across most samples in all three conditions, often with high prevalence and moderate-to-high mean expression, suggesting a general presence on CD4+ T cells regardless of inflammatory status.
- PTGER4 exhibits a more sporadic expression pattern. It is present in a subset of cells in many samples, with variable expression levels. Some Inflamed and Non-inflamed samples show higher prevalence and expression compared to certain Healthy samples, but this is not uniform.
- CD63 shows low prevalence and generally low expression across most samples and conditions, suggesting it might mark a specific subpopulation or be transiently expressed.
- KLRB1 (CD161) displays notable patterns. It is present with moderate to high expression and prevalence in several Healthy and Non-inflamed samples. In contrast, its expression and prevalence appear to be relatively diminished or absent in many Inflamed samples, with a few exceptions (e.g., Inflamed N26, N52). This suggests a potential downregulation of KLRB1 on CD4+ T cells during active inflammation.
Condition-Specific Trends:
- While no single marker is exclusively present or absent in one condition, KLRB1 shows a tendency towards lower expression/prevalence in many Inflamed samples compared to Healthy and Non-inflamed samples.
- LY6E appears consistently expressed across all conditions, potentially serving as a general CD4+ T cell surface marker, although its intensity may vary.
- EMP3 and PTGER4 show more variable patterns, indicating heterogeneity within CD4+ T cells across individuals and conditions.
Biological Interpretation
The observed surfaceome markers provide insights into the functional states and potential roles of CD4+ T cells in the colon, particularly in the context of inflammation associated with IBD.
EMP3 (Epithelial Membrane Protein 3):
- Biological Mechanism: EMP3 is a member of the peripheral myelin protein 22 (PMP22) family, involved in cell-cell interactions, adhesion, and cell growth regulation. While primarily studied in the nervous system and cancer, its presence on immune cells, including T cells, might suggest roles in cell trafficking or interaction within the colon microenvironment. Its variable expression may reflect different activation states or migratory properties of CD4+ T cells.
- Signaling Pathways: Less is known about specific signaling pathways for EMP3 in T cells, but as a cell surface protein, it can potentially influence adhesion-related pathways.
- Relevance to IBD: Highly variable expression across conditions suggests it may not be a primary driver of inflammation but could contribute to the complex cellular interactions in the gut. Further research is needed to delineate its precise role in CD4+ T cell function in IBD.
- Therapeutic Potential: Currently, EMP3 is not a well-established therapeutic target in IBD.
LY6E (Lymphocyte Antigen 6 Family Member E):
- Biological Mechanism: LY6E is a glycosylphosphatidylinositol (GPI)-anchored cell surface protein. It has been implicated in T cell activation, differentiation, and survival, and is often associated with immune cell activation and tumor progression. Its broad expression suggests a fundamental role in CD4+ T cell biology.
- Signaling Pathways: LY6E can modulate TCR signaling and has been shown to enhance NF-κB activation and cytokine production in T cells. It can interact with components of lipid rafts, influencing signal transduction efficiency PubMed search: LY6E T cell signaling.
- Relevance to IBD: Consistent expression suggests it's a general feature of CD4+ T cells. While its exact role in IBD pathology needs specific investigation, its involvement in T cell activation and survival could be pertinent.
- Therapeutic Potential: As LY6E can promote T cell activation and survival, blocking its function could theoretically dampen excessive immune responses in IBD, but specific targeting strategies are not yet established for autoimmune contexts.
PTGER4 (Prostaglandin E Receptor 4 / EP4):
- Biological Mechanism: PTGER4 is a G protein-coupled receptor (GPCR) that binds prostaglandin E2 (PGE2). In T cells, PGE2-EP4 signaling is crucial for immune modulation, often exerting both pro-inflammatory and anti-inflammatory effects depending on context. In CD4+ T cells, EP4 activation can promote Th17 differentiation and suppress Treg function, contributing to inflammation GeneCards: PTGER4. It is highly relevant in gut immunology.
- Signaling Pathways: EP4 signals primarily through Gs protein, leading to increased cAMP levels, which activates PKA and downstream targets like CREB. It can also couple to Gi and Gq proteins, leading to alternative signaling cascades that influence cytokine production, cell proliferation, and migration.
- Relevance to IBD: PGE2 levels are often elevated in inflamed tissues, including the colon in IBD. Upregulation of PTGER4 on CD4+ T cells, particularly in inflamed or non-inflamed samples, could amplify pro-inflammatory responses, making it a critical player in gut inflammation. The variability observed might reflect different inflammatory milieus or the presence of distinct CD4+ T cell subsets with varying EP4 expression.
- Therapeutic Potential: Given its role in modulating inflammation, PTGER4 antagonists are being investigated as potential therapeutic agents for inflammatory diseases, including IBD. Selective EP4 antagonists could reduce pathogenic T cell responses and ameliorate gut inflammation PubMed search: PTGER4 IBD therapy.
CD63 (CD63 Molecule):
- Biological Mechanism: CD63 is a member of the tetraspanin family, widely expressed on the surface of various cells. It plays roles in cell adhesion, migration, signal transduction, and membrane organization. CD63 is also a marker of exosomes and lysosomal membranes. In T cells, it can be transiently expressed upon activation or associated with the formation of immunological synapses and exosome release UniProt: CD63.
- Signaling Pathways: Tetraspanins form complexes with integrins and other signaling molecules, modulating their activity and influencing downstream pathways related to cell migration (e.g., Rho GTPases) and T cell activation.
- Relevance to IBD: Its generally low prevalence and expression on CD4+ T cells in this dataset might indicate that it is not a constitutive marker but could mark specific transient states, such as highly activated cells or those actively involved in exosome-mediated communication within the inflamed colon. The variability suggests a nuanced role.
- Therapeutic Potential: While CD63 is involved in cellular communication (e.g., exosome biogenesis), it is not typically considered a direct therapeutic target for IBD. However, understanding its role in exosome-mediated immune regulation could open new avenues.
KLRB1 (Killer Cell Lectin Like Receptor B1 / CD161):
- Biological Mechanism: KLRB1 (CD161) is a C-type lectin receptor expressed on NK cells, NKT cells, and specific subsets of T cells, including some CD4+ T cells. It functions as an inhibitory receptor, regulating immune cell activation. CD161+ CD4+ T cells are often associated with Th17 responses, and their frequency can be altered in inflammatory conditions GeneCards: KLRB1.
- Signaling Pathways: KLRB1 contains an ITIM-like motif in its cytoplasmic tail, suggesting it can recruit phosphatases (e.g., SHP-1, SHP-2) to modulate TCR signaling, leading to inhibition of T cell activation and cytokine production.
- Relevance to IBD: The observed trend of decreased KLRB1 expression/prevalence in many Inflamed samples suggests a potential shift in the CD4+ T cell repertoire or a downregulation of this inhibitory receptor during active inflammation. Loss of KLRB1 could lead to a less regulated, more pro-inflammatory T cell response, contributing to IBD pathology.
- Therapeutic Potential: Modulating KLRB1 expression or function could be a therapeutic strategy. For instance, agonists that enhance KLRB1 signaling could dampen excessive T cell activation in IBD. Conversely, understanding the factors leading to its downregulation in inflammation might reveal novel pathways for intervention.
Clinical or Translational Implications
The differential expression of these surface markers on CD4+ T cells, particularly in the context of Inflammatory Bowel Disease, holds several clinical and translational implications:
- Diagnostic and Prognostic Biomarkers:
- The reduced prevalence or expression of KLRB1 on CD4+ T cells in inflamed colon samples could potentially serve as a marker for active inflammation in IBD. Further validation might determine its utility in distinguishing inflammatory activity or response to treatment.
- Changes in PTGER4 expression could indicate distinct pathogenic subsets of CD4+ T cells or reflect the local inflammatory milieu, potentially aiding in patient stratification.
- Therapeutic Targets:
- PTGER4: Given PGE2's role as a potent inflammatory mediator and PTGER4's involvement in shaping T cell responses in the gut, targeting the EP4 receptor with selective antagonists represents a promising therapeutic strategy for IBD. Such agents could reduce excessive inflammation by modulating pathogenic CD4+ T cell activity without completely ablating beneficial immune responses.
- KLRB1: If the downregulation of KLRB1 in inflammation contributes to uncontrolled T cell activation, strategies to restore or enhance KLRB1 expression or its inhibitory signaling could represent a novel immunomodulatory approach. This could involve small molecules or biologics designed to promote an inhibitory phenotype in pathogenic CD4+ T cells.
- Understanding IBD Pathogenesis:
- The distinct patterns for these surface markers highlight the heterogeneity of CD4+ T cell responses in the colon during inflammation. Understanding the specific subsets of CD4+ T cells defined by these markers (e.g., KLRB1-low CD4+ T cells in inflamed tissue) could reveal new insights into disease mechanisms and help develop more targeted therapies.
- The consistently high expression of LY6E suggests its importance in general T cell function in the colon, warranting further investigation into how its modulation might affect immune homeostasis versus inflammation.
In summary, this marker expression analysis provides a valuable foundation for hypothesis generation regarding CD4+ T cell function in IBD. PTGER4 and KLRB1, in particular, emerge as markers with significant potential for therapeutic targeting and deeper investigation into disease mechanisms.
15. Gene Ontology (GSA) Analysis of Macrophage States in Colon Inflammation
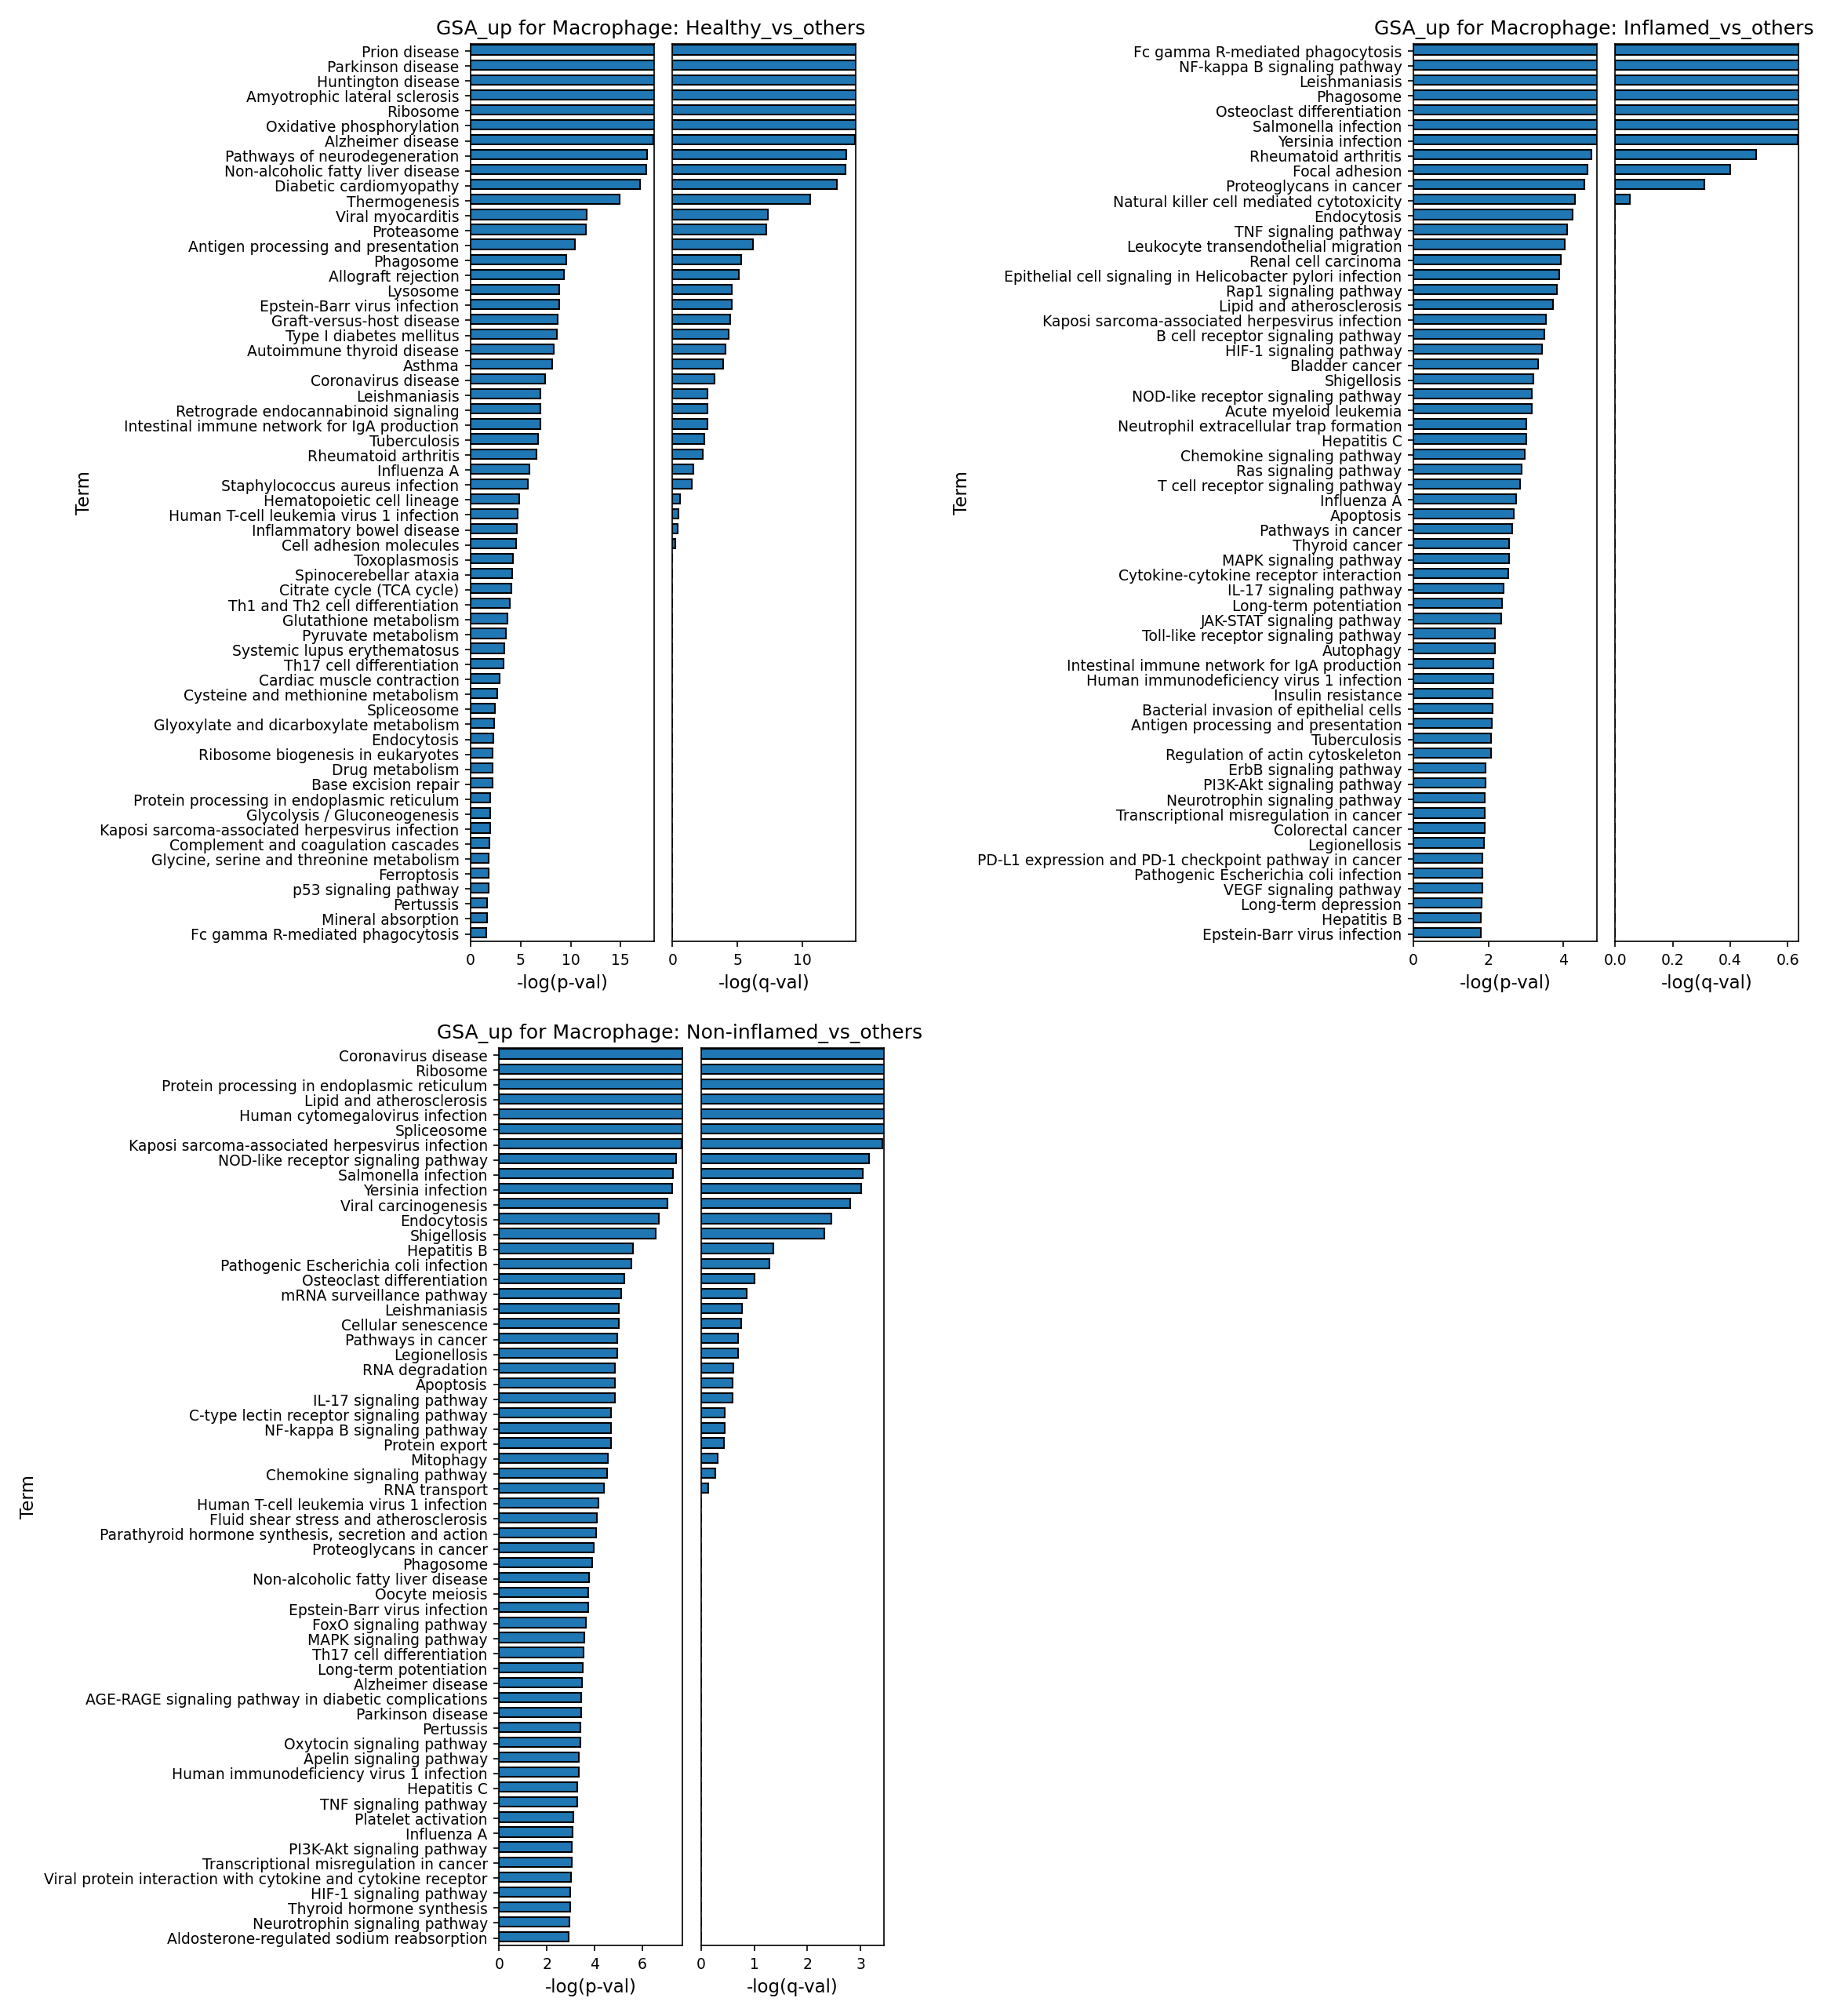
[Analysis Visualization Results]...
Analysis Overview
This analysis investigates the biological pathways and processes enriched in Macrophage cells across different conditions (Healthy, Inflamed, Non-inflamed) in the human colon, using Gene Ontology (GO) enrichment analysis (GSA). The comparison is performed for each condition against all other conditions, identifying pathways associated with upregulated genes in that specific state. This helps in understanding how macrophage function adapts and shifts in response to varying inflammatory environments, particularly relevant in the context of Inflammatory Bowel Disease (IBD).
Visual Summary
The provided bar plots illustrate the top enriched GO terms (pathways) in Macrophages for three comparative analyses: 'Healthy_vs_others', 'Inflamed_vs_others', and 'Non-inflamed_vs_others'. Terms are ranked by their -log(p-val), with corresponding -log(q-val) for False Discovery Rate (FDR) corrected significance.
Macrophages in Healthy Conditions (Healthy_vs_others)
The first plot, "GSA_up for Macrophage: Healthy_vs_others," shows a striking enrichment of pathways often associated with neurodegenerative diseases such as "Prion disease," "Parkinson disease," "Huntington disease," and "Amyotrophic lateral sclerosis," alongside general cellular processes like "Ribosome," "Oxidative phosphorylation," and "Proteasome." Other significant terms include "Antigen processing and presentation" and various metabolic pathways. The p-values for these top terms are exceptionally low (high -log(p-val) and -log(q-val)), indicating strong statistical significance.
Macrophages in Inflamed Conditions (Inflamed_vs_others)
The second plot, "GSA_up for Macrophage: Inflamed_vs_others," reveals a strong signature of pro-inflammatory and immune-response pathways. Top enriched terms include "Fc gamma R-mediated phagocytosis," "NF-kappa B signaling pathway," "Leishmaniasis" (as an infection model), "Phagosome," and "TNF signaling pathway." Pathways related to leukocyte migration ("Leukocyte transendothelial migration") and various pathogen responses (e.g., "Salmonella infection," "Yersinia infection," "Shigellosis") are also highly significant. Signaling pathways such as "HIF-1 signaling pathway," "Ras signaling pathway," and "MAPK signaling pathway" are also prominent. While many terms show low p-values, the q-values for the top terms are generally lower compared to the 'Healthy_vs_others' comparison, indicating a robust inflammatory signature.
Macrophages in Non-inflamed Conditions (Non-inflamed_vs_others)
The third plot, "GSA_up for Macrophage: Non-inflamed_vs_others," presents a mixed profile. It includes pathways related to infection and immune signaling such as "Coronavirus disease," "Human cytomegalovirus infection," "NOD-like receptor signaling pathway," and "NF-kappa B signaling pathway," similar to the inflamed state, but also a strong emphasis on general cellular maintenance and stress responses. Key terms include "Protein processing in endoplasmic reticulum," "Spliceosome," "RNA surveillance pathway," "RNA degradation," "Apoptosis," and "Mitophagy." While showing significant p-values, the corresponding q-values are generally higher than the other two conditions, suggesting a broader, perhaps less acutely specific, set of activated pathways.
Biological Interpretation
The distinct GO term enrichments provide valuable insights into the functional states of colon macrophages under different health and inflammatory conditions.
- Healthy Macrophage Homeostasis: The strong enrichment of terms like "Ribosome," "Proteasome," "Oxidative phosphorylation," and "Antigen processing and presentation" in 'Healthy_vs_others' suggests a role for macrophages in maintaining basal cellular function, protein quality control, and immune surveillance in a non-inflammatory environment. The unexpected prominence of neurodegenerative disease pathways is likely not indicative of neurodegeneration in the colon, but rather points to fundamental cellular processes that are often dysregulated in these conditions (e.g., protein aggregation, mitochondrial dysfunction, oxidative stress, lysosomal activity). In a healthy context, these pathways might reflect a robust capacity for waste management, energy production, and cellular repair, which are essential for preventing the accumulation of cellular damage that contributes to neurodegeneration elsewhere. Therefore, healthy colon macrophages appear to be actively engaged in maintaining cellular integrity and efficient waste disposal.
- Inflammatory Macrophage Activation: The 'Inflamed_vs_others' profile is a clear signature of pro-inflammatory M1-like macrophage activation, highly consistent with their role in active inflammatory conditions such as IBD. The enrichment of "Fc gamma R-mediated phagocytosis," "NF-kappa B signaling pathway" [PubMed search: NF-kappa B inflammatory bowel disease], "TNF signaling pathway" [GeneCards: TNF], and infection-related pathways demonstrates their involvement in pathogen clearance, robust immune signaling, and the propagation of inflammatory responses. The activation of "HIF-1 signaling pathway" suggests adaptation to hypoxic microenvironments common in inflamed tissues, further driving inflammatory gene expression. The presence of "Leukocyte transendothelial migration" highlights their role in recruiting other immune cells to the inflammatory site.
- Macrophages in Non-inflamed Contexts: The 'Non-inflamed_vs_others' state appears to represent macrophages that are not fully quiescent but also not fully engaged in acute inflammation. The co-occurrence of general cellular maintenance (e.g., "Protein processing in endoplasmic reticulum," "RNA surveillance pathway") with specific immune/infection responses (e.g., "NOD-like receptor signaling pathway" [GeneCards: NOD2], "Coronavirus disease") suggests these macrophages may be involved in ongoing surveillance, mild immune activation, or recovery/remodeling processes. They might be responding to low-grade stressors, viral exposures, or pre-inflammatory signals, actively processing cellular debris, or undergoing adaptations to environmental changes without escalating into a full-blown inflammatory response. This could represent a critical intermediate state in the progression or resolution of IBD.
Clinical or Translational Implications
The distinct functional states of macrophages identified through GSA have significant implications for understanding and managing inflammatory conditions in the colon, such as IBD.
- Targeted Therapeutic Strategies: The highly inflammatory signature of macrophages in the 'Inflamed' condition (e.g., NF-kappa B, TNF signaling) reinforces these pathways as prime therapeutic targets for IBD, consistent with existing anti-TNFα therapies. Identifying novel pathways, such as specific infection responses or aspects of HIF-1 signaling, could lead to new drug development.
- Understanding Disease Progression/Remission: The 'Non-inflamed' macrophage profile, with its blend of immune and cellular maintenance pathways, could offer insights into the mechanisms underlying subclinical inflammation, disease flares, or sustained remission. Targeting these processes might prevent disease progression or enhance long-term remission.
- Defining Macrophage Health and Disease: Characterizing the 'Healthy' macrophage state—which emphasizes fundamental cellular integrity and maintenance—provides a baseline for what constitutes a "healthy" immune environment in the gut. Understanding how these homeostatic processes are compromised in disease could inform preventive strategies or interventions aimed at restoring macrophage health.
16. Gene Set Enrichment Analysis (GSEA) Across Colon Cell Types and Inflammatory Conditions
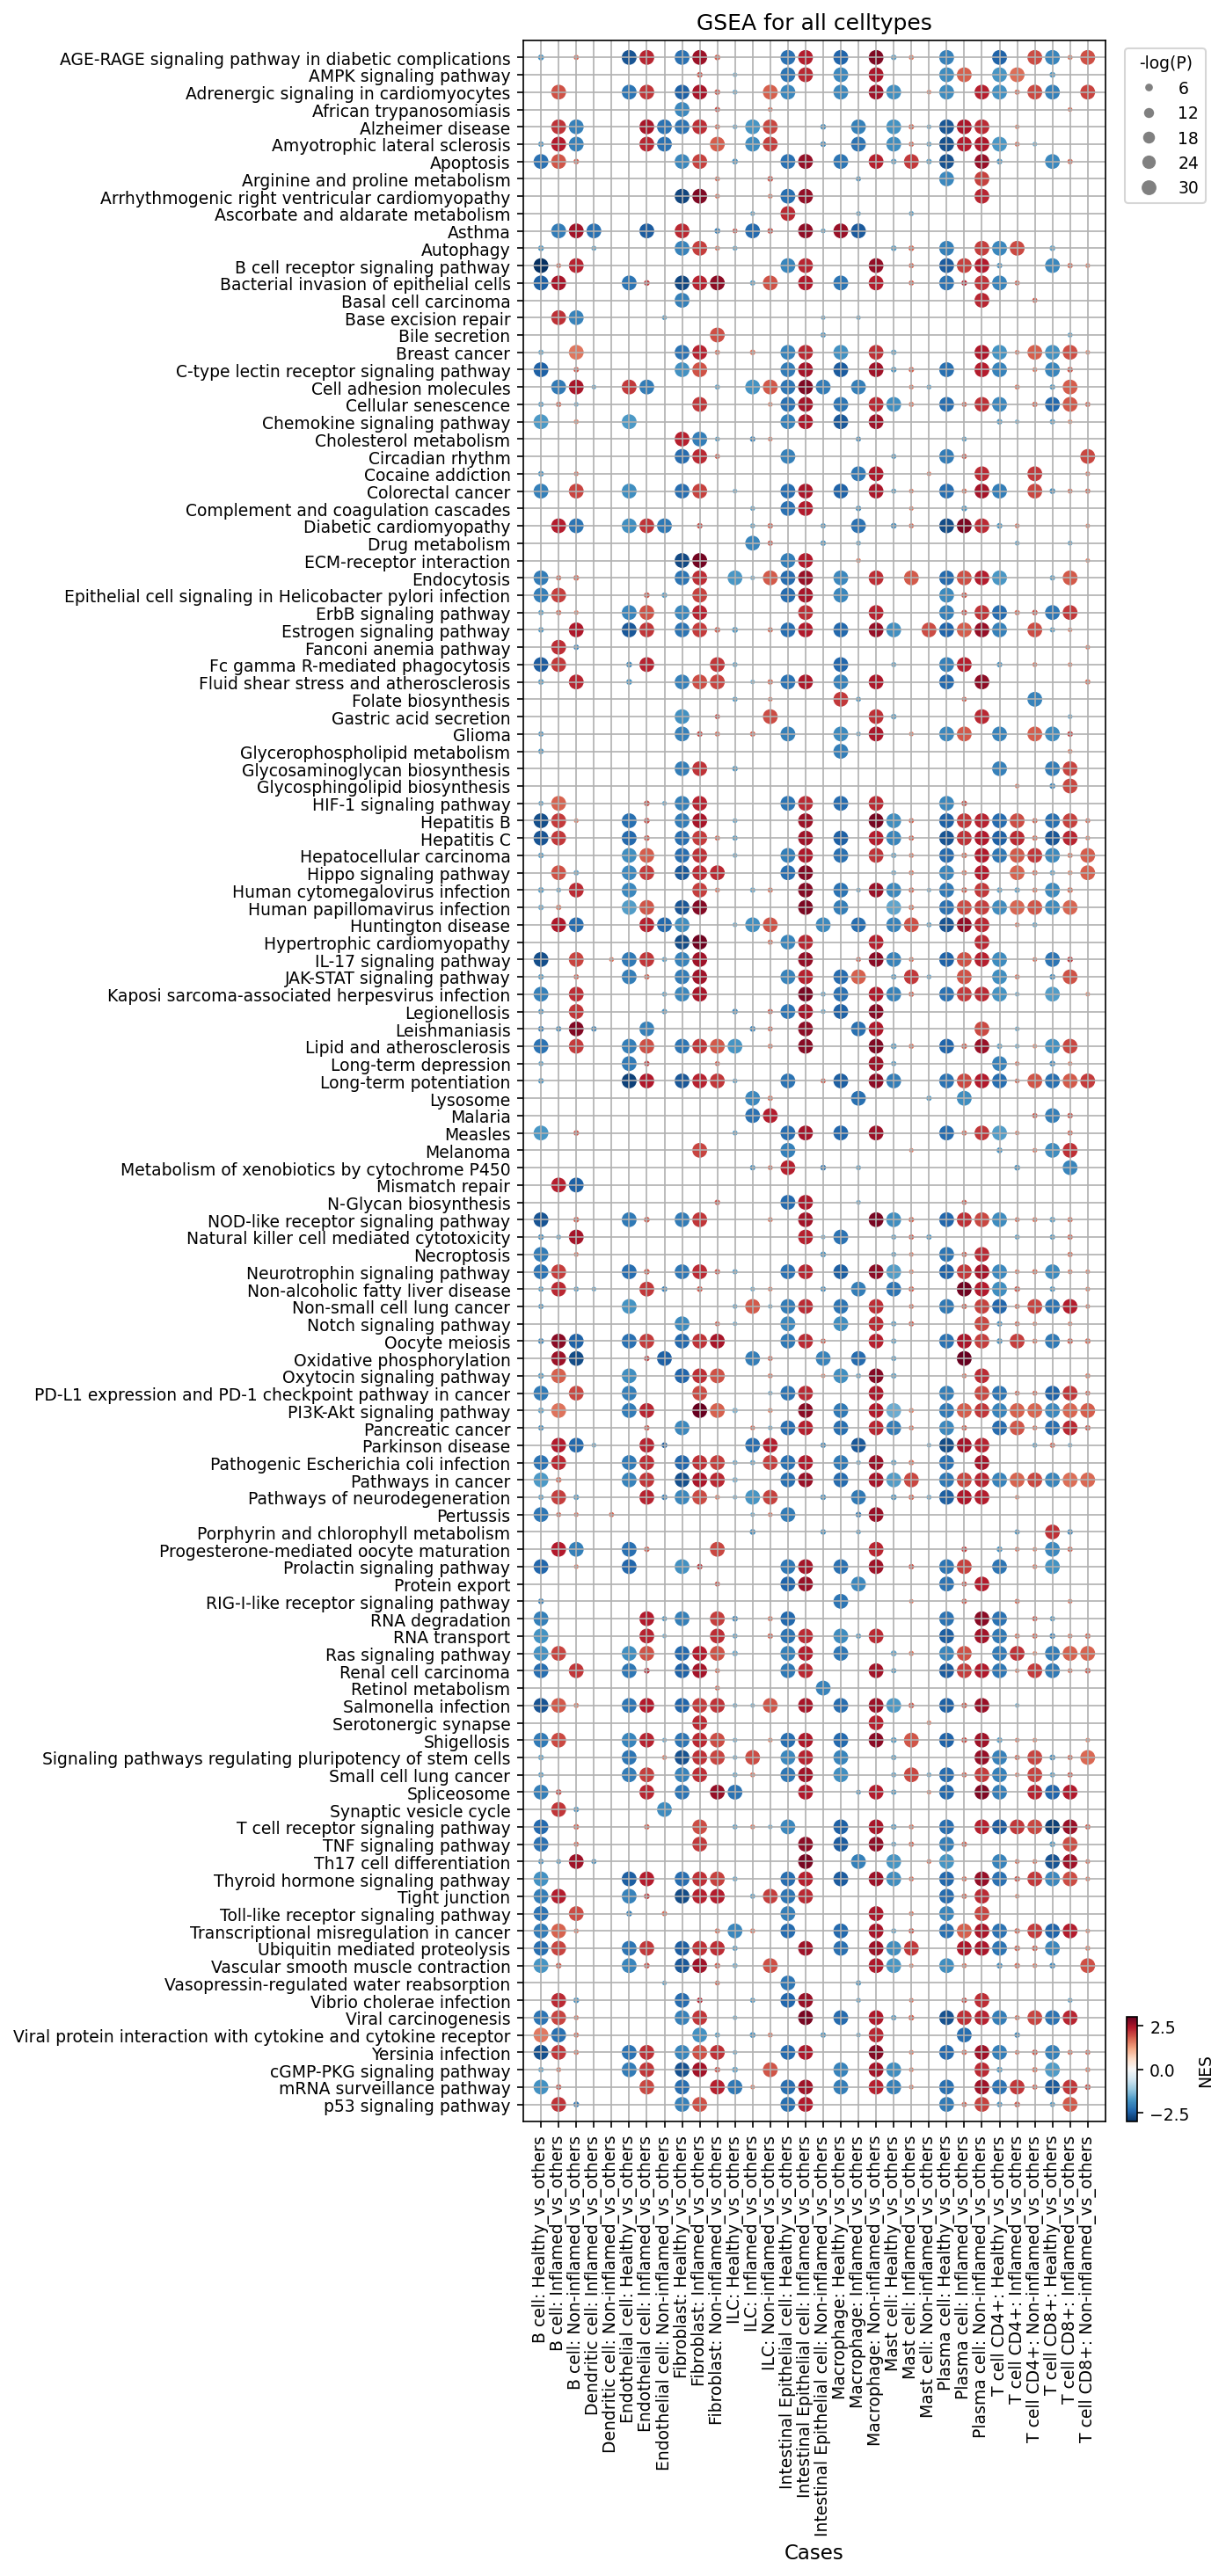
[Analysis Visualization Results]...
Analysis Overview
This analysis presents Gene Set Enrichment Analysis (GSEA) results, visualized as a dot plot, to identify pathways differentially regulated across various cell types and inflammatory conditions in human colon tissue. The analysis compares gene expression in a specific cell type under one condition (Healthy, Inflamed, or Non-inflamed) against all other conditions combined for that same cell type (e.g., Inflamed B cells vs. Healthy B cells + Non-inflamed B cells). The plot uses dot color to represent the Normalized Enrichment Score (NES), indicating pathway upregulation (red) or downregulation (blue), and dot size to reflect statistical significance (-log(p-value)). This approach allows us to uncover cell-type-specific and condition-dependent biological processes relevant to inflammatory states in the colon.
Visual Summary
The dot plot displays a matrix where the Y-axis lists 120 significantly enriched gene sets (pathways), and the X-axis represents different cell types (celltype_minor) under three comparison conditions: Healthy_vs_others, Inflamed_vs_others, and Non-inflamed_vs_others.
- Inflamed Condition Dominance: The Inflamed_vs_others columns generally show the most pronounced and widespread pathway enrichments (larger dots, brighter red/blue colors), indicating significant transcriptional reprogramming during inflammation. Many pathways are strongly upregulated (red dots) in various cell types in the Inflamed condition.
- Immune Cell Activation: Immune cell types such as B cell, Dendritic cell, Macrophage, Plasma cell, T cell CD4+, and T cell CD8+ exhibit strong upregulation of numerous immune-related signaling pathways (e.g., T cell receptor signaling pathway, B cell receptor signaling pathway, JAK-STAT signaling pathway, TNF signaling pathway, IL-17 signaling pathway, Chemokine signaling pathway) in the Inflamed_vs_others comparison.
- Intestinal Epithelial Cell Dysregulation: Intestinal Epithelial cell: Inflamed_vs_others shows a distinct pattern, with upregulation of pathways like Bacterial invasion of epithelial cells, NOD-like receptor signaling pathway, and Apoptosis, alongside a significant downregulation (blue dots) of Oxidative phosphorylation and Tight junction.
- Stromal and Endothelial Remodeling: Fibroblast: Inflamed_vs_others and Endothelial cell: Inflamed_vs_others demonstrate upregulation of pathways associated with tissue remodeling, angiogenesis, and stress responses, such as ECM-receptor interaction, HIF-1 signaling pathway, and PI3K-Akt signaling pathway.
- "Non-inflamed" Condition Insights: While generally less active than Inflamed_vs_others, the Non-inflamed_vs_others columns for immune cells often show similar, albeit less intense, patterns of immune pathway activation compared to Inflamed_vs_others. This suggests that even "non-inflamed" regions in an inflammatory context might exhibit subtle immune dysregulation when compared against a pooled reference that includes truly healthy tissue.
- "Healthy" Condition Patterns: Healthy_vs_others columns tend to show fewer strong enrichments. Notably, Oxidative phosphorylation is enriched (red dot) in Intestinal Epithelial cell: Healthy_vs_others, contrasting with its strong depletion in the Inflamed state. This highlights a shift in metabolic activity.
Biological Interpretation
Given the context of human colon tissue with 'Inflamed', 'Non-inflamed', and 'Healthy' conditions, these results strongly support the biological changes characteristic of Inflammatory Bowel Disease (IBD).
- Immune Cell Hyperactivation and Recruitment: The pervasive upregulation of JAK-STAT, TNF, IL-17, Chemokine, T cell receptor, and B cell receptor signaling pathways in multiple immune cell types during inflammation is a hallmark of IBD. This indicates robust immune activation, cytokine production, and active immune cell recruitment to the inflamed site. For instance, Chemokine signaling pathway upregulation in Dendritic cells, Macrophages, and T cells in inflamed conditions drives immune cell infiltration, a key event in IBD pathogenesis PubMed Search: "chemokine signaling inflammatory bowel disease".
- Epithelial Barrier Dysfunction: The Intestinal Epithelial cells in the Inflamed condition show a critical dysregulation. Downregulation of Tight junction pathway components suggests impaired gut barrier integrity, a known contributor to IBD by allowing increased antigen translocation from the lumen PubMed Search: "intestinal barrier inflammatory bowel disease". Concurrently, the upregulation of Bacterial invasion of epithelial cells and NOD-like receptor signaling pathway indicates increased susceptibility to microbial translocation and enhanced sensing of pathogen-associated molecular patterns, further driving inflammation. Increased Apoptosis suggests epithelial cell death, contributing to tissue damage.
- Metabolic Reprogramming: The switch from Oxidative phosphorylation (downregulated in inflamed Intestinal Epithelial cells) to potentially anaerobic metabolism (suggested by HIF-1 signaling pathway upregulation in Endothelial cells and Fibroblasts) is a common feature of inflammation and cancer, allowing immune cells and stressed tissue cells to rapidly produce energy and inflammatory mediators PubMed Search: "metabolic reprogramming inflammation gut".
- Tissue Remodeling and Fibrosis: The activation of pathways like ECM-receptor interaction, Ras signaling pathway, and PI3K-Akt signaling pathway in Fibroblasts and Endothelial cells in inflamed tissue points to ongoing processes of extracellular matrix deposition, angiogenesis, and cell proliferation, which are crucial for wound healing but can also lead to fibrosis, a significant complication in chronic IBD PubMed Search: "fibrosis inflammatory bowel disease pathway".
- Immune Checkpoint Activation: Upregulation of PD-L1 expression and PD-1 checkpoint pathway in Macrophage, T cell CD4+, and T cell CD8+ in inflamed tissue might indicate an attempt by the immune system to temper the exaggerated inflammatory response or reflect a state of T cell exhaustion, both of which are observed in chronic inflammatory conditions.
Clinical or Translational Implications
These GSEA findings provide critical insights into the molecular mechanisms underpinning IBD, with potential translational implications:
- Targeted Therapies: The consistent activation of specific signaling pathways (e.g., TNF, JAK-STAT, IL-17, Chemokine) in distinct immune and non-immune cell populations validates existing therapeutic targets (e.g., anti-TNF, JAK inhibitors) and highlights others (e.g., IL-17 pathway components, specific chemokine receptors) that could be explored for cell-type-specific interventions in IBD.
- Biomarkers of Disease Activity: Pathways and their associated genes that are highly enriched or depleted in the Inflamed condition, particularly in Intestinal Epithelial cells (e.g., Tight junction, Oxidative phosphorylation, Apoptosis), could serve as potential biomarkers for assessing disease activity, treatment response, or risk of complications like fibrosis or epithelial dysfunction.
- Understanding Pathogenesis: The multi-faceted changes observed across various cell types underscore the complex interplay between immune cells, epithelial cells, and stromal components in driving and maintaining gut inflammation. For instance, the metabolic reprogramming in epithelial cells could be a therapeutic target to restore gut homeostasis.
- Monitoring Non-Inflamed Regions: The detection of subtle pathway enrichments in Non-inflamed_vs_others suggests that even macroscopically "healthy" tissue in IBD patients might harbor subclinical inflammation or pre-inflammatory changes. This could inform surveillance strategies or proactive intervention to prevent disease flares.
17. Discussion
The single-cell analysis of human colon tissue provides a high-resolution view of the cellular and molecular landscape in Inflammatory Bowel Disease (IBD), revealing profound condition-specific changes that extend beyond overt inflammation. The UMAP visualizations confirm robust cell type annotation and highlight a clear separation of cellular states between healthy, non-inflamed, and inflamed tissues, indicating that inflammatory processes induce distinct transcriptional and compositional shifts.
Cellular Landscape Remodeling in IBD: A central finding is the drastic remodeling of the colon's cellular composition during inflammation. Healthy colon tissue is dominated by Intestinal Epithelial cells, but in inflamed states, there is a marked decrease in their relative proportion, consistent with epithelial damage and displacement. Concurrently, a substantial infiltration and expansion of immune cells — including B cells, plasma cells, T cells (CD4+ and CD8+), Dendritic cells, and Macrophages — are observed. This immune cell accumulation, particularly of B cells and plasma cells, underscores their critical role in local humoral immunity and antibody production in IBD pathogenesis. Notably, even 'Non-inflamed' regions often exhibit an intermediate immune cell profile, suggesting subclinical inflammation or ongoing immune dysregulation.
T Cell and ILC Dysregulation: Detailed analysis of T cell subsets reveals specific proportional shifts. While Th1, Th2, and Cytotoxic T cell proportions decrease in inflamed/non-inflamed conditions relative to healthy, there are significant increases in Th17, Th22, Treg, and Tfh cells in inflamed tissue. The robust elevation of Th17 and Th22 cells is a hallmark of chronic inflammation, driving tissue damage and immune responses. The concomitant increase in Tregs may represent a compensatory mechanism, though their functional efficacy in an inflammatory milieu warrants further investigation. Furthermore, a prominent increase in Innate Lymphoid Cells (ILC1, ILC2, ILC3 (NCR+)) and NK cells in inflamed and some non-inflamed samples highlights ILC dysregulation as a key contributor to chronic inflammation in IBD.
Macrophage Polarization and Immune Dysregulation: Macrophages exhibit a striking shift towards a pro-inflammatory M1-like phenotype in both inflamed and non-inflamed conditions, evidenced by the dominance of M1 macrophage proportions and the enrichment of pathways like Fc gamma R-mediated phagocytosis, NF-kappa B, and TNF signaling. Surface markers like CLEC7A, CD44, CYBB, and ITGB1 are highly upregulated in inflamed macrophages, signifying robust innate immune activation and oxidative stress. Concomitantly, M2 macrophage subsets show complex dynamics: Mac (M2B) and Mac (M2C) increase in inflammation, while Mac (M2D) decreases. The persistent M1 dominance, even in non-inflamed areas, suggests a sustained pro-inflammatory immune environment that may contribute to chronic disease and relapse, while the changes in M2 subsets highlight impaired resolution or altered tissue repair.
Epithelial Barrier Compromise and Remodeling: Intestinal Epithelial cells in inflamed tissue undergo profound transcriptional reprogramming. They upregulate MHC Class II molecules (HLA-DRB1/DRA, CD74), suggesting enhanced antigen-presenting capabilities, which can perpetuate inflammation. Adhesion molecules (CEACAM5, CDH1, DSG2, ITGB1, ITGA6, CD44), mucins (MUC1, MUC4, MUC12, MUC13), and immune modulators (CD47, ADAM15) are also upregulated, indicating significant alterations in epithelial-immune interactions and barrier function. Conversely, functional transporters like SLC26A3/2 and AQP8 are decreased, consistent with impaired fluid and electrolyte balance and overall epithelial dysfunction. GSEA further highlights downregulation of 'Tight junction' components and Oxidative phosphorylation, alongside upregulation of Bacterial invasion and Apoptosis pathways, reinforcing a compromised barrier and metabolic stress.
Fibroblast Activation and Fibrosis: Fibroblasts in inflamed colon tissue exhibit a pro-fibrotic and pro-inflammatory phenotype. Upregulated surface markers include IL6ST (GP130), THY1 (CD90), VCAM1, MMP14, F2R (PAR1), and CDH11. These markers are involved in inflammatory signaling, extracellular matrix remodeling, cell adhesion, and fibroblast activation, contributing to tissue stiffness and potential stricture formation. The activation of pathways such as ECM-receptor interaction, Ras signaling, and PI3K-Akt signaling in fibroblasts and endothelial cells further underscores ongoing tissue remodeling and angiogenesis, characteristic of chronic inflammation and fibrosis in IBD.
Dysregulated Cell-Cell Communication: Cell-cell interaction analyses reveal a significantly enhanced and altered communication network in inflamed tissues. Key interactions include the SPP1-CD44 axis, CXCL12-CXCR4, Prostaglandin E2 signaling (via PTGES3-PTGER2/4), and PDGFA-PDGFRA. Integrin-mediated adhesion (e.g., FN1_integrin_a6b7, VCAM1_integrin_a4b1) between fibroblasts, epithelial cells, and immune cells is robustly active, facilitating immune cell recruitment and tissue remodeling. These interactions represent critical nodes of intercellular crosstalk driving inflammation and tissue pathology.
Metabolic Reprogramming as a Driver of Disease: Beyond individual cell types, a broad metabolic reprogramming is observed. Intestinal epithelial cells show a shift away from oxidative phosphorylation, potentially reflecting adaptation to hypoxic conditions or inflammatory stress. This metabolic inflexibility could impair their regenerative capacity and contribute to barrier dysfunction.
In conclusion, this single-cell atlas delineates the intricate molecular and cellular mechanisms underpinning IBD pathogenesis, highlighting not only immune cell hyperactivation but also crucial roles for epithelial and stromal cells in perpetuating chronic inflammation, barrier dysfunction, and fibrotic remodeling. The observed heterogeneity, particularly in 'Non-inflamed' tissues, underscores the complexity of IBD and the need for targeted interventions that consider the full spectrum of disease states.
Hypotheses:
- Chronic inflammation in the colon, characteristic of IBD, drives a shift in T cell differentiation towards pro-inflammatory Th17 and Th22 subsets, while increasing Treg cells to counteract overwhelming inflammation, whose function may be impaired.
- Macrophages in both actively inflamed and macroscopically non-inflamed colon tissue adopt a persistent pro-inflammatory M1-like polarization state, which is sustained by specific surface marker expression (e.g., CLEC7A, CD44, CYBB) and pathway activation (e.g., NF-kappa B, TNF signaling), thereby contributing to chronic inflammation and impaired resolution.
- Intestinal epithelial cells in IBD exhibit a compromised barrier function, characterized by downregulation of tight junction components and fluid/electrolyte transporters (e.g., SLC26A3, AQP8), coupled with increased immune antigen presentation (e.g., HLA-DRB1/DRA) and susceptibility to bacterial invasion, actively contributing to perpetuating inflammation.
- Fibroblasts in the inflamed colon undergo significant activation and differentiation into myofibroblast-like cells, marked by increased expression of IL6ST, THY1, VCAM1, and MMP14, which drives extracellular matrix remodeling and promotes pathogenic immune cell recruitment and tissue fibrosis.
- Specific cell-cell interaction axes, such as SPP1-CD44, CXCL12-CXCR4, and various integrin-ligand pairs (e.g., VCAM1-integrin_a4b1), are dysregulated in inflamed colon, acting as critical communication hubs between immune, epithelial, and stromal cells to propagate inflammation and drive tissue pathology.
- The observed metabolic reprogramming, particularly the downregulation of oxidative phosphorylation in inflamed intestinal epithelial cells, indicates a shift towards altered energy metabolism that impairs epithelial barrier integrity and regenerative capacity, contributing to IBD pathology.
Potential therapeutic targets:
- Integrins (e.g., α4β1, α4β7, α6β7, α1β1) / VCAM1: Integrin-mediated adhesion and VCAM1 expression are profoundly upregulated in inflamed and non-inflamed colon tissue, particularly on fibroblasts, macrophages, and epithelial cells. These interactions facilitate immune cell trafficking, tissue remodeling, and epithelial-stromal crosstalk, critically driving inflammation and fibrosis in IBD. Evidence: Increased VCAM1_integrin_a4b1_complex--Fib|Mac and FN1_integrin_a6b7_complex--Fib|Ent.Epi interactions are highly active in Inflamed and Non-inflamed conditions (Section 10). Macrophages show upregulated ITGB1 in inflammation (Section 12). Fibroblasts show upregulated VCAM1 (Section 13). GSEA indicates upregulation of 'ECM-receptor interaction' (Section 16). Validation: Test existing integrin inhibitors (e.g., Vedolizumab (α4β7), Natalizumab (α4)) in IBD animal models or clinical trials with a focus on specific cell populations and fibrotic outcomes. Develop novel antibodies or small molecules against VCAM1 itself or other key integrin subunits (e.g., α6, β1, α1) and evaluate their efficacy in organoid/co-culture models and patient biopsies via functional assays and immunostaining.
- IL-6/GP130 Signaling Pathway (IL6ST): IL-6 signaling is a potent driver of chronic inflammation and fibrosis. Upregulation of the GP130 receptor subunit (IL6ST) on fibroblasts in inflamed tissue indicates heightened responsiveness to IL-6, promoting fibroblast activation, proliferation, and extracellular matrix production. Evidence: IL6ST is markedly higher on fibroblasts in Inflamed samples (Section 13). GSEA shows upregulation of 'JAK-STAT signaling pathway' (which IL-6 uses) in multiple immune cell types during inflammation (Section 16). Validation: Evaluate the efficacy of existing IL-6R blocking antibodies (e.g., tocilizumab, sarilumab) in IBD patients, specifically monitoring fibroblast activation markers (e.g., THY1, MMP14) in biopsies. Develop novel strategies directly targeting GP130 on stromal cells and test in fibroblast culture models or fibrosis-prone animal models of IBD.
- Prostaglandin E Receptor 4 (PTGER4 / EP4): PGE2 is a critical lipid mediator of inflammation, and its receptor PTGER4 is expressed on CD4+ T cells, where its activation can promote Th17 differentiation and suppress Treg function, contributing to inflammation in the gut. PGE2 signaling is also a prominent cell-cell interaction in inflamed colon. Evidence: PGE2 signaling is a strong and significant cell-cell interaction in inflamed colon (Section 9 & 10). PTGER4 is present on CD4+ T cells with variable expression, showing potential for modulation in inflammation (Section 14). Validation: Administer selective EP4 antagonists in IBD animal models and assess their impact on Th17/Treg balance, cytokine production, and overall gut inflammation. Evaluate PTGER4 expression and signaling in patient-derived T cells and test the effects of EP4 modulation on their inflammatory responses in vitro.
- CLEC7A (Dectin-1): CLEC7A is a C-type lectin receptor highly expressed on macrophages in inflamed tissue, indicating robust innate immune activation and initiation of downstream pro-inflammatory signaling pathways (e.g., NF-κB), contributing to excessive inflammation in IBD. Evidence: CLEC7A is a key surface marker highly expressed in inflamed macrophages (Section 12). Macrophages in the inflamed condition show strong enrichment of 'NF-kappa B signaling pathway' (Section 15). Validation: Develop inhibitors or blocking antibodies against CLEC7A and test their effect on macrophage activation, cytokine production, and inflammation in ex vivo colon explants from IBD patients or in IBD animal models. Monitor downstream NF-κB activation.
- CXCL12-CXCR4 Axis: The CXCL12-CXCR4 axis is critical for immune cell trafficking and retention. Its sustained activity in inflamed and non-inflamed colon, particularly involving fibroblasts and T cells, suggests its role in promoting immune cell infiltration and potentially contributing to chronic inflammation and fibrosis in IBD. Evidence: CXCL12-CXCR4 is a strong and significant cell-cell interaction in healthy, inflamed, and non-inflamed conditions, specifically Fib|T CD4+ (Section 9 & 10). Validation: Investigate the efficacy of CXCR4 antagonists (e.g., Plerixafor or novel compounds) in preclinical IBD models to reduce immune cell infiltration and assess impacts on inflammation and fibrosis. Use flow cytometry to track CXCR4+ immune cells in colon biopsies from treated patients.
Follow-up validation ideas:
- Flow Cytometry/Immunostaining: Quantify the proportions of Th17, Th22, Treg, and ILC subsets (ILC1, ILC2, ILC3 (NCR+)) in fresh colon biopsies from IBD patients and healthy controls to validate the observed population shifts. Use specific surface markers (e.g., KLRB1 for a subset of CD4+ T cells) to confirm differential expression and localization within the inflamed mucosa.
- Spatial Transcriptomics/Immunofluorescence: Investigate the spatial distribution and co-localization of M1-like macrophages (e.g., expressing CLEC7A, CD44, CYBB), activated fibroblasts (e.g., THY1+, VCAM1+), and epithelial cells expressing MHC Class II (e.g., HLA-DRB1/DRA) in inflamed versus non-inflamed colon tissues to confirm their proximity and potential for direct cell-cell interactions. This can validate key CCI findings.
- Organoid/Co-culture Models: Develop patient-derived intestinal epithelial organoids or co-culture systems with macrophages and fibroblasts, simulating inflamed conditions. Perturb specific signaling pathways (e.g., using inhibitors for NF-kappa B, TNF, IL-6, or specific integrins like ITGB1) or block identified ligand-receptor interactions (e.g., SPP1-CD44, VCAM1-integrin) to assess their impact on epithelial barrier integrity, cytokine production, macrophage polarization, and fibroblast activation.
- Targeted qPCR/Western Blot: Validate the differential expression of key surface markers (e.g., SLC26A3, AQP8, CEACAM5, MUC1, PTGER4, KLRB1) in sorted epithelial cells, macrophages, fibroblasts, and T cells from IBD patient biopsies versus controls. This provides orthogonal confirmation of the scRNA-seq findings at the protein or mRNA level.
- Functional Assays for Epithelial Barrier: Conduct transepithelial electrical resistance (TEER) measurements and dextran permeability assays on epithelial cell monolayers or organoids after specific pathway perturbations (e.g., targeting tight junction components or mucins, or co-culturing with activated immune cells) to functionally validate epithelial barrier dysfunction in IBD.
- In Vivo Animal Models: Utilize genetically modified mouse models of IBD (e.g., IL-10 knockout, DSS-induced colitis) or humanized mouse models to test the efficacy of blocking agents (e.g., anti-IL6ST, anti-VCAM1, anti-CLEC7A, PTGER4 antagonists) targeting identified therapeutic candidates on disease progression, inflammation resolution, and fibrosis development. Assess cellular infiltrates and gene expression changes in response to treatment.
- Single-Cell Validation Cohorts: Apply the identified cellular and molecular signatures (e.g., M1 macrophage polarization markers, Th17/Th22 T cell profiles, epithelial barrier gene expression) to an independent cohort of IBD patients using single-cell RNA-seq or multiplexed spatial proteomics to confirm generalizability and prognostic value.
- Metabolic Flux Analysis: Perform metabolic profiling (e.g., Seahorse assay) on sorted intestinal epithelial cells from healthy and inflamed colon to confirm the shift away from oxidative phosphorylation and explore alternative metabolic pathways, providing functional validation of the observed metabolic reprogramming.
Limitations:
This report is based on single-cell RNA sequencing data, which provides valuable insights into cell states and interactions but has inherent limitations. The analysis infers cell-cell interactions and pathway activities from gene expression, which may not always directly reflect functional protein interactions or signaling kinetics. The 'Non-inflamed' condition, particularly in the context of IBD, can be highly heterogeneous, potentially encompassing quiescent disease, subclinical inflammation, or areas affected by past inflammation, leading to varied cellular and molecular profiles that are challenging to distinguish without comprehensive clinical staging. The dataset, while extensive, is a snapshot in time and does not capture the dynamic progression of IBD. The use of surfaceome-only markers in some analyses might exclude crucial intracellular regulators. Furthermore, while the inferred disease is Inflammatory Bowel Disease, the specific subtype (Crohn's disease vs. Ulcerative Colitis) or clinical severity cannot be definitively determined from the provided metadata alone. Therapeutic target suggestions are based on correlative findings and literature; their functional validation and clinical translation require extensive experimental and clinical trials.
18. Query List
- Show and save UMAPs for condition, sample, major cell type, minor cell type, and celltype_subset in two columns.
- Show major cell type scores on UMAP and save the result.
- Show and save a marker expression dot plot for celltype_subset. SET target_cell = None and var_group_rotation = 45. Leave all other arguments at their default values.
- Show and save a population bar plot of minor cell types.
- Show and save a population bar plot of T cell subsets.
- Show and save box plots of T cell subset populations with statistically significant differences between conditions, if any. Choose ncols based on the total number of panels.
- Show and save a population bar plot of macrophage subsets.
- Show and save box plots of macrophage subset populations with statistically significant differences between conditions, if any. Choose ncols based on the total number of panels.
- Show and save cell-cell interaction patterns. Select at most 80 cell-cell interactions per group.
- Find cell-cell interactions involving major immune and stromal cells that differ significantly between conditions, show them as a dot plot, and save the result. Set max_n_items_per_group to 60. For each interaction identified under each condition, using the provided dataset context, describe the associated signaling pathways and mechanisms and, where relevant, its potential as a therapeutic target and related therapeutic agents.
- Show marker expressions for Intestinal Epithelial cell in a dot plot, and save the result. Use only surfaceome markers, with at most 50 markers per condition. For each marker identified under each condition, using the provided dataset context, describe the associated signaling pathways and biological mechanisms within the tissue and, where relevant, its potential as a therapeutic target for the disease and related therapeutic agents.
- Show marker expressions for Macrophage in a dot plot, and save the result. Use only surfaceome markers, with at most 40 markers per condition. For each marker identified under each condition, using the provided dataset context, describe the associated signaling pathways and biological mechanisms within the tissue and, where relevant, its potential as a therapeutic target for the disease and related therapeutic agents.
- Show marker expressions for Fibroblast in a dot plot, and save the result. Use only surfaceome markers, with at most 40 markers per condition. For each marker identified under each condition, using the provided dataset context, describe the associated signaling pathways and biological mechanisms within the tissue and, where relevant, its potential as a therapeutic target for the disease and related therapeutic agents.
- Show marker expressions for T cell CD4+ in a dot plot, and save the result. Use only surfaceome markers, with at most 40 markers per condition. For each marker identified under each condition, using the provided dataset context, describe the associated signaling pathways and biological mechanisms within the tissue and, where relevant, its potential as a therapeutic target for the disease and related therapeutic agents.
- Show Gene Ontology (GSA) analysis results for Macrophage as a bar plot, and save the result.
- Show Gene Set Enrichment Analysis results as a dot plot, and save it. Set the color map to RdBu_r, n_pws_to_show to 120, and target_cells to None.