Single-Cell Transcriptomic Atlas of Human Colon Reveals Distinct Immune and Stromal Alterations in Inflammation
This report presents a comprehensive single-cell analysis of human colon tissue, delineating the cellular landscape across healthy, non-inflamed, and inflamed conditions. Key findings highlight significant shifts in immune cell populations, particularly the expansion of pro-inflammatory T cell and macrophage subsets, even in macroscopically non-inflamed regions. Cellular crosstalk through specific ligand-receptor interactions and pathway activations involving both immune and stromal cells is profoundly altered during inflammation, pointing to critical mechanisms driving disease pathogenesis and tissue remodeling in the colon.
Contents
- Dataset overview
- UMAP Analysis of Colon Single-Cell RNA-Seq Data
- Major Cell Type Score Visualization on UMAP
- Celltype Subset Marker Expression Validation
- Minor Cell Type Population Analysis in Colon Samples
- T cell and Innate Lymphoid Cell Subset Distribution Across Colon Conditions
- T Cell and ILC Subset Population Shifts in Colon Across Inflamed and Non-Inflamed Conditions
- Colon Macrophage Subset Population Shifts Across Inflammatory States
- Macrophage Subset Population Shifts in Colon Inflammation
- Condition-Specific Cell-Cell Interaction Analysis in Colon
- Condition-Specific Cell-Cell Interaction Patterns in Human Colon
- Macrophage Condition-Specific Surfaceome Markers in Colon Tissue
- Fibroblast Condition-Specific Surfaceome Markers in Colon Tissue
- CD4 T Cell Condition-Specific Surfaceome Markers in Colon
- Gene Ontology (GSA) Analysis of Intestinal Epithelial Cells Across Colon Conditions
- Gene Set Enrichment Analysis (GSEA) of Colon Cell Types Across Health and Inflammatory States
- Discussion
- Query List
0. Dataset overview
Dataset Summary
- This dataset is an AnnData object derived from single-cell RNA-seq data, containing 97,411 cells and 18,151 genes.
- Species: Human, Tissue: Colon.
- Conditions: Non-inflamed, Inflamed, Healthy, with 'Healthy' as the reference condition for differential analyses.
Cell types are categorized at multiple levels
- Major: B cell, T cell, Myeloid cell, Mast cell, Stromal cell, Intestinal Epithelial cell, Endothelial cell, unassigned.
- Minor: Plasma cell, T cell CD8+, T cell CD4+, Macrophage, Dendritic cell, Mast cell, ILC, B cell, Fibroblast, NK cell, Intestinal Epithelial cell, Endothelial cell, Smooth muscle cell, unassigned.
- Subset: Includes more granular classifications like Plasma cell, T cell (Cytotoxic), Macrophage (M1), Goblet cell, and many others, including unassigned.
Key precomputed results available include
- Cell-cell interaction (CCI) results at both condition and sample levels.
- Differential Expression Gene (DEG) results, comparing conditions or conditions against a reference, for various celltype_minor groups.
- Gene Set Enrichment Analysis (GSEA) and Gene Set Analysis (GSA/GO) results, comparing conditions or conditions against a reference, for various celltype_minor groups.
1. UMAP Analysis of Colon Single-Cell RNA-Seq Data
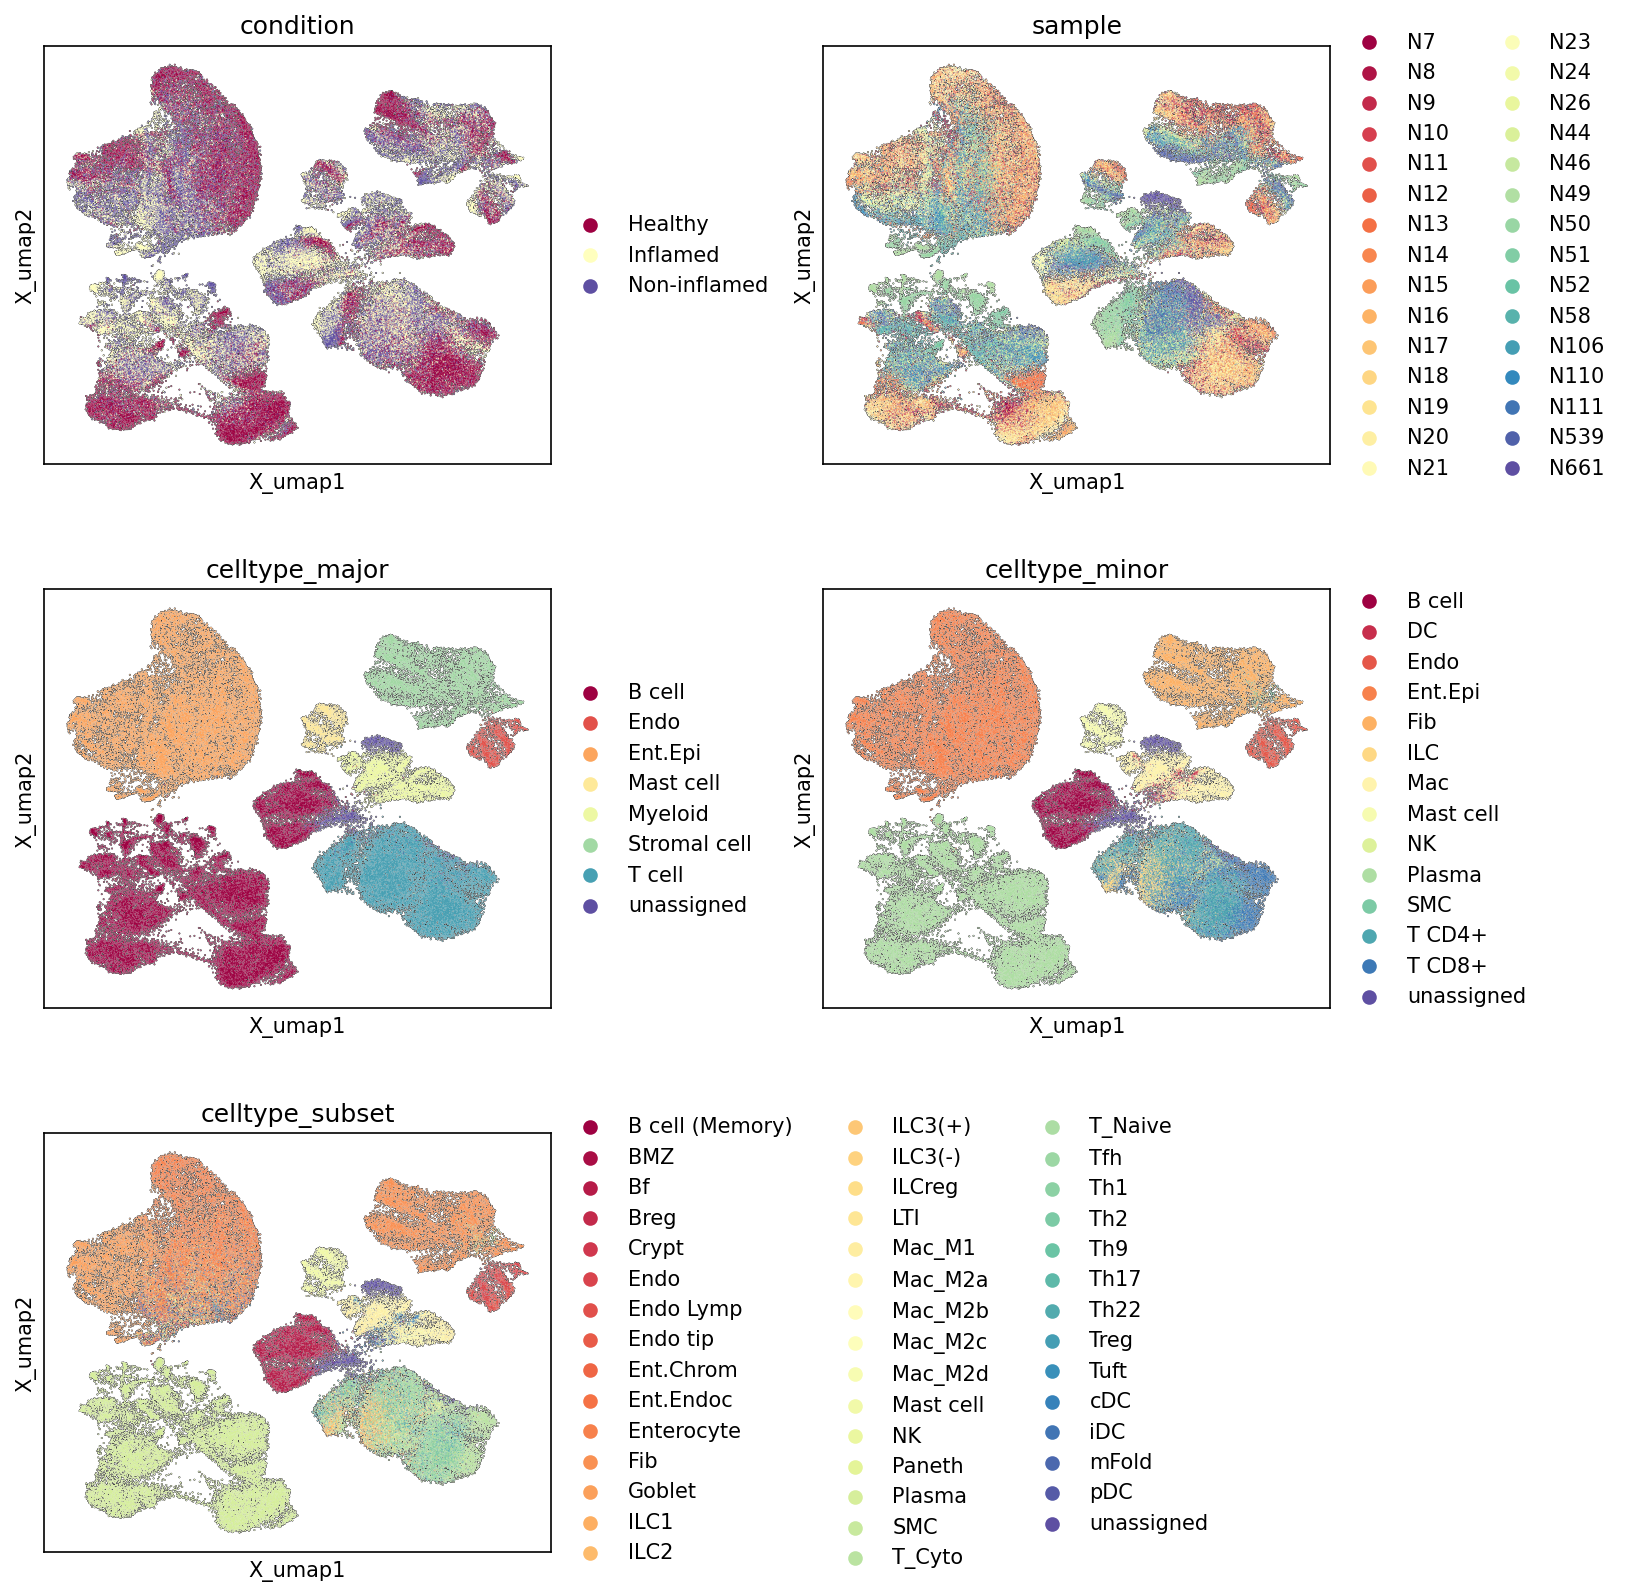
[Analysis Visualization Results]...
Analysis Overview
This analysis presents Uniform Manifold Approximation and Projection (UMAP) plots of single-cell RNA-sequencing data from human colon tissue. The UMAPs visualize the cellular landscape, with individual cells colored according to their condition (Healthy, Inflamed, Non-inflamed), sample origin, and hierarchical celltype annotations (celltype_major, celltype_minor, celltype_subset). This visualization is crucial for assessing the quality of cell clustering, identifying cell populations, and observing how cellular composition and states vary across different conditions and samples. The dataset comprises 97,411 cells and 18,151 genes.
Visual Summary
Condition Distribution
The UMAP colored by condition reveals clear patterns related to the inflammatory state.
- Healthy vs. Non-inflamed: Cells from Healthy and Non-inflamed conditions show substantial overlap across many clusters. This suggests that the transcriptomic profiles of cells from non-inflamed regions, whether from healthy individuals or non-affected areas in diseased individuals, are largely similar and represent a baseline or quiescent state of the colon.
- Inflamed: Cells from the Inflamed condition demonstrate distinct distributions. While some inflamed cells are intermixed with healthy/non-inflamed populations, indicating shared cell types or milder inflammation, other clusters are predominantly enriched with inflamed cells. This indicates condition-specific alterations in cellular composition or gene expression programs, particularly within immune cell compartments, which is characteristic of inflammatory processes.
Sample Distribution
The UMAP colored by sample shows a generally good mixing of cells from different individual samples across the major cellular clusters. This observation is critical as it suggests that technical variations or batch effects associated with individual samples are not dominating the overall cellular embedding. The biological differences (e.g., cell types, disease states) appear to be the primary drivers of the clustering structure, which enhances the reliability of downstream comparisons.
Cell Type Hierarchy (Major, Minor, Subset)
The UMAPs colored by celltype_major, celltype_minor, and celltype_subset progressively reveal the hierarchical resolution of cell populations.
- Celltype_major: Major cell types such as Intestinal Epithelial cells (Ent.Epi), T cells, Myeloid cells, Stromal cells, B cells, Endothelial cells, and Mast cells form well-defined, spatially separated clusters. This indicates robust identification of the principal cellular components of the colon. The "unassigned" category is minimal, suggesting comprehensive initial annotation.
- Celltype_minor: Within these major clusters, further granularity is observed. For instance, T cells differentiate into T cell CD4+ and T cell CD8+ clusters, while Myeloid cells resolve into Macrophage and Dendritic cell populations. Other distinct minor types include Plasma cell, Fibroblast, ILC, NK cell, Smooth muscle cell (SMC), and Intestinal Epithelial cell. These minor types generally maintain coherent, although sometimes more interconnected, structures, reflecting distinct functional subtypes.
- Celltype_subset: The highest resolution, celltype_subset, reveals even finer cellular identities, such as T cell (Cytotoxic), T cell (Naive), T cell (Treg), Macrophage (M1), Macrophage (M2D), Goblet cell, Paneth cell, Enterocyte, ILC1, ILC2, ILC3, DC (Classical), and DC (Plasmacytoid). These subsets often form distinct groupings within their respective minor cell type regions, allowing for a detailed understanding of the specific cell states present in the tissue.
Biological Interpretation
The UMAP visualizations provide a comprehensive overview of the cellular landscape of the human colon and its alterations in inflammatory conditions.
- Colon Tissue Heterogeneity: The clear separation of cell types from celltype_major to celltype_subset level highlights the remarkable cellular heterogeneity of the human colon. This includes distinct immune cell populations (T cells, B cells, myeloid cells, ILCs), epithelial cells crucial for barrier function (Enterocytes, Goblet, Paneth, Tuft cells), and stromal components (Fibroblasts, Smooth muscle cells, Endothelial cells). The high-resolution annotation is fundamental for studying the specialized functions and interactions within this complex organ.
- Inflammation-Associated Cellular Shifts: By examining the condition UMAP in conjunction with the cell type maps, we can infer which specific cell populations are primarily affected by inflammation.
- The marked enrichment of Inflamed cells within certain immune cell clusters (e.g., T cell clusters, particularly those containing T cell CD8+ and T cell CD4+ subsets) strongly suggests an activated immune response. This aligns with the known pathophysiology of inflammatory bowel diseases (IBD) where T cell infiltration and activation play a critical role PubMed search: T cell inflammatory bowel disease.
- Similarly, myeloid cell clusters, encompassing various Macrophage and Dendritic cell subtypes, likely exhibit shifts in composition or activation states, given their crucial roles in initiating and resolving inflammation. Macrophages, for instance, can differentiate into pro-inflammatory M1-like or anti-inflammatory/reparative M2-like phenotypes, which can significantly influence disease progression GeneCards: Macrophage markers.
- While epithelial cells (Intestinal Epithelial cell, Enterocyte, Goblet cell) show some mixture of conditions, subtle condition-specific changes within these populations would be expected, reflecting the impact of inflammation on barrier integrity and epithelial cell function.
- Data Quality and Annotation Robustness: The distinct and biologically meaningful separation of cell populations across all annotation levels, combined with the successful mitigation of sample-specific batch effects, indicates a high-quality dataset and robust cell type annotation. This solid foundation allows for confidence in subsequent differential expression and pathway analyses.
Annotation Notes
The comprehensive annotation from celltype_major to celltype_subset provides exceptional detail. The small proportion of "unassigned" cells across all annotation levels is a positive indicator of the thoroughness of the cell typing process. The distinction between "Non-inflamed" and "Healthy" conditions, despite some overlap, suggests that "Non-inflamed" tissue may include histologically normal tissue from diseased individuals, providing a valuable comparison point against overtly inflamed tissue within the same disease context, beyond just comparing to healthy controls.
2. Major Cell Type Score Visualization on UMAP
[Analysis Visualization Results]...
Analysis Overview
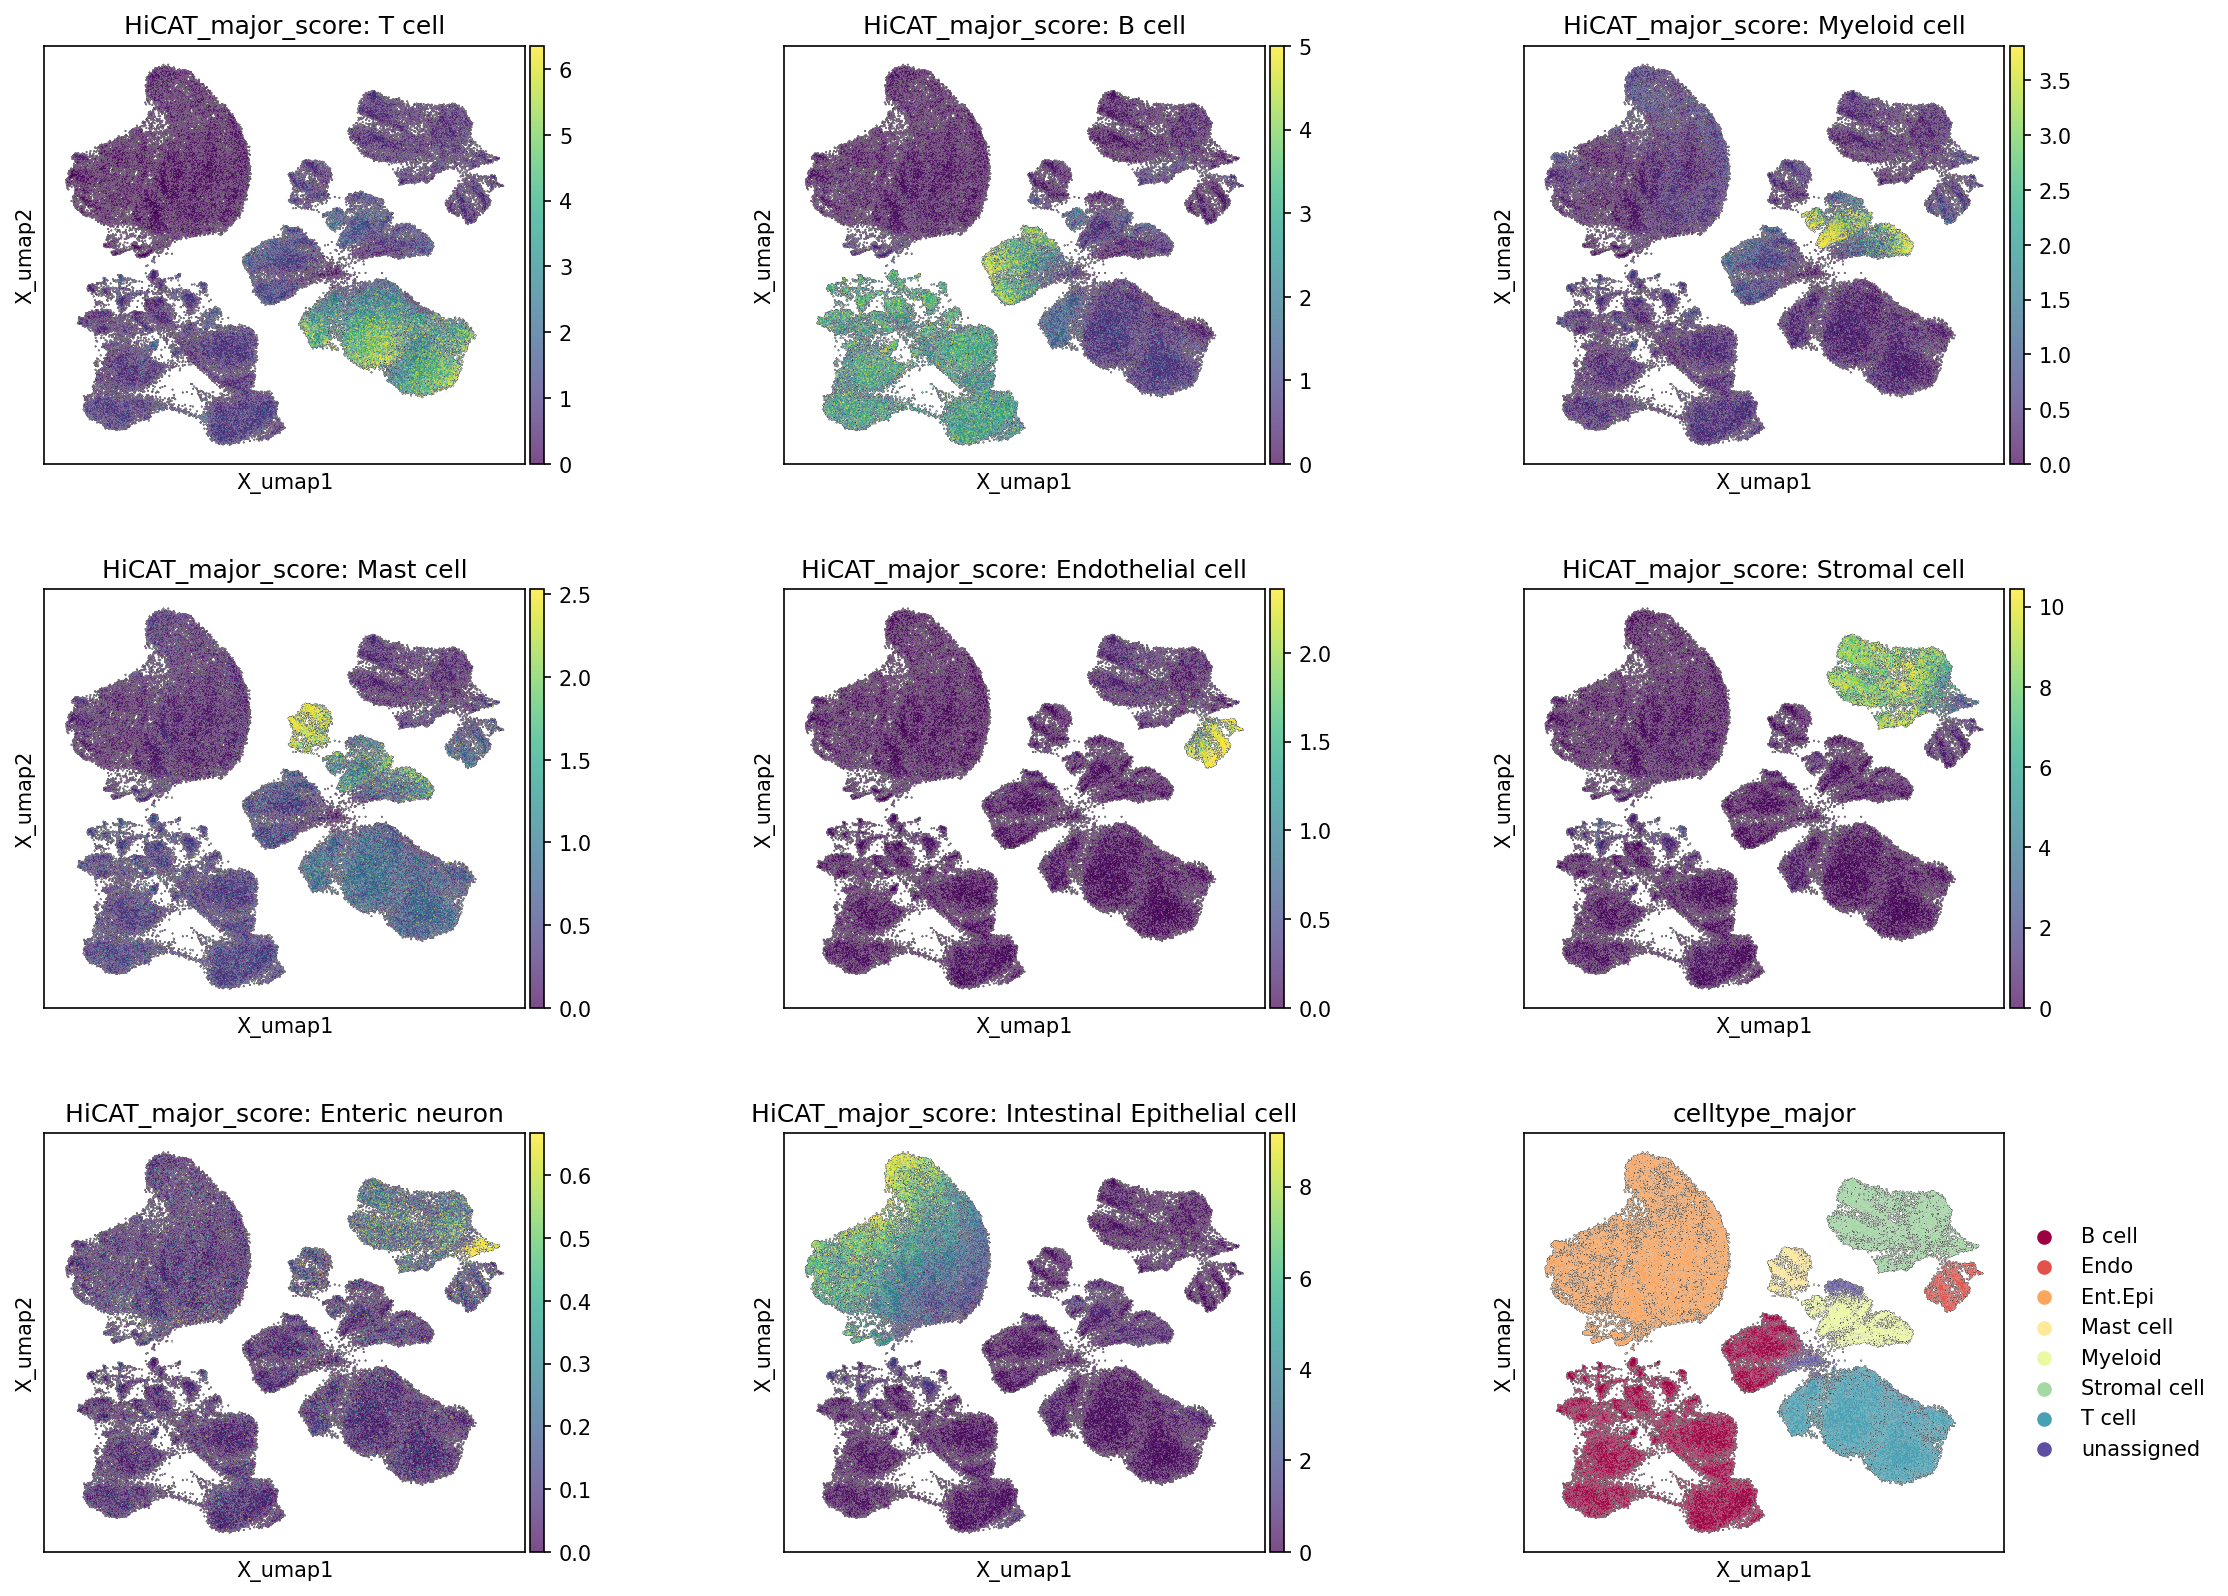
This analysis visualizes the distribution of major cell type scores across the Uniform Manifold Approximation and Projection (UMAP) embedding of single-cell RNA-seq data from human Colon tissue. Each plot shows the score for a specific major cell type, indicating the degree to which cells in that region express genes characteristic of that cell type. The final UMAP plot (bottom right) shows the celltype_major annotation, serving as a reference for the assigned cell identities. This visualization is crucial for assessing the quality of cell type annotation and the coherence of the UMAP embedding.
Visual Summary
The UMAP plots effectively illustrate distinct clusters corresponding to different major cell types.
- T cell scores are highest in clusters located in the bottom-right and upper-middle-right regions of the UMAP.
- B cell scores show strong enrichment in a distinct cluster in the bottom-left area.
- Myeloid cell scores are concentrated in a cluster in the middle-right of the UMAP.
- Mast cell scores highlight a smaller, well-defined cluster in the upper-middle-right region.
- Endothelial cell scores are high in a compact cluster positioned at the far right of the UMAP.
- Stromal cell scores are enriched in a cluster in the top-right quadrant.
- Intestinal Epithelial cell scores are prominently high in the large cluster occupying the top-left area.
- Enteric neuron scores show a very localized, relatively low-intensity signal in a small cluster towards the far right, near the Endothelial cell cluster. The maximum score for Enteric neuron (approx. 0.6) is considerably lower than those for other major cell types, suggesting either a less abundant population, a weaker gene signature, or that these cells may not form a distinct major cell type cluster in this dataset as prominently as others.
- The celltype_major UMAP (bottom right) provides the final annotation, showing distinct, spatially separated clusters for B cells (red), Endothelial cells (orange), Intestinal Epithelial cells (light yellow), Mast cells (pale yellow), Myeloid cells (light green), Stromal cells (teal), T cells (purple), and 'unassigned' cells (dark blue).
Biological Interpretation
The visual concordance between the high-score regions for individual major cell types and their corresponding annotated clusters in the celltype_major UMAP is a strong indicator of robust cell type identification and annotation.
- Each major cell type exhibits a clear, spatially restricted signal on the UMAP, confirming that cells with similar transcriptional profiles (and thus high scores for a given cell type) cluster together. This validates the quality of the dimension reduction and clustering algorithms employed.
- The distinct separation of major immune cell types (T cell, B cell, Myeloid cell, Mast cell), stromal cells, and intestinal epithelial cells reflects the known cellular heterogeneity of the human Colon tissue.
- The presence of 'unassigned' cells indicates populations that either lack a strong, specific major cell type signature, are transcriptionally intermediate, or represent rare cell types not fully captured by the major categories. These unassigned cells often occupy regions between clearly defined clusters or sparse areas.
- The observed score for 'Enteric neuron' highlights the potential presence of neuronal or neuroendocrine-like cells within the colon, even if they don't constitute a major cell type in the provided celltype_major list, or are less numerous. Their low overall score and localized distribution might suggest specific niche populations, which could warrant further investigation at a celltype_minor or celltype_subset level. Enteric neurons play critical roles in regulating gut motility, secretion, and local immune responses PubMed Search: enteric nervous system gut immunity.
Annotation Notes
The strong agreement between the cell type scores and the celltype_major annotations across the UMAP provides high confidence in the quality of the cell identity assignments. The embedding structure clearly delineates distinct cellular populations, with minimal overlap of high scores for different cell types, suggesting well-separated and accurately identified clusters. This foundational step is critical for subsequent downstream analyses, ensuring that differential expression, pathway analysis, and cell-cell interaction studies are performed on correctly identified cell populations. Further investigation into the 'unassigned' cells could reveal additional rare or intermediate cell states, or refine existing annotations.
3. Celltype Subset Marker Expression Validation
[Analysis Visualization Results]...
Analysis Overview
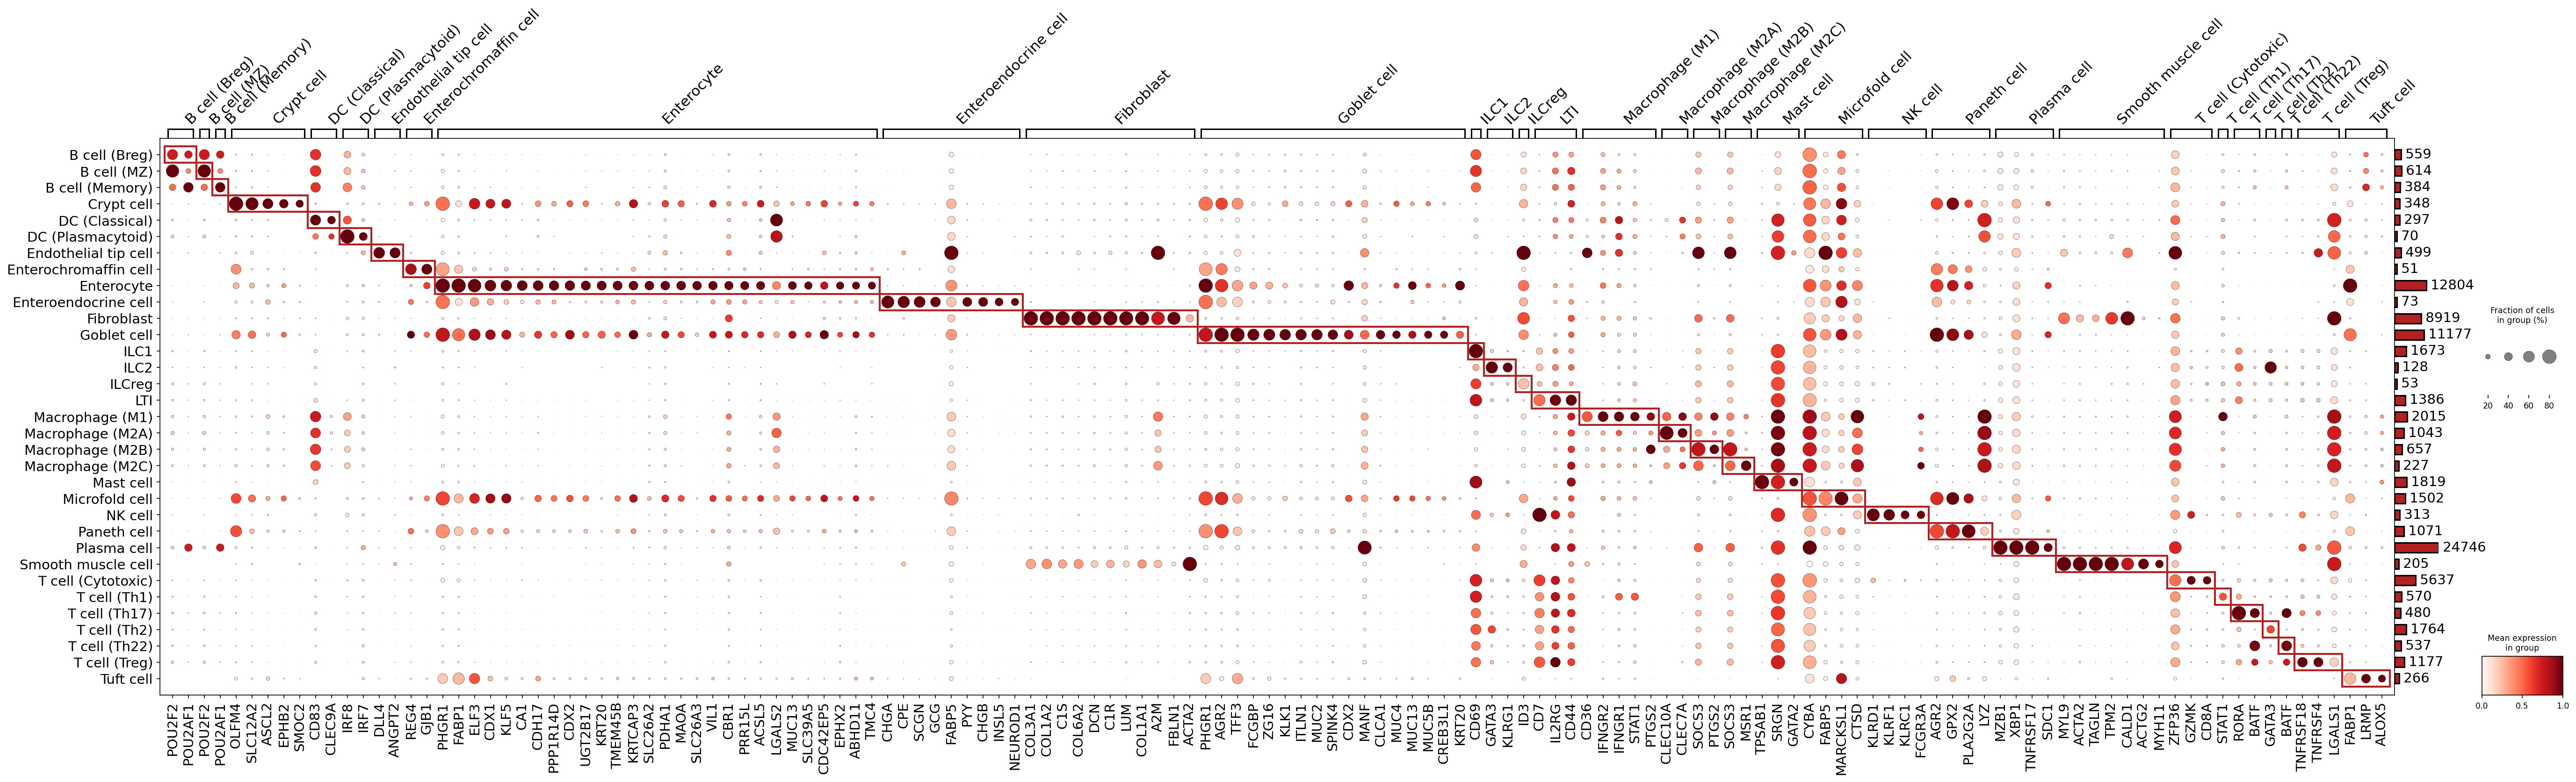
This analysis presents a dot plot illustrating the expression patterns of identified marker genes across various celltype_subset populations derived from single-cell RNA-seq data of the human colon. The objective is to visualize the specificity and prevalence of these markers to validate the assigned cell type annotations. The markers displayed were specifically selected as "surfaceome only" to highlight cell surface proteins and secreted molecules, which are often excellent indicators of cell identity and function.
Visual Summary
The dot plot effectively visualizes the distinct expression profiles of marker genes for each celltype_subset.
- Specificity and Expression Level: The color intensity of each dot (ranging from light red to deep red) represents the mean expression level of a gene within a given cell group, while the size of the dot indicates the fraction of cells within that group expressing the gene. High color intensity and large dot size generally correspond to highly specific and prevalent markers for a particular cell type.
- Distinct Clusters: Many cell type subsets exhibit clear blocks of highly expressed and prevalent markers, highlighted by red boxes, demonstrating robust and unique gene expression signatures for these populations.
- Pan-Cell Type Markers vs. Specific Markers: While most highlighted markers show high specificity, some genes appear to be expressed at lower levels or in a smaller fraction of cells across multiple cell types, indicating potential common cellular processes or shared lineage markers, or less stringent specificity.
- Cell Type Abundance: The bar chart on the right provides the total number of cells and the fraction of cells in each group, offering context on the representation of each celltype_subset in the dataset.
Biological Interpretation
The observed marker gene expression patterns strongly support the given celltype_subset annotations, affirming the biological distinctiveness and accurate identification of these populations within the colon tissue. Key observations include:
Immune Cell Lineages:
- B cells: Subsets like B cell (Breg), B cell (MZ), and B cell (Memory) show expression of key B cell transcription factors like POU2F2 (OCT2) and POU2AF1 (OBF1), which are crucial for B cell development and function.
- T cells: Distinct T helper cell subsets are identified by their characteristic transcriptional regulators or effector molecules. For instance, T cell (Cytotoxic) expresses GZMK and CD8A GeneCards: GZMK, T cell (Th2) expresses GATA3 GeneCards: GATA3, and T cell (Th17) expresses RORA and BATF GeneCards: RORA, GeneCards: BATF. T cell (Treg) shows TNFRSF18 (GITR) and TNFRSF4 (OX40).
- Myeloid cells: Macrophage subsets (M1, M2A, M2B, M2C) and Dendritic cell subsets (DC Classical, DC Plasmacytoid) display unique markers. For example, DC (Classical) shows CLEC9A GeneCards: CLEC9A, while DC (Plasmacytoid) expresses IRF7 and IRF8 GeneCards: IRF7. M1 macrophages exhibit SOCS3 and SPP1 GeneCards: SPP1.
- Plasma cells: Distinctly express MZB1, XBP1, TNFRSF17 (BCMA), and SDC1 (CD138) GeneCards: SDC1, confirming their terminally differentiated state.
- Mast cells and NK cells: Mast cells are characterized by TPSAB1 and KIT GeneCards: KIT, while NK cells show expression of KLRD1 (CD94), KLRF1, and KLRG1 GeneCards: KLRD1.
Epithelial Cell Lineages:
- Enterocytes: Exhibit high expression of CDH17 and VIL1 GeneCards: VIL1, typical of absorptive epithelial cells.
- Goblet cells: Show MUC2 and TFF3 GeneCards: MUC2, consistent with their mucin-secreting function.
- Paneth cells: Are marked by LYZ and REG4 GeneCards: LYZ, reflecting their role in host defense.
- Enteroendocrine and Enterochromaffin cells: Express hormone-related genes such as CHGA, CHGB, PYY, and INSL5 GeneCards: CHGA, consistent with their neuroendocrine functions.
- Tuft cells: Characterized by DCLK1 and ALOX5 GeneCards: DCLK1, indicating their chemosensory role.
- Crypt cells: Marked by KRT20 and FABP1 GeneCards: KRT20, reflecting their proliferative and regenerative capacity.
Stromal and Endothelial Cells:
- Fibroblasts: Express characteristic extracellular matrix components like COL1A1, COL1A2, and DCN GeneCards: COL1A1.
- Endothelial cells: (including Endothelial tip cell and Lymphatic Endothelial cell) show genes like ANGPT2, DLL4, and PROX1 (for lymphatic endothelium) GeneCards: ANGPT2, consistent with vascular and lymphatic identities.
- Smooth muscle cells: Marked by ACTA2 and MYL9 GeneCards: ACTA2, confirming their contractile properties.
Annotation Notes
This marker gene expression analysis provides strong evidence validating the celltype_subset annotations in the AnnData object. The clear and specific expression patterns of known surfaceome markers for each cell type subset underscore the high quality and biological fidelity of the cell type assignments. This robust annotation is crucial for ensuring the reliability of subsequent in-depth analyses, such as differential gene expression, pathway analysis, and cell-cell interaction studies, allowing for confident biological interpretation in the context of colon health and disease.
4. Minor Cell Type Population Analysis in Colon Samples
[Analysis Visualization Results]...
Analysis Overview
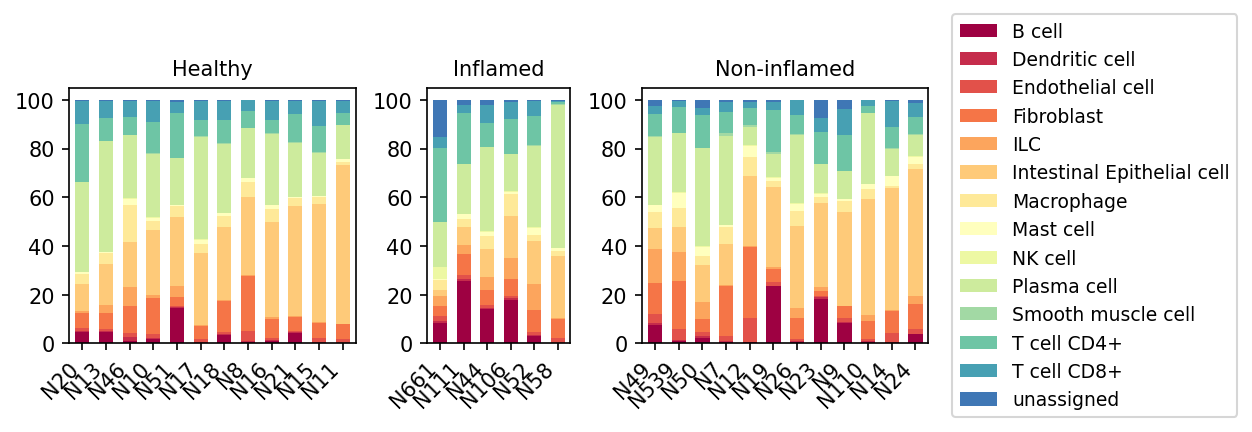
This analysis presents the relative proportions of minor cell types across individual samples from human colon tissue, categorized by three conditions: Healthy, Inflamed, and Non-inflamed. The visualization uses stacked bar plots, with each bar representing a single sample and segments indicating the percentage contribution of each minor cell type. This provides a high-level overview of cellular composition changes in the colon under different physiological and pathological states.
Visual Summary
The stacked bar plots display the proportional distribution of 15 distinct minor cell types within each sample. Samples are grouped by condition: Healthy, Inflamed, and Non-inflamed.
- Overall Composition: Across all conditions, major components consistently include Intestinal Epithelial cells (light orange), T cell CD4+ (teal), and T cell CD8+ (darker teal). Macrophages (yellow) are also a substantial population.
- Healthy Condition: In healthy colon samples, Intestinal Epithelial cells, T cells (CD4+ and CD8+), and Macrophages collectively constitute a significant portion of the cellular landscape. Plasma cells (light green), B cells (maroon), and Fibroblasts (orange) are present but generally at lower proportions compared to the Inflamed condition.
Inflamed Condition:
- A prominent increase in Plasma cells (light green) and B cells (maroon) is consistently observed across most Inflamed samples (e.g., N661, N111, N44, N106, N52, N58). This suggests a robust humoral immune response.
- The proportion of Fibroblasts (orange) also appears to be generally elevated in Inflamed samples compared to Healthy ones, potentially indicating tissue remodeling or fibrotic processes.
- Macrophages (yellow) show variable, but often increased, proportions in inflamed samples.
- While T cell proportions remain high, their relative distribution might shift, or their absolute numbers could be increased, leading to a proportional decrease in non-immune cells like Intestinal Epithelial cells in some samples.
- The "unassigned" category (dark blue) is more noticeable in some Inflamed samples compared to Healthy samples.
- Non-inflamed Condition: The cell type composition in Non-inflamed samples generally appears more heterogeneous and in some cases, intermediate between Healthy and Inflamed.
- Some Non-inflamed samples (e.g., N7, N12) show relatively similar profiles to Healthy samples.
- However, other Non-inflamed samples (e.g., N49, N539, N50) display features reminiscent of the Inflamed group, such as higher proportions of Macrophages and sometimes Plasma cells, or even a noticeable "unassigned" fraction. This could reflect a spectrum of disease activity or the presence of other non-inflammatory pathological processes.
- Sample-to-Sample Variability: Significant heterogeneity is evident within each condition, particularly in the Inflamed and Non-inflamed groups, highlighting individual patient differences in cellular responses.
- "unassigned" cell type: This population is generally minor or absent in Healthy samples but becomes more apparent in some Inflamed and Non-inflamed samples.
Biological Interpretation
The observed shifts in minor cell type populations provide crucial insights into the immune and stromal changes occurring in the human colon during inflammation.
- Immune Cell Infiltration and Activation: The marked increase in Plasma cells and B cells in Inflamed colon samples is a hallmark of chronic inflammation, often seen in conditions like Inflammatory Bowel Disease (IBD). Plasma cells are terminally differentiated B cells responsible for antibody production, indicating an active humoral immune response. Increased B cells could point to germinal center formation or expansion of B cell subsets in the inflamed tissue PubMed search: B cell intestinal inflammation.
- Myeloid Cell Dynamics: The variable, but often increased, Macrophage proportions in Inflamed samples suggest their role in mediating and perpetuating inflammation. Macrophages are versatile immune cells that can adopt pro-inflammatory (M1-like) or regulatory/repair (M2-like) phenotypes, and their increase often correlates with disease activity GeneCards: Macrophage.
- Stromal Remodeling: The expanded Fibroblast population in Inflamed samples indicates active tissue remodeling, fibrosis, and extracellular matrix deposition, which are common pathological features in chronic intestinal inflammation PubMed search: Fibroblast intestinal fibrosis.
- Epithelial-Immune Balance: While not always a clear decrease, the relative proportion of Intestinal Epithelial cells can appear reduced in inflamed tissues, possibly due to increased immune cell infiltrate or epithelial damage/loss common in inflammatory conditions.
- Non-inflamed Heterogeneity: The variability in the "Non-inflamed" group is noteworthy. It suggests that these samples, while not overtly "inflamed," may harbor subclinical inflammation, tissue repair processes, or other underlying conditions that lead to altered cellular compositions compared to truly "Healthy" tissue. The presence of "unassigned" cells in these conditions could point to novel or disease-associated cell states that are not yet well-characterized.
Clinical or Translational Implications
These findings have several potential clinical and translational implications:
- Biomarker Identification: The increase in Plasma cells, B cells, and Fibroblasts could serve as cellular biomarkers for distinguishing active inflammation from healthy or quiescent disease states. Monitoring their proportions via single-cell analysis could complement traditional histological assessments.
- Therapeutic Targets: The expansion of specific immune cell populations (e.g., B cells, Plasma cells, Macrophages) highlights their potential as therapeutic targets for inflammatory bowel diseases. Interventions aimed at modulating the activity or survival of these cells could reduce inflammation and promote healing. Similarly, targeting fibroblast activation could be relevant for preventing fibrosis.
- Disease Heterogeneity: The inter-sample variability within conditions underscores the heterogeneous nature of inflammatory diseases, even within a defined clinical group. This emphasizes the need for personalized approaches to diagnosis and treatment, where cell composition profiles could help stratify patients.
- Defining "Non-inflamed": The distinction between "Non-inflamed" and "Healthy" is critical. The observation that some "Non-inflamed" samples show immune cell increases suggests that seemingly quiescent areas or patients might still harbor underlying immunological activity, which could impact prognosis or guide preventative strategies. Further investigation into these "Non-inflamed" samples, especially those with increased immune cells, is warranted.
- Annotation Improvement: The "unassigned" category, particularly in disease states, indicates areas where current cell type annotation might be insufficient. Further efforts to characterize these populations could uncover novel cell types or disease-specific cell states relevant to pathology.
5. T cell and Innate Lymphoid Cell Subset Distribution Across Colon Conditions
[Analysis Visualization Results]...
Analysis Overview
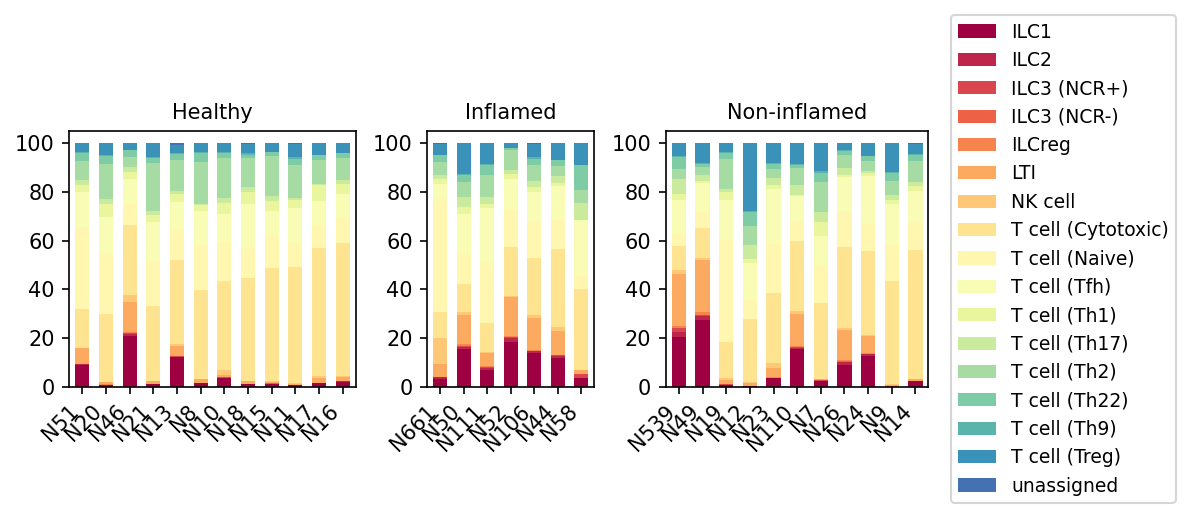
This analysis provides a detailed look at the relative proportions of T cell and related innate lymphoid cell (ILC) subsets within the human colon across different conditions: Healthy, Inflamed, and Non-inflamed. Derived from single-cell RNA sequencing data, this stacked bar plot illustrates the compositional shifts of immune cell subsets categorized under the 'T cell' major population in individual samples, offering insights into the immune landscape dynamics during colon inflammation.
Visual Summary
The plot displays the percentage composition of various immune cell subsets—including distinct T cell subtypes, innate lymphoid cells (ILCs), and NK cells—within the 'T cell' major population for each sample, grouped by condition.
- Overall Composition: T cell (Cytotoxic) and T cell (Naive) populations generally represent a large portion of the T cell compartment across all conditions. T cell (Treg) also maintains a consistent presence. ILCs and NK cells are present in varying, generally lower, proportions.
- Healthy Condition: Samples from healthy colon typically show a more balanced distribution of T cell subsets. While ILC1 (dark red), ILC2 (darker red), and ILC3 (NCR+) (red) are present, their proportions tend to be lower compared to some inflamed samples. T cell (Naive) (pale yellow) and T cell (Cytotoxic) (light yellow) are often the most abundant T cell populations.
- Inflamed Condition: A clear shift in immune cell composition is observed in inflamed colon samples. Many inflamed samples (e.g., N661, N50, N111, N106) show a notable increase in the relative proportions of ILC1 (dark red) and ILC3 (NCR+) (red). There also appears to be a higher contribution from pro-inflammatory T helper subsets such as T cell (Th1) (light green) and T cell (Th17) (medium green) in several inflamed individuals.
- Non-inflamed Condition: This group exhibits considerable heterogeneity. Some non-inflamed samples (e.g., N539, N49, N19, N12) display an immune profile that resembles the inflamed group, characterized by elevated ILC1, ILC3 (NCR+), Th1, and Th17 cells. In contrast, other non-inflamed samples (e.g., N110, N7, N26) show a composition closer to that of healthy individuals, with lower proportions of these pro-inflammatory innate and adaptive subsets.
- Inter-sample Variability: Significant variability in cell subset proportions is apparent among individual samples within each condition, particularly within the "Inflamed" and "Non-inflamed" groups, highlighting the patient-specific nature of immune responses and disease heterogeneity.
Biological Interpretation
The observed changes in T cell and ILC subset populations offer crucial biological insights into the immune responses within the colon, particularly in the context of inflammation.
- Pro-inflammatory Signature in Inflamed Colon: The enrichment of ILC1s, ILC3s (NCR+), T cell (Th1), and T cell (Th17) populations in inflamed colon samples strongly aligns with their established roles in chronic gut inflammation, such as Inflammatory Bowel Disease (IBD).
- ILC1s and Th1 cells are known producers of IFN-gamma, mediating Type 1 immune responses that contribute to tissue damage and chronic inflammation.
- ILC3s (NCR+) and Th17 cells are critical for mucosal immunity but also significant drivers of inflammatory pathology in the gut through their production of IL-17 and IL-22 [PubMed search: "Colon inflammation ILC1 ILC3 Th1 Th17"]. The presence of NCR+ ILC3s specifically indicates an activated, pro-inflammatory subset.
- Role of Regulatory Populations: While T cell (Treg) populations are consistently present, their relative abundance might be diminished in inflamed states due to the expansion of effector populations. A healthy balance between these pro-inflammatory and regulatory (e.g., Tregs) cell types is essential for maintaining immune homeostasis in the gut [GeneCards: FOXP3].
- Heterogeneity of "Non-inflamed" Tissue: The diverse immune profiles within the "Non-inflamed" group are particularly revealing. This suggests that even macroscopically normal-appearing regions in individuals with inflammatory conditions may harbor subclinical immune activation or represent areas of ongoing immune perturbation. This heterogeneity could reflect varying degrees of disease activity, proximity to active inflammation, or distinct phases of remission.
- Annotation Note: It is important to acknowledge that, within this specific AnnData object's annotation scheme, ILCs and NK cells are categorized under the broader 'T cell' major population. While biologically distinct from conventional T cells, their inclusion here underscores their critical and interconnected roles within the overall lymphoid immune responses of the colon [UniProt: ILCs].
Clinical or Translational Implications
These findings have several potential implications for understanding and managing colon inflammatory conditions:
- Biomarker Potential: The specific shifts in the relative proportions of ILC1s, ILC3s (NCR+), Th1, and Th17 cells could serve as valuable cellular biomarkers for monitoring disease activity, assessing therapeutic response, or even predicting disease flares in colon inflammatory conditions.
- Targeted Therapies: The observed enrichment of specific pro-inflammatory subsets in inflamed tissue points towards potential therapeutic targets. Strategies focused on modulating the activity or abundance of these key immune cells (e.g., ILC1s, ILC3s, Th1, or Th17 cells) or enhancing regulatory cell functions could lead to novel, more precise treatments for chronic colon inflammation [PubMed search: "Targeting ILCs and T cells in IBD"].
- Enhanced Disease Understanding: The heterogeneity within "Non-inflamed" samples emphasizes that histological assessment alone may not fully capture the immunological state of the tissue. Single-cell analysis offers a more granular perspective, potentially revealing subtle immune dysregulations that could impact prognosis or treatment decisions.
- Precision Medicine Approaches: Understanding the precise immune cell composition in an individual patient's colon could facilitate the development of personalized treatment strategies, tailoring therapies to target the specific inflammatory pathways and cell types active in their disease.
6. T Cell and ILC Subset Population Shifts in Colon Across Inflamed and Non-Inflamed Conditions
[Analysis Visualization Results]...
Analysis Overview
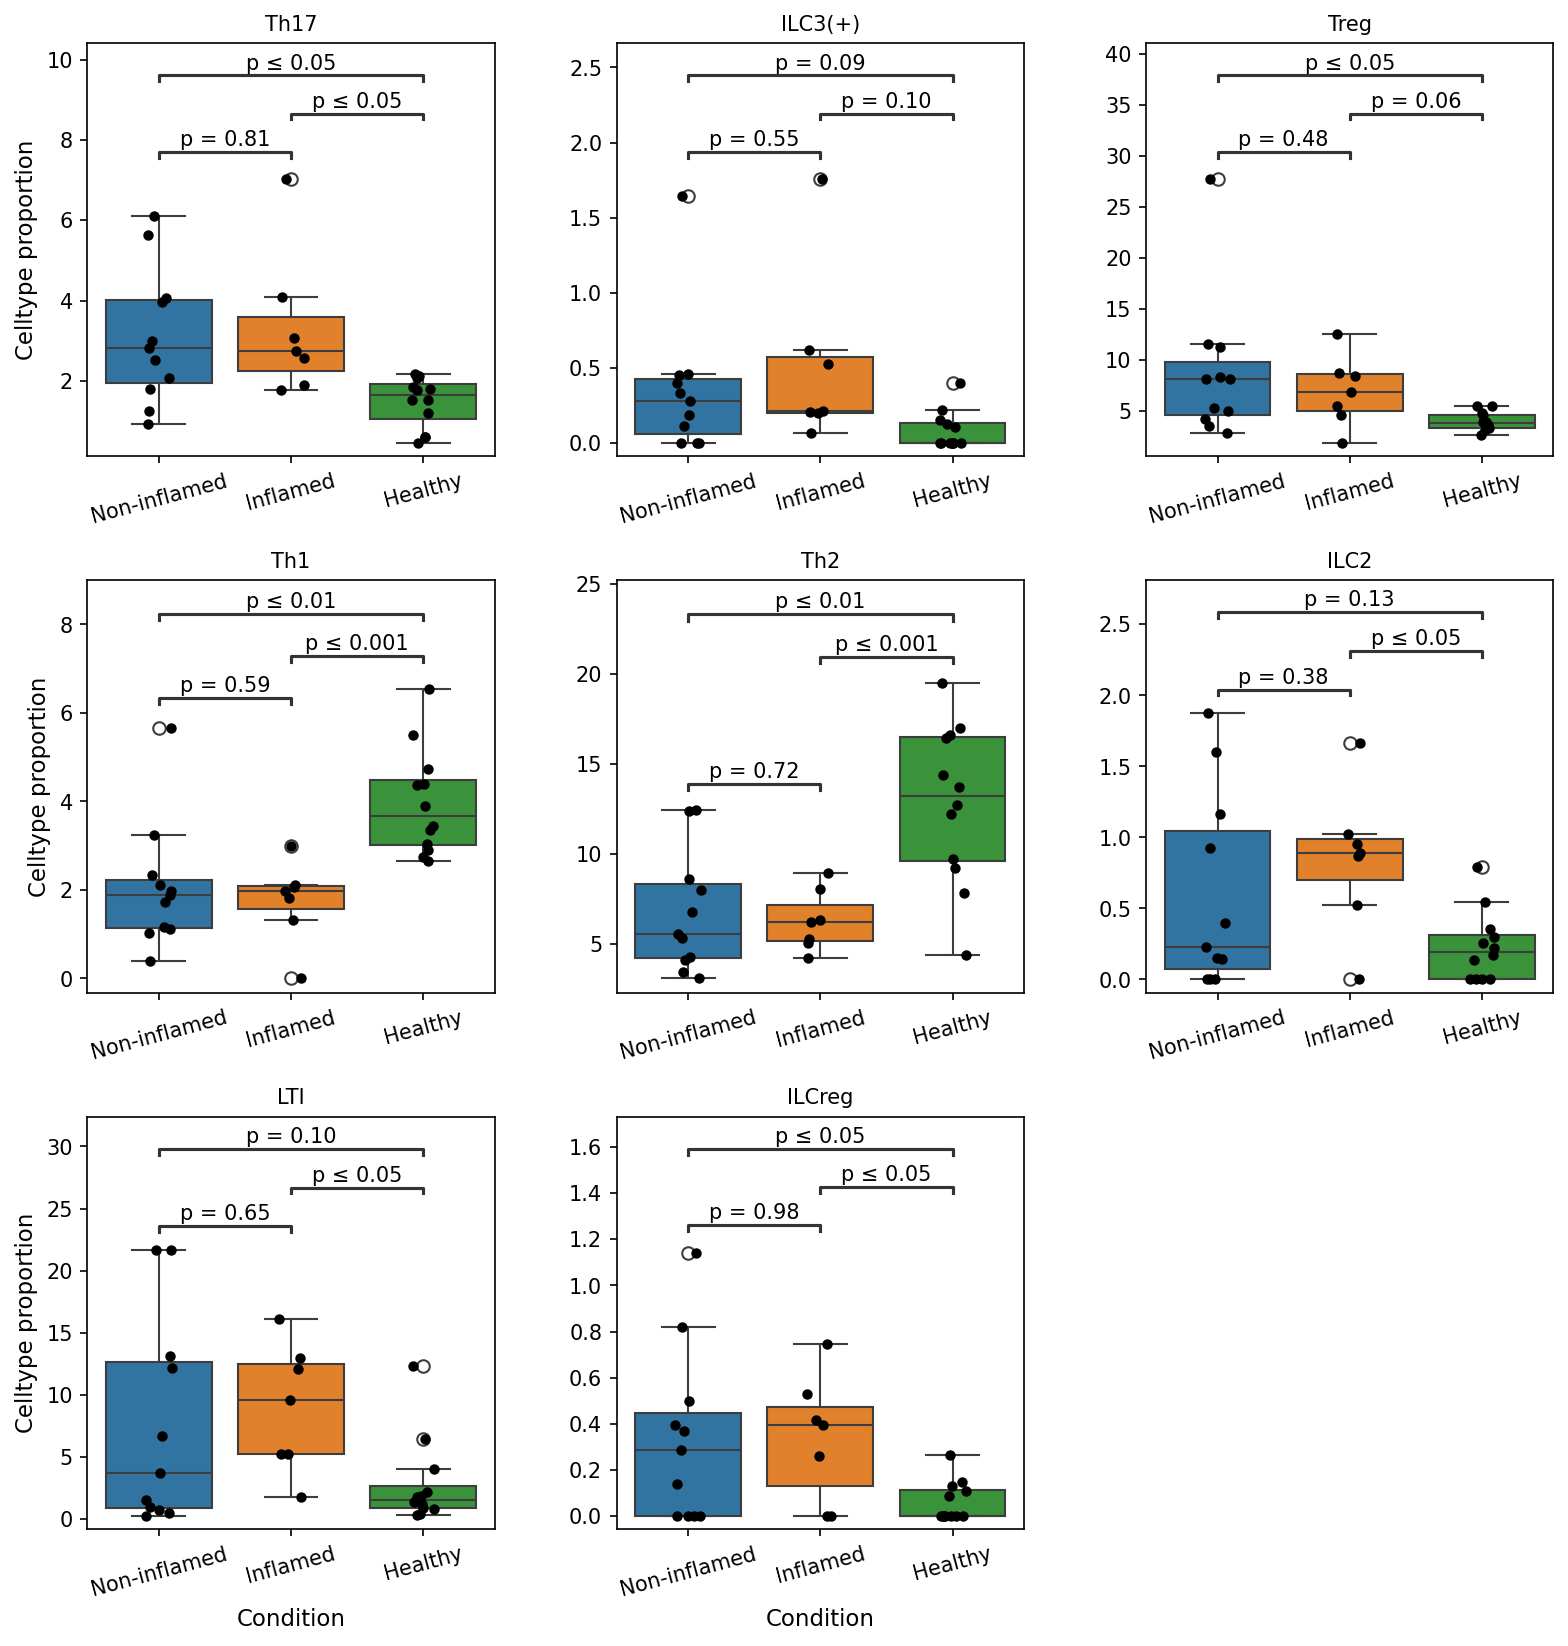
This analysis investigates the proportions of various T cell and innate lymphoid cell (ILC) subsets within the colon tissue across three conditions: "Non-inflamed" (diseased but not macroscopically inflamed), "Inflamed" (diseased and macroscopically inflamed), and "Healthy" (reference group). The goal is to identify statistically significant differences in these cell populations that may contribute to or reflect disease pathogenesis in the colon. Box plots visualize the celltype proportions, with individual data points overlaid, and statistical significance (p-values) indicated for pairwise comparisons, particularly against the "Healthy" reference condition.
Visual Summary
The box plots illustrate the distribution of celltype proportions for eight distinct T cell and ILC subsets: Th17, ILC3(+), Treg, Th1, Th2, ILC2, LTI, and ILCreg.
- Elevated Populations in Diseased Conditions (Non-inflamed & Inflamed vs. Healthy):
- Th17 cells show significantly higher proportions in both Non-inflamed (p ≤ 0.05) and Inflamed (p ≤ 0.05) colon compared to Healthy.
- Treg cells are significantly elevated in Non-inflamed (p ≤ 0.05) and marginally in Inflamed (p = 0.06) conditions relative to Healthy.
- ILC3(+) cells show marginally higher proportions in Non-inflamed (p = 0.09) and Inflamed (p = 0.10) conditions compared to Healthy.
- LTI (Lymphoid Tissue inducer) cells are significantly increased in Inflamed colon (p ≤ 0.05) and marginally in Non-inflamed (p = 0.10) compared to Healthy.
- ILCreg cells demonstrate significantly higher proportions in both Non-inflamed (p ≤ 0.05) and Inflamed (p ≤ 0.05) conditions versus Healthy.
- Reduced Populations in Diseased Conditions (Non-inflamed & Inflamed vs. Healthy):
- Th1 cells exhibit significantly lower proportions in both Non-inflamed (p ≤ 0.01) and Inflamed (p ≤ 0.001) colon compared to Healthy.
- Th2 cells also show significantly lower proportions in Non-inflamed (p ≤ 0.01) and Inflamed (p ≤ 0.001) conditions relative to Healthy.
- ILC2 cells are significantly decreased in Inflamed colon (p ≤ 0.05) compared to Healthy, with a similar trend observed in Non-inflamed (p = 0.13) though not reaching statistical significance at the 0.1 cutoff.
Comparison Between Non-inflamed and Inflamed Conditions:
- Notably, for all depicted T cell and ILC subsets, there were no statistically significant differences observed between the "Non-inflamed" and "Inflamed" conditions (all p-values for Non-inflamed vs. Inflamed comparisons were greater than the 0.1 cutoff, generally much higher, e.g., p=0.81 for Th17, p=0.48 for Treg).
Biological Interpretation
The observed shifts in T cell and ILC subset proportions highlight significant immune dysregulation in diseased colon tissue, irrespective of its macroscopic inflammatory status (Non-inflamed vs. Inflamed).
- Increased Pro-inflammatory and Regulatory Populations:
- Th17 cells are crucial mediators of inflammatory responses, particularly in the gut. Their increased proportion in both diseased conditions suggests an active pro-inflammatory environment in the colon PubMed Search: Th17 cells IBD colon.
- The concomitant increase in Treg cells often represents a compensatory mechanism to control escalating inflammation and maintain immune homeostasis GeneCards: FOXP3 (marker for Treg cells). However, in chronic inflammation, Treg function can be impaired, or their presence might be insufficient to suppress pathogenic responses.
- ILC3(+) cells are important for gut barrier integrity and immunity, often producing IL-17 and IL-22, which can contribute to both protective and pathogenic inflammation depending on context PubMed Search: ILC3 gut immunity. Their increase supports a shift in the innate immune landscape.
- LTI cells are involved in the development and maintenance of lymphoid tissues. Their elevation in diseased colon may indicate enhanced tissue remodeling or the formation of tertiary lymphoid structures, which are often observed in chronic inflammatory conditions.
- The increase in ILCreg cells, a less-characterized regulatory ILC population, further hints at complex regulatory adaptations within the inflamed microenvironment.
- Decreased Type 1 and Type 2 Helper T Cell and ILC Populations:
- The significant decrease in Th1 cells (producers of IFN-gamma) and Th2 cells (producers of IL-4, IL-5, IL-13) in diseased tissues is notable. This shift away from classical Th1/Th2 responses, coupled with increased Th17, suggests a dominant role for Th17-mediated inflammation or perhaps suppression of other T helper lineages in the context of colon disease. This imbalance is characteristic of several chronic inflammatory diseases, including inflammatory bowel disease PubMed Search: Th1 Th2 Th17 balance IBD.
- The reduction in ILC2 cells, which typically mediate type 2 immunity, suggests a dampening of these responses or a shift in the immune microenvironment that favors other ILC subsets.
- Similar Immunological Profiles in Non-inflamed and Inflamed Disease:
- The lack of significant differences between "Non-inflamed" and "Inflamed" disease tissues for these specific T cell and ILC subsets is a critical finding. It indicates that "Non-inflamed" areas within a diseased colon still possess substantial immunological alterations compared to truly healthy tissue. This suggests that the immune environment in clinically "non-inflamed" regions of diseased individuals is not quiescent but rather harbors chronic immune dysregulation, reflecting a systemic or regional disease state even in the absence of macroscopic signs of inflammation.
Clinical or Translational Implications
These findings have important implications for understanding the pathophysiology and management of colon diseases:
- Subclinical Inflammation: The observation that "Non-inflamed" diseased tissue shares similar immunological shifts with "Inflamed" tissue emphasizes the concept of subclinical inflammation. Macroscopically "normal" regions in diseased patients are not truly healthy at the cellular level. This could explain disease persistence or recurrence and suggests that treatment strategies might need to target these "non-inflamed" areas as well.
- Biomarker Potential: The specific shifts in Th17, Treg, Th1, Th2, ILC3(+), ILC2, LTI, and ILCreg cell proportions could serve as potential biomarkers for disease activity or progression, even in the absence of overt inflammation. Longitudinal studies could further investigate their predictive value.
- Therapeutic Targets: The consistent elevation of Th17 cells across diseased conditions points towards the IL-17 pathway as a potential therapeutic target for reducing inflammation in colon disease. Similarly, strategies aimed at restoring the balance of Th1/Th2/Th17 cells or modulating Treg/ILC functions could be explored.
- Disease Heterogeneity: The data suggest a common immune signature related to the disease state itself, rather than strictly distinguishing between active and less active (macroscopically) inflammation based on these particular cell proportions. Further investigations into other immune cell populations or molecular profiles might reveal nuances that differentiate "Non-inflamed" from "Inflamed" diseased tissues.
7. Colon Macrophage Subset Population Shifts Across Inflammatory States
[Analysis Visualization Results]...
Analysis Overview
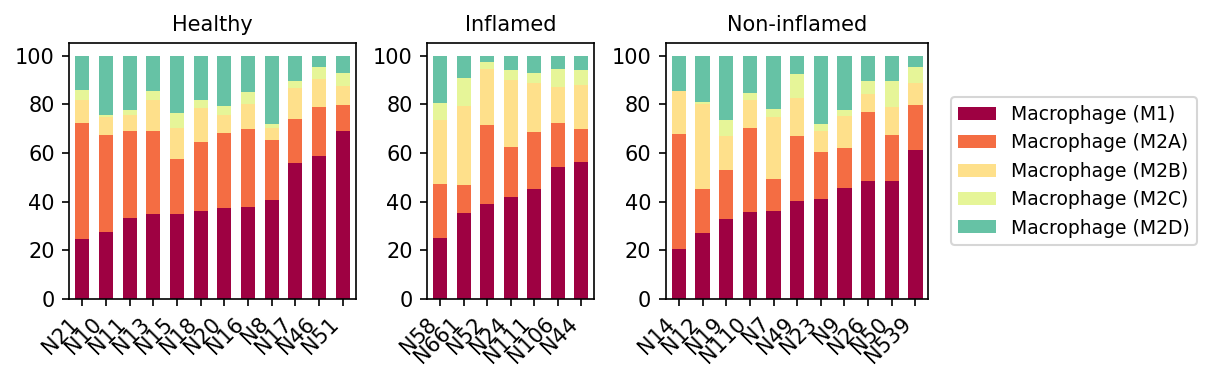
This analysis investigates the proportional distribution of various macrophage subsets (M1, M2A, M2B, M2C, M2D) within the colon tissue across different conditions: Healthy, Inflamed, and Non-inflamed. The stacked bar plots display the relative abundance of these macrophage subsets for individual samples within each condition, providing insight into the overall macrophage polarization state.
Visual Summary
The visualization reveals distinct patterns in macrophage subset composition across the three conditions:
Macrophage (M1) Dominance in Inflamed and Non-inflamed Conditions:
- In both "Inflamed" and "Non-inflamed" samples, Macrophage (M1) (maroon) constitutes a significantly larger proportion of the total macrophage population compared to "Healthy" samples.
- Specifically, in "Inflamed" samples, M1 macrophages frequently account for over 40-50% of the macrophage population, and in some samples, even higher.
- "Non-inflamed" samples also show elevated M1 proportions, often in the 30-50% range, which is higher than "Healthy" but perhaps slightly less pronounced than in "Inflamed" samples.
Reduced Relative Abundance of M2 Subsets in Inflamed/Non-inflamed Conditions:
- Conversely, the relative proportions of various M2 subsets (M2A, M2B, M2C, M2D) appear generally lower in "Inflamed" and "Non-inflamed" samples when compared to "Healthy" samples.
- "Healthy" colon samples tend to exhibit a more balanced or even M2-predominant profile, with M2A (orange) often forming a substantial part alongside M1, and notable contributions from M2D (mint green).
- Inter-sample Variability: There is some heterogeneity in macrophage subset proportions across individual samples within each condition, although the overall trends remain consistent.
Biological Interpretation
Macrophages are highly plastic immune cells that play critical roles in both initiating and resolving inflammation. They are commonly categorized into distinct functional phenotypes, most notably M1 (pro-inflammatory) and M2 (anti-inflammatory, tissue repair, immunomodulatory).
- Shift towards Pro-inflammatory M1 Phenotype: The prominent increase in Macrophage (M1) populations in "Inflamed" colon tissue is a hallmark of active inflammation. M1 macrophages are typically activated by microbial products (e.g., LPS) and Th1 cytokines (e.g., IFN-γ, TNF-α), producing pro-inflammatory cytokines such as TNF-α, IL-1β, IL-6, and IL-12, and contributing to pathogen clearance and tissue damage PubMed Search: M1 macrophage inflammation colon.
- Role of "Non-inflamed" Tissue: The observation that "Non-inflamed" tissue also exhibits an elevated M1 macrophage population compared to "Healthy" tissue is insightful. In the context of inflammatory bowel disease (IBD), "Non-inflamed" sections might refer to macroscopically normal tissue from patients with active disease elsewhere or tissue from patients in remission. This finding suggests that even "non-inflamed" areas in affected individuals might harbor a subtle, subclinical pro-inflammatory predisposition at the cellular level, contributing to disease chronicity or recurrence.
- M2 Macrophages and Tissue Homeostasis: In "Healthy" colon, a more significant proportion of M2 macrophages (M2A, M2B, M2C, M2D) is observed. M2 macrophages are diverse, involved in wound healing (M2A), immune regulation (M2B), and efferocytosis/immunosuppression (M2C) GeneCards: CD163 (M2 marker). M2D (also known as M2-like or TAM-like) can promote angiogenesis and tumor progression PubMed Search: M2D macrophage phenotype. The higher relative abundance of these M2 subsets in healthy tissue suggests their crucial role in maintaining tissue homeostasis, resolving minor inflammation, and promoting tissue repair in the gut. The reduction in their relative proportion in inflammatory conditions indicates a disruption of this balance.
- Overall Imbalance in Inflammatory Conditions: The overall macrophage population shift from a more balanced or M2-predominant state in healthy colon to an M1-dominant state in inflamed and even non-inflamed conditions underscores the critical role of macrophage polarization in intestinal pathology, particularly inflammatory diseases like IBD.
Clinical or Translational Implications
The distinct macrophage polarization patterns observed have significant clinical and translational implications for colon inflammatory diseases:
- Biomarker Potential: The ratio of M1 to M2 macrophages, or the absolute proportion of M1 macrophages, could serve as a valuable biomarker for disease activity or inflammatory predisposition, even in macroscopically "non-inflamed" tissues. This could aid in earlier diagnosis or monitoring of disease progression/remission.
- Therapeutic Targets: Targeting macrophage polarization represents a promising therapeutic strategy. Modulating macrophage differentiation to reduce M1 prevalence or enhance M2 functions (e.g., M2A for tissue repair, M2B for immune regulation) could be beneficial in resolving chronic inflammation in the colon PubMed Search: macrophage polarization therapy IBD.
- Understanding Disease Heterogeneity: The inter-sample variability observed within conditions suggests that macrophage responses can differ between individuals, highlighting the need for personalized approaches to inflammatory bowel disease management.
- Investigating "Non-inflamed" Disease States: The heightened M1 presence in "Non-inflamed" tissue emphasizes the importance of studying these areas to understand mechanisms of disease relapse and sustained inflammation, even in the absence of overt clinical signs.
8. Macrophage Subset Population Shifts in Colon Inflammation
[Analysis Visualization Results]...
Analysis Overview
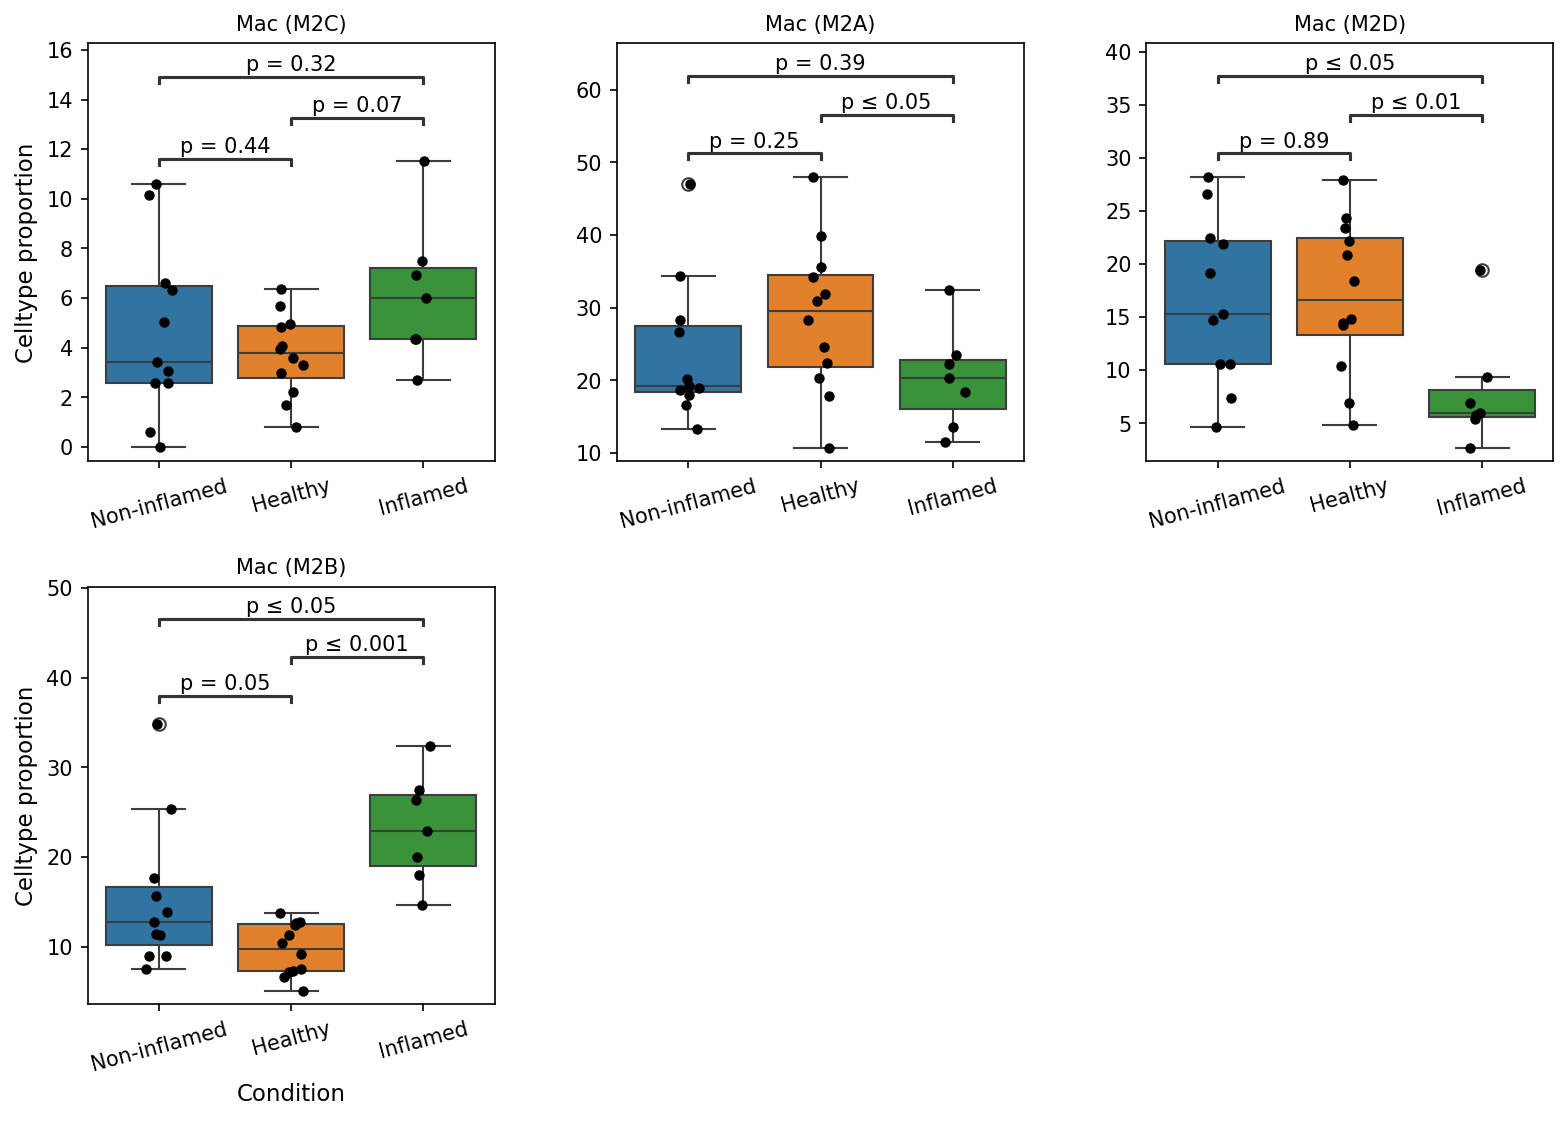
This analysis investigates the proportions of different macrophage subsets (M2C, M2A, M2D, M2B) across various conditions (Non-inflamed, Healthy, Inflamed) in human colon tissue, derived from single-cell RNA sequencing data. The goal is to identify statistically significant differences in these cell type proportions, which could indicate shifts in immune cell composition during inflammatory processes in the colon. Comparisons are made primarily against the 'Healthy' reference group, with a p-value cutoff of 0.1 for significance.
Visual Summary
The box plots display the celltype proportion for four macrophage subsets: Mac (M2C), Mac (M2A), Mac (M2D), and Mac (M2B) across 'Non-inflamed', 'Healthy', and 'Inflamed' conditions.
- Mac (M2C): The proportion of M2C macrophages shows a trend towards increase in the 'Inflamed' condition compared to 'Healthy' (p = 0.07), though it does not reach the conventional significance threshold of p <= 0.05. No significant differences were observed between 'Non-inflamed' and 'Healthy' or 'Inflamed'.
- Mac (M2A): This subset exhibits a statistically significant *decrease* in proportion in the 'Inflamed' condition compared to 'Healthy' (p <= 0.05). There were no significant differences between 'Non-inflamed' and 'Healthy'.
- Mac (M2D): The proportion of M2D macrophages is significantly *reduced* in the 'Inflamed' condition compared to both 'Non-inflamed' (p <= 0.05) and 'Healthy' (p <= 0.01).
- Mac (M2B): A highly significant *increase* in M2B macrophage proportion is observed in the 'Inflamed' condition compared to 'Healthy' (p <= 0.001) and 'Non-inflamed' (p <= 0.05). Additionally, there is a significant difference between 'Non-inflamed' and 'Healthy' (p = 0.05), with 'Non-inflamed' showing a higher proportion.
Biological Interpretation
Macrophages are highly plastic immune cells that polarize into different subsets with distinct functions, broadly categorized as M1 (pro-inflammatory) and M2 (anti-inflammatory/pro-resolving/tissue repair). The M2 category itself comprises several phenotypically and functionally distinct subsets (M2A, M2B, M2C, M2D), and their balance is crucial for maintaining tissue homeostasis, especially in dynamic environments like the gut.
The observed shifts in macrophage subsets in the colon with inflammation suggest a dysregulation in the immune response:
- Decreased M2A and M2D Macrophages in Inflammation: M2A macrophages are typically associated with Th2 responses, helminth infections, and wound healing/tissue repair [NCBI]. M2D macrophages are sometimes linked to tumor-associated macrophages or specific metabolic reprogramming. The significant reduction of both M2A and M2D subsets in the 'Inflamed' colon suggests a potential impairment in the tissue's capacity for anti-inflammatory resolution, debris clearance, and repair. This could perpetuate the inflammatory state or hinder mucosal healing.
- Increased M2B Macrophages in Inflammation: M2B macrophages are known for their role in immune regulation, capable of producing both pro-inflammatory cytokines (e.g., TNF-α, IL-1β) and anti-inflammatory cytokines (e.g., IL-10) [PubMed Search]. Their significant increase in the 'Inflamed' condition is notable. This could indicate a specific M2 subtype being recruited or polarized in response to chronic gut inflammation. Depending on their specific functional state in this context, they might contribute to the inflammatory cascade or represent a complex, potentially ineffective, immunoregulatory attempt. The elevated proportion in 'Non-inflamed' compared to 'Healthy' also hints at a baseline shift or a transitional state.
- M2C Macrophages Trend: M2C macrophages are generally associated with acquired deactivation, immune suppression, and phagocytosis of apoptotic cells, often producing high levels of IL-10 and TGF-β, contributing to tissue remodeling and fibrosis [NCBI]. The trend towards an increase in 'Inflamed' suggests they might be involved in dampening inflammation or participating in remodeling processes that could lead to fibrosis in chronic inflammation.
Collectively, these findings point to a complex re-orchestration of macrophage subsets in the inflamed colon, moving away from M2A/M2D phenotypes that promote resolution and repair, and towards an increased presence of M2B macrophages, which have more nuanced and context-dependent roles in inflammation.
Clinical or Translational Implications
The distinct shifts in macrophage subset populations observed in the inflamed colon have several potential clinical implications:
- Disease Biomarkers: The specific changes in M2A, M2D, and M2B macrophage proportions could serve as potential cellular biomarkers for the presence or severity of colon inflammation. Monitoring these shifts might aid in diagnosis, prognosis, or assessing treatment response in inflammatory bowel diseases (IBD) or other gut inflammatory conditions.
- Therapeutic Targets: Understanding the functional roles of these dysregulated macrophage subsets is crucial for developing targeted therapies. Strategies aimed at restoring the balance of reparative macrophages (e.g., enhancing M2A/M2D populations) or modulating the activity of specific M2B subsets could represent novel therapeutic avenues for managing chronic colon inflammation. For instance, promoting M2A polarization could potentially improve mucosal healing and reduce chronic inflammation.
- Pathogenic Mechanisms: These data highlight specific macrophage phenotypes that contribute to the underlying pathogenesis of colon inflammation. The reduced presence of macrophages typically associated with resolution and repair, coupled with an increase in subsets with complex immunoregulatory roles, suggests a sustained inflammatory environment and impaired resolution mechanisms. Further research into the exact functional state and cytokine profiles of these macrophage subsets in the inflamed colon could provide deeper insights into disease mechanisms.
9. Condition-Specific Cell-Cell Interaction Analysis in Colon
[Analysis Visualization Results]...
Analysis Overview
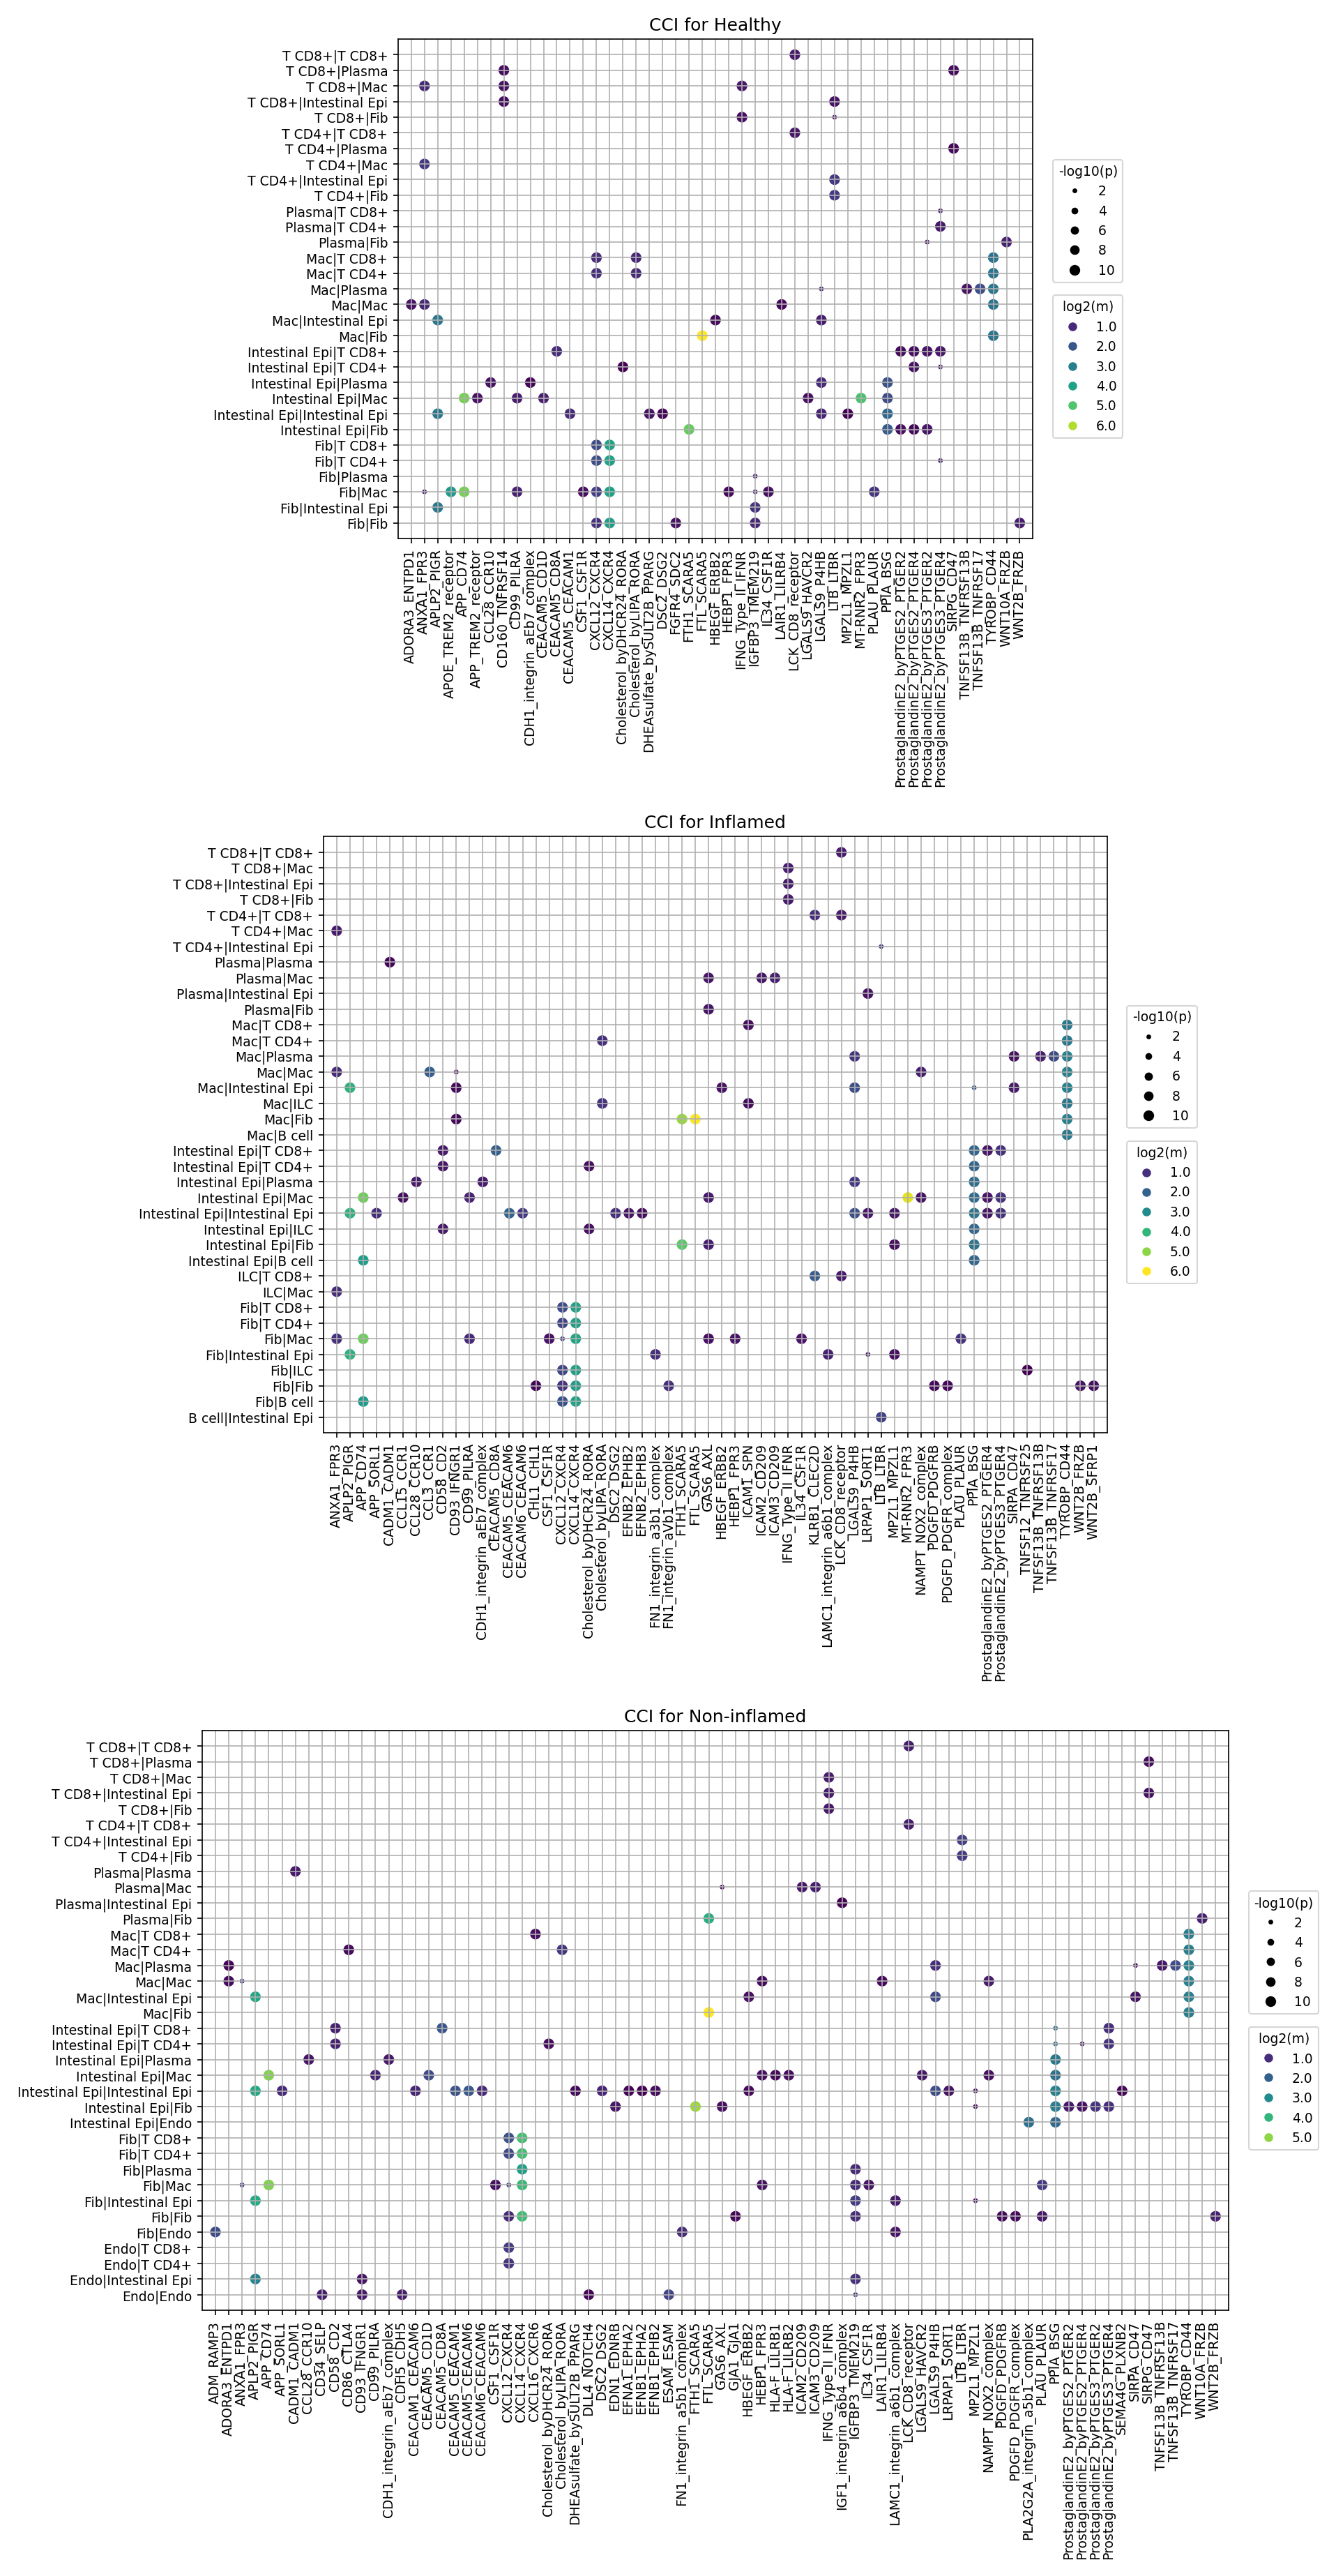
This analysis investigates cell-cell interactions (CCIs) using CellPhoneDB across different conditions (Healthy, Inflamed, Non-inflamed) in human colon single-cell RNA-seq data. The objective is to identify prominent ligand-receptor pairs mediating communication between various cell types in each condition, with a specific focus on understanding changes associated with colonic inflammation. The dot plots visualize the significance of interactions (indicated by dot size, representing -log10(p)) and the mean expression level of the interacting ligand-receptor pair (indicated by dot color, representing log2(mean)), between various cell type pairs.
Visual Summary
The provided dot plots present the top 80 cell-cell interactions for Healthy, Inflamed, and Non-inflamed colon tissues, showcasing the intricate communication networks at the celltype_minor level.
- Overall Pattern: A diverse array of cell-cell interactions are observed across all conditions, with key players including T cells (CD4+, CD8+), Macrophages, Intestinal Epithelial cells (IEC), and Fibroblasts. These cell types frequently interact with each other and within their own populations.
- Healthy Condition: This plot establishes a baseline of homeostatic interactions. Notable strong interactions include SPP1-CD44, various Prostaglandin-receptor interactions (e.g., PTGES2-PTGER4, PTGES2-PTGER2), and CXCL12-CXCR4 signaling. These interactions are active across multiple immune-stromal and immune-immune cell pairs, contributing to normal tissue function. HBEGF-ERBB2/ERBB4 interactions, critical for epithelial repair and proliferation, are also present, often involving IEC.
- Inflamed Condition: This plot reveals a dramatic increase in both the number and the intensity (larger dot sizes indicating higher significance, brighter colors indicating higher mean expression) of cell-cell interactions compared to both Healthy and Non-inflamed states.
- Amplified Signaling: Interactions involving SPP1-CD44 and Prostaglandin pathways are notably strengthened and more widespread, particularly involving Macrophages, T cells, and IEC.
- Emergence/Strengthening of Pro-inflammatory Signals: IFNG-IFNGR1 interactions become significantly more prominent, especially between Macrophages and IEC, and T cells and Macrophages. Several TNFSF-TNFRSF interactions, such as TNFSF13B-TNFRSF13B/TNFRSF13C (BAFF system), appear considerably more active, involving B cells, Plasma cells, and T cells. Cell adhesion molecules like ICAM1-ITGAL/ITGB2 also show enhanced activity, consistent with increased immune cell infiltration and activation.
- Expanded Cellular Crosstalk: The Inflamed condition highlights significantly expanded communication networks among immune cells (T-T, T-Mac, Mac-Mac) and between immune and stromal/epithelial compartments (Mac-IEC, T-IEC, Fib-T, Fib-Mac).
- Non-inflamed Condition: The interaction profile in the Non-inflamed condition appears largely similar to the Healthy state. While some subtle quantitative differences might exist, the broad patterns of active ligand-receptor pairs and interacting cell types closely resemble the Healthy baseline, suggesting a relatively quiescent or pre-disease physiological environment compared to the active inflammation.
Biological Interpretation
The distinct cell-cell interaction patterns provide significant biological insights into the dynamic cellular crosstalk in the colon under different physiological and pathological conditions.
- Inflammation-driven Cellular Activation and Recruitment: The robust increase in SPP1-CD44 interactions in the Inflamed colon is highly significant. Osteopontin (SPP1) is a critical matricellular protein involved in inflammation, immune cell recruitment, and tissue remodeling, often expressed by macrophages and T cells GeneCards: SPP1. Its enhanced interaction with CD44, a cell surface glycoprotein, suggests activated immune cell migration, adhesion, and survival within the inflamed microenvironment.
Immune Cell Orchestration and Pro-inflammatory Signaling:
- The heightened activity of IFNG-IFNGR1 signaling in the Inflamed state points to a strong Th1-driven immune response. Interferon-gamma (IFN-γ) is a key pro-inflammatory cytokine produced by T cells and NK cells, activating macrophages and driving inflammation UniProt: P01579 (IFNG).
- The increased presence of TNFSF family interactions, particularly involving B and Plasma cells (e.g., TNFSF13B/BAFF), indicates active humoral immunity and B cell survival mechanisms, which are often implicated in chronic inflammatory conditions like Inflammatory Bowel Disease (IBD) PubMed Search: BAFF inflammatory bowel disease.
- CXCL12-CXCR4 interactions, prominent across conditions but often amplified in inflammation, are crucial for leukocyte trafficking and retention within tissues, as well as influencing fibroblast activity and fibrosis GeneCards: CXCL12.
- Inflammatory Mediators and Tissue Response: The consistent and often amplified presence of Prostaglandin receptor interactions (e.g., PTGES2-PTGER4, PTGES2-PTGER2) underscores the central role of prostaglandins in modulating inflammation, pain, and tissue repair in the colon. Prostaglandin E2 (PGE2) can have both pro- and anti-inflammatory roles depending on context and receptor expression, but its enhanced signaling suggests active eicosanoid metabolism during inflammation.
- Epithelial-Immune-Stromal Crosstalk: The robust interactions involving Intestinal Epithelial cells (IEC) with T cells and Macrophages, and Fibroblasts with immune cells, are crucial for maintaining gut barrier integrity, initiating immune responses, and driving tissue remodeling processes, including fibrosis, during chronic inflammation. HBEGF-ERBB2/ERBB4 interactions, though present in healthy tissue, might also be part of an amplified epithelial repair response or contribute to aberrant epithelial proliferation in inflamed tissue.
Clinical or Translational Implications
The distinct patterns of cell-cell interactions, particularly the marked changes observed in the Inflamed colon, offer valuable insights for potential therapeutic interventions and biomarker discovery.
Therapeutic Targets:
- SPP1-CD44 Axis: Given its strong and widespread activation in inflammation, targeting the SPP1-CD44 axis could be a promising strategy to modulate immune cell recruitment, activation, and tissue remodeling in colonic inflammation. Inhibitors or neutralizing antibodies against SPP1 or CD44 could potentially dampen inflammatory responses and fibrosis PubMed Search: SPP1 CD44 inflammation therapy.
- IFN-γ Pathway: The prominent IFNG-IFNGR1 signaling in the Inflamed state suggests that therapies aimed at neutralizing IFN-γ or blocking its receptor might be beneficial in reducing pro-inflammatory responses in certain subsets of patients with colonic inflammation.
- TNFSF-TNFRSF Interactions: Modulating specific TNFSF members, such as BAFF (TNFSF13B), which is crucial for B cell survival and antibody production, could be relevant for inflammatory conditions with significant humoral involvement, potentially offering a target for diseases like certain forms of Inflammatory Bowel Disease.
- CXCL12-CXCR4 Axis: Modulating this axis could help control immune cell trafficking into and retention within inflamed colon tissue, potentially reducing inflammatory cell burden and subsequent tissue damage.
- Biomarker Discovery: The specific ligand-receptor pairs that are highly enriched and significantly altered in the Inflamed condition (e.g., SPP1-CD44, IFNG-IFNGR1, certain TNFSF interactions) could serve as potential biomarkers for disease activity, prognosis, or response to therapy in patients with colonic inflammatory diseases.
- Experimental Validation: The identified critical interactions provide a strong basis for further experimental validation. *In vitro* co-culture experiments using relevant colon cell lines or primary cells, and *in vivo* studies in animal models of colitis, could be designed to confirm the functional significance of these ligand-receptor pairs in driving inflammatory processes or tissue repair. For example, blocking specific interactions using recombinant proteins or antibodies could clarify their roles in immune cell activation, migration, and cytokine production.
- Personalized Medicine: Understanding the specific CCI profiles in different inflammatory conditions could contribute to a personalized medicine approach, allowing for targeted therapies based on the dominant interactive pathways in a patient's unique colonic microenvironment.
10. Condition-Specific Cell-Cell Interaction Patterns in Human Colon
[Analysis Visualization Results]...
Analysis Overview
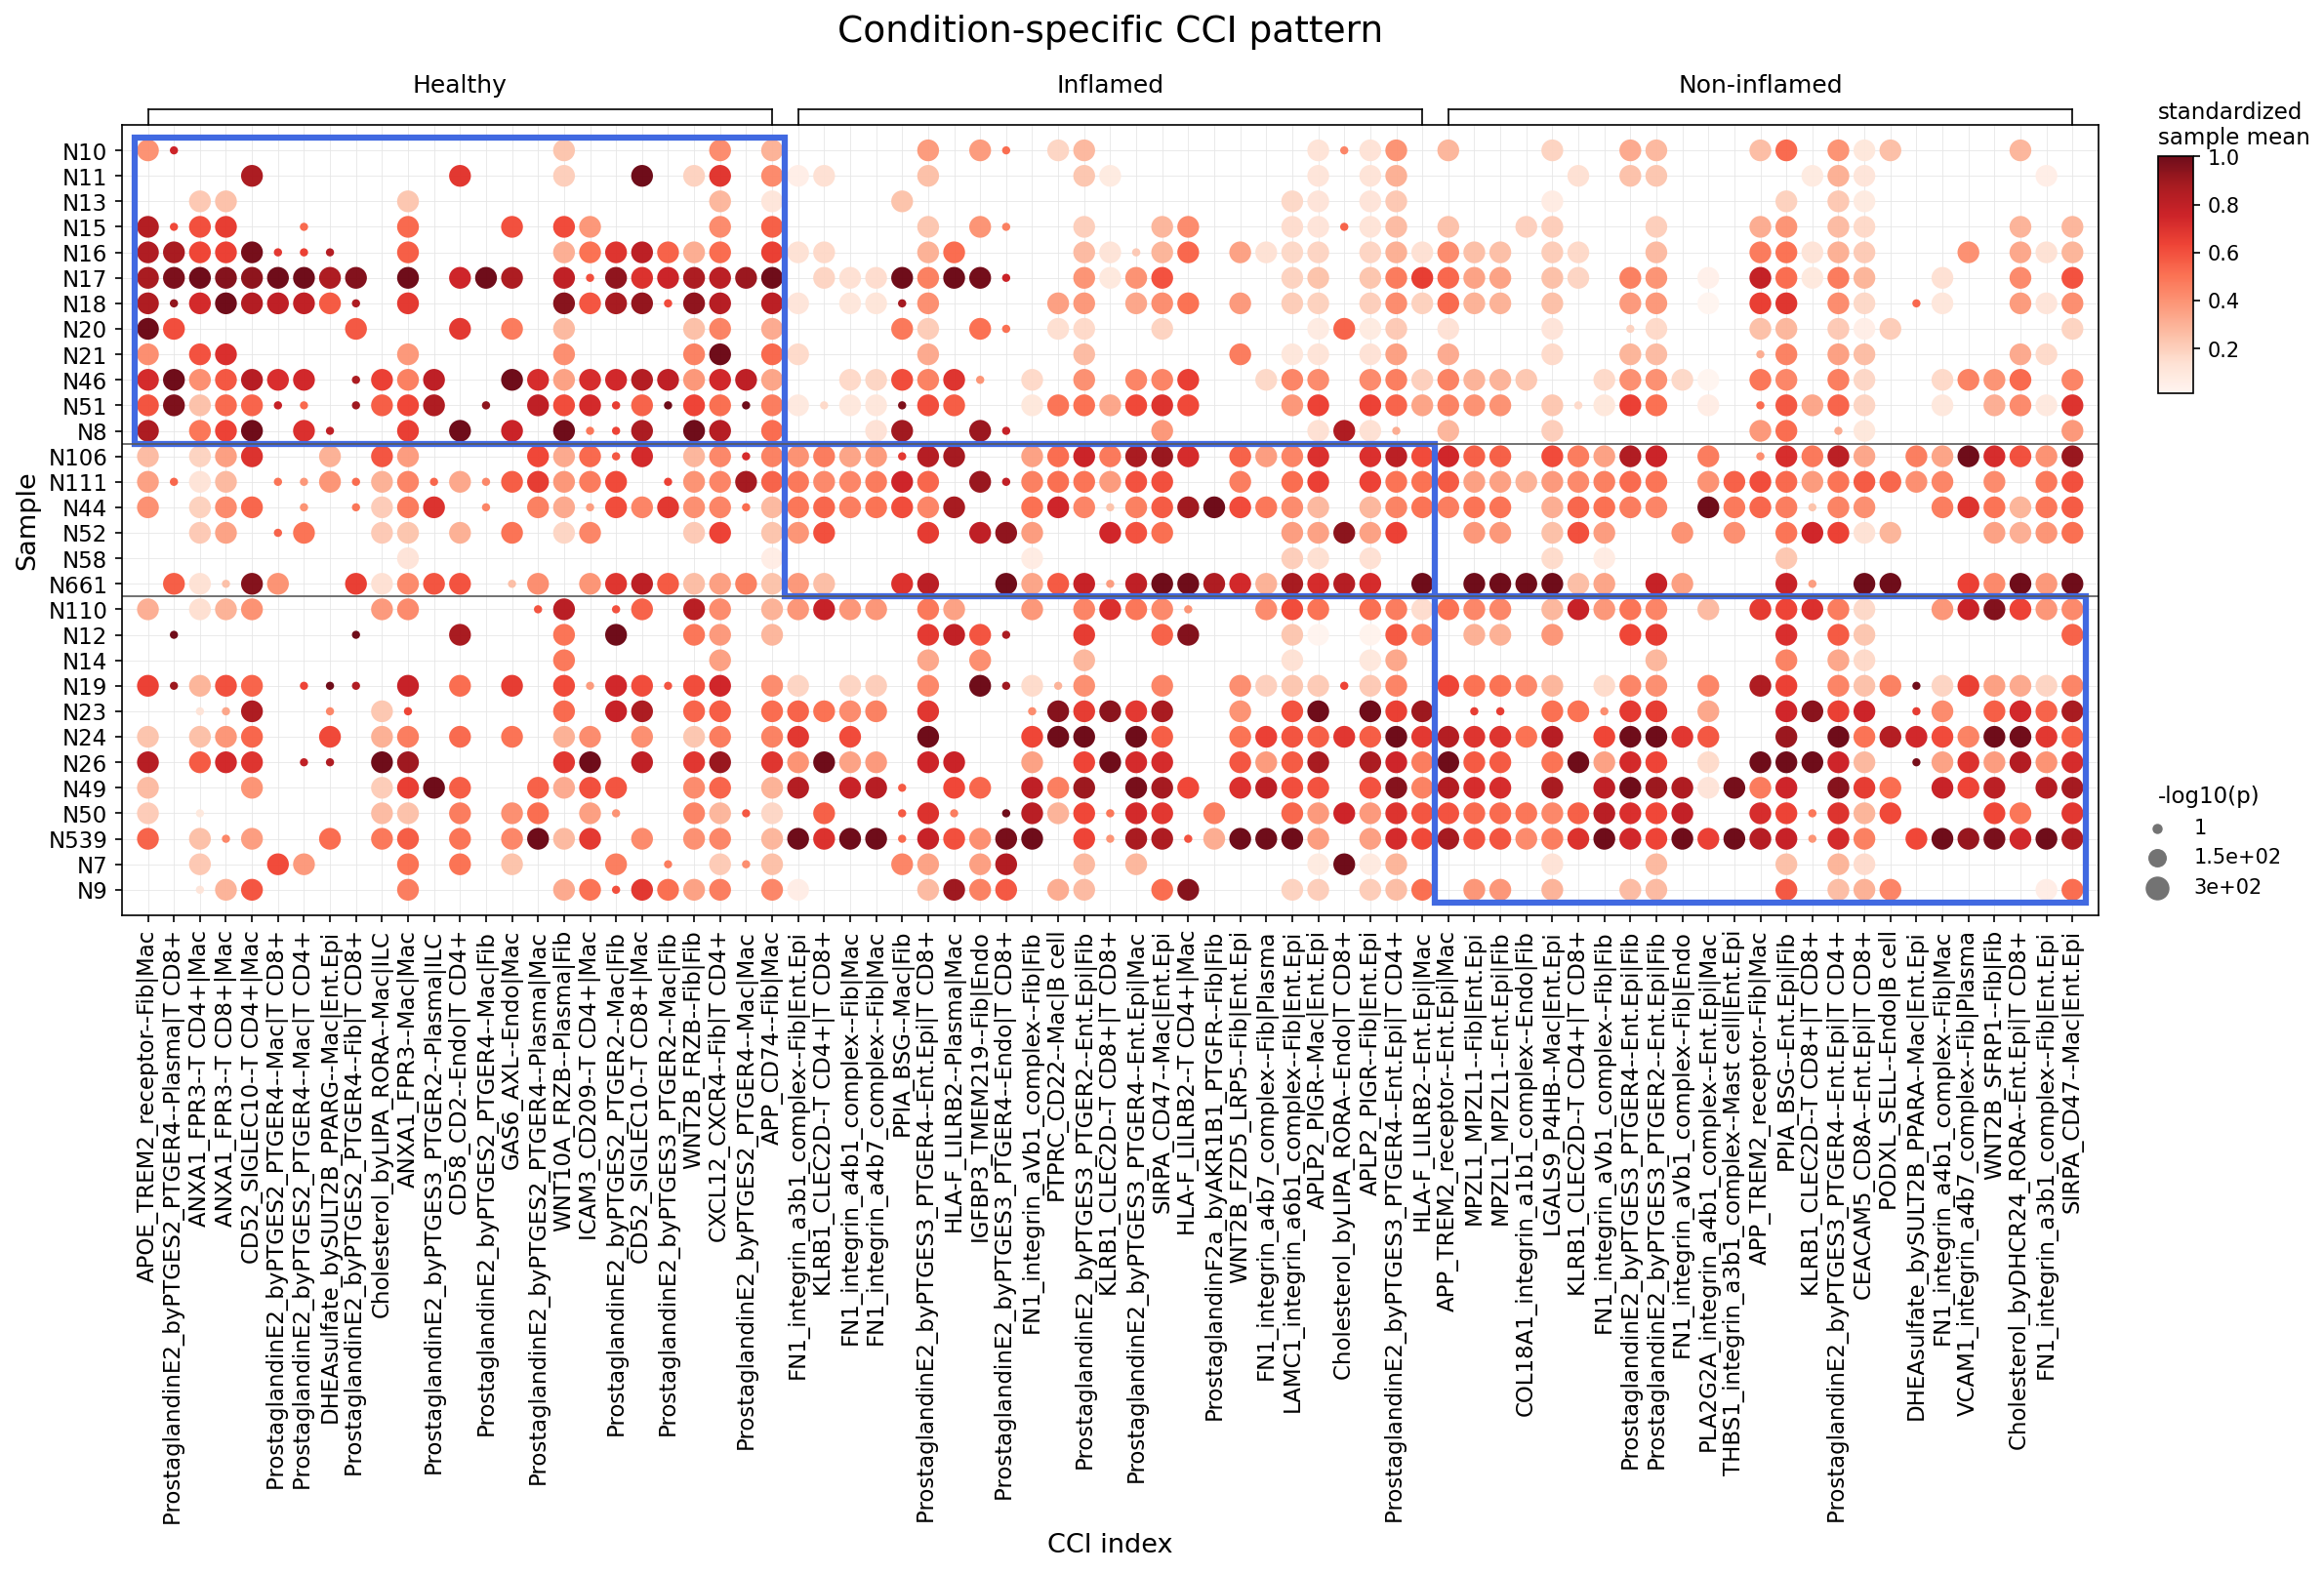
This analysis investigates statistically significant differences in cell-cell interactions (CCI) across different conditions (Healthy, Inflamed, Non-inflamed) within the human colon, focusing on major immune cells (B cell, T cell, Myeloid cell, Mast cell) and stromal cells. The dot plot visualizes the top 25 most significantly enriched CCIs in each condition, identified by comparing the mean interaction strength in that condition against others using a t-test (p-value cutoff 0.1, alternative hypothesis: greater). The color intensity of the dots represents the standardized mean interaction strength, and the dot size indicates the statistical significance (-log10(p-value)).
Visual Summary
The dot plot clearly segregates distinct patterns of cell-cell interactions across the Healthy, Inflamed, and Non-inflamed colon samples.
- Healthy Condition: A unique set of CCIs is highly active in healthy samples, characterized by strong ProstaglandinE2_byPTGES2 signaling interactions with various immune and stromal cells (e.g., Fibroblasts, Macrophages, Plasma cells, CD4+ and CD8+ T cells via PTGER2, PTGER3, PTGER4 receptors). Other prominent interactions include ANXA1_FPR3 (T cell CD4+ and Macrophage) and CD52_SIGLEC10 (T cell CD8+ and Macrophage).
- Inflamed Condition: A striking shift in active CCIs is observed in the inflamed colon. ProstaglandinE2_byPTGES3 interactions, rather than PTGES2, become highly enriched and statistically significant. These interactions occur broadly between Intestinal Epithelial cells, Endothelial cells, Fibroblasts, Macrophages, and T cells, notably through PTGER2 and PTGER4. Furthermore, various integrin-mediated interactions (e.g., FN1_integrin_a4b1_complex with Intestinal Epithelial cells and Fibroblasts, LAMC1_integrin_a6b1_complex with Intestinal Epithelial cells and Fibroblasts, COL18A1_integrin_a1b1_complex with Endothelial cells and Fibroblasts) are strongly upregulated. Immune cell crosstalk, such as KLRB1_CLEC2D between T cells and PTPRC_CD22 between Macrophages and B cells, also shows increased activity.
- Non-inflamed Condition: This condition exhibits a distinct interaction profile, differing from both Healthy and Inflamed states. Notable interactions include SIRPA_CD47 between Macrophages and Intestinal Epithelial cells, WNT2B_FRZB between Fibroblasts, and CXCL12_CXCR4 between Fibroblasts and T cells. Some ProstaglandinE2_byPTGES3 interactions are also present, suggesting a transitional or actively regulated state that is not fully quiescent but also lacks the severe inflammatory signature.
Biological Interpretation
The observed condition-specific CCI patterns provide critical insights into the underlying cellular communication dynamics in colon health and disease.
- Prostaglandin E2 (PGE2) Signaling Shift: The most prominent finding is the differential role of PGE2 synthesis enzymes. In healthy tissues, PGE2 production predominantly involves PTGES2 (cytosolic PGE2 synthase), which often maintains tissue homeostasis. In contrast, the inflamed state is characterized by highly significant interactions driven by ProstaglandinE2_byPTGES3 (microsomal PGE2 synthase 3). PTGES3 is known to be inducible and can contribute to pro-inflammatory PGE2 synthesis, influencing a wide array of cells including epithelial cells, endothelial cells, and immune cells, thereby propagating inflammatory responses [1, 2].
- Increased Integrin-Mediated Adhesion and Remodeling in Inflammation: The substantial upregulation of various integrin complexes, particularly involving Fibroblasts, Intestinal Epithelial cells, and Endothelial cells in the Inflamed condition, highlights dysregulated cell-extracellular matrix and cell-cell adhesion. Integrins are crucial for immune cell trafficking, tissue repair, and fibrosis. Their activation in inflammation suggests ongoing tissue damage, immune cell infiltration, and remodeling processes in the colon [3].
- Distinct Immune Cell Crosstalk:
- The increased KLRB1_CLEC2D (CD161-CLEC2D) interaction between CD4+ and CD8+ T cells in the Inflamed colon points to altered T cell-T cell communication, potentially modulating effector functions or survival during inflammation [4].
- The PTPRC_CD22 (CD45-CD22) interaction between Macrophages and B cells suggests macrophage-mediated regulation of B cell activity, which is critical in adaptive immunity and often dysregulated in inflammatory diseases.
- HLA-F_LILRB2 interactions between Endothelial cells and Fibroblasts in inflammation may represent an immune evasive or immunoregulatory mechanism, as LILRB2 (ILT4) on myeloid cells can inhibit immune responses [5].
- Role of Stromal and Epithelial Cells: Fibroblasts and Intestinal Epithelial cells are not passive, but actively participate in the condition-specific CCI networks. Their involvement in integrin signaling and PGE2 pathways underscores their central role in shaping the inflammatory microenvironment and contributing to tissue integrity or pathology.
Clinical or Translational Implications
The identification of condition-specific CCI patterns offers several potential clinical and translational avenues:
- Biomarkers of Disease Activity: The distinct set of highly active ligand-receptor pairs in the Inflamed colon, especially those involving ProstaglandinE2_byPTGES3 and specific integrin complexes, could serve as robust biomarkers for distinguishing active inflammation from healthy or quiescent disease states. Monitoring these interactions might offer a more granular assessment of disease severity and progression.
- Therapeutic Targets: Ligand-receptor pairs that are significantly elevated and unique to the Inflamed condition represent promising therapeutic targets. For example, specific inhibitors of PTGES3 or its downstream PGE2 receptors (PTGER2/4) could offer novel anti-inflammatory strategies. Similarly, targeting dysregulated integrin pathways has already proven effective in some inflammatory bowel diseases (e.g., vedolizumab targeting α4β7 integrin), and the specific integrin complexes identified here could lead to development of more precise therapies [6].
- Mechanistic Understanding of Pathogenesis: Unraveling these cell-cell communication networks provides a deeper mechanistic understanding of how different cell types coordinate their responses during inflammation in the colon. This knowledge can inform the development of combination therapies that simultaneously target multiple aspects of the inflammatory cascade, addressing both immune cell activation and stromal/epithelial dysfunction.
---
References:
[1] PTGES3 in inflammation: A PubMed search for "PTGES3 inflammation colon" can provide relevant literature on its role. Example search: https://pubmed.ncbi.nlm.nih.gov/?term=PTGES3+inflammation+colon
[2] PGE2 synthesis enzymes: Review articles discussing the roles of different PGE2 synthases (PTGES1, PTGES2, PTGES3) in physiological and pathological conditions. Example search: https://pubmed.ncbi.nlm.nih.gov/?term=PGE2+synthase+inflammation
[3] Integrins in inflammation and colon disease: GeneCards for FN1: https://www.genecards.org/cgi-bin/carddisp.pl?gene=FN1. General reviews on integrins in inflammatory bowel disease. Example search: https://pubmed.ncbi.nlm.nih.gov/?term=integrin+inflammatory+bowel+disease
[4] KLRB1 (CD161) and CLEC2D (LLT1) interaction: UniProt entry for KLRB1: https://www.uniprot.org/uniprotkb/Q12918/entry. Information on CD161-LLT1 axis in immune regulation. Example search: https://pubmed.ncbi.nlm.nih.gov/?term=KLRB1+CLEC2D+T+cell
[5] HLA-F and LILRB2: UniProt entry for LILRB2: https://www.uniprot.org/uniprotkb/Q8N423/entry. Role of HLA-F/LILRB2 in immune modulation. Example search: https://pubmed.ncbi.nlm.nih.gov/?term=HLA-F+LILRB2+inflammation
[6] Integrin-targeting therapies for IBD: Clinical reviews on therapies targeting integrins in inflammatory bowel disease. Example search: https://pubmed.ncbi.nlm.nih.gov/?term=integrin+therapy+inflammatory+bowel+disease
11. Macrophage Condition-Specific Surfaceome Markers in Colon Tissue
[Analysis Visualization Results]...
Analysis Overview
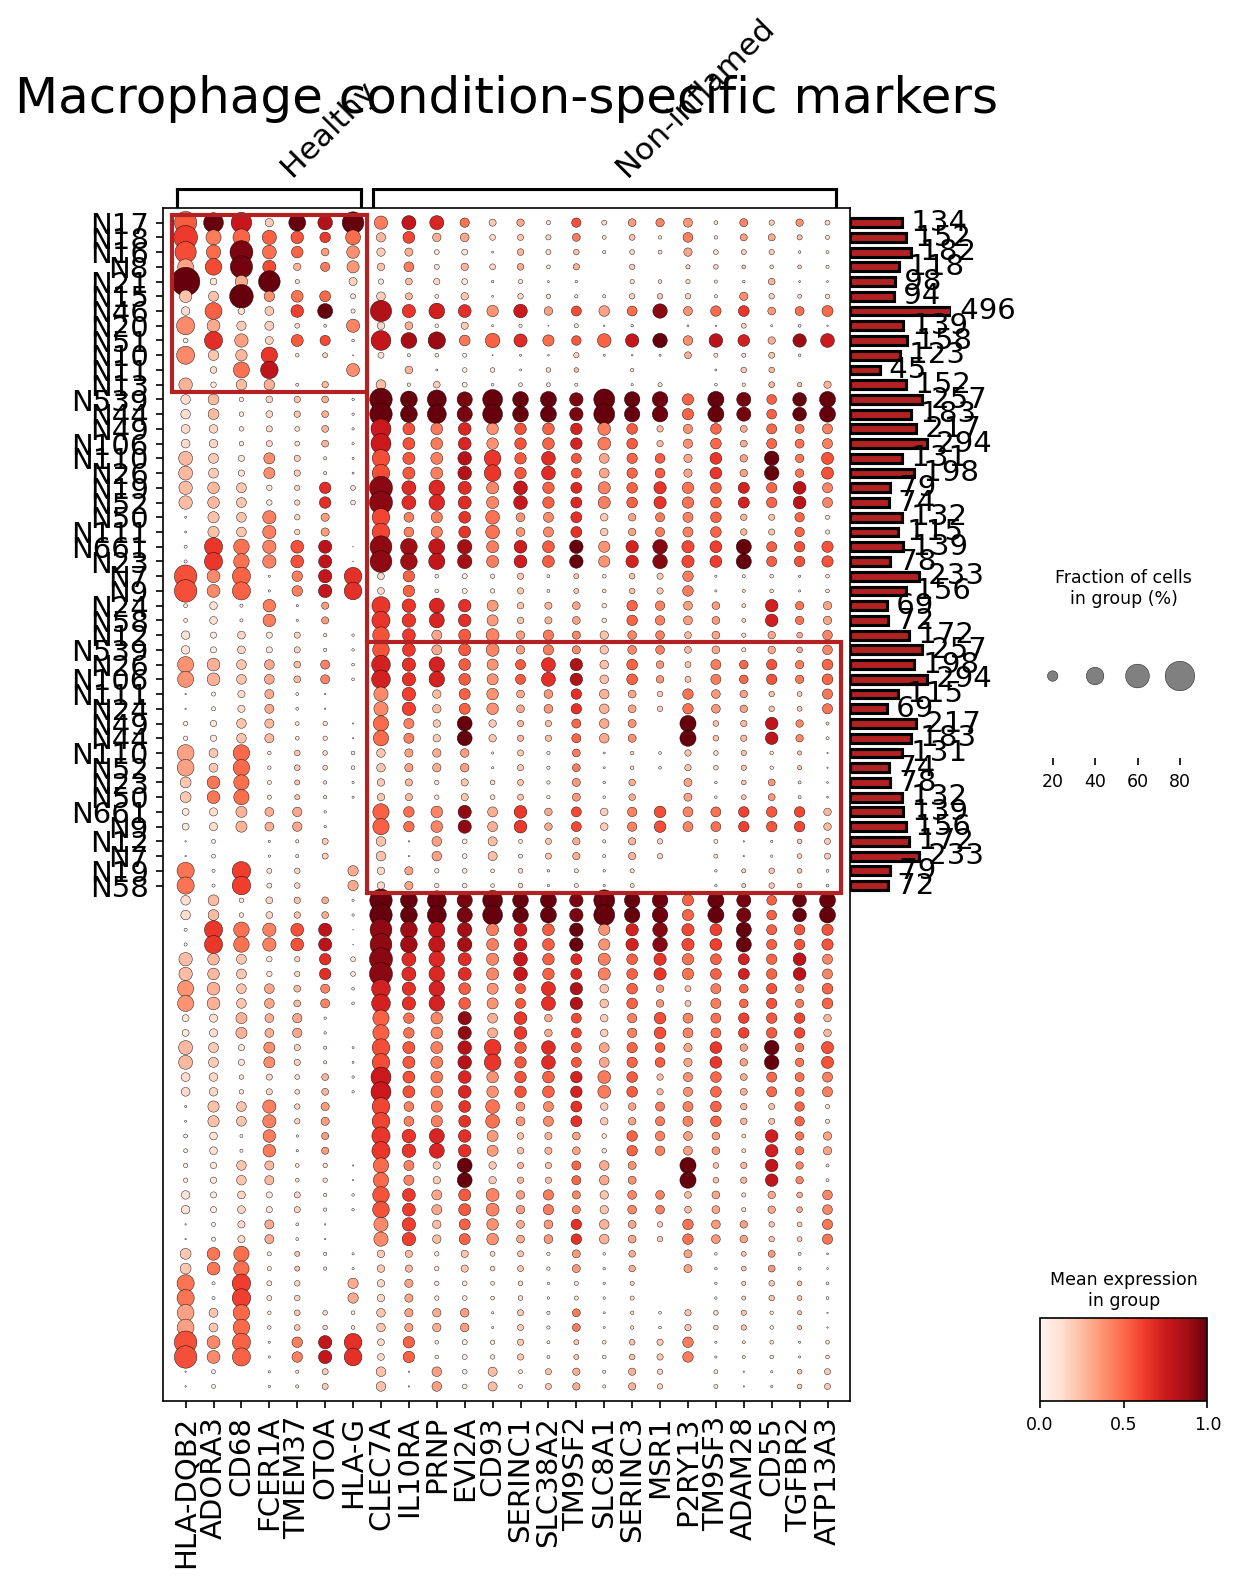
This analysis identifies and visualizes condition-specific surfaceome markers for Macrophages in human colon tissue, comparing "Healthy" samples with "Non-inflamed" samples. The dot plot displays the mean expression level (color intensity) and the fraction of cells expressing each marker gene (dot size) for individual samples grouped by condition. Only surfaceome markers, up to 50 per condition, are presented, offering insights into potential cell surface targets for diagnostic or therapeutic applications.
Visual Summary
The dot plot clearly differentiates two major groups of macrophage surfaceome markers based on their expression patterns across "Healthy" and "Non-inflamed" conditions:
- Healthy-Associated Markers: The leftmost cluster of genes, including HLA-DQB2, ADORA3, CD68, FCER1A, TMEM37, OTOA, HLA-G, CLEC7A, and IL10RA, shows notably higher mean expression (darker red dots) and often a higher fraction of expressing cells (larger dot sizes) predominantly in macrophages from "Healthy" colon samples. Their expression is markedly lower or absent in "Non-inflamed" samples.
- Non-inflamed-Associated Markers: The larger cluster of genes, beginning with PRNP and extending to ATP13A3, exhibits consistently high expression and prevalence in macrophages from "Non-inflamed" colon samples. These markers, such as CD93, MSR1, CD55, and TGFBR2, show minimal to no expression in "Healthy" macrophage populations. This pattern suggests a distinct macrophage activation or differentiation state in the non-inflamed disease context.
- Overall Pattern: The plot demonstrates a clear binary distinction in marker expression, indicating that macrophages undergo substantial changes in their surface proteome when transitioning from a healthy state to a non-inflamed state within the colon. The "Inflamed" condition, explicitly mentioned in the AnnData context, is not displayed as a separate group in this specific visualization.
Biological Interpretation
The differential expression of surfaceome markers in macrophages provides critical insights into their functional states in colon health versus non-inflamed disease.
Healthy Macrophage Signatures:
- MHC Class II molecules (HLA-DQB2) and MHC Class I-related (HLA-G) are involved in antigen presentation and immune modulation. Higher expression in healthy tissue might reflect a state of immune surveillance and tolerance maintenance by tissue-resident macrophages. HLA-G is known for its immunomodulatory roles, often associated with immune tolerance https://www.uniprot.org/uniprotkb/P17693/entry.
- CD68 is a general macrophage marker, and its enrichment here could indicate a particular subtype or state of resident macrophages.
- CLEC7A (Dectin-1) is an innate immune receptor for fungal pathogens. Its presence could indicate ongoing surveillance of the gut microbiota in a healthy state https://www.genecards.org/cgi-bin/carddisp.pl?gene=CLEC7A.
- IL10RA encodes a subunit of the receptor for the anti-inflammatory cytokine IL-10. Higher expression might suggest a readiness for maintaining immune homeostasis and limiting inflammation in healthy tissue https://www.genecards.org/cgi-bin/carddisp.pl?gene=IL10RA.
Non-inflamed Macrophage Signatures:
- The upregulation of genes like CD93 and MSR1 in "Non-inflamed" macrophages points towards altered functional states. CD93 is an adhesion molecule implicated in immune cell regulation and angiogenesis, often upregulated in activated cells https://www.uniprot.org/uniprotkb/Q9NPR5/entry. MSR1 (Macrophage Scavenger Receptor 1) is involved in phagocytosis and clearance of cellular debris and pathogens, characteristic of an activated, potentially pro-inflammatory or tissue-remodeling phenotype https://www.genecards.org/cgi-bin/carddisp.pl?gene=MSR1.
- CD55 (DAF), a complement regulatory protein, is often upregulated during inflammation to protect host cells from excessive complement activation, suggesting an activated state trying to mitigate tissue damage https://www.uniprot.org/uniprotkb/P08174/entry.
- TGFBR2 is a receptor for TGF-β, a cytokine central to tissue repair, immune suppression, and fibrosis. Its high expression suggests macrophages in "Non-inflamed" conditions are actively involved in wound healing, remodeling, or acquiring an immunosuppressive phenotype, which can be part of chronic disease processes or resolution phases.
- Genes like SLC38A2 (SNAT2), an amino acid transporter, and P2RY13, a purinergic receptor, indicate metabolic and signaling adaptations in these macrophages, crucial for their altered functions in the disease microenvironment.
The clear distinction between these marker sets suggests that even in "Non-inflamed" regions of the colon, macrophages exhibit a distinct molecular phenotype compared to truly healthy tissue, likely reflecting a persistent altered state or a precursor to overt inflammation.
Clinical or Translational Implications
The identification of condition-specific surfaceome markers for macrophages has several potential clinical and translational implications:
- Diagnostic Biomarkers: The differentially expressed surfaceome markers, particularly those upregulated in "Non-inflamed" macrophages (e.g., CD93, MSR1, CD55, TGFBR2), could serve as diagnostic or prognostic biomarkers for detecting macrophage activation states associated with chronic intestinal conditions, even in the absence of overt inflammation. These could potentially be assayed via tissue biopsies or circulating macrophage subsets.
- Therapeutic Targets: As these are surfaceome markers, they represent excellent candidates for targeted therapies. Antibodies or small molecules could be developed to specifically modulate the activity of these "Non-inflamed" macrophages, potentially interrupting disease progression or facilitating remission in conditions like Inflammatory Bowel Disease (IBD) or other chronic colitides. For example, targeting TGFBR2 could modulate pro-fibrotic or immunosuppressive macrophage functions https://pubmed.ncbi.nlm.nih.gov/?term=TGFBR2+macrophage+ibd.
- Cellular Immunotherapy: The identified markers could be used for precise isolation (e.g., via FACS) of specific macrophage subsets for further research or for adoptive cell transfer strategies, allowing for a deeper understanding of their roles and therapeutic manipulation.
- Understanding Disease Pathogenesis: These markers provide a molecular fingerprint of macrophages in "Non-inflamed" states, which can help elucidate the underlying mechanisms by which these cells contribute to chronic inflammation, tissue remodeling, or immune dysregulation in colon diseases. Further investigation into the specific functions of genes like PRNP, EVI2A, SERINC family members, and TM9SF family members in macrophage biology within the colon could reveal novel pathways involved in disease pathogenesis.
It is important to note that this analysis specifically compares "Healthy" and "Non-inflamed" conditions, and further investigation is warranted to understand the distinct macrophage surfaceome changes that occur in the explicitly "Inflamed" state of colon tissue.
12. Fibroblast Condition-Specific Surfaceome Markers in Colon Tissue
[Analysis Visualization Results]...
Analysis Overview
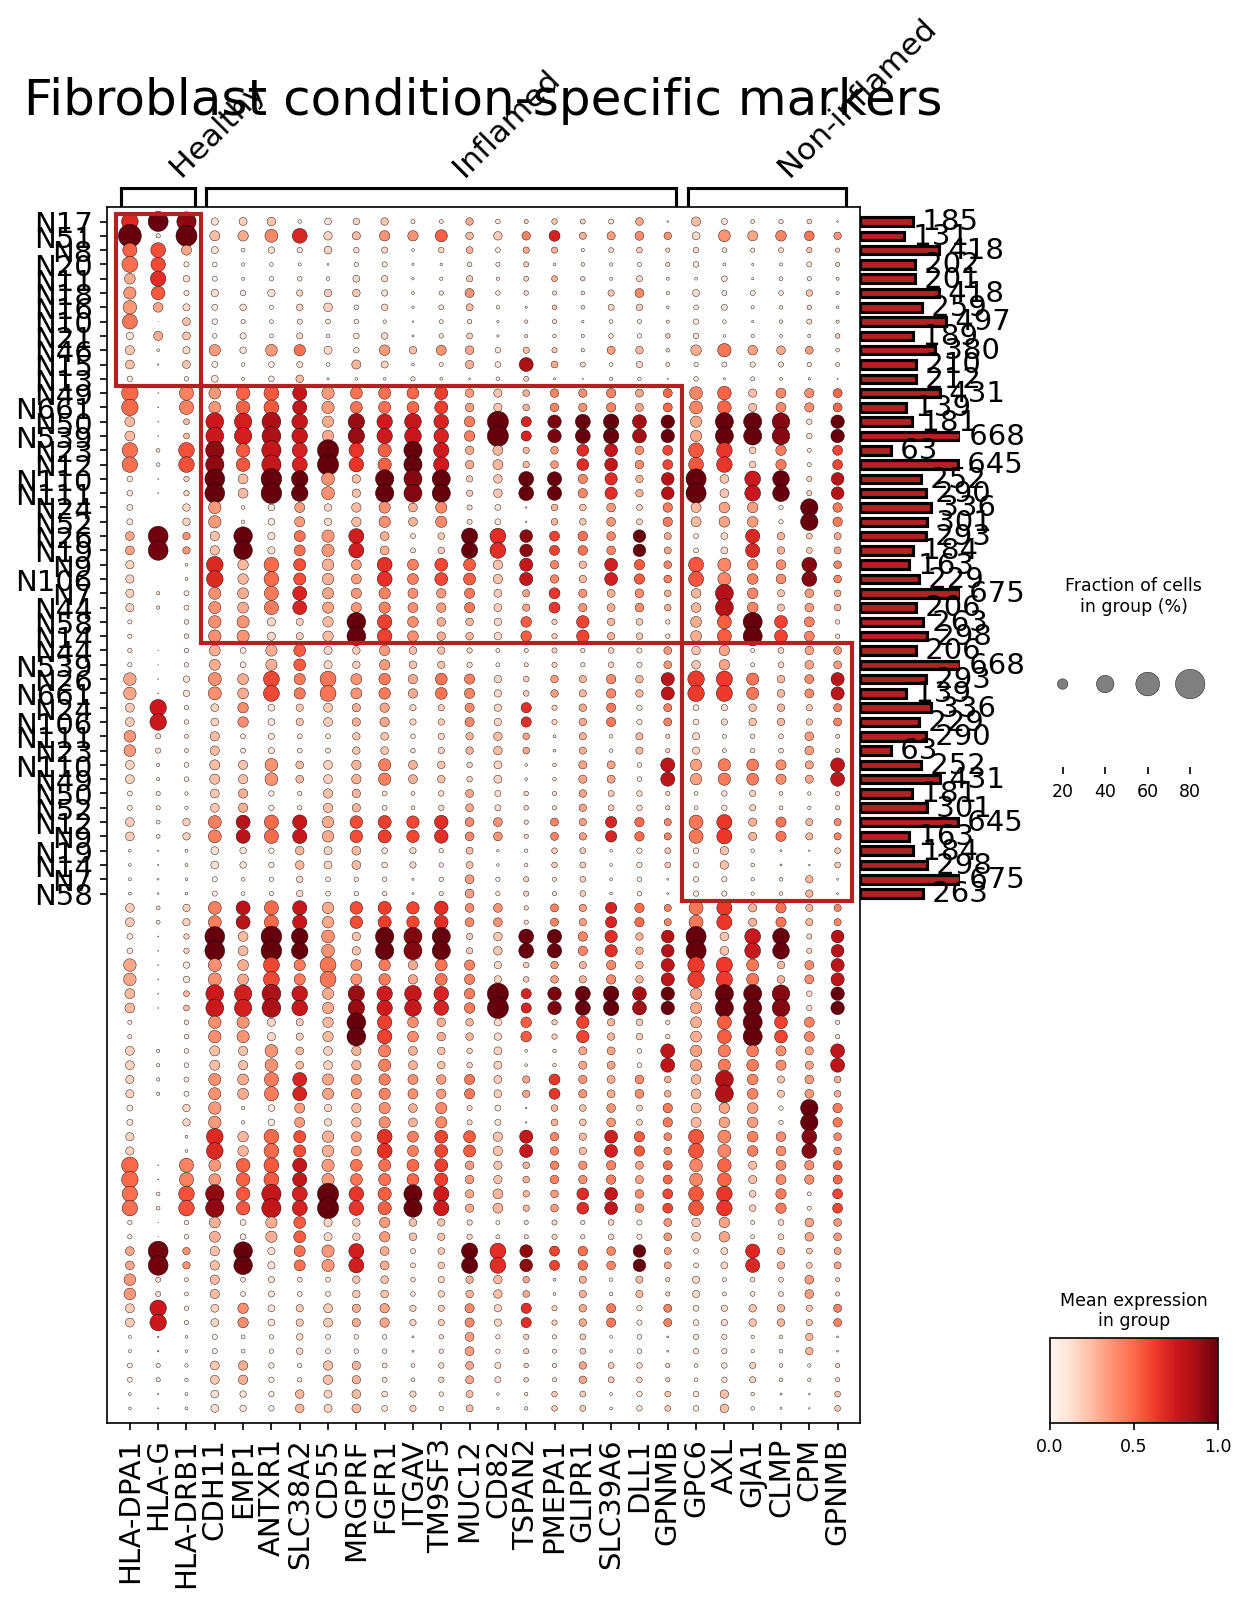
This analysis identifies condition-specific surfaceome markers in fibroblasts from human colon tissue, comparing Healthy, Inflamed, and Non-inflamed states using single-cell RNA sequencing data. The goal was to extract up to 50 surfaceome markers per condition, displaying their expression and prevalence via a dot plot. This provides insights into how fibroblast surface protein profiles change with inflammation, highlighting potential therapeutic targets and biomarkers.
Visual Summary
The dot plot displays the expression patterns of 30 selected surfaceome markers across various subjects (N17-N50), grouped by their condition: Healthy, Inflamed, and Non-inflamed.
- Dot size represents the fraction of cells in a given subject group expressing the gene (prevalence).
- Dot color intensity (reds) indicates the mean expression level of the gene within that group.
- Subject Grouping: Subjects are clearly separated into three distinct clusters corresponding to the Healthy, Inflamed, and Non-inflamed conditions.
- Inflamed-Specific Upregulation: The most striking observation is a robust and widespread upregulation of a large panel of surfaceome markers specifically in fibroblasts from Inflamed colon tissues. These genes exhibit both high prevalence (large dot size) and high mean expression (dark red color) across nearly all Inflamed subjects.
- Contrast with Healthy/Non-inflamed: In stark contrast, fibroblasts from Healthy and Non-inflamed conditions generally show very low or no expression of these same markers, or express them in a much smaller fraction of cells and at lower levels.
- Key Inflamed Markers: Prominent markers highly upregulated in Inflamed fibroblasts include HLA class II molecules (*HLA-DPA1*, *HLA-DRB1*, *HLA-G*), adhesion molecules (*CDH11*, *ITGAV*), growth factor receptors (*FGFR1*, *AXL*), and other functional surface proteins such as *EMP1*, *ANTXR1*, *SLC38A2*, *CD55*, *MRGPRF*, *TM9SF3*, *MUC12*, *CD82*, *TSPAN2*, *PMEPA1*, *GLIPR1*, *SLC39A6*, *DLL1*, *GPC6*, *GJA1*, *CPM*, *CLMP*, and *GPNMB*.
Biological Interpretation
The distinct surfaceome profile observed in fibroblasts from inflamed colon tissue strongly suggests a significant functional shift in these cells during active inflammation.
- Immune Modulation and Antigen Presentation: The high expression of MHC class II genes (*HLA-DPA1*, *HLA-DRB1*, *HLA-G*) in inflamed fibroblasts is particularly notable. While conventionally associated with professional antigen-presenting cells (APCs), fibroblasts can acquire antigen-presenting capabilities under inflammatory conditions, influencing local T cell responses and perpetuating chronic inflammation in the colon. *HLA-G* also plays immune-modulatory roles, potentially fine-tuning immune responses or contributing to immune evasion mechanisms within the inflamed microenvironment PubMed search: HLA-G inflammation fibroblast.
- Fibroblast Activation and Remodeling: Many upregulated markers are associated with fibroblast activation, migration, adhesion, and extracellular matrix (ECM) remodeling, which are hallmarks of chronic inflammation and fibrosis in diseases like Inflammatory Bowel Disease (IBD).
- Adhesion and Migration: *CDH11* (Cadherin-11) GeneCards: CDH11 and *ITGAV* (Integrin alpha V) GeneCards: ITGAV are key adhesion molecules. Their upregulation indicates increased cell-cell and cell-ECM interactions, crucial for fibroblast motility and tissue restructuring during inflammation and wound healing.
- Growth Factor Signaling: *FGFR1* (Fibroblast Growth Factor Receptor 1) GeneCards: FGFR1 and *AXL* (AXL Receptor Tyrosine Kinase) GeneCards: AXL are receptor tyrosine kinases involved in cell proliferation, survival, and migration. Their activation can drive fibroblast proliferation and differentiation into myofibroblasts, contributing to fibrosis.
- Extracellular Matrix (ECM) Interactions: *ANTXR1* (Anthrax Toxin Receptor 1, also known as TEM8) GeneCards: ANTXR1 is involved in angiogenesis and ECM organization. *GPNMB* (Glycoprotein NMB) GeneCards: GPNMB is also implicated in tissue remodeling and inflammation.
- Other Functional Implications:
- Complement Regulation: *CD55* (Decay-accelerating factor) GeneCards: CD55 is a complement regulatory protein, suggesting fibroblasts might actively protect themselves from complement-mediated damage in the inflamed microenvironment or modulate local immune responses.
- Cell-Cell Communication: *DLL1* (Delta-like ligand 1) GeneCards: DLL1, a Notch ligand, indicates altered Notch signaling, critical for cell fate, differentiation, and inter-cellular communication. *GJA1* (Connexin 43) GeneCards: GJA1 forms gap junctions, suggesting enhanced direct communication between inflamed fibroblasts or with other cell types.
Collectively, these findings demonstrate that fibroblasts in the inflamed colon undergo significant transcriptional reprogramming, manifesting in a distinct surfaceome that likely supports their pro-inflammatory and pro-fibrotic roles in disease pathogenesis.
Clinical or Translational Implications
The identification of condition-specific surfaceome markers in colon fibroblasts holds significant clinical and translational potential.
- Biomarkers for Disease Activity and Fibrosis: The identified upregulated surface markers (e.g., *AXL*, *GPNMB*, *CDH11*, *ITGAV*, *FGFR1*, *HLA-DPA1/DRB1*) could serve as valuable biomarkers for detecting active inflammation or early signs of fibrosis in the colon. These markers could potentially be measured on fibroblasts isolated from biopsy samples or, if shed, in stool or serum, offering non-invasive or minimally invasive diagnostic and prognostic tools for conditions like IBD.
- Therapeutic Targets for Inflammatory Bowel Disease (IBD): Since these are surface proteins, they are directly accessible for targeted therapies.
- AXL: Inhibitors targeting AXL are currently under investigation in various diseases, including cancer and fibrosis PubMed search: AXL inhibitor fibrosis. Targeting AXL on activated colon fibroblasts could modulate their survival, proliferation, and pro-inflammatory activities, potentially mitigating inflammation and fibrosis.
- FGFR1: Given its role in fibroblast activation, FGFR1 could also be a therapeutic target to reduce excessive fibroblast proliferation and matrix deposition.
- ITGAV and CDH11: Antibodies or small molecules blocking integrin αV or Cadherin-11 could interfere with fibroblast adhesion, migration, and activation of profibrotic pathways (e.g., TGF-β activation via ITGAV), thereby reducing fibrosis.
- GPNMB: Modulating GPNMB activity could also impact fibroblast function and the inflammatory milieu.
- Understanding Disease Mechanisms and Stratification: Elucidating the precise roles of these surface markers will deepen our understanding of fibroblast heterogeneity and their diverse contributions to colon health and disease. This knowledge could enable better patient stratification and personalized treatment strategies for IBD and other inflammatory colon conditions. Further experimental validation, such as flow cytometry on dissociated tissue or immunohistochemistry on tissue sections, could confirm protein expression and localization of these promising marker candidates.
13. CD4 T Cell Condition-Specific Surfaceome Markers in Colon
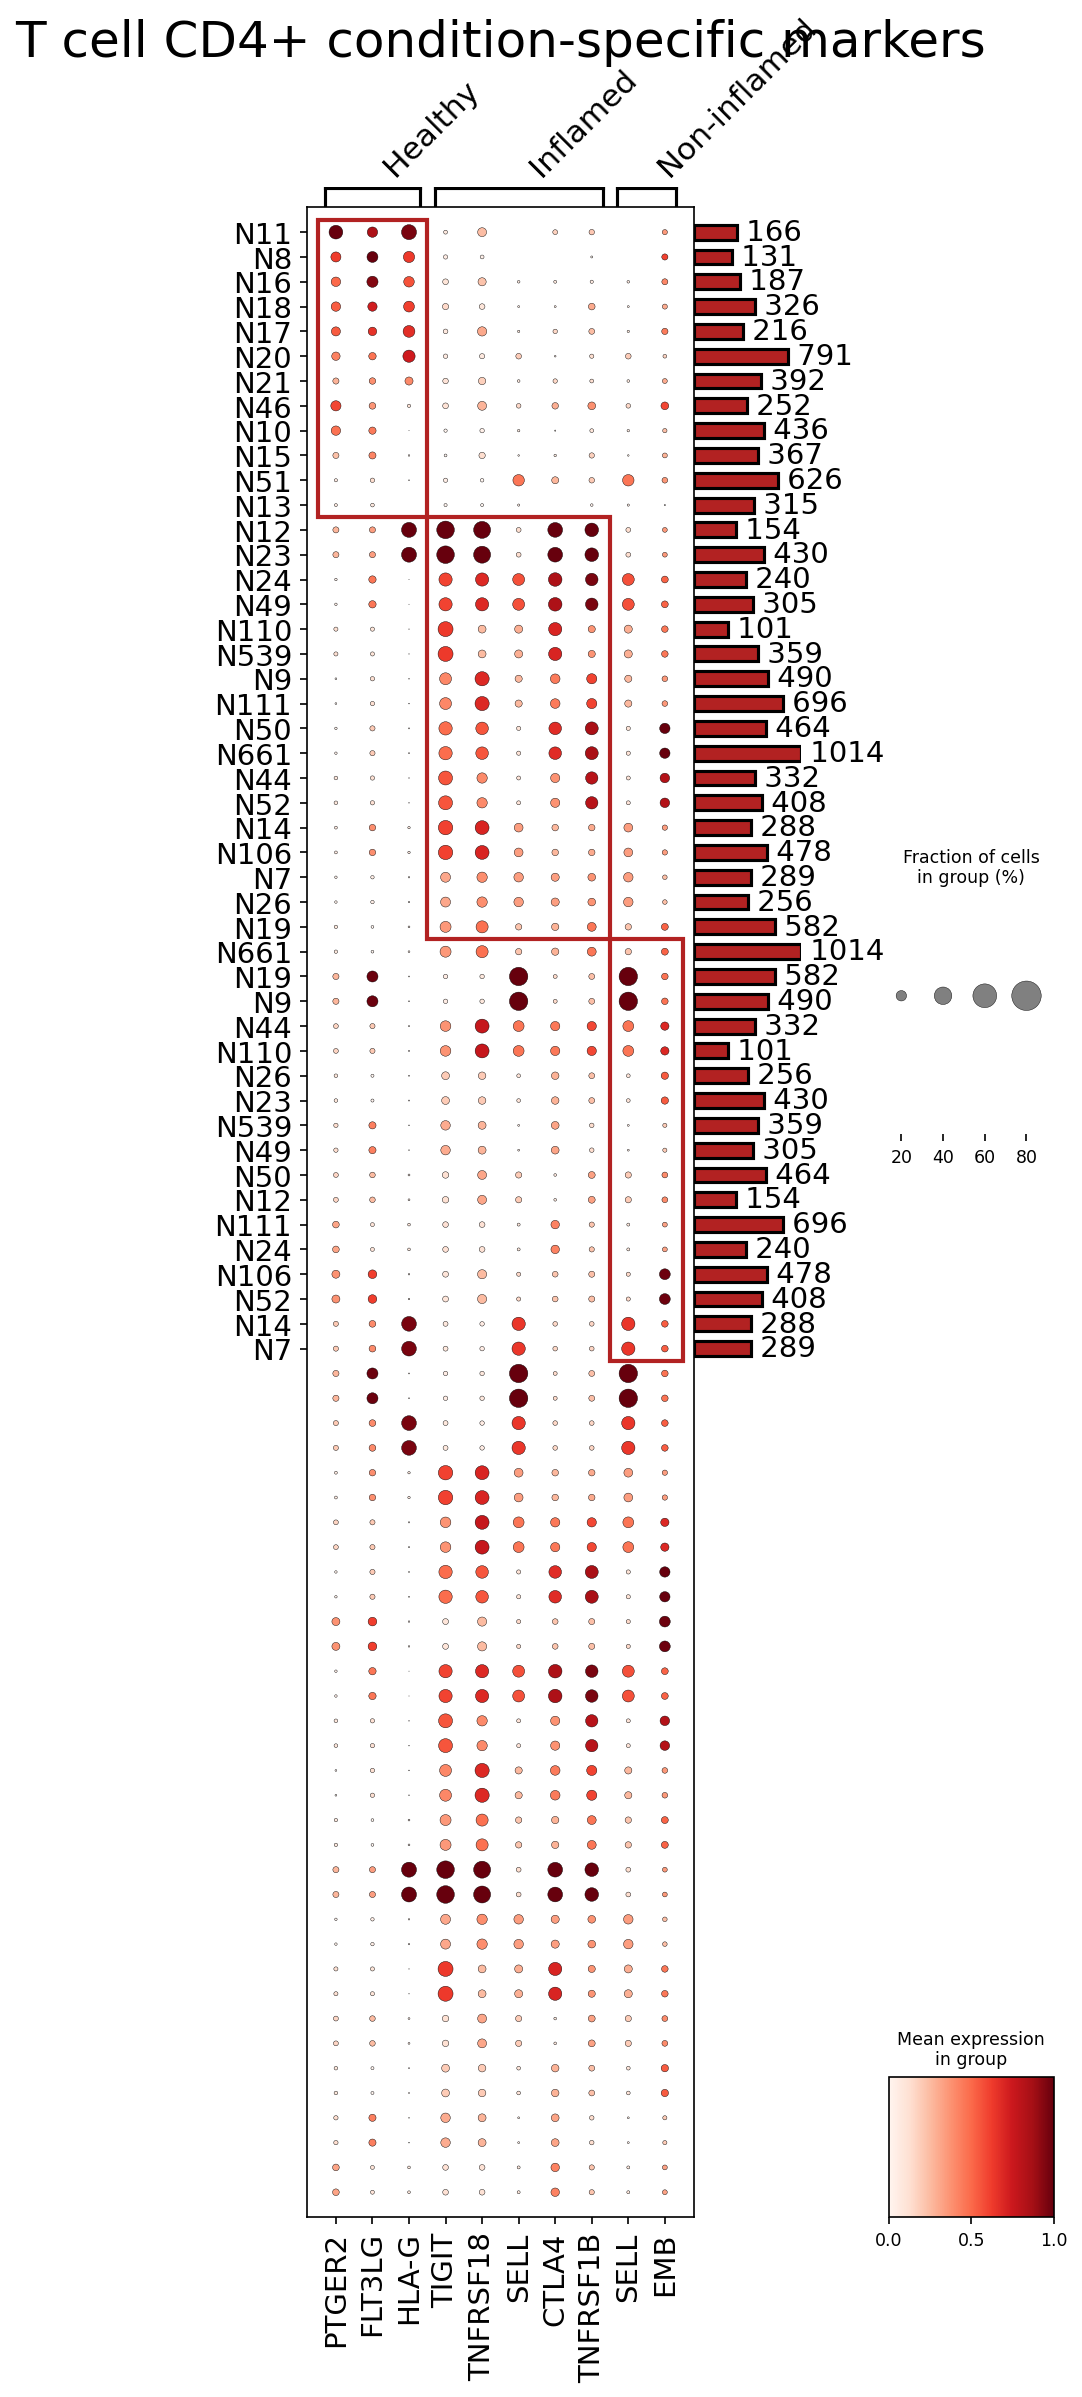
[Analysis Visualization Results]...
Analysis Overview
This analysis identifies surfaceome markers specifically enriched in CD4 T cells across different colon conditions (Healthy, Inflamed, Non-inflamed). Using single-cell RNA-seq data from human colon, the plot_markers_and_expression_dot tool was applied to extract and visualize differentially expressed surface markers for T cell CD4+ populations. The results highlight genes whose expression patterns are distinct between the healthy, inflamed, and non-inflamed states, offering insights into the phenotypic adaptation of CD4 T cells in these contexts. Importantly, only surfaceome markers were considered, which are of particular interest for diagnostic and therapeutic applications.
Visual Summary
The provided dot plot illustrates the expression of condition-specific surfaceome markers in CD4 T cells across individual samples, grouped by colon condition (Healthy, Inflamed, Non-inflamed).
- Dot Size: Represents the fraction of CD4 T cells within a given sample and condition that express the particular gene. Larger dots indicate a higher proportion of expressing cells.
- Dot Color Intensity: Reflects the mean expression level of the gene in the expressing cells within that group, with darker red indicating higher mean expression.
- Y-axis (Samples): Individual samples (N-prefixed IDs) are grouped by condition. The bar plot on the right indicates the total number of CD4 T cells contributing to each sample's data point.
- X-axis (Genes): Displays the identified surfaceome markers. These markers were selected for their differential expression across conditions, with genes common to all three conditions largely filtered out.
Key Observations:
- Healthy-Associated Markers: A cluster of samples predominantly from the "Healthy" condition exhibits higher expression and prevalence of markers such as PTGER2, FLT3LG, and HLA-G. These markers show limited or no expression in most Inflamed or Non-inflamed samples.
- Inflamed-Associated Markers: A distinct set of markers, including TIGIT, TNFRSF18 (GITR), SELL, and CTLA4, shows strong and consistent expression across many "Inflamed" samples. While some of these markers are also detectable in "Non-inflamed" samples, their expression is generally more prominent and widespread in the inflamed state.
- Non-Inflamed Specificity: The "Non-inflamed" condition does not display a unique set of highly and consistently expressed surface markers as clearly as the "Healthy" or "Inflamed" conditions. Some markers, like EMB and TNFRSF1B, show varying expression in subsets of non-inflamed samples, but without a unified pattern.
- Sample Heterogeneity: Even within conditions, there is variability across individual samples, suggesting biological diversity among subjects or specific microenvironmental influences. For instance, some Inflamed samples show very high expression of certain markers, while others show moderate levels.
Biological Interpretation
The identified condition-specific surfaceome markers for CD4 T cells offer valuable insights into their functional states and roles in colon health and disease.
- Healthy Colon Immunity: The enrichment of PTGER2, FLT3LG, and HLA-G in CD4 T cells from healthy colon suggests a state of immune homeostasis and tolerance.
- PTGER2 (Prostaglandin E Receptor 2) is a receptor for PGE2, which can modulate immune responses, often with immunosuppressive or anti-inflammatory effects depending on the context, potentially contributing to gut immune quiescence. https://www.genecards.org/cgi-bin/carddisp.pl?gene=PTGER2
- FLT3LG (FMS-like Tyrosine Kinase 3 Ligand) is critical for dendritic cell development and activation. Its expression on CD4 T cells could indicate specific T cell-dendritic cell interactions promoting a healthy immune environment. https://www.genecards.org/cgi-bin/carddisp.pl?gene=FLT3LG
- HLA-G is a non-classical MHC Class I molecule often associated with immune tolerance, potentially promoting an immunosuppressive phenotype on T cells or interacting with other immune cells to maintain gut tolerance. https://www.genecards.org/cgi-bin/carddisp.pl?gene=HLA-G
- Inflammatory Response Dynamics: The prominent upregulation of TIGIT, TNFRSF18 (GITR), SELL, and CTLA4 in inflamed CD4 T cells points to an activated yet tightly regulated immune response.
- Immune Checkpoints (TIGIT, CTLA4): Both TIGIT and CTLA4 are well-known inhibitory immune checkpoints expressed on T cells. Their high expression in inflamed conditions suggests that while CD4 T cells are activated, there are concurrent strong regulatory mechanisms in place, possibly to prevent excessive tissue damage from chronic inflammation. This is a common hallmark of chronic inflammatory diseases and T cell exhaustion. https://www.genecards.org/cgi-bin/carddisp.pl?gene=TIGIT, https://www.genecards.org/cgi-bin/carddisp.pl?gene=CTLA4
- Costimulatory Receptor (TNFRSF18/GITR): TNFRSF18 (Glucocorticoid-Induced TNFR-Related Protein, GITR) is a costimulatory receptor that, upon engagement, can enhance T cell activation, proliferation, and survival. Its co-expression with inhibitory receptors indicates a complex interplay between pro-inflammatory and regulatory signals in the inflamed colon. https://www.genecards.org/cgi-bin/carddisp.pl?gene=TNFRSF18
- Homing Receptor (SELL/CD62L): SELL (L-selectin, CD62L) is an adhesion molecule involved in lymphocyte recirculation and homing to lymphoid tissues. While often shed upon T cell activation, its presence here might indicate specific migratory subsets of CD4 T cells within the inflamed colon or specific differentiation states. https://www.genecards.org/cgi-bin/carddisp.pl?gene=SELL
Clinical or Translational Implications
The identification of condition-specific surfaceome markers provides valuable opportunities for developing diagnostic tools and therapeutic strategies in colon inflammatory diseases.
- Biomarkers for Disease Activity and Subtyping: The distinct expression patterns of surface markers like TIGIT, CTLA4, and TNFRSF18 could serve as valuable biomarkers to identify activated, exhausted, or regulatory CD4 T cell subsets in the inflamed colon. These markers could be used for patient stratification, monitoring disease activity, or assessing response to immunomodulatory therapies, potentially through flow cytometry or immunohistochemistry of biopsies.
- Therapeutic Targets: Given that these are surfaceome markers, they are highly accessible for antibody-based interventions.
- Immune Checkpoint Modulation: TIGIT and CTLA4 are established immune checkpoints, with therapies targeting them (e.g., CTLA4 blocking antibodies like ipilimumab) already in clinical use for other conditions (e.g., cancer, and some CTLA4 agonistic strategies in IBD). Their upregulation in inflamed colon suggests these pathways are actively involved in modulating immune responses in the gut. Targeted blockade of TIGIT or CTLA4 could potentially enhance anti-inflammatory responses in specific contexts, though careful consideration of off-target effects and potential for exacerbating inflammation is crucial.
- Costimulatory Modulation: TNFRSF18 (GITR) agonists are being explored in oncology to boost anti-tumor immunity. In the context of inflammation, modulating GITR signaling could either promote pro-inflammatory responses or, in specific settings (e.g., selective activation of regulatory T cells), could have a beneficial effect.
- Novel Therapeutic Avenues: The discovery of PTGER2, FLT3LG, and HLA-G as healthy-associated markers might open avenues to restore immune homeostasis in inflammatory conditions by promoting pathways active in health, perhaps by inducing HLA-G expression or modulating prostaglandin signaling.
- Experimental Validation: These identified markers provide clear candidates for further experimental validation. Flow cytometry on dissociated colon tissue, immunohistochemistry on tissue sections, or functional assays using specific antibodies could be employed to confirm protein expression patterns and assess the functional consequences of modulating these surface molecules in CD4 T cells from inflammatory bowel disease patients.
14. Gene Ontology (GSA) Analysis of Intestinal Epithelial Cells Across Colon Conditions
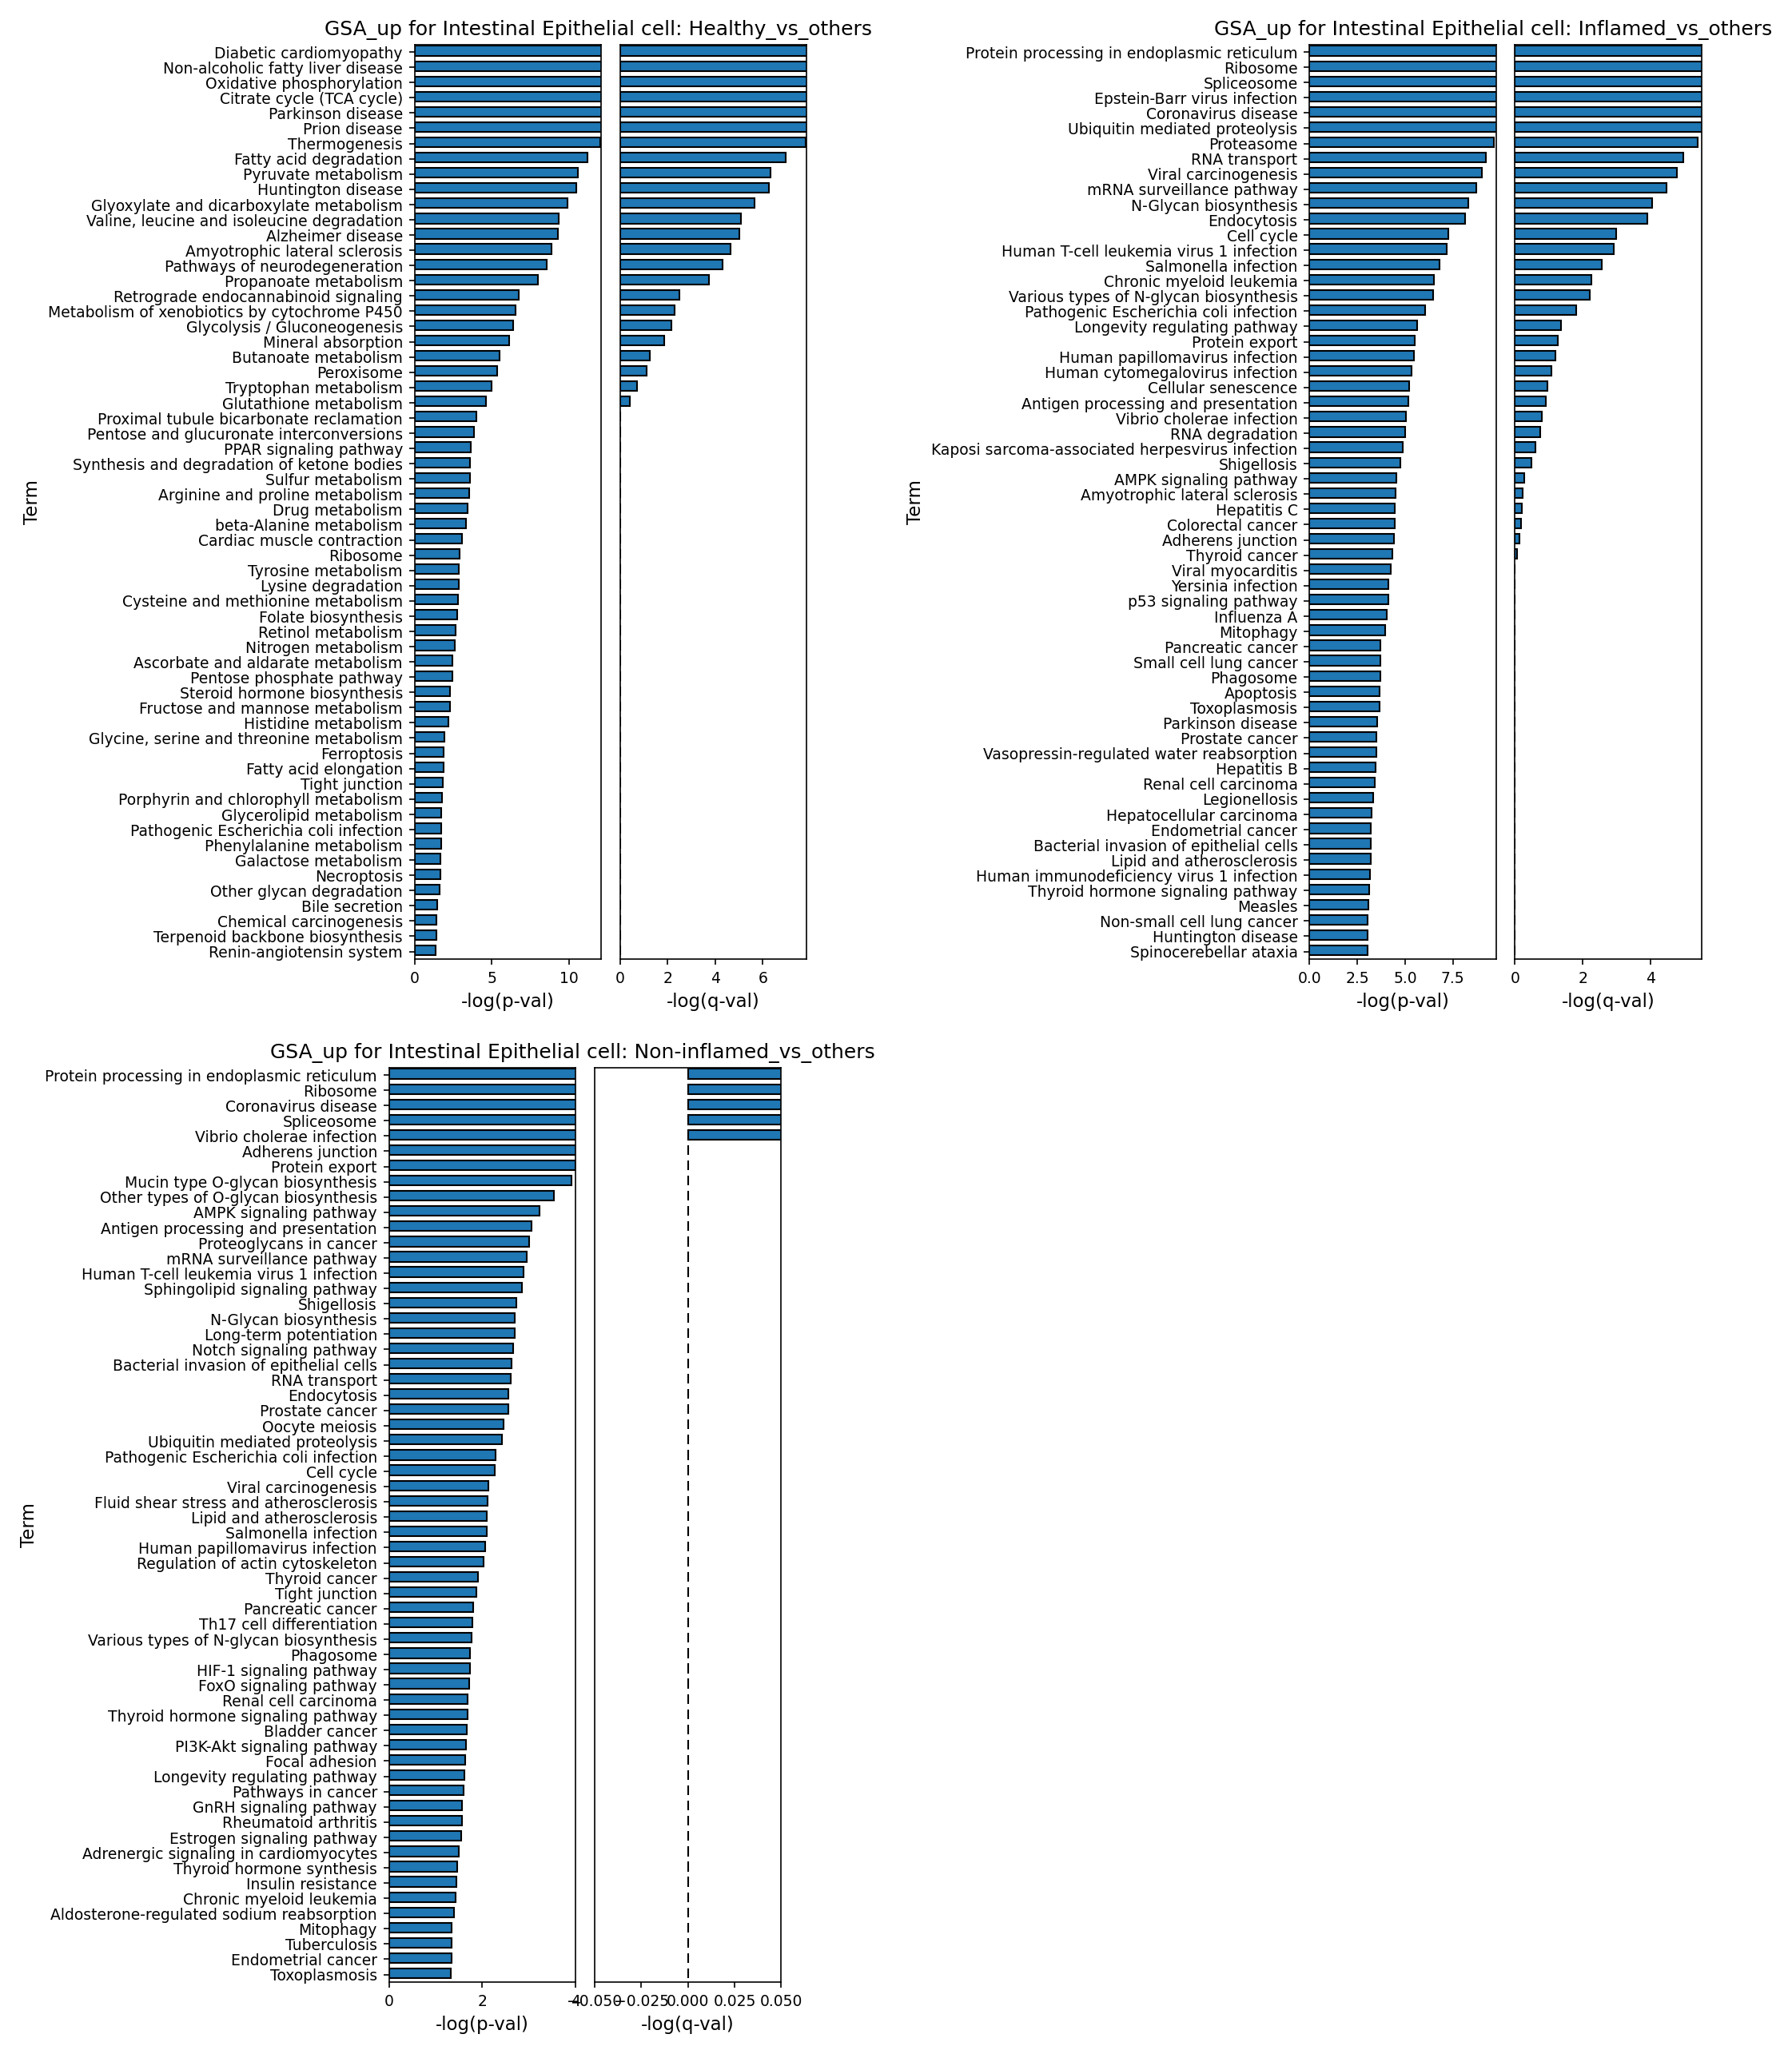
[Analysis Visualization Results]...
Analysis Overview
이 분석은 대장 조직 내 장 상피 세포(IECs)의 유전자 온톨로지(GSA) 결과를 제시하며, 세 가지 조건(건강, 염증, 비염증)을 비교합니다. 각 조건의 IEC에서 통계적으로 유의하게 상향 조절된 생물학적 경로 및 프로세스를 식별하며, 이는 해당 조건의 세포를 다른 두 조건의 세포를 합친 그룹과 비교하여 도출되었습니다 (예: 건강 vs. [염증 + 비염증]). 결과는 -log(p-value) 및 -log(q-value)를 기반으로 상위 풍부 GO 용어를 보여주는 막대 그래프로 시각화됩니다.
Visual Summary
제공된 막대 그래프는 각 대장 조건에서 장 상피 세포의 조건별 유전자 온톨로지 용어 풍부도를 보여줍니다:
- Healthy_vs_others (건강 vs. 기타): 최상위 풍부 경로는 주로 대사 및 에너지 생산과 관련이 있습니다. 여기에는 "Oxidative phosphorylation (산화적 인산화)," "Citrate cycle (TCA cycle) (구연산 회로)," "Fatty acid degradation (지방산 분해)," 및 "Pyruvate metabolism (피루브산 대사)" 등이 포함됩니다. "Diabetic cardiomyopathy (당뇨병성 심근병증)" 및 신경퇴행성 질환과 같은 전신 질환 관련 경로도 나타나, 기본적인 대사 조절 이상이 이러한 병리 상태와 연관될 수 있음을 시사합니다. 상위 용어들의 통계적 유의성 (-log(p-val) 및 -log(q-val))은 일반적으로 높습니다.
- Inflamed_vs_others (염증 vs. 기타): 대조적으로, 염증이 있는 조직의 IEC는 단백질 합성, 처리, 분해 및 세포 스트레스 반응에 관련된 경로에서 강한 풍부도를 보입니다. 주요 용어로는 "Protein processing in endoplasmic reticulum (소포체 내 단백질 처리)," "Ribosome (리보솜)," "Spliceosome (스플라이스솜)," "Ubiquitin mediated proteolysis (유비퀴틴 매개 단백질 분해)," 및 "Proteasome (프로테아솜)"이 있습니다. 또한, "Epstein-Barr virus infection (엡스타인-바 바이러스 감염)," "Coronavirus disease (코로나바이러스 질환)"과 같은 바이러스 감염 관련 경로와 "Cell cycle (세포 주기)"가 두드러지게 나타나, 활발한 면역 반응과 세포 재생/증식을 나타냅니다.
- Non-inflamed_vs_others (비염증 vs. 기타): 이 조건은 혼합된 프로필을 나타냅니다. 염증 관련 경로(예: 소포체 내 단백질 처리, 리보솜, 스플라이스솜, 세포 주기)와 일부 겹침이 있습니다. 그러나 다른 두 조건에 비해 특히 -log(q-val)의 통계적 유의성이 많은 용어에서 현저히 낮아, 덜 강력한 차등적 풍부도를 시사합니다. "Sphingolipid signaling pathway (스핑고지질 신호 전달 경로)" 및 "Notch signaling pathway (노치 신호 전달 경로)"와 같은 잠재적으로 독특한 용어도 포함되며, 이는 상피 항상성 및 분화에 중요하고, "Bacterial invasion of epithelial cells (상피 세포의 세균 침투)"와 관련된 경로도 나타납니다.
Biological Interpretation
GSA 결과는 대장의 다른 조건에서 장 상피 세포의 뚜렷한 기능적 적응 및 상태를 보여줍니다.
건강한 장 상피 세포의 항상성 (Healthy_vs_others):
- 대사 경로(예: 산화적 인산화, TCA 회로, 지방산 분해)의 두드러진 풍부도는 건강한 IEC의 높은 에너지 요구량을 강조합니다. 이는 장벽 완전성 유지, 빠른 세포 회전율 및 영양소 흡수에 중요합니다. 이러한 강력한 대사 능력은 정상적인 생리 기능에 필수적입니다.
- 전신 질환 경로의 출현은 IEC 내 이러한 핵심 대사 과정의 교란이 광범위한 병리학적 상태에 기여하거나 이를 반영할 수 있음을 시사합니다. 예를 들어, 지방산 대사의 조절 이상은 비알코올성 지방간 질환(NAFLD) 또는 당뇨병 합병증과 연결될 수 있으며, 장 건강과 전신 대사 균형의 상호 연결성을 강조합니다.
장 상피 세포의 염증 반응 (Inflamed_vs_others):
- 단백질 합성, 처리 및 분해 기전(ER 단백질 처리, 리보솜, 스플라이스솜, 유비퀴틴 매개 단백질 분해, 프로테아솜)의 강력한 상향 조절은 격렬한 세포 활동을 나타냅니다. 이는 염증 동안 사이토카인, 케모카인 및 기타 염증 매개체의 생산 증가, 그리고 손상된 단백질의 교체와 관련이 있을 가능성이 높습니다.
- 바이러스 감염 및 세포 주기 경로의 풍부도는 병원체에 대한 숙주 방어 기전과 손상을 복구하려는 염증 조직의 활발한 재생 과정을 모두 나타냅니다. 이러한 빠른 증식은 복구에 필요하지만, 조절되지 않으면 이형성 변화에도 기여할 수 있습니다.
비염증 조직의 미묘한 변화 (Non-inflamed_vs_others):
- 일부 단백질 처리 및 세포 주기 경로가 '염증' 상태와 겹치는 것은 '비염증' 영역(종종 염증성 장 질환(IBD) 환자에서 육안적 염증 없이 발견됨)이 분자 수준에서 실제로 비활성 상태이거나 건강하지 않음을 시사합니다. 대신, 이들은 지속적인 미미한 염증, 적응 또는 미래 염증 발병에 대한 준비 상태를 반영하는 것으로 보입니다.
- 이 그룹의 많은 경로에서 낮은 통계적 유의성(q-value)은 '비염증' IEC의 특정 전사적 변화가 '기타' 그룹과의 비교 시 덜 균일하거나 덜 강력하게 구별된다는 것을 의미합니다. 이는 '비염증' 샘플 내의 더 큰 이질성 또는 더 미묘하고 덜 두드러진 분자적 특징 때문일 수 있습니다.
- "Notch signaling pathway (노치 신호 전달 경로)" 및 "Sphingolipid signaling pathway (스핑고지질 신호 전달 경로)"와 같은 특정 신호 전달 경로의 풍부도는 주목할 만합니다. 노치 신호는 장 줄기 세포 유지 및 다양한 상피 계열로의 분화에 중요하며, 스핑고지질은 세포 성장, 세포 사멸 및 염증에 역할을 합니다. 이들의 차등적 조절은 항상성 메커니즘의 변화를 나타낼 수 있으며, 겉보기에 비활성 상태인 이 영역에서 질병 감수성 또는 변형된 재생 능력에 기여할 수 있습니다. "Bacterial invasion of epithelial cells (상피 세포의 세균 침투)" 및 "Shigellosis (시겔라증)"는 지속적인 숙주-미생물 상호작용의 변화를 더욱 시사합니다.
Clinical or Translational Implications
이러한 조건에 따른 장 상피 세포의 뚜렷한 GSA 프로필은 임상 관리 및 치료 개발에 중요한 통찰력을 제공합니다.
- 바이오마커 발굴: 식별된 경로는 질병 활동, 예후 또는 치료 반응에 대한 분자 바이오마커로 활용될 수 있습니다. 예를 들어, 건강한 IEC의 대사 변화는 질병으로의 초기 편차를 나타낼 수 있으며, 특정 단백질 처리 또는 바이러스 반응 경로는 염증 심각도를 추적할 수 있습니다.
- 표적 치료법: 염증성 IEC에서 지속적으로 상향 조절되는 경로(예: ER 단백질 처리 또는 프로테아좀 분해의 특정 구성 요소)는 염증을 완화하거나 상피 복구를 개선하기 위한 잠재적인 치료 표적이 됩니다.
- 비염증성 질병 상태 이해: '비염증' GSA 프로필은 특히 IBD에 중요합니다. 육안적으로 정상인 영역도 분자적 이상을 가지고 있을 수 있음을 강조합니다. 이러한 특정 경로(예: 노치 및 스핑고지질 신호 전달, 세균 상호작용)를 이해하는 것은 질병 재발을 예방하거나, 진행 위험이 있는 환자를 식별하거나, 증상 완화 이상으로 관해를 유지하는 전략으로 이어질 수 있습니다. 이러한 분자적 변화를 모니터링하는 것은 내시경 평가만으로는 질병 상태를 평가하는 것보다 더 민감한 접근 방식을 제공할 수 있습니다.
- 장-전신 건강 연결: 건강한 IEC의 강력한 대사 특징과 전신 질환과의 중첩은 전반적인 건강에서 장의 중심 역할을 재확인합니다. IEC 대사를 표적으로 하는 개입은 장 건강뿐만 아니라 전신 질환에도 잠재적으로 이점을 줄 수 있습니다.
15. Gene Set Enrichment Analysis (GSEA) of Colon Cell Types Across Health and Inflammatory States
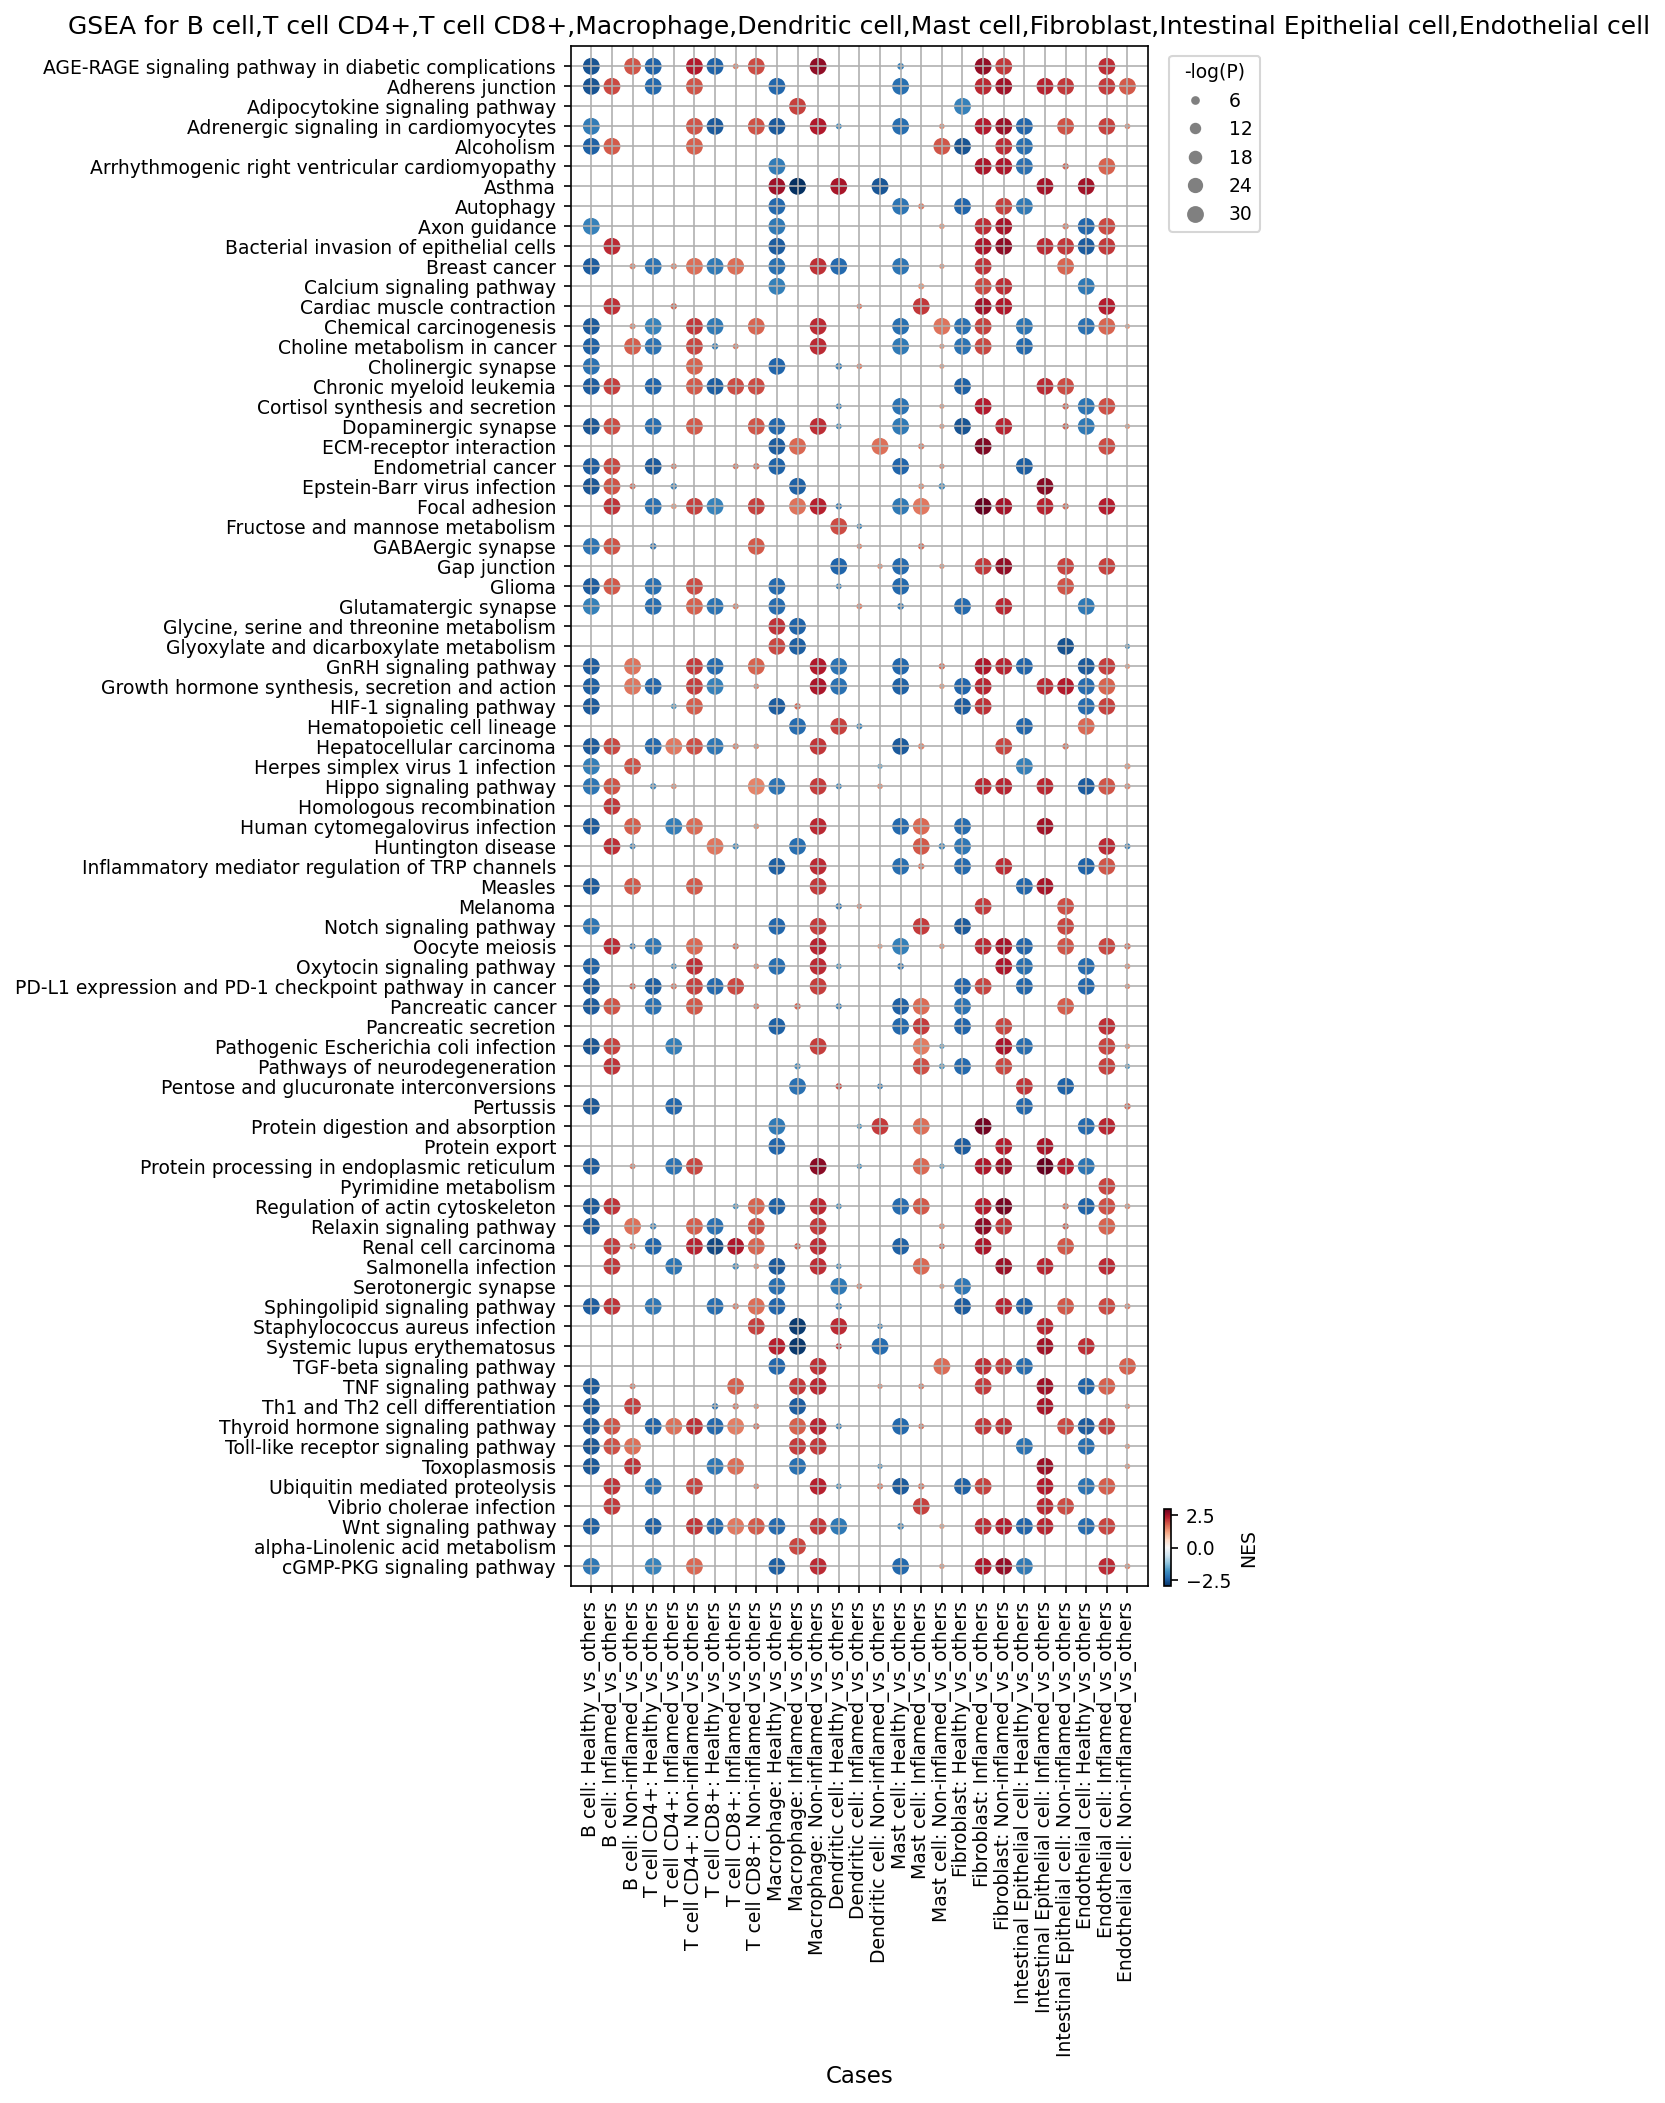
[Analysis Visualization Results]...
Analysis Overview
This analysis presents Gene Set Enrichment Analysis (GSEA) results across various major cell types of the human colon, comparing gene expression profiles in "Inflamed," "Non-inflamed," and "Healthy" conditions against "all other" conditions (i.e., condition-vs-rest). The dot plot visualizes the Normalized Enrichment Score (NES) for 80 key pathways across different cell type-condition combinations. Dot color indicates the NES (red for positive/upregulated, blue for negative/downregulated), and dot size reflects the statistical significance (-log(p-val)). This approach helps identify cell-type-specific and condition-specific pathway activations or inhibitions.
The targeted cell types for this analysis are: B cells, T cells CD4+, T cells CD8+, Macrophages, Dendritic cells, Mast cells, Fibroblasts, Intestinal Epithelial cells, and Endothelial cells.
Visual Summary
The dot plot clearly shows distinct patterns of pathway enrichment across different cell types and conditions.
- Inflamed Condition: The "Inflamed_vs_others" columns for almost all cell types show a predominant pattern of bright red, large dots. This indicates a widespread and highly significant upregulation of numerous pathways, particularly those related to inflammation, immune response, and tissue remodeling.
- Healthy Condition: The "Healthy_vs_others" columns generally display blue or lighter-colored, smaller dots, suggesting a downregulation of many inflammatory pathways and fewer significantly enriched pathways overall, consistent with a quiescent or homeostatic state.
- Non-inflamed Condition: The "Non-inflamed_vs_others" columns show a mixed pattern. While often resembling "Healthy_vs_others" with blue dots or less intense enrichment, certain pathways, especially in structural cells like Fibroblasts and Endothelial cells, exhibit moderate red dots, indicating some ongoing activity or a sub-clinical altered state compared to truly healthy tissue.
Key Pathway Observations:
- Immune and Inflammatory Pathways: TNF signaling pathway, Toll-like receptor signaling pathway, Th1 and Th2 cell differentiation, and PD-L1 expression and PD-1 checkpoint pathway in cancer are strongly and consistently upregulated (bright red, large dots) across almost all immune cell types (B cells, T cells CD4+, T cells CD8+, Macrophages, Dendritic cells, Mast cells) in the "Inflamed_vs_others" condition. These pathways are also activated in Intestinal Epithelial cells and Endothelial cells during inflammation.
- Pathogen Response Pathways: Bacterial invasion of epithelial cells, Staphylococcus aureus infection, and Salmonella infection pathways are notably upregulated in Macrophages, Dendritic cells, and Intestinal Epithelial cells in the "Inflamed_vs_others" state, suggesting a response to microbial challenges.
- Tissue Remodeling and Adhesion: ECM-receptor interaction, Focal adhesion, and Regulation of actin cytoskeleton are significantly upregulated in Fibroblasts, Intestinal Epithelial cells, and Endothelial cells, particularly in the "Inflamed_vs_others" condition, pointing to extensive changes in cell-matrix interactions and cell morphology essential for repair or fibrosis.
- Other Signaling Pathways: Wnt signaling pathway, Hippo signaling pathway, and TGF-beta signaling pathway show upregulation in Fibroblasts and Endothelial cells during inflammation, indicating active participation in tissue repair, stem cell maintenance, and immune modulation.
- Metabolic Shifts: Fructose and mannose metabolism and Glycine, serine and threonine metabolism are downregulated in Inflamed Intestinal Epithelial cells but often upregulated in Healthy Intestinal Epithelial cells, suggesting altered metabolic states during inflammation.
Biological Interpretation
The GSEA results provide strong biological insights into the molecular mechanisms underlying colon inflammation at a single-cell level.
- Orchestrated Inflammatory Response: The widespread activation of TNF signaling pathway and Toll-like receptor signaling pathway across diverse immune and non-immune cells in the "Inflamed" condition underscores their central role in initiating and propagating inflammation in the colon. TNF signaling is a master regulator of inflammation and immune responses PubMed Search: TNF signaling pathway. Toll-like receptors are critical pattern recognition receptors that sense microbial components and initiate innate immune responses PubMed Search: Toll-like receptor signaling.
- Adaptive Immune Cell Activation: T cells (CD4+ and CD8+) show strong enrichment for Th1 and Th2 cell differentiation in the inflamed state. This reflects the activation and polarization of helper and cytotoxic T lymphocytes, critical for adaptive immunity in the gut PubMed Search: Th1 Th2 differentiation colon. PD-L1 expression and PD-1 checkpoint pathway upregulation in T cells, B cells, macrophages, and dendritic cells points to a robust immune response that may also be encountering regulatory feedback mechanisms, potentially leading to immune exhaustion in chronic inflammation or attempt to limit tissue damage.
- Macrophages and Dendritic Cells as Front-Line Responders: The strong enrichment of pathogen response pathways (Bacterial invasion of epithelial cells, Staphylococcus aureus infection, Salmonella infection) in macrophages and dendritic cells in the "Inflamed" state highlights their critical role in sensing and responding to microbial dysbiosis or pathogen invasion often associated with colon inflammation. Macrophages also show upregulation of HIF-1 signaling pathway, which is involved in adaptation to hypoxia and immune responses in inflammatory settings.
- Fibroblasts and Endothelial Cells in Tissue Remodeling: The consistent upregulation of ECM-receptor interaction, Focal adhesion, Regulation of actin cytoskeleton, and growth/repair-related signaling (Wnt, Hippo, TGF-beta) in fibroblasts and endothelial cells during inflammation indicates their active participation in tissue restructuring, angiogenesis, and wound healing, which can sometimes lead to fibrosis in chronic inflammatory conditions like Inflammatory Bowel Disease (IBD) PubMed Search: Fibroblast TGF-beta IBD fibrosis.
- Intestinal Epithelial Cell Dysfunction: Upregulation of Bacterial invasion of epithelial cells and Staphylococcus aureus infection pathways in Intestinal Epithelial cells suggests compromised barrier function and increased susceptibility to microbial interactions. The downregulation of metabolic pathways in inflamed epithelial cells might indicate a shift in energy utilization or impaired normal physiological functions, as epithelial cells are crucial for nutrient absorption and barrier integrity.
Clinical or Translational Implications
These GSEA results offer several potential clinical and translational implications for colon inflammatory conditions:
- Biomarkers of Inflammation: The identified activated pathways and the specific cell types exhibiting these changes could serve as highly specific biomarkers for diagnosing active inflammation, assessing disease severity, or monitoring treatment response. For instance, high activity of TNF signaling or Toll-like receptor signaling across multiple cell types in biopsies could indicate severe inflammation.
- Therapeutic Targets: Pathways consistently upregulated in the inflamed state, such as TNF signaling or components of Toll-like receptor signaling, represent validated or potential therapeutic targets. The broad involvement of PD-L1 expression and PD-1 checkpoint pathway suggests that immune checkpoint modulators, currently used in oncology, might have a role in regulating chronic colon inflammation, albeit with careful consideration of potential side effects.
- Understanding Disease Pathogenesis: The cell-type-specific pathway activities provide a granular view of how different cell populations contribute to the overall inflammatory milieu. For example, understanding how fibroblasts drive ECM remodeling via TGF-beta and Wnt signaling could inform strategies to prevent or reverse fibrosis in chronic colon diseases.
- Metabolic Intervention: The observed metabolic shifts in Intestinal Epithelial cells suggest that targeting these metabolic pathways could be a novel therapeutic avenue to restore epithelial barrier function and support tissue healing during inflammation.
16. Discussion
The single-cell analysis of human colon tissue provides a high-resolution view of the cellular and molecular landscape in health and disease. A striking observation is the profound immune dysregulation occurring not only in overtly inflamed tissue but also significantly in macroscopically non-inflamed regions of diseased individuals. This 'non-inflamed' state often harbors a molecular signature akin to active inflammation, characterized by elevated proportions of pro-inflammatory T cell subsets (Th17, ILC3(+)) and a shift towards an M1-like macrophage polarization (increased M1, decreased M2A/M2D, increased M2B). This suggests that clinically 'normal' tissue in diseased patients is far from immunologically quiescent, potentially explaining disease chronicity and relapse.
Cell-cell interaction analysis further elucidates the complex interplay in inflammation. The inflamed colon exhibits a dramatic amplification of pro-inflammatory signaling, notably through the SPP1-CD44 axis, IFN-gamma pathway, and specific integrin-mediated adhesion. A key finding is the distinct shift in prostaglandin E2 synthesis, with PTGES3-driven PGE2 interactions being highly significant in inflammation compared to PTGES2 in healthy tissue. This highlights a switch in eicosanoid metabolism that likely fuels the inflammatory cascade. Fibroblasts, previously considered passive bystanders, emerge as active participants, upregulating MHC class II molecules and growth factor receptors like AXL and FGFR1, suggesting a direct role in immune modulation and driving fibrotic remodeling. Epithelial cells, crucial for barrier function, show heightened stress responses and altered metabolism in inflamed states, coupled with an increased susceptibility to bacterial invasion pathways.
Furthermore, activated CD4 T cells in inflamed tissue display co-expression of both activating (TNFRSF18/GITR) and inhibitory (TIGIT, CTLA4) immune checkpoint receptors. This complex interplay suggests an activated T cell state alongside concurrent regulatory mechanisms, potentially indicative of T cell exhaustion or a compensatory attempt to limit tissue damage in chronic inflammation. Overall, the data portray colon inflammation as a multi-cellular pathology involving highly coordinated, condition-specific changes in cell composition, activation states, and communication networks across immune, epithelial, and stromal compartments.
Hypotheses:
- The persistent inflammatory signature in macroscopically non-inflamed colon tissue (increased Th17/ILC3(+), M1-like macrophages, and specific CCIs) primes the tissue for disease relapse and contributes to chronic inflammation, even in the absence of overt clinical symptoms.
- The shift in prostaglandin E2 synthesis from PTGES2-driven in healthy tissue to PTGES3-driven in inflamed tissue is a critical metabolic switch that perpetuates inflammation by modulating local immune and stromal cell functions.
- Activated fibroblasts in the inflamed colon, characterized by increased expression of AXL, FGFR1, and MHC Class II molecules, directly contribute to both immune modulation and fibrotic remodeling, exacerbating disease pathology.
- The co-expression of activating (GITR) and inhibitory (TIGIT, CTLA4) receptors on CD4 T cells in inflamed colon represents a state of functional exhaustion or tightly controlled immune response, which, if dysregulated, can impact disease progression.
Potential therapeutic targets:
- PTGES3 / PGE2 receptors (PTGER2/PTGER4): Shift from PTGES2-driven PGE2 in healthy tissue to PTGES3-driven PGE2 in inflammation suggests PTGES3 as a key enzyme fueling inflammatory responses. PGE2, through its receptors, plays diverse roles in inflammation, pain, and tissue repair. Evidence: GSA (Section 14) and CCI (Section 10) analyses show PTGES3-derived PGE2 pathways are highly active and significantly enriched in inflamed colon, contrasting with healthy tissue. Validation: Test PTGES3-specific inhibitors or antagonists of PTGER2/4 in colon organoids or animal models of colitis to assess effects on inflammatory cytokine production, immune cell infiltration, and mucosal healing.
- AXL Receptor Tyrosine Kinase: Upregulation of AXL on inflamed fibroblasts indicates its potential role in driving fibroblast proliferation, survival, and pro-fibrotic activities, key to chronic inflammation and fibrosis. Evidence: Fibroblast condition-specific surfaceome markers (Section 12) show AXL to be highly expressed in inflamed colon fibroblasts, with low expression in healthy/non-inflamed states. Validation: Use AXL inhibitors (e.g., currently in cancer trials) in ex vivo colon tissue cultures or in vivo colitis models to assess impact on fibroblast activation, collagen deposition, and inflammation.
- SPP1 (Osteopontin) / CD44 axis: This axis is strongly activated in inflammation, mediating immune cell recruitment, adhesion, and tissue remodeling, crucial for chronic inflammatory pathology. Evidence: Cell-cell interaction analysis (Sections 9, 10) shows SPP1-CD44 interactions are dramatically amplified and widespread across immune and stromal cells in inflamed colon. Validation: Test neutralizing antibodies against SPP1 or CD44, or small molecule inhibitors of their interaction, in in vitro immune cell migration/adhesion assays and in vivo colitis models to evaluate effects on immune cell infiltration and disease severity.
- TIGIT / CTLA4 (Immune checkpoints on CD4 T cells): Upregulation of these inhibitory checkpoints on activated CD4 T cells in inflamed colon indicates an active immune response that is potentially being regulated or driven towards exhaustion. Modulating these pathways could fine-tune T cell responses. Evidence: CD4 T cell condition-specific surfaceome markers (Section 13) show TIGIT and CTLA4 are strongly expressed in inflamed CD4 T cells. GSEA (Section 15) also highlights PD-L1/PD-1 checkpoint pathway upregulation in various immune cells. Validation: Evaluate the therapeutic potential of TIGIT or CTLA4 blocking antibodies (alone or in combination) in pre-clinical models of colitis, carefully monitoring T cell activation, cytokine profiles, and tissue damage, given the complex dual role of these pathways in chronic inflammation and potential for exacerbation.
Follow-up validation ideas:
- Flow Cytometry/Immunohistochemistry: Validate the altered cell population proportions (e.g., Th17, Treg, M1/M2 subsets) and surface marker expression (e.g., AXL, ITGAV on fibroblasts; TIGIT, GITR on CD4 T cells) in independent patient cohorts using flow cytometry on dissociated tissue or immunohistochemistry/immunofluorescence on tissue sections.
- Spatial Transcriptomics/Proteomics: Investigate the spatial localization and interactions of key immune and stromal cells, and the expression of identified ligand-receptor pairs (e.g., SPP1-CD44, PTGES3/PGE2 receptors, integrins) using spatial transcriptomics or high-resolution multiplex immunofluorescence/mass cytometry imaging to confirm co-localization and functional relevance.
- In Vitro/Ex Vivo Perturbation Assays: Perform co-culture experiments with isolated colon cell types (e.g., fibroblasts, macrophages, T cells) and perturb specific pathways (e.g., PTGES3 inhibitors, AXL/FGFR1 blockers, anti-SPP1/CD44 antibodies, immune checkpoint modulators) to assess their impact on cell activation, proliferation, cytokine production, and migration.
- Organoid/Animal Models: Utilize human colon organoid models or established animal models of colitis to test the functional consequences of genetically ablating or pharmacologically targeting identified therapeutic candidates (e.g., PTGES3, AXL, SPP1, TIGIT) on inflammation severity, tissue repair, and fibrosis development.
- Targeted Metabolomics: Investigate the local prostaglandin E2 metabolite profiles in healthy, non-inflamed, and inflamed colon tissues to confirm the shift in PTGES2 vs. PTGES3 activity.
Limitations:
This study provides a snapshot of cellular and molecular states at a single time point, limiting inferences about disease progression or causality. While the 'Non-inflamed' condition offers insights into subclinical changes, its heterogeneity suggests a spectrum of disease activity requiring further characterization. The reliance on marker gene expression for cell type annotation, while robust, may not fully capture all rare or transient cell states. Finally, validation of proposed therapeutic targets and mechanistic hypotheses requires functional experiments beyond correlative transcriptomic observations.
17. Query List
- Show UMAP including condition, sample, major cell type, minor cell type, and celltype_subset in 2 columns and save it.
- Show major celltype score on UMAP and save it.
- Show the overall Celltype_subset marker expression dot plot and save it. Keep target_cell as None and keep the other arguments at their default values.
- Show population bar plot of minor cell types and save it.
- Show subset population bar plot for T cells and save it.
- If there are statistically significant differences between conditions in T cell subset populations, show them as box plots and save them. Set ncols appropriately considering the total number of panels.
- Show subset population bar plot for macrophages and save it.
- If there are statistically significant differences between conditions in macrophage subset populations, show them as box plots and save them. Set ncols appropriately considering the total number of panels.
- Show cell-cell interactions by condition and save the result. Select at most 80 cell-cell interactions for each condition.
- Find statistically significant differences in cell-cell interactions between conditions for major immune cells and stromal cells and show them as a dot plot and save it. Set max_n_items_per_group = 25.
- Extract condition-specific markers for macrophages and show them as a dot plot and save it. Show only surfaceome markers, up to 50 per condition.
- Extract condition-specific markers for fibroblasts and show them as a dot plot and save it. Show only surfaceome markers, up to 50 per condition.
- Extract condition-specific markers for CD4 T cells and show them as a dot plot and save it. Show only surfaceome markers, up to 50 per condition.
- Show Gene Ontology (GSA) analysis results for epithelial cells as bar plots and save the result.
- Show dot plot of Gene set enrichment analysis results for major cell types and save it. Set color map to RdBu_r and n_pws_to_show = 80.