Single-Cell Transcriptomic and Genomic Landscape of Renal Cell Carcinoma: Insights into Tumor Microenvironment and Therapeutic Vulnerabilities
This comprehensive single-cell analysis of kidney tissue reveals the distinct cellular and molecular landscape of Renal Cell Carcinoma (RCC). Tumor cells, identified as aneuploid Renal Epithelial cells, exhibit significant metabolic reprogramming and activated oncogenic pathways. The tumor microenvironment is characterized by substantial shifts in immune cell populations, particularly an increase in immunosuppressive macrophages and regulatory T cells, alongside extensive remodeling of the extracellular matrix and active angiogenesis. These findings highlight critical cell-cell communication pathways and specific surface markers that represent potential diagnostic and therapeutic targets for RCC.
Contents
- Dataset overview
- UMAP Visualization of Sample Metadata and Cell Annotations
- Major Cell Type Scores and Ploidy on UMAP
- Marker Expression Profile Across Kidney Cell Subsets
- Analysis of Copy Number Variations in Renal Epithelial Cells
- CNV-Informed UMAP Embedding of Kidney Cells by Cell Type, Ploidy, Condition, and Sample
- Minor Cell Type Population Analysis in Renal Cell Carcinoma Samples
- Population Analysis of T Cell Subsets in Kidney Tissue (Normal vs. Tumor)
- Analysis of Regulatory T cell (Treg) Proportions in Renal Cell Carcinoma
- Macrophage Subset Population Analysis in Renal Cell Carcinoma
- Differential Abundance of Macrophage M2C Subset in Renal Cell Carcinoma
- Ploidy Analysis of Renal Epithelial Cells in Normal and Tumor Conditions
- Cell-Cell Interaction Patterns in Renal Cell Carcinoma Tumor Microenvironment
- Cell-Cell Interaction Analysis of Immune Checkpoint and Cell Cycle Genes in Renal Cell Carcinoma
- Condition-Specific Cell-Cell Interaction Patterns in Renal Cell Carcinoma
- Renal Epithelial Cell Condition-Specific Surfaceome Markers in Kidney Tumor
- Macrophage Condition-Specific Surfaceome Markers in Renal Cell Carcinoma
- T cell CD4+ Condition-Specific Surfaceome Markers in Renal Cell Carcinoma
- Differential Expression Trends of Cell Cycle Pathway Genes in Renal Epithelial Cells
- Gene Ontology (GSA) Analysis for Renal Epithelial Cells in Kidney Tissue
- Gene Set Enrichment Analysis (GSEA) Across Renal Cell Carcinoma Cell Types
- Discussion
- Query List
0. Dataset overview
데이터셋 요약
- 이 데이터는 26502개의 세포와 22483개의 유전자로 구성된 단일 세포 RNA-seq AnnData입니다.
- 인간 신장 조직에서 유래했으며, 'tumor'와 'normal' 두 가지 조건이 포함되어 있습니다.
- 세포 타입은 'celltype_major', 'celltype_minor', 'celltype_subset' 세 가지 수준으로 계층적으로 분류되어 있습니다.
- 'Renal Epithelial cell'이 종양 기원 세포로 분석되었습니다.
- 세포의 약 38.9%가 이수성(Aneuploid)으로 확인되었으며, CNV(Copy Number Variation) 추정치도 사용 가능합니다.
- 사전 계산된 결과로는 세포-세포 상호작용(CCI), 차등 발현 유전자(DEG), 유전자 세트 농축 분석(GSEA), GO(Gene Ontology) 분석 결과가 포함되어 있습니다.
- DEG, GSEA, GSA/GO 분석은 'Endothelial cell', 'Macrophage', 'Renal Epithelial cell', 'Smooth muscle cell', 'T cell CD4+', 'T cell CD8+' 세포 타입에 대해 수행되었습니다.
1. UMAP Visualization of Sample Metadata and Cell Annotations
[Analysis Visualization Results]...
Analysis Overview
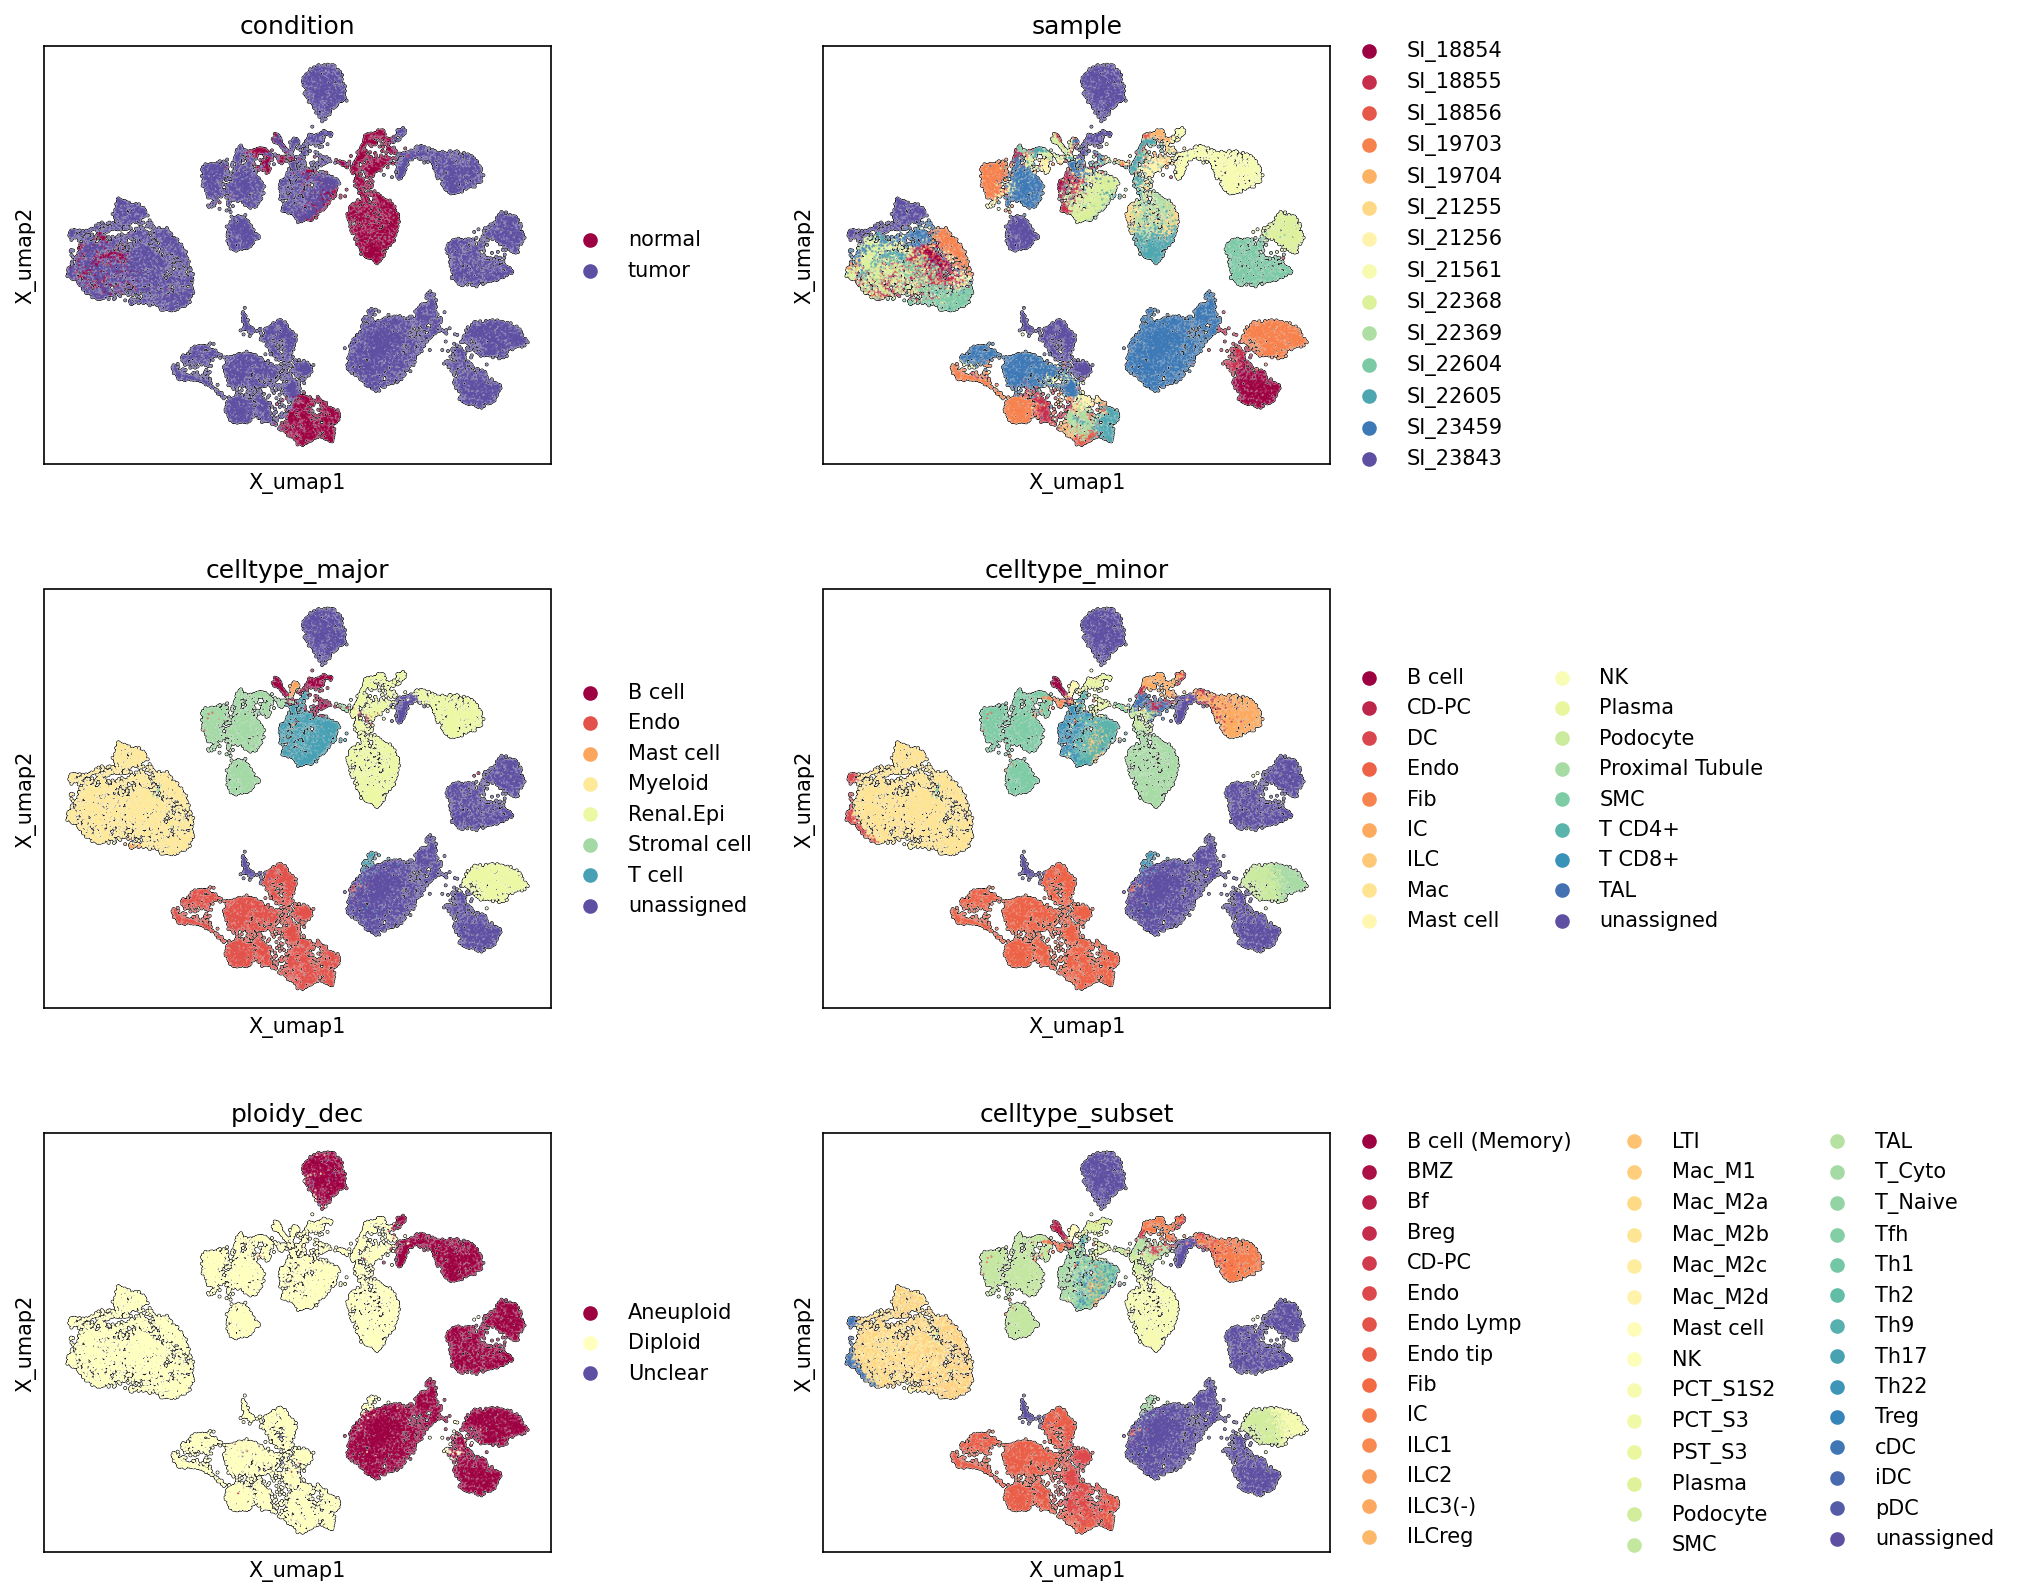
This analysis presents a series of UMAP (Uniform Manifold Approximation and Projection) visualizations, depicting the relationships between individual cells based on their gene expression profiles. Each plot is colored by a different metadata attribute: experimental condition (tumor/normal), originating sample, major cell type, minor cell type, ploidy status, and cell type subsets. This comprehensive visualization allows for an assessment of dataset structure, the quality of cell annotations, and the distribution of biological variables across the single-cell landscape.
Visual Summary
Condition-based UMAP
The UMAP colored by condition shows a clear separation between tumor (purple) and normal (maroon) cells. Tumor cells largely occupy a distinct, interconnected region of the embedding space, while normal cells are primarily localized to separate, somewhat dispersed clusters. There are some areas of overlap or interface, indicating a mixture of cell types or regions where tumor and normal microenvironments might interact.
Sample-based UMAP
The sample UMAP reveals that cells from different samples are generally well-interspersed across the embedding, suggesting that the primary clustering is driven by biological variation rather than strong batch effects related to individual samples. While some clusters might show enrichment for specific samples, there is no single sample dominating entire large regions, which indicates good integration of the various samples.
Cell Type Hierarchy UMAPs (celltype_major, celltype_minor, celltype_subset)
These UMAPs progressively demonstrate the hierarchical organization of cell types from broad categories to fine-grained subsets:
- celltype_major: Distinct clusters are observed for major cell populations such as Renal Epithelial cell (light green), T cell (light blue), and Myeloid cell (orange). Renal Epithelial cell forms a prominent, large cluster that significantly overlaps with the tumor region identified in the condition UMAP.
- celltype_minor: Provides higher resolution within the major cell types. For example, T cell differentiates into T cell CD4+ and T cell CD8+, and Myeloid cell shows Macrophage and Dendritic cell populations. Kidney-specific epithelial cells like Proximal Tubule and Collecting Duct Principal cell are also clearly demarcated, often within the larger Renal Epithelial cell major cluster.
- celltype_subset: Further refines annotations, revealing numerous specialized subtypes like Macrophage (M1), T cell (Cytotoxic), T cell (Treg), and various epithelial segments such as Proximal Convoluted Tubule S1_S2 and Thick Ascending Limb. These subsets maintain coherent clustering, indicating robust and granular cell type identification.
Ploidy Status UMAP (ploidy_dec)
The ploidy_dec UMAP shows a striking pattern: Aneuploid cells (maroon) largely co-localize with the tumor clusters and, notably, with the large Renal Epithelial cell cluster. Conversely, Diploid cells (light yellow) predominantly occupy regions associated with normal conditions and non-epithelial cell types. Unclear cells (dark purple) are very few and scattered, suggesting a high confidence in ploidy assignments for most cells.
Biological Interpretation
The UMAP visualizations provide crucial insights into the cellular landscape of the kidney in the context of disease:
- Tumor vs. Normal Separation: The clear segregation of tumor and normal cells indicates distinct transcriptional states associated with the disease. This separation is a foundational observation, confirming the presence of a disease-specific cell population and microenvironment.
- Tumor Cell Identity and Ploidy: The Renal Epithelial cell population, which is the resolved tumor-origin cell type in renal cell carcinoma, significantly overlaps with the tumor clusters. Furthermore, these tumor-associated regions are heavily enriched with Aneuploid cells. This strong co-localization of tumor condition, renal epithelial identity, and aneuploidy provides compelling evidence for the malignant nature of these cells, consistent with the characteristics of renal cell carcinoma. The high proportion of aneuploid cells (38.9% of total cells) further supports the presence of a cancerous state.
- Cellular Heterogeneity in the Microenvironment: Beyond the malignant epithelial cells, the UMAPs reveal a complex tumor microenvironment comprising various immune cells (e.g., T cell CD4+, T cell CD8+, Macrophage subtypes, B cell subtypes) and stromal cells (Fibroblast, Endothelial cell, Smooth muscle cell). The distinct clustering of these populations highlights the diverse cellular composition within both normal kidney tissue and the tumor microenvironment, which is critical for understanding tumor progression and potential therapeutic targets.
- Annotation Quality: The consistently well-separated and biologically intuitive clustering patterns across different levels of cell type annotation (major, minor, subset) indicate high-quality cell type assignments, enabling reliable downstream analyses.
Annotation Notes
- The UMAPs demonstrate that the various metadata annotations are largely consistent and biologically meaningful, with distinct cell populations occupying coherent regions in the embedding space.
- The robust separation of condition and ploidy_dec aligned with specific celltype_major populations (e.g., Renal Epithelial cell) reinforces the accuracy of these labels.
- The minimal evidence of strong sample-specific batch effects suggests that the biological variation is the primary driver of the observed cell clustering, making the dataset suitable for cross-sample comparisons.
- The unassigned cell populations (visible in celltype_major and celltype_minor) are sparse and scattered, suggesting that the majority of cells have received confident assignments. Further investigation into these unassigned cells might be warranted depending on the analysis goals.
2. Major Cell Type Scores and Ploidy on UMAP
[Analysis Visualization Results]...
Analysis Overview
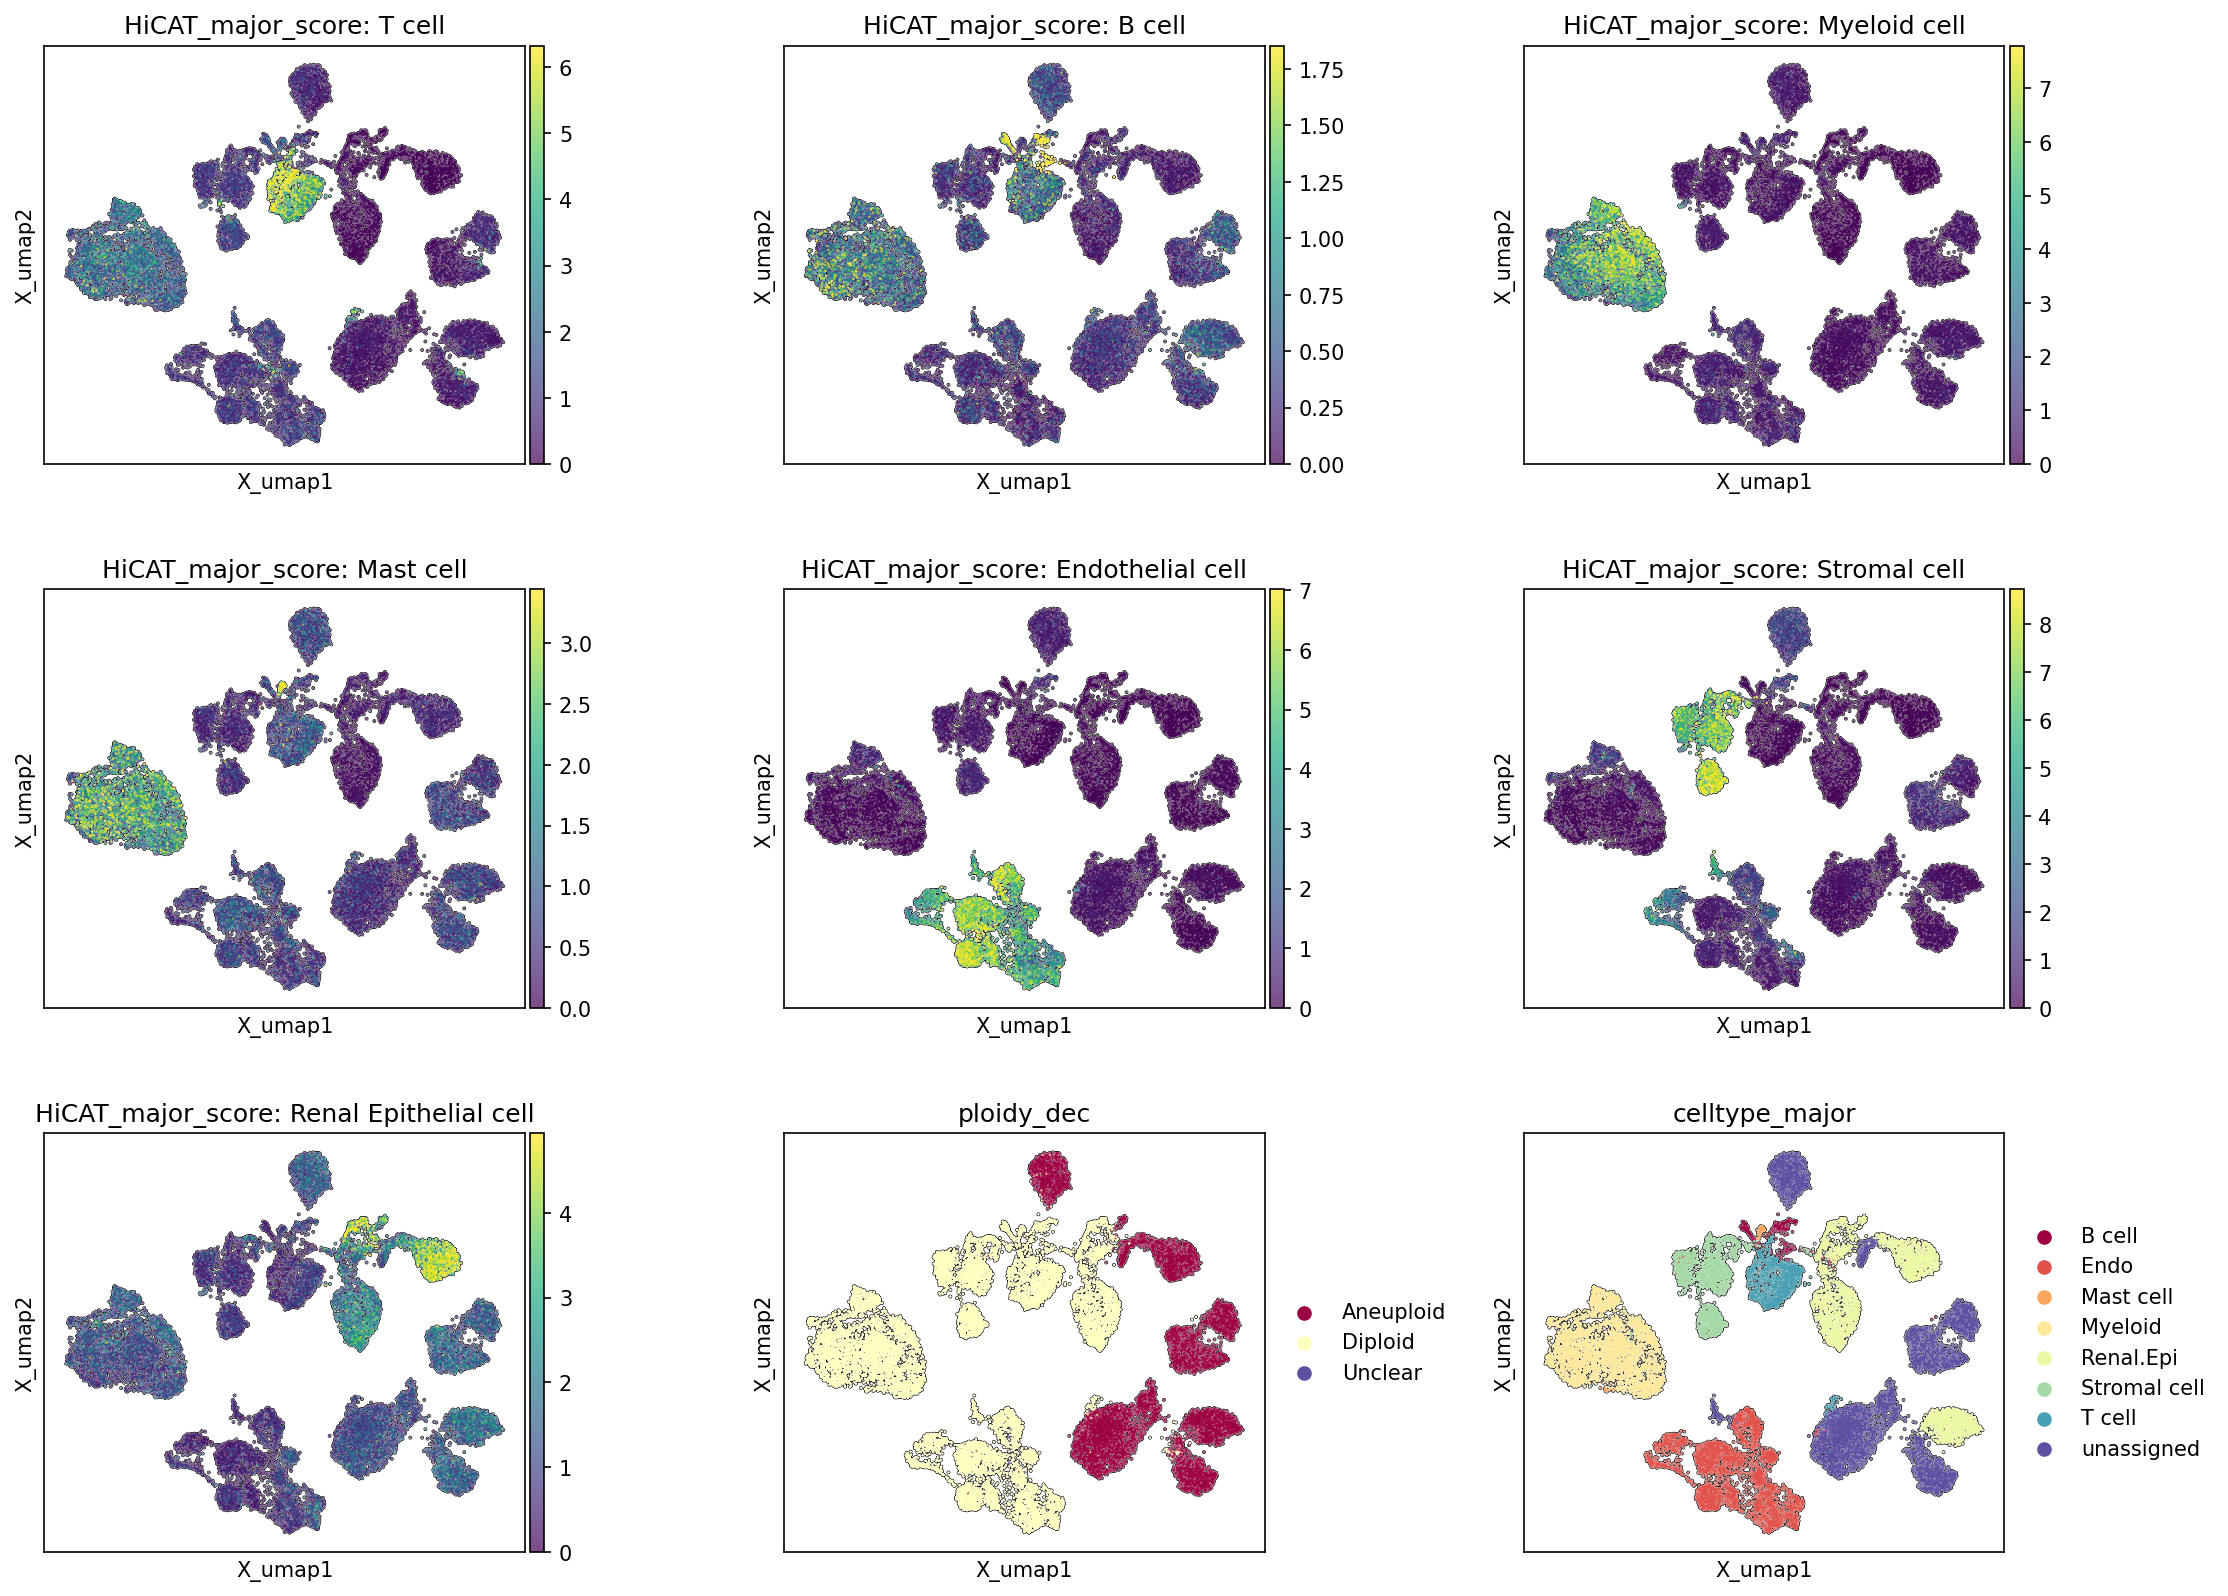
This analysis presents Uniform Manifold Approximation and Projection (UMAP) embeddings of single-cell RNA-seq data from kidney tissue, comparing 'tumor' and 'normal' conditions. The UMAP plots visualize the distribution of cells, colored by major cell type scoring (HiCAT_major_score), ploidy status (ploidy_dec), and the final major cell type annotations (celltype_major). This allows for assessing the consistency of cell type assignments and their relationship with chromosomal ploidy, particularly in the context of the inferred Renal Cell Carcinoma.
Visual Summary
The UMAP projection effectively separates cells into distinct clusters, reflecting their underlying transcriptional profiles.
HiCAT Major Cell Type Scores
- Each of the seven plots for HiCAT_major_score (T cell, B cell, Myeloid cell, Mast cell, Endothelial cell, Stromal cell, Renal Epithelial cell) shows a clear localization of high scores (indicated by yellow/green coloration) to specific regions of the UMAP. This indicates that the scoring system successfully identifies and localizes distinct cell populations.
- For instance, HiCAT_major_score: Renal Epithelial cell shows a strong signal concentrated in a large, prominent cluster. Similarly, immune cell types (T cell, B cell, Myeloid cell) and stromal/endothelial cells each have their own distinct regions of high scores, although some immune cell populations show more distributed signals across several smaller clusters.
Ploidy Status (ploidy_dec)
- The ploidy_dec plot reveals a clear segregation of cells based on their inferred ploidy. A large, distinct cluster of cells is predominantly labeled as Aneuploid (maroon).
- The remaining cell populations are largely identified as Diploid (yellow), forming several clusters separate from the aneuploid group. A very small fraction of cells are categorized as Unclear (blue).
Major Cell Type Annotation (celltype_major)
- The celltype_major plot provides the final, discrete cell type annotations. There is a strong congruence between the areas of high HiCAT_major_score for each cell type and the corresponding annotated celltype_major clusters.
- Crucially, the large Aneuploid cluster observed in the ploidy_dec plot perfectly aligns with the cluster annotated as Renal Epithelial cell in the celltype_major plot.
- The Diploid cells primarily encompass the immune cell types (T cell, B cell, Myeloid cell, Mast cell) and structural cells (Endothelial cell, Stromal cell), with a small unassigned population.
Biological Interpretation
The visualization provides strong evidence supporting the biological integrity of the dataset and the consistency of the cell type annotation pipeline.
- Robust Cell Type Identification: The clear segregation of cell populations by HiCAT_major_score and their excellent correspondence with the final celltype_major annotations confirm the accurate identification and clustering of major cell types within the kidney tissue. This indicates that the single-cell data accurately captures the distinct transcriptional profiles of these cell types.
- Identification of Tumor Cells: A critical finding is the strong co-localization of high Renal Epithelial cell scores, the Renal Epithelial cell annotation, and Aneuploid status within a single, prominent UMAP cluster. Given that the 'Resolved tumor-origin cell type' is Renal Epithelial cell and the dataset is from kidney tissue with 'tumor' conditions and a significant aneuploid fraction, this cluster represents the malignant tumor cell population (likely Renal Cell Carcinoma cells). Aneuploidy, the presence of an abnormal number of chromosomes, is a hallmark of many cancers, including renal cell carcinoma.
- Tumor Microenvironment and Normal Parenchyma: The remaining cell populations, primarily Diploid, consist of various immune cells (T cells, B cells, Myeloid cells, Mast cells) and stromal/endothelial cells. These cells represent components of the tumor microenvironment (e.g., tumor-infiltrating lymphocytes, tumor-associated macrophages) and/or normal kidney tissue, consistent with what would be expected in a kidney tumor sample. Their distinct separation from the aneuploid renal epithelial cells suggests clear boundaries between cancerous and non-cancerous cell compartments.
Annotation Notes
The consistency observed between the HiCAT_major_score plots, ploidy_dec, and celltype_major plots provides high confidence in the quality of the cell type annotations and the underlying dimensionality reduction. The distinct separation of aneuploid, tumor-origin renal epithelial cells from diploid, non-malignant cells is particularly well-resolved.
3. Marker Expression Profile Across Kidney Cell Subsets
[Analysis Visualization Results]...
Analysis Overview
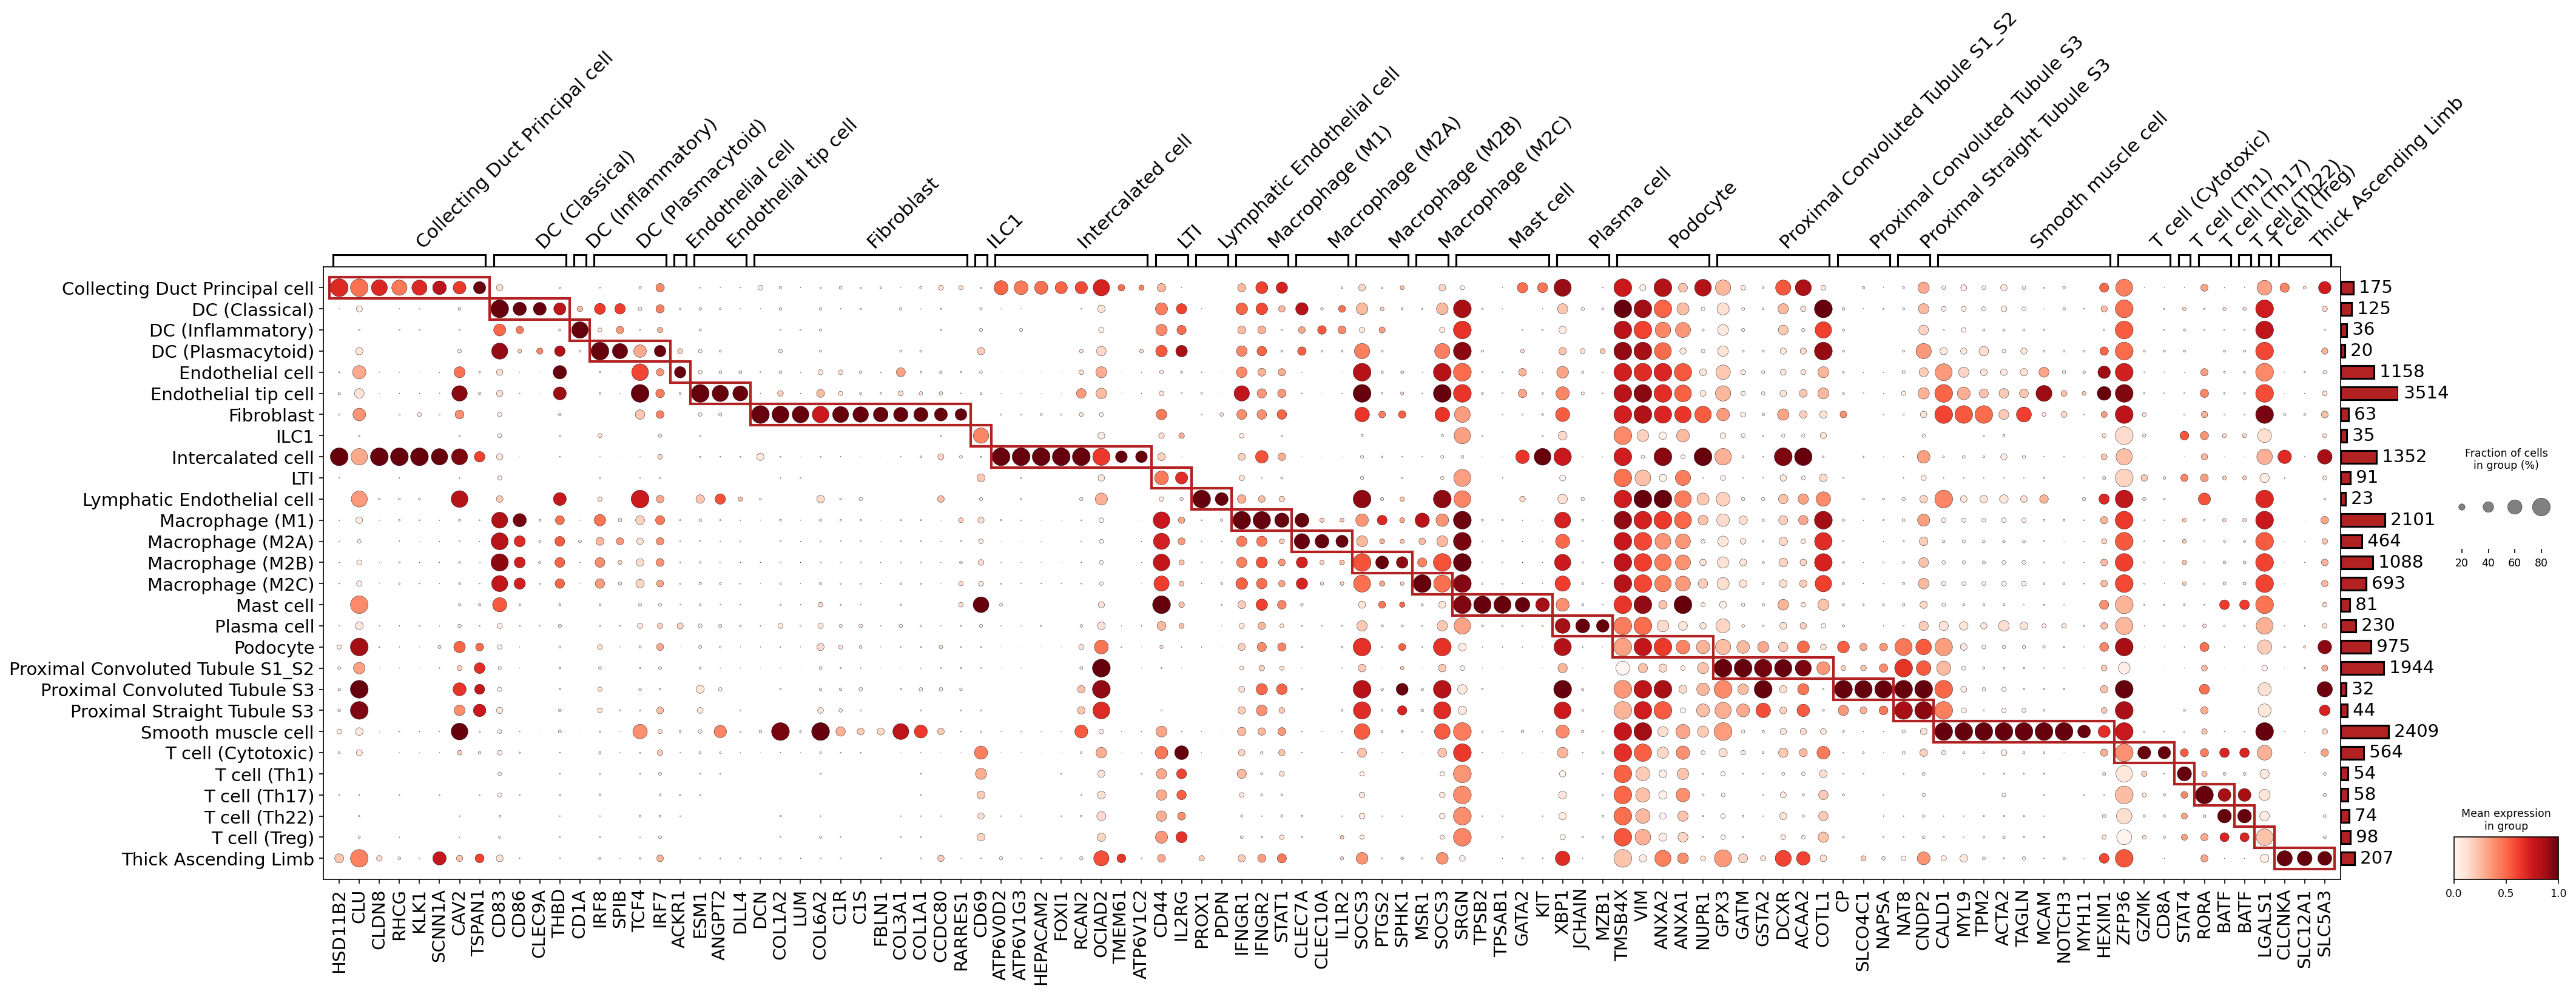
This dot plot visualizes the expression of marker genes across various celltype_subset populations identified in the single-cell RNA-seq dataset from kidney tissue. The purpose of this analysis is to evaluate the distinctiveness and consistency of the assigned cell type annotations based on the expression patterns of known and discovered marker genes. Each row represents a celltype_subset, and each column represents a marker gene. The size of each dot corresponds to the fraction of cells within that group expressing the gene, while the color intensity reflects the mean expression level of the gene in those cells. Red boxes highlight clusters of genes highly specific to particular cell subsets. The analysis was configured to identify and plot surfaceome-only markers, with a rotation of 45 degrees for gene labels for readability.
Visual Summary
The dot plot displays a clear diagonal pattern of strong and specific marker gene expression, indicated by larger, darker red dots. This pattern suggests that most celltype_subset annotations are well-supported by distinct transcriptional signatures.
- Dot Size and Color Intensity: The legend indicates that the size of the dot correlates with the percentage of cells in the group expressing a given gene, and the color intensity (from light red to dark red) represents the mean expression level of that gene within the group. Large, dark red dots signify high expression in a large fraction of cells within a specific subset.
- Marker Specificity: The prominent red boxes delineate groups of genes that are highly expressed and specific to individual cell subsets or closely related groups, confirming their unique identities.
- Gene Grouping: Marker genes are grouped along the x-axis, typically clustering genes that are characteristic of specific cell types, which aids in visual interpretation.
- celltype_subset Diversity: A wide array of celltype_subset annotations from both immune and renal epithelial lineages are represented, including various DC populations, endothelial cells, fibroblasts, immune cells (ILC1, Macrophages, Mast cells, Plasma cells, T cells), and different segments of renal tubules.
- Cell Counts per Group: The bar chart on the right side of the plot shows the number of cells belonging to each celltype_subset, providing context on the sample size for each group. Most groups have a substantial number of cells, with some smaller populations (e.g., DC (Plasmacytoid) with 20 cells, T cell (Th22) with 74 cells) still exhibiting clear marker expression.
- Readability: The var_group_rotation of 45 degrees for gene labels improves the readability of the numerous marker gene names.
Biological Interpretation
The marker expression patterns observed in the plot largely confirm the identity and annotation of the various celltype_subset populations, consistent with known kidney and immune cell biology.
Renal Epithelial Cells:
- Collecting Duct Principal cells: Show strong and specific expression of HSD11B2, SCNN1A, and CLDN8, which are key regulators of ion and water balance in the collecting duct.
- Intercalated cells: Identified by specific expression of vacuolar H+-ATPase subunits like ATP6V0D2 and ATP6V1G3, involved in acid-base homeostasis. [GeneCards ATP6V1G3: GeneCards]
- Podocytes: Show expression of CALD1 and MYL9, consistent with their contractile properties and structural roles in the glomerulus.
- Proximal Tubule subsets (Convoluted S1_S2, Straight S3, Convoluted S3): These highly related populations exhibit shared strong expression of SLC5A3 and CLCNKA, indicating their common function in reabsorption.
- Thick Ascending Limb: Characterized by robust expression of SLC12A1, the Na-K-2Cl cotransporter, a crucial marker for this segment.
Immune Cells:
- Dendritic Cells (DCs): Subtypes demonstrate distinct markers: CLEC9A and THBD for DC (Classical); CD83 and CD86 for DC (Inflammatory); and CD1A along with IRF7 for DC (Plasmacytoid), supporting their functional specialization.
- Macrophages: Different macrophage polarization states (M1, M2A, M2B, M2C, M2D) show overlapping but also subtype-specific markers. SPP1 and CD68 are generally present. MSR1 and CLEC10A are more prominent in M2A and M2D. SRGN is specific to M2B.
- Mast cells: Display exceptionally strong and specific expression of canonical mast cell markers such as KIT, TPSAB1, TPSB2, and GATA2. [GeneCards KIT: GeneCards]
- Plasma cells: Clearly identified by the expression of JCHAIN, XBP1, and MZB1, reflecting their role in antibody production.
- T cells: Various T cell subsets are well-differentiated: GZMK and CD8A for T cell (Cytotoxic); STAT4 for T cell (Th1); RORC and BATF for T cell (Th17); LGALS1 for T cell (Th22); and IL2RG (a component of the IL-2 receptor crucial for Treg function) for T cell (Treg). The absence of FOXP3 for Tregs is expected given the surfaceome_only parameter, as FOXP3 is an intracellular transcription factor.
- ILC1: Show distinct expression of IFNGR1 and IFNGR2, consistent with their interferon-gamma mediated immune functions.
Stromal and Endothelial Cells:
- Endothelial cells (General, Tip, Lymphatic): Express known pan-endothelial markers like CDH5 and PECAM1. Endothelial tip cells are distinguished by ESM1, ANGPT2, and DLL4, while Lymphatic Endothelial cells show specificity for PROX1 and PDPN.
- Fibroblasts: Exhibit robust expression of classic fibroblast markers such as DCN, COL1A1, COL3A1, COL6A2, LUM, and FBLN1, indicative of their extracellular matrix production role.
- Smooth muscle cells: Clearly identified by ACTA2, TAGLN, and MYH11, which are markers of contractile muscle elements.
The consistent and specific expression patterns of these markers across the different celltype_subset populations provide strong evidence for the accuracy and reliability of the cell type annotations derived from the single-cell RNA-seq data.
Annotation Notes
The marker expression dot plot effectively validates the celltype_subset annotations within the AnnData object. The clear, specific expression of known marker genes for each cell group, particularly those highlighted by the red boxes, indicates that the computational clustering and annotation process has successfully identified biologically meaningful and distinct cell populations. The surfaceome_only parameter for marker discovery is particularly useful as it prioritizes genes encoding cell surface proteins, which are critical for cell-cell interactions and can serve as targets for immunophenotyping or cell isolation. The overall quality of annotation appears high based on this marker analysis.
4. Analysis of Copy Number Variations in Renal Epithelial Cells
[Analysis Visualization Results]...
Analysis Overview
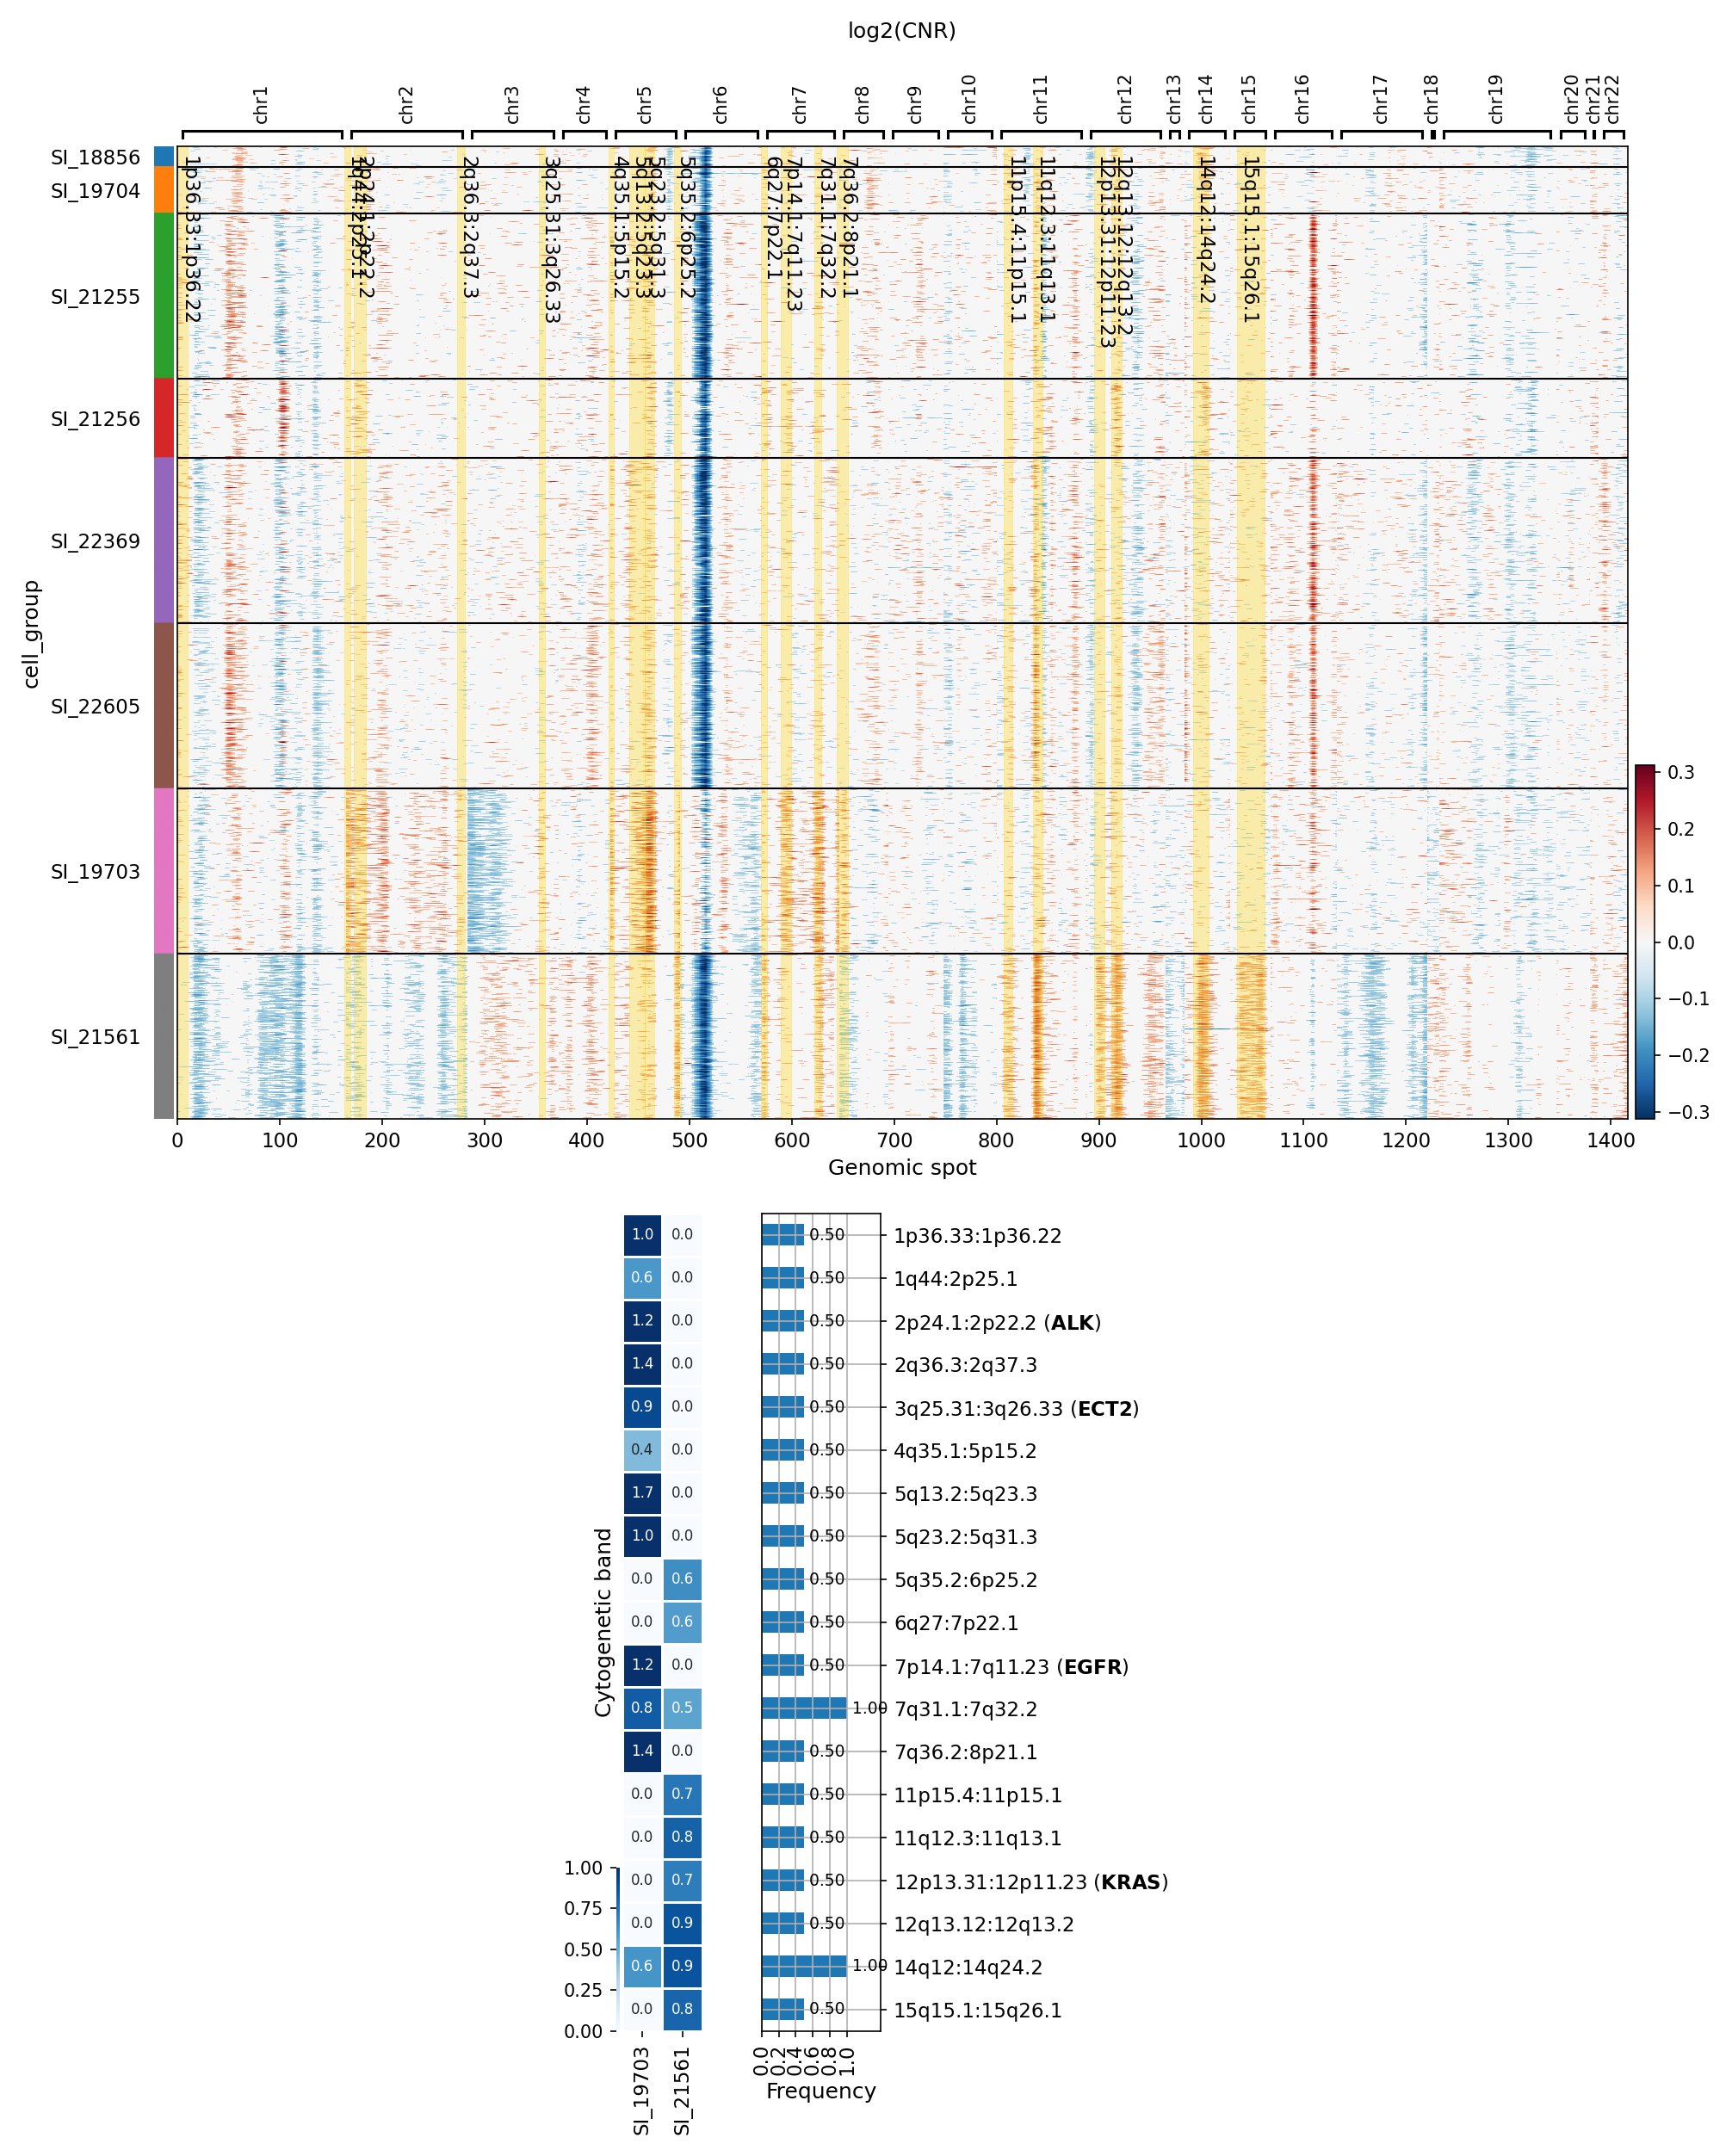
This analysis investigates copy number variations (CNVs) in Renal Epithelial cells, identified as the tumor-origin cell type, across different samples. A heatmap visualizes the log2(Copy Number Ratio) (log2(CNR)) across the genome for each sample, allowing for the identification of regions of amplification (red) and deletion (blue). An accompanying summary highlights specific cytogenetic bands exhibiting significant recurrent amplifications, including their average log2(CNR) values and frequency across relevant samples.
Visual Summary
CNV Heatmap
The main heatmap displays log2(CNR) values for Renal Epithelial cells, grouped by individual samples.
- Sample-Specific Patterns: A clear distinction in CNV burden is observed between samples. Samples SI_18856, SI_19704, SI_21255, SI_21256, SI_22369, and SI_22605 generally exhibit fewer widespread and less intense CNVs, with some sporadic deletions (blue) and minor amplifications. In contrast, samples SI_19703 and SI_21561 show extensive and strong amplifications (red) across numerous chromosomes, indicating a high degree of genomic instability.
- Genomic Regions of Interest: Several chromosomes show recurrent amplification events, particularly visible in SI_19703 and SI_21561. These include broad regions on chromosomes 7, 8, 12, 14, 15, and 16, among others. Specific cytogenetic bands corresponding to these amplifications are highlighted in yellow on the heatmap and are detailed in the summary plot.
Summary of Significantly Amplified Regions
The accompanying plots provide a focused summary of frequently amplified cytogenetic bands:
- Magnitude of Amplification: The left heatmap shows the average log2(CNR) for selected amplified regions in samples SI_19703 and SI_21561. Both samples exhibit substantial amplifications (log2(CNR) values typically ranging from 0.4 to 1.1) across multiple shared genomic loci. Notable amplifications include regions on chromosomes 1q44:2p25.1, 3q27.1:4p16.3, 5q23.1:5q31.3, 7q31.1:7q33, 11p15.4:11p15.1, 11q12.3:11q13.1, 12p13.31:12p11.21 (KRAS), 12q13.12:12q13.2, 14q13.2:14q24.2, 15q15.1:15q21.3, and 15q24.1:15q25.3.
- Recurrence Frequency: The bar plot on the right indicates that all these highlighted regions show an amplification frequency of 0.5. This suggests that these regions are significantly amplified in 50% of the samples contributing to this specific summary (which appear to be SI_19703 and SI_21561 based on the previous heatmap and summary visualization).
Biological Interpretation
The observed CNV patterns provide strong evidence of genomic instability within the Renal Epithelial cells of specific samples, consistent with the inferred context of Renal Cell Carcinoma.
- Tumor-Associated Aneuploidy: The extensive and high-magnitude amplifications in samples SI_19703 and SI_21561 in Renal Epithelial cells align with the dataset's observation of 38.9% aneuploid cells and the identification of Renal Epithelial cells as the tumor-origin cell type. This suggests that these samples represent tumor tissues with active malignant transformation and clonal expansion marked by significant genomic aberrations. The other samples might represent normal tissue, or tumor samples with less pronounced CNV burden, or different tumor microenvironment compositions.
- Recurrent Amplifications: The identification of recurrently amplified regions across multiple samples (SI_19703 and SI_21561) is a hallmark of cancer. These regions often harbor oncogenes or genes that provide a selective advantage to cancer cells.
- KRAS Amplification: The prominent amplification of the 12p13.31:12p11.21 region, explicitly labeled as encompassing KRAS, is particularly noteworthy. KRAS is a well-established oncogene in human cancers, and its amplification can drive cell proliferation, survival, and metastasis. KRAS amplification and mutations are common mechanisms of oncogene activation in various tumor types, including subsets of renal cancers. PubMed search for "KRAS amplification renal cell carcinoma"
- Other Potential Oncogenic Loci: Amplifications in regions like 1q, 3q, 5q, 7q, 11q/p, 12q, 14q, and 15q are frequently implicated in various cancers, including renal cell carcinoma. These regions may contain other oncogenes or genes involved in cell cycle regulation, signaling pathways, or tumor progression. For example, amplifications on chromosome 7q are often associated with growth factor receptors. GeneCards for KRAS
Clinical or Translational Implications
- Tumor Characterization: The distinct CNV profiles observed across samples underscore inter-patient genomic heterogeneity in Renal Cell Carcinoma. The high CNV burden in specific samples (SI_19703, SI_21561) strongly indicates aggressive disease or advanced tumor progression.
- Biomarker Potential: Recurrent CNVs, such as the amplification of KRAS and other consistent regions, could serve as potential diagnostic or prognostic biomarkers for specific subtypes of Renal Cell Carcinoma. Detecting these aberrations in tumor biopsies could aid in patient stratification.
- Therapeutic Relevance: While this analysis does not directly assess drug sensitivity, identification of oncogene amplifications like KRAS can indicate potential vulnerabilities that may be explored with targeted therapies. However, KRAS itself has historically been challenging to target directly, though new inhibitors are emerging. The presence of these genomic alterations suggests that these tumors may respond differently to standard treatments.
5. CNV-Informed UMAP Embedding of Kidney Cells by Cell Type, Ploidy, Condition, and Sample
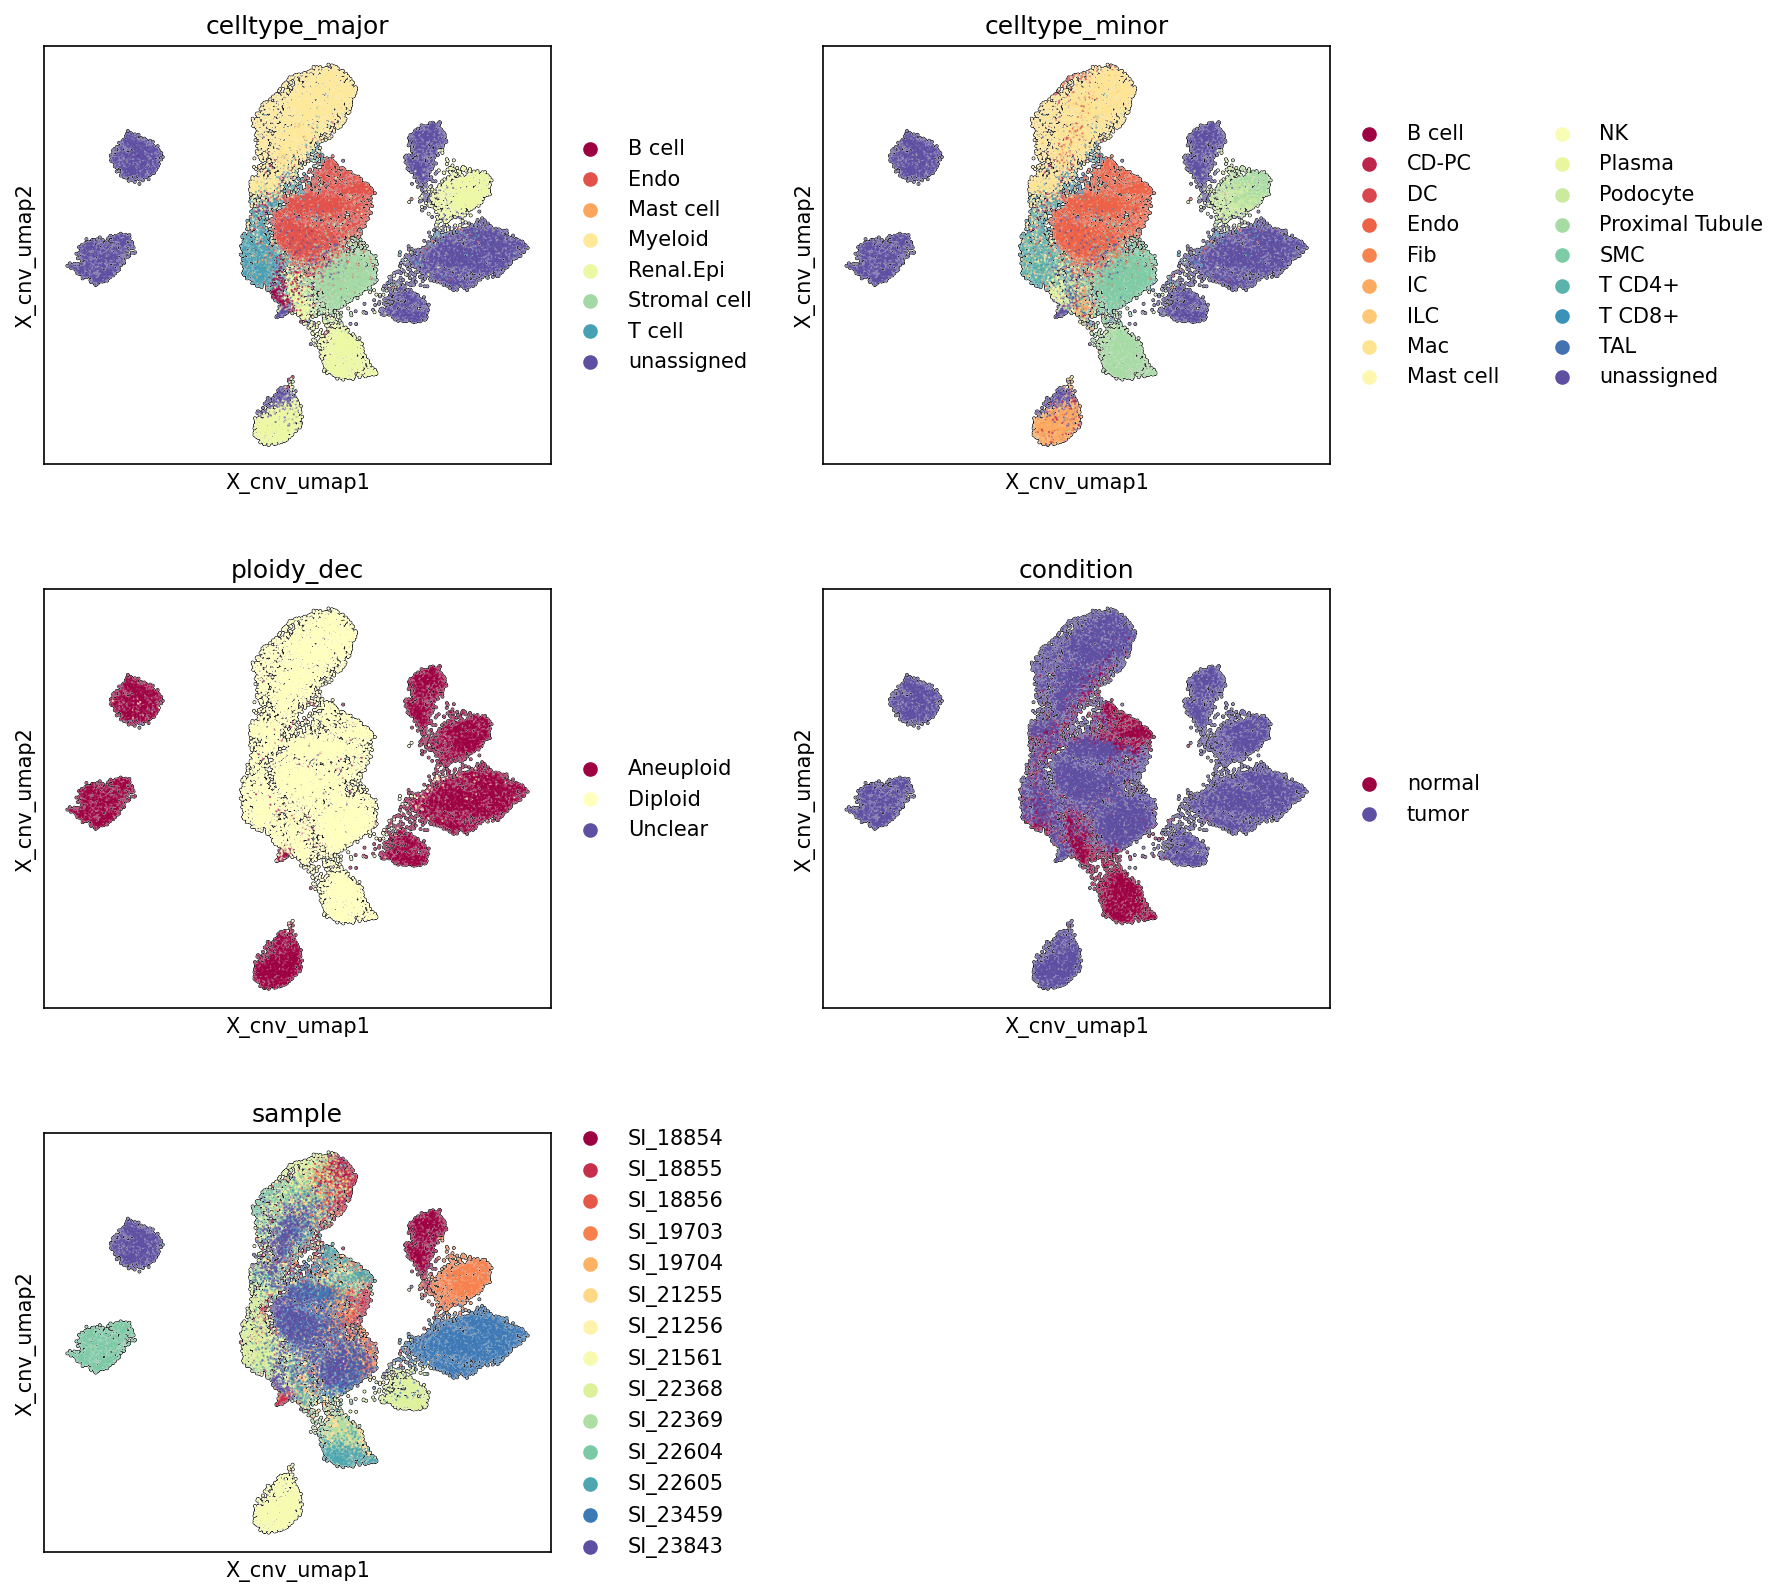
[Analysis Visualization Results]...
Analysis Overview
This analysis presents five UMAP (Uniform Manifold Approximation and Projection) plots, where the embedding was specifically informed by Copy Number Variation (CNV) patterns (cnv=True). These plots visualize the single-cell RNA-sequencing data from kidney tissue, colored by major cell type, minor cell type, ploidy status, disease condition (tumor/normal), and individual sample. The primary goal is to assess how well these biological and experimental variables separate cells in a CNV-aware dimensionality reduction, particularly focusing on identifying tumor cell populations and associated microenvironments in the context of Renal Cell Carcinoma.
Visual Summary
The UMAPs display a multi-cluster structure with a large, diffuse central group of cells and several more compact, distinct peripheral clusters.
- celltype_major: The central, largest cluster is predominantly composed of Renal Epithelial cells, Stromal cells, Myeloid cells, and Endothelial cells. T cells form several smaller, distinct clusters, and B cells occupy another separate cluster. 'unassigned' cells are also observed in distinct, small peripheral clusters.
- celltype_minor: This plot provides a more granular view. Proximal Tubule cells (a type of Renal Epithelial cell) are a major component of the central cluster. Macrophages (Myeloid), Fibroblasts (Stromal), and Endothelial cells are also prominent in this central region. T cell CD4+ and T cell CD8+ form well-separated clusters, as do B cells and Plasma cells. Podocytes, Intercalated cells, and Collecting Duct Principal cells form smaller, distinct groups, often adjacent to the main Renal Epithelial cell mass.
- ploidy_dec: This plot shows a striking separation. A large central population is clearly labeled "Diploid" (yellow), while several distinct and relatively compact clusters, mostly located away from the central mass, are labeled "Aneuploid" (maroon). The "Unclear" cells are very sparse and scattered.
- condition: This UMAP demonstrates a strong concordance with the ploidy status. The cells identified as "tumor" (purple) occupy the same distinct clusters that were labeled "Aneuploid" in the ploidy_dec plot. Conversely, the "normal" cells (maroon) largely overlap with the "Diploid" cells in the central and other non-aneuploid clusters. It is important to note the color 'maroon' represents 'Aneuploid' in the ploidy_dec plot and 'normal' in the condition plot; the spatial distribution and specific legend labels must be carefully considered for interpretation.
- sample: Cells from different samples are generally well-interspersed across the major diploid cell populations, indicating good mixing and minimal strong batch effects within these groups. However, some of the smaller, distinct clusters, particularly those identified as aneuploid/tumor, may show some degree of sample-specific enrichment, though they still contain cells from multiple samples, suggesting common CNV patterns across patients.
Biological Interpretation
The CNV-informed UMAP embedding effectively separates cell populations based on their genomic integrity, providing strong evidence for distinct normal and tumor compartments.
- Identification of Tumor Cells: The distinct clusters of "Aneuploid" cells in the ploidy_dec plot, which perfectly align with the "tumor" condition in the condition plot, strongly represent the malignant cell population. Given the context of Renal Cell Carcinoma and the 'Resolved tumor-origin cell type' being Renal Epithelial cell, these aneuploid, tumor-associated clusters are expected to be enriched for malignant renal epithelial cells.
- Tumor Microenvironment: The major central cluster, identified as predominantly "Diploid" and "normal" condition, contains a diverse mix of renal epithelial cells, stromal cells (fibroblasts), endothelial cells, and immune cells (myeloid, T cells). The immune and stromal cells observed within or adjacent to the tumor-associated (aneuploid/tumor) clusters suggest the presence of a tumor microenvironment, where these non-malignant cells infiltrate or are recruited by the tumor.
- Cell Type Specificity of Ploidy: Upon closer inspection across the celltype_major, celltype_minor, ploidy_dec, and condition plots, the aneuploid/tumor clusters appear to be enriched for specific subtypes of Renal Epithelial cells (e.g., Proximal Tubule cells if they are part of the spatially separated aneuploid cluster, but from the visualization it seems the aneuploid clusters are more distinctly separated from the main 'Renal Epithelial' cluster which is mostly diploid/normal), reinforcing the inference that these are indeed transformed renal epithelial cells. The non-epithelial cells like T cells, B cells, myeloid cells, and stromal cells generally remain diploid, whether they are in normal or tumor tissue, as expected for immune and stromal components of the microenvironment.
- CNV-driven Separation: The clear separation of aneuploid/tumor cells from diploid/normal cells highlights the effectiveness of using CNV inference to guide the embedding. This CNV-aware dimensionality reduction is critical for distinguishing true malignant cells from normal tissue cells and infiltrating stromal/immune cells, which often cluster together based solely on gene expression profiles. The visual segregation validates the underlying CNV estimates.
Annotation Notes
- The strong and coherent segregation of cells by ploidy_dec and condition on the CNV-informed UMAP provides robust validation for these annotations. The co-localization of aneuploidy with tumor status is a key finding consistent with the biology of Renal Cell Carcinoma.
- The sample plot generally shows good mixing across the broad 'normal' cell populations, indicating that the embedding is not heavily driven by sample-specific batch effects for these cells. The distinct tumor clusters drawing from multiple samples suggest shared tumor characteristics rather than patient-specific artifacts.
- The presence of "unassigned" cells in small, distinct clusters suggests populations that could not be confidently assigned to known cell types or represent rare, distinct cell states. Further investigation into these cells might be warranted.
6. Minor Cell Type Population Analysis in Renal Cell Carcinoma Samples
[Analysis Visualization Results]...
Analysis Overview
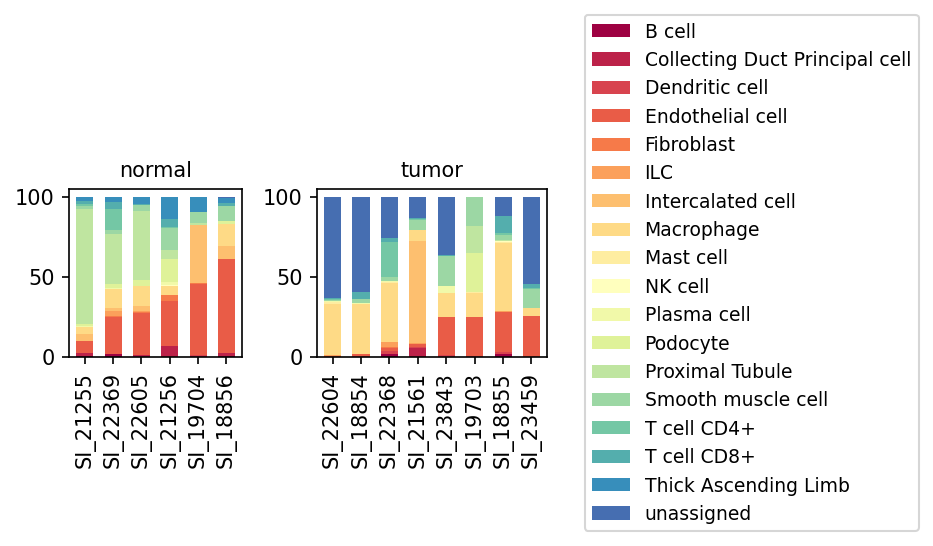
This analysis visualizes the population distribution of minor cell types across individual samples, distinguishing between 'normal' and 'tumor' conditions in kidney tissue. The objective is to identify shifts in cellular composition associated with the tumor microenvironment, particularly in the context of inferred Renal Cell Carcinoma (RCC). The AnnData context indicates the dataset comprises human kidney single-cell RNA-seq data, with a significant proportion of aneuploid cells and a resolved tumor-origin cell type as Renal Epithelial cell, reinforcing the RCC context.
Visual Summary
The bar plot displays the relative proportions of various minor cell types for each sample, grouped by 'normal' and 'tumor' conditions.
Normal Samples (Left Panel):
- These samples exhibit a diverse cellular composition, with a clear dominance of native renal epithelial cell types.
- Proximal Tubule and Thick Ascending Limb cells are consistently the most abundant populations across all normal samples.
- Podocytes, Endothelial cells, and Macrophages also contribute significantly to the normal kidney cellular landscape.
- Other immune cells (e.g., T cells, Dendritic cells) and stromal cells (e.g., Fibroblasts) are present in smaller proportions.
- The 'unassigned' cell population is negligible across all normal samples, indicating robust and comprehensive annotation of healthy kidney tissue.
Tumor Samples (Right Panel):
- A striking feature of the tumor samples is the substantial proportion of 'unassigned' cells. In most tumor samples, 'unassigned' cells represent the largest or a major fraction of the total cell population, often exceeding 50%.
- Concurrently, there is a marked reduction, and in some cases near absence, of the predominant normal renal epithelial cell types such as Proximal Tubule and Thick Ascending Limb cells, compared to normal samples.
- Macrophages, Endothelial cells, T cell CD4+, and T cell CD8+ are consistently present in tumor samples, and their relative proportions among the *assigned* cells appear more prominent than in normal samples, especially given the reduction in native epithelial cells.
- Dendritic cells and Fibroblasts are also observed, contributing to the tumor microenvironment.
- The overall cellular diversity among *assigned* cell types in tumor samples appears lower compared to normal, primarily due to the large 'unassigned' fraction and the depletion of many native kidney cells.
Biological Interpretation
The observed cellular shifts provide significant biological insights into Renal Cell Carcinoma:
- Dominance of 'Unassigned' Cells in Tumor Samples: The high percentage of 'unassigned' cells in tumor samples is a critical observation. Given that the 'Resolved tumor-origin cell type' is 'Renal Epithelial cell' and a substantial proportion of cells are 'Aneuploid' in the dataset, it is highly probable that these 'unassigned' cells represent the malignant renal epithelial cells. Tumor cells often undergo significant transcriptomic reprogramming and dedifferentiation, making them difficult to classify using reference annotations derived from healthy tissues. These 'unassigned' cells likely constitute the cancerous population, characterized by their altered gene expression profiles and aneuploidy.
- Depletion of Normal Kidney Parenchyma: The dramatic reduction or absence of native renal epithelial cell types like Proximal Tubule and Thick Ascending Limb in tumor samples reflects the pathological process where tumor cells proliferate and replace the healthy kidney tissue. This observation is consistent with the destructive nature of renal cell carcinoma.
- Altered Tumor Microenvironment Composition: Despite the dominance of 'unassigned' cells, the consistent presence of immune cells (Macrophages, T cell CD4+, T cell CD8+, Dendritic cells) and stromal cells (Fibroblasts, Endothelial cells) in tumor samples highlights the formation of a complex tumor microenvironment.
- Macrophages are often a major component of the tumor microenvironment, frequently differentiating into tumor-associated macrophages (TAMs) that can promote tumor growth, angiogenesis, and immune suppression PubMed search: tumor associated macrophages renal cell carcinoma.
- The presence of both CD4+ and CD8+ T cells indicates an immune response, although their functional state (e.g., exhausted, activated) would require further investigation. These cells are key players in anti-tumor immunity, and their infiltration patterns are crucial for prognosis and therapeutic response in RCC PubMed search: t cells renal cell carcinoma immunology.
- Fibroblasts contribute to the tumor stroma, often differentiating into cancer-associated fibroblasts (CAFs) that play roles in extracellular matrix remodeling, immune modulation, and tumor progression PubMed search: cancer associated fibroblasts renal cell carcinoma.
- Endothelial cells are essential for angiogenesis, supporting tumor growth by supplying nutrients and oxygen. Their presence indicates ongoing vascularization within the tumor.
Clinical or Translational Implications
- Identification of Malignant Cells: The large "unassigned" population in tumor samples strongly suggests these are the malignant cells. Further characterization of these cells (e.g., through DEG, GSEA, GSA analyses specifically on these cells if they can be robustly re-clustered/annotated) is crucial to uncover tumor-specific biological pathways, potential therapeutic targets, and markers for disease progression.
- Targeting the Tumor Microenvironment: The consistent presence and altered proportions of immune and stromal cells within the tumor indicate that the tumor microenvironment plays a critical role in RCC progression. Strategies targeting these non-malignant components, such as immunotherapies (e.g., checkpoint inhibitors modulating T cells) or therapies targeting TAMs or CAFs, could be highly relevant for treatment PubMed search: renal cell carcinoma tumor microenvironment therapy.
- Understanding Disease Pathology: The clear distinction in cell type composition between normal and tumor tissue provides a cellular basis for understanding RCC pathology. The loss of normal kidney function can be directly linked to the replacement of healthy renal cells by the tumor mass. This reinforces the importance of early detection and intervention to preserve renal function.
7. Population Analysis of T Cell Subsets in Kidney Tissue (Normal vs. Tumor)
[Analysis Visualization Results]...
Analysis Overview
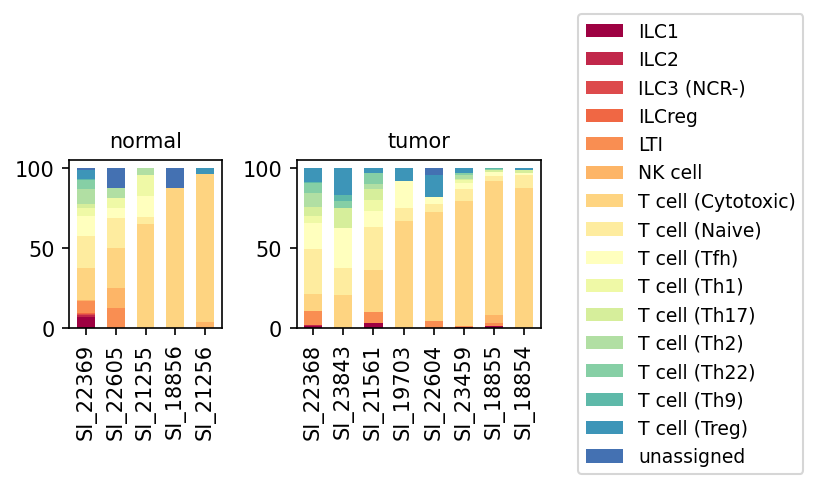
This analysis presents a stacked bar plot visualizing the relative proportions of T cell subsets across individual samples, comparing normal kidney tissue with renal cell carcinoma (tumor) tissue. The plot focuses specifically on cells classified under the 'T cell' major cell type, further dissecting them into finer 'subset' annotations. This provides insight into the compositional changes within the T cell compartment in the tumor microenvironment, which is crucial for understanding immune responses and potential immune evasion mechanisms in renal cell carcinoma.
Visual Summary
The visualization displays the distribution of various T cell subsets, as well as NK cells and ILCs (which are grouped under the 'T cell' major category for this analysis based on the dataset's annotation structure), in individual samples from both normal and tumor conditions.
- Normal Samples: The normal kidney samples (SI_22369, SI_22605, SI_21255, SI_18856, SI_21256) generally exhibit a more diverse composition of T cell subsets. Notably, T cell (Cytotoxic) and T cell (Naive) cells constitute a significant portion. However, there are also appreciable proportions of other helper T cell subsets such as T cell (Th1), T cell (Th17), T cell (Th2), T cell (Th22), T cell (Th9), T cell (Tfh), as well as T cell (Treg) cells. Furthermore, NK cells and various ILCs (ILC1, ILC2, ILC3 (NCR-), ILCreg, LTI) are present in varying but notable proportions in several normal samples. Some samples also show an 'unassigned' fraction.
- Tumor Samples: In contrast, the tumor samples (SI_22368, SI_23843, SI_21561, SI_19703, SI_22604, SI_23459, SI_18855, SI_18854) show a marked shift in their T cell subset composition. The T cell compartment in tumor samples appears to be largely dominated by T cell (Cytotoxic) and T cell (Naive) populations, which together account for a very high relative proportion in most tumor samples. There is a noticeable reduction in the relative proportions of other T cell subsets, including Th1, Th17, Th2, Th22, Th9, and Tfh cells, compared to normal samples. Crucially, NK cells and ILCs (ILC1, ILC2, ILC3 (NCR-), ILCreg, LTI) are largely diminished or almost absent in most tumor samples. The relative proportion of T cell (Treg) also appears reduced in most tumor samples compared to some normal counterparts (e.g., SI_22369). The 'unassigned' fraction also varies across tumor samples.
Biological Interpretation
The observed shifts in the T cell subset landscape within the renal tumor microenvironment provide critical insights into the immune response against renal cell carcinoma.
- Dominance of Cytotoxic and Naive T Cells in Tumor: The striking relative abundance of T cell (Cytotoxic) cells in tumor samples suggests an attempt by the immune system to mount an anti-tumor response. Cytotoxic T lymphocytes (CTLs) are crucial for directly killing cancer cells PubMed Search: cytotoxic T cells cancer immunity. The concurrent high proportion of T cell (Naive) cells could indicate a continuous influx of new T cells into the tumor microenvironment, some of which may differentiate into effector cells.
- Reduced Helper T Cell Diversity: The general reduction in the relative proportions of various helper T cell subsets (Th1, Th17, Th2, Th22, Th9, Tfh) in tumor samples is notable. These subsets play critical roles in orchestrating adaptive immune responses, with Th1 cells driving anti-tumor immunity through IFN-γ production and Th17 cells being involved in both pro- and anti-tumor responses depending on context PubMed Search: helper T cell subsets cancer. A relative decrease in their diversity or proportion might impair a robust and multi-faceted immune response against the tumor.
- Diminished NK Cells and ILCs: The most striking observation is the significant reduction or near absence of NK cells and ILCs (ILC1, ILC2, ILC3 (NCR-), ILCreg, LTI) in the tumor samples, within this specific T cell major population grouping. NK cells and ILCs represent key components of the innate immune system that provide early and potent anti-tumor surveillance and response, often without prior sensitization PubMed Search: NK cells ILCs cancer immunity. Their relative depletion in the tumor microenvironment could represent a significant mechanism of immune evasion employed by renal cell carcinoma, allowing tumor progression by weakening crucial innate immune defenses.
- Treg Proportions: While Regulatory T cells (Treg) are known to suppress anti-tumor immunity and their infiltration often correlates with poor prognosis in RCC PubMed Search: regulatory T cells renal cell carcinoma, this plot shows a *relative reduction* in their proportion within the T cell compartment in tumor samples compared to some normal samples. This could imply a shift in the overall balance, where even if absolute numbers of Tregs increase in the tumor, other T cell populations (like cytotoxic T cells) increase even more dramatically, or their relative contribution is masked by the dominance of other subsets. Alternatively, it could suggest a specific immune landscape where Treg-mediated suppression might be less dominant at the T cell subset level, or that other suppressive mechanisms are at play.
Clinical or Translational Implications
The observed shifts in T cell subset populations, particularly the diminished presence of NK cells and ILCs and the altered helper T cell landscape in renal tumors, have important clinical implications for understanding disease progression and developing immunotherapeutic strategies for Renal Cell Carcinoma.
- Immunotherapy Response: The dominance of cytotoxic T cells in the tumor might suggest an ongoing, albeit potentially insufficient, immune response. Strategies aimed at enhancing the function or persistence of these cytotoxic T cells (e.g., checkpoint blockade) could be considered. However, the reduced presence of NK cells and ILCs points to a potential gap in innate immune surveillance, which could limit the overall effectiveness of T-cell-centric immunotherapies.
- Novel Therapeutic Targets: The substantial relative reduction of NK cells and ILCs in tumor samples highlights these innate immune cells as potential targets for novel immunotherapeutic approaches in RCC. Restoring or enhancing their activity within the tumor microenvironment could provide a powerful anti-tumor effect, especially considering their role in early tumor detection and elimination.
- Biomarker Potential: The specific shifts in the proportions of different T cell subsets, NK cells, and ILCs could serve as prognostic biomarkers or indicators of response to therapy. Monitoring these immune cell populations could help tailor treatment strategies for individual patients.
- Understanding Immune Evasion: The data suggests that renal cell carcinoma may evade the immune system not only by tolerizing T cells but also by actively reducing or altering the influx and differentiation of crucial innate immune cells like NK cells and ILCs, and potentially impacting the helper T cell landscape. Future research could focus on mechanisms driving these specific compositional changes.
8. Analysis of Regulatory T cell (Treg) Proportions in Renal Cell Carcinoma
[Analysis Visualization Results]...
Analysis Overview
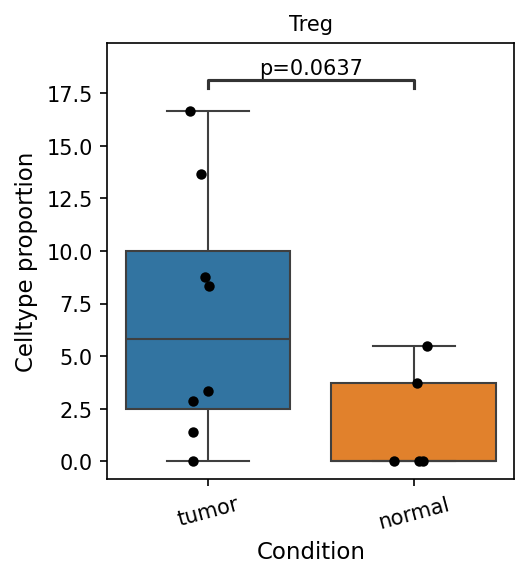
This analysis investigates the proportional differences of various T cell subsets between 'tumor' and 'normal' kidney tissue conditions. The provided box plot specifically illustrates the proportion of Regulatory T cells (Tregs) in samples derived from tumor versus normal tissues. The comparison identifies statistically significant differences based on a p-value cutoff of 0.1, as defined in the analysis parameters.
Visual Summary
The box plot displays the celltype proportion of "Treg" cells across 'tumor' and 'normal' conditions.
- Higher Proportion in Tumor: The 'tumor' condition (blue box) shows a noticeably higher median Treg cell proportion compared to the 'normal' condition (orange box). The median Treg proportion in tumor samples appears to be around 5-6%, while in normal samples it is close to 0%.
- Increased Variability in Tumor: The interquartile range (IQR) for Treg proportion is wider in the 'tumor' group, indicating greater variability among tumor samples, with some samples showing proportions exceeding 15%.
- Individual Data Points: The stripplot overlays individual data points, illustrating the distribution of Treg proportions for each sample within both conditions. It shows several tumor samples with high Treg proportions and very low proportions in normal samples.
- Statistical Significance: A p-value of 0.0637 is indicated, which meets the applied statistical significance cutoff of p < 0.1. This suggests a statistically significant enrichment of Treg cells in the tumor microenvironment compared to normal tissue.
Biological Interpretation
Regulatory T cells (Tregs) are a specialized subset of T lymphocytes crucial for maintaining immune tolerance and preventing autoimmunity. In the context of cancer, an elevated presence of Tregs in the tumor microenvironment (TME) is a well-established mechanism of immune evasion by cancer cells [1].
- Immunosuppressive Microenvironment: The significantly higher proportion of Tregs in the 'tumor' condition, particularly within the inferred context of Renal Cell Carcinoma (RCC), strongly suggests the establishment of an immunosuppressive TME. Tregs suppress the activity of effector T cells (like CD8+ cytotoxic T cells) and other immune cells, thereby allowing tumor cells to escape immune surveillance and proliferate unchecked [2].
- Role in RCC Progression: In RCC, an increase in tumor-infiltrating Tregs is frequently associated with advanced disease stages and poorer patient prognosis. This finding aligns with the biological understanding that Tregs contribute to tumor growth by dampening anti-tumor immune responses [3].
- Potential Mechanism for Tumor Escape: The observed enrichment of Tregs in tumor samples could be a key factor contributing to the overall immune evasion strategy of Renal Epithelial cells, the resolved tumor-origin cell type in this dataset.
Clinical or Translational Implications
The increased proportion of Tregs in renal tumor tissue holds several clinical implications for Renal Cell Carcinoma:
- Prognostic Biomarker: An elevated Treg frequency in the tumor microenvironment could serve as a prognostic biomarker, potentially indicating a less favorable disease course for RCC patients [3].
- Therapeutic Target: Given their role in immune suppression, Tregs represent an attractive therapeutic target in oncology. Strategies to deplete or inhibit Treg function within the tumor microenvironment, often in combination with other immunotherapies (e.g., checkpoint inhibitors), are under investigation to enhance anti-tumor immunity in various cancers, including RCC [4].
- Monitoring Immunotherapy Response: Changes in Treg proportions following treatment could potentially be used to monitor the effectiveness of immunotherapeutic interventions.
---
References
- Wing, K., & Sakaguchi, S. (2010). Regulatory T cells exert checks and balances on the immune system. *Nature Immunology*, 11(11), 984–991. PubMed Search: "Regulatory T cells cancer immune evasion"
- Ohue, Y., & Nishikawa, H. (2019). Regulatory T Cells in the Tumor Microenvironment: New Insights into Functions and Targets. *Cancer Science*, 110(5), 1590–1596. PubMed Search: "Tregs tumor microenvironment"
- Shen, X., Li, B., Lu, J., et al. (2020). Prognostic value of tumor-infiltrating regulatory T cells in renal cell carcinoma: A meta-analysis. *OncoTargets and Therapy*, 13, 11463–11475. PubMed Search: "Tregs renal cell carcinoma prognosis"
- Tanaka, A., & Sakaguchi, S. (2017). Regulatory T cells in cancer immunotherapy. *Cell Research*, 27(1), 109–118. PubMed Search: "Tregs cancer immunotherapy"
9. Macrophage Subset Population Analysis in Renal Cell Carcinoma
[Analysis Visualization Results]...
Analysis Overview
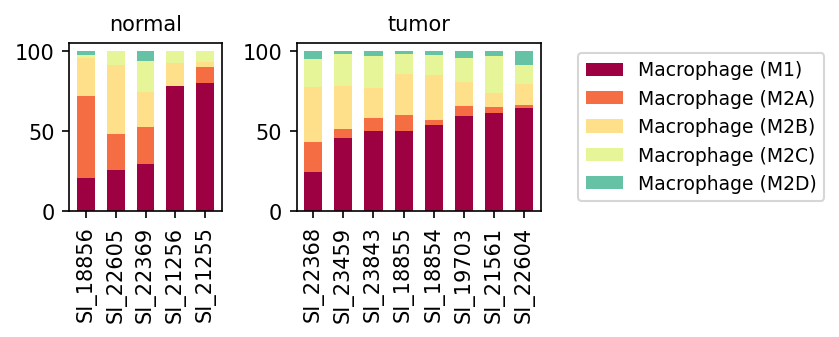
This analysis presents a stacked bar plot illustrating the proportional distribution of different macrophage subsets (Macrophage M1, M2A, M2B, M2C, M2D) across individual normal and tumor kidney samples. The primary goal is to identify shifts in macrophage polarization that may be associated with the tumor microenvironment in Renal Cell Carcinoma (RCC).
Visual Summary
The plot displays macrophage subset composition for five normal kidney samples and eight tumor kidney samples. Each bar represents a single sample, normalized to 100% of total macrophages within that sample.
Key observations:
- Normal Samples: Macrophage composition in normal kidney samples is heterogeneous. Some normal samples (e.g., SI_18856, SI_22605) show a significant proportion of Macrophage (M2A) (orange, ~50-70%). In contrast, other normal samples (e.g., SI_21256, SI_21255) are predominantly composed of Macrophage (M1) (dark red, ~75-80%). Macrophage (M2B) (light yellow) and Macrophage (M2C) (pale yellow) are present in varying, generally smaller, proportions, while Macrophage (M2D) (teal) is consistently minimal.
- Tumor Samples: In the tumor samples, Macrophage (M1) (dark red) consistently represents the largest proportion across most samples, often exceeding 50% (e.g., SI_18855, SI_18854, SI_19703, SI_21561, SI_22604). While present, Macrophage (M2A) (orange) generally appears less dominant compared to the M2A-high normal samples. Macrophage (M2B) and Macrophage (M2C) subsets contribute notably to the remaining macrophage population, demonstrating a consistent presence in tumor samples. Macrophage (M2D) remains a minor population, similar to normal tissues.
- Condition-specific shift: A noticeable trend in tumor samples is the more consistent dominance of Macrophage (M1) cells across individual tumor samples compared to the more variable patterns seen in normal samples, where either M1 or M2A could be the leading subset.
Biological Interpretation
Macrophages are critical components of the tumor microenvironment (TME) and play diverse roles in cancer progression, broadly categorized into M1-like (pro-inflammatory, anti-tumor) and M2-like (immunosuppressive, pro-tumor) phenotypes, though their polarization exists on a spectrum.
- Dominance of M1 Macrophages in Tumors: The observed consistent dominance of M1 macrophages in the tumor samples is intriguing. M1 macrophages are typically associated with classical activation, producing pro-inflammatory cytokines and mediating anti-tumor immunity. However, their persistent presence in the TME can also contribute to chronic inflammation, which has been implicated in tumor promotion. This pattern could suggest an ongoing, yet potentially overwhelmed or dysregulated, immune response against the RCC cells, or it might represent an M1-like phenotype with nuanced functions within the tumor context.
- Persistent M2 Subsets: Despite M1 dominance, the sustained presence of M2B and M2C macrophages in tumor samples is biologically significant. M2B macrophages are known for their immunomodulatory properties, while M2C macrophages are largely immunosuppressive, promoting tissue remodeling, fibrosis, and immune evasion (PubMed search: "M2C macrophages cancer" [PubMed Search]). The co-existence of M1 with these M2 subtypes highlights the complexity and heterogeneity of tumor-associated macrophages (TAMs) in RCC, where pro- and anti-tumor functions may operate simultaneously.
- Reduced M2A in Tumors: While M2A macrophages (associated with wound healing and angiogenesis) are prominent in some normal samples, their relative proportion appears reduced in many tumor samples compared to the M1 population. This might suggest a shift in the specific M2 programs activated within the RCC TME.
- Implications for Renal Cell Carcinoma: The inferred disease, Renal Cell Carcinoma, is often characterized by a highly immunosuppressive TME. While the M1 dominance might seem counterintuitive for an immunosuppressive environment, it underscores the plasticity of macrophages and the complex signaling within the kidney TME. The balance and specific activation states of these macrophage subsets are crucial determinants of disease progression and response to therapy in RCC (GeneCards: "M1 macrophage" [GeneCards]).
Clinical or Translational Implications
The distinct macrophage subset profiles observed between normal and tumor kidney tissues could have several clinical implications for Renal Cell Carcinoma:
- Biomarker Potential: The specific distribution of macrophage subsets, particularly the prevalence of M1 macrophages alongside M2B and M2C, could serve as a prognostic biomarker for RCC patient outcomes or a predictive marker for response to immunotherapies.
- Therapeutic Targeting: Understanding the precise polarization of TAMs in RCC can inform the development of targeted immunotherapies. Strategies aiming to reprogram immunosuppressive M2 subsets towards an M1-like phenotype, or to enhance the anti-tumor functions of existing M1 cells, could be explored (PubMed search: "macrophage reprogramming cancer therapy" [PubMed Search]).
- Monitoring Treatment Response: Changes in macrophage subset composition could potentially be monitored during treatment to assess the efficacy of therapeutic interventions and guide personalized medicine approaches.
10. Differential Abundance of Macrophage M2C Subset in Renal Cell Carcinoma
[Analysis Visualization Results]...
Analysis Overview
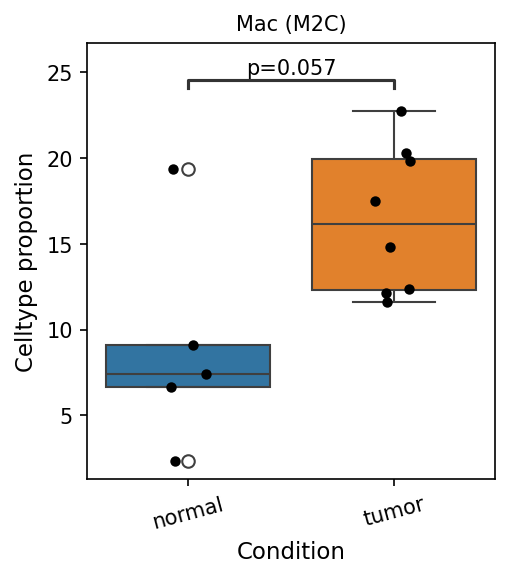
This analysis investigates the proportional representation of macrophage subsets within kidney tissue, comparing 'normal' and 'tumor' conditions. Specifically, the provided box plot focuses on the Macrophage (M2C) subset. The aim is to identify macrophage populations with statistically significant differences in their proportions between the two conditions, based on a single-cell RNA sequencing dataset from human kidney samples where Renal Cell Carcinoma is the inferred disease context. The analysis utilized a p-value cutoff of 0.1 for statistical significance, and a log2 fold change cutoff of 0.1 was also applied.
Visual Summary
The box plot illustrates the celltype proportion of Macrophage (M2C) cells in normal versus tumor kidney samples.
- In the normal condition, the median proportion of Macrophage (M2C) cells is approximately 7.5%, with an interquartile range (IQR) spanning from about 6.5% to 9.5%. The individual sample proportions are relatively low.
- In the tumor condition, the median proportion of Macrophage (M2C) cells is considerably higher, at approximately 16%, with an IQR ranging from about 12% to 20%. The data points for tumor samples are generally shifted upwards compared to normal samples, indicating an enrichment.
- A statistical comparison between the two conditions yielded a p-value of 0.057. According to the applied statistical cutoff (p-value < 0.1), this difference is considered statistically significant, indicating a notable increase in the proportion of Macrophage (M2C) cells in tumor samples compared to normal samples.
Biological Interpretation
The observed increase in the proportion of Macrophage (M2C) cells in the tumor microenvironment is biologically significant in the context of Renal Cell Carcinoma (RCC). Macrophages are a heterogeneous population of immune cells that play diverse roles in cancer. The M2 subtype of macrophages, often termed tumor-associated macrophages (TAMs), is generally associated with pro-tumorigenic functions.
- M2C Macrophages: M2C macrophages are characterized by their roles in immune regulation, wound healing, tissue remodeling, and suppression of adaptive immune responses. They typically express markers like CD163 and CD206 and can produce anti-inflammatory cytokines such as IL-10 and TGF-β.
- Role in Cancer: In various cancers, including RCC, M2-polarized macrophages contribute to tumor progression by promoting angiogenesis, extracellular matrix remodeling, immune evasion, and metastasis. The enrichment of M2C macrophages specifically suggests an immunosuppressive and tissue-remodeling environment within the renal tumors. This shift in macrophage polarization from a more balanced state in normal tissue to an M2C-dominant profile in tumor tissue can facilitate tumor growth and survival by dampening anti-tumor immune responses PubMed Search: M2C macrophages cancer immune evasion.
- Context of RCC: Given that RCC is characterized by its complex immune microenvironment, the increased infiltration and shift towards an M2C phenotype among macrophages in kidney tumors highlight their potential contribution to disease pathogenesis.
Clinical or Translational Implications
The significant enrichment of Macrophage (M2C) cells in Renal Cell Carcinoma tumors suggests several potential clinical and translational implications:
- Prognostic Marker: An elevated proportion of M2C macrophages in the tumor microenvironment could potentially serve as a prognostic marker for RCC progression or response to therapy, as increased TAM infiltration is often associated with poor prognosis in various cancers PubMed Search: tumor associated macrophages RCC prognosis.
- Therapeutic Target: Targeting M2C macrophages or re-educating them towards a more anti-tumorigenic (M1-like) phenotype represents a promising therapeutic strategy. This could involve approaches that inhibit M2C differentiation, deplete TAMs, or modulate their function to enhance anti-tumor immunity in RCC patients.
- Immunotherapy Enhancement: Understanding the specific roles of M2C macrophages could inform strategies to improve the efficacy of existing immunotherapies, such as checkpoint inhibitors, which may be hampered by immunosuppressive TAMs. Modulating M2C activity could potentially synergize with these treatments.
11. Ploidy Analysis of Renal Epithelial Cells in Normal and Tumor Conditions
[Analysis Visualization Results]...
Analysis Overview
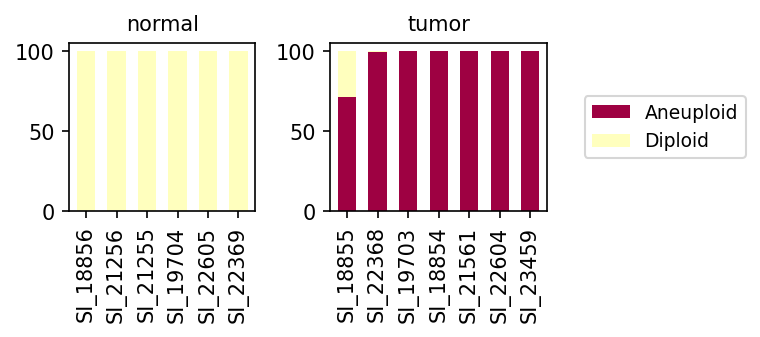
This analysis investigates the ploidy status (Diploid vs. Aneuploid) of Renal Epithelial cells, identified as the tumor-origin cell type, across different individual samples from both normal and tumor kidney tissues. The primary goal is to visualize the distribution of these ploidy populations within this specific cell type and observe any condition-associated shifts.
Visual Summary
The bar plots display the proportion of aneuploid (burgundy) and diploid (light yellow) cells within Renal Epithelial cells for each individual sample, grouped by 'normal' and 'tumor' conditions.
- Normal Condition Samples: All samples from the 'normal' condition (SI_18856, SI_21256, SI_21255, SI_19704, SI_22605, SI_22369) show a near-exclusive population of Diploid Renal Epithelial cells. The aneuploid population is negligible or absent.
- Tumor Condition Samples: In contrast, the 'tumor' condition samples exhibit a dramatic shift towards Aneuploidy within the Renal Epithelial cell population.
- Most tumor samples (SI_22368, SI_19703, SI_18854, SI_21561, SI_22604, SI_23459) consist almost entirely of Aneuploid Renal Epithelial cells (approaching 100%).
- One tumor sample, SI_18855, shows a notable proportion of both Aneuploid (approximately 70%) and Diploid (approximately 30%) Renal Epithelial cells, indicating some heterogeneity.
Biological Interpretation
The observed ploidy patterns strongly corroborate the inference of Renal Cell Carcinoma in the tumor samples.
- Maintenance of Diploidy in Normal Tissue: In healthy, non-cancerous kidney tissue, renal epithelial cells are expected to maintain a normal diploid chromosomal complement. The data perfectly reflects this, with normal samples showing virtually 100% diploidy among these cells. This serves as a critical baseline and validates the ploidy estimation.
- Aneuploidy as a Hallmark of Cancer: The striking prevalence of aneuploidy in Renal Epithelial cells from tumor samples is a well-established characteristic of malignancy and genomic instability in cancer, including Renal Cell Carcinoma. Aneuploidy, the condition of having an abnormal number of chromosomes, arises from errors during cell division and is a major driver of tumor evolution and heterogeneity [PubMed Search: "aneuploidy cancer" PubMed Search].
- Tumor Heterogeneity: The sample SI_18855 from the tumor group, which contains a significant fraction of diploid Renal Epithelial cells alongside aneuploid ones, suggests tumor heterogeneity. This could represent:
- Admixture of normal renal epithelial cells within the tumor biopsy.
- Presence of distinct tumor cell subclones, some of which might still be diploid or have recently undergone transformation but haven't fully committed to aneuploidy.
- Contamination with stromal cells or immune cells from the tumor microenvironment that are inherently diploid (though the analysis was specifically for "Renal Epithelial cell").
This observation highlights the complex cellular landscape within tumors.
Clinical or Translational Implications
The findings have several important clinical and translational implications for Renal Cell Carcinoma:
- Diagnostic and Prognostic Marker: Aneuploidy is a significant indicator of malignancy. In RCC, the degree of aneuploidy can be associated with tumor aggressiveness, pathological stage, and patient prognosis [GeneCards: "Renal Cell Carcinoma" GeneCards]. Identifying a high proportion of aneuploid renal epithelial cells can support a diagnosis of RCC.
- Understanding Tumor Evolution: The prevalence of aneuploidy underscores the profound genomic alterations occurring during RCC development. This genomic instability can lead to the acquisition of new traits, including drug resistance, metastasis, and immune evasion.
- Therapeutic Considerations: The presence of aneuploidy impacts cellular stress responses and can influence sensitivity to chemotherapy or targeted therapies. Tumors with high aneuploidy might respond differently to treatments compared to those with lower levels, suggesting potential for personalized therapeutic approaches. Further investigation into specific chromosomal gains or losses could reveal actionable targets.
- Monitoring Tumor Purity and Cellular Composition: The varying proportions of aneuploid/diploid cells across tumor samples (e.g., SI_18855 vs. other tumor samples) indicate the importance of assessing tumor purity and cellular heterogeneity in single-cell analyses, which can impact interpretation of downstream analyses like differential gene expression or cell-cell interaction studies.
12. Cell-Cell Interaction Patterns in Renal Cell Carcinoma Tumor Microenvironment
[Analysis Visualization Results]...
Analysis Overview
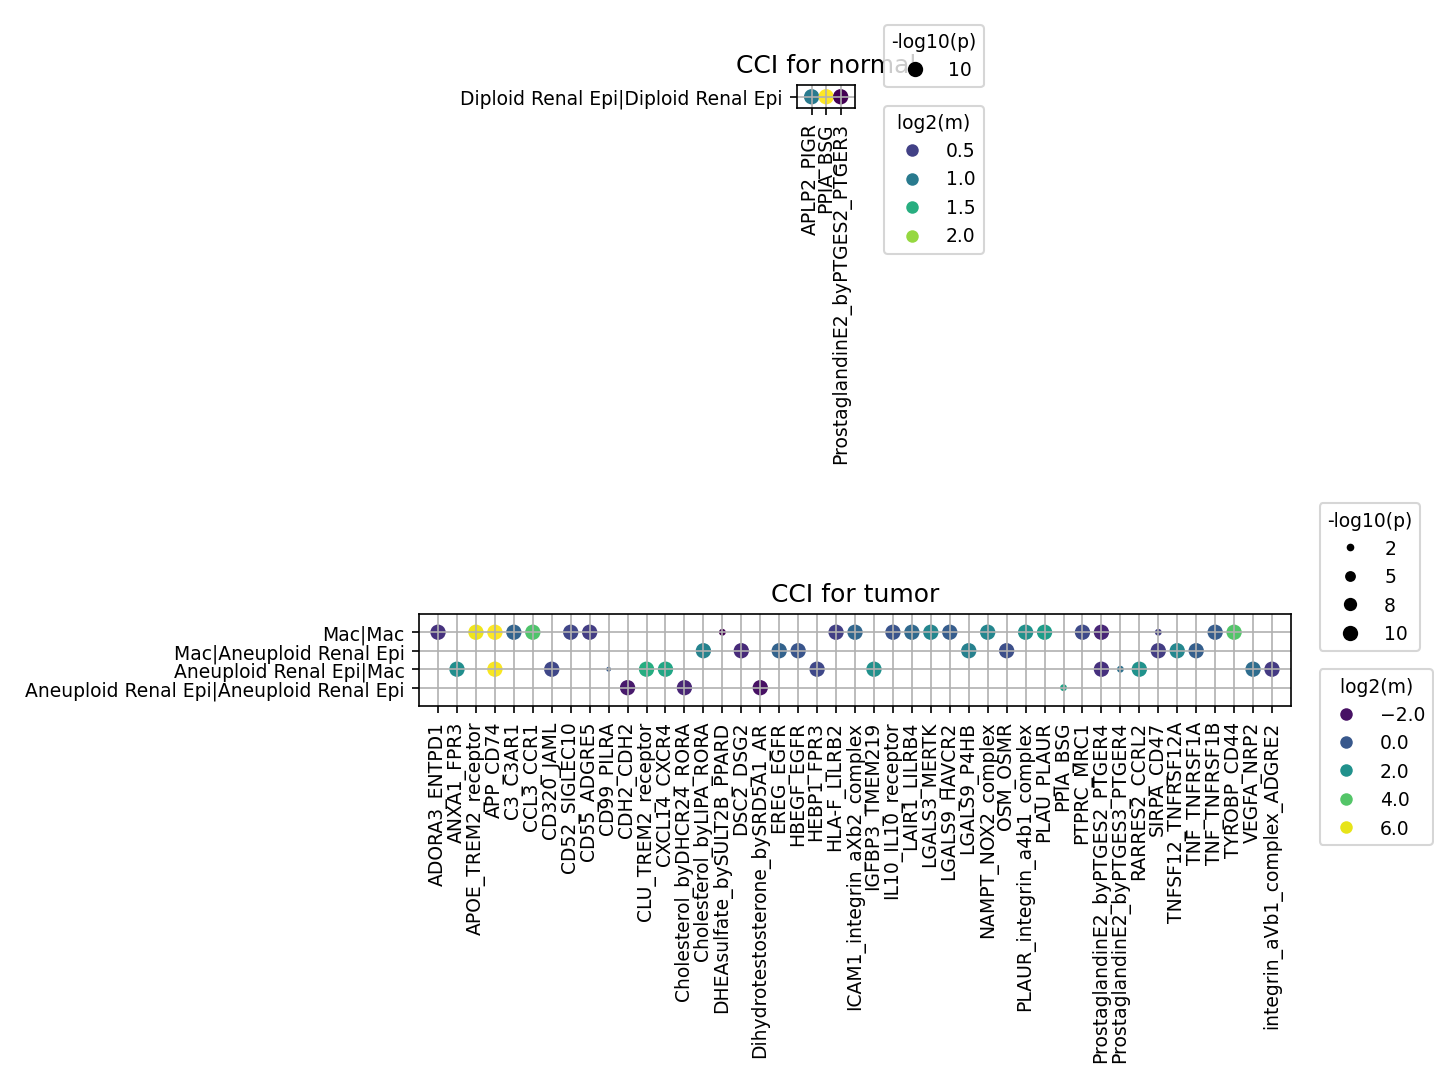
This analysis investigates cell-cell interaction (CCI) patterns using CellPhoneDB results, comparing normal kidney tissue with renal cell carcinoma (RCC) tumor tissue. The analysis focuses on interactions involving key cell types implicated in cancer biology: Renal Epithelial cells (identified as the tumor-origin cell type), Fibroblasts, Macrophages, T cells (CD4+ and CD8+), Endothelial cells, and B cells. The plot_cci_dots tool was used to visualize significant ligand-receptor interactions, limited to the top 80 pairs per group based on p-value and mean expression cutoffs. The plots differentiate between normal and tumor conditions, highlighting cell-type specific interactions and the molecular pathways involved. Given the context of RCC, the analysis also differentiates between diploid and aneuploid renal epithelial cells.
Visual Summary
Two dot plots are provided, one for "CCI for normal" and another for "CCI for tumor".
CCI for Normal Tissue:
- The Y-axis displays interacting cell pairs: Endo|Endo (Endothelial cell to Endothelial cell), Diploid Renal Epi|Endo (Diploid Renal Epithelial cell to Endothelial cell), and Diploid Renal Epi|Diploid Renal Epi (Diploid Renal Epithelial cell to Diploid Renal Epithelial cell).
- The X-axis lists specific ligand-receptor pairs.
- Dot size indicates statistical significance (-log10(p-value)), with larger dots representing more significant interactions.
- Dot color represents the interaction strength (log2(mean expression)), with yellow/green colors indicating stronger interactions.
- In normal tissue, prominent interactions are observed within Endothelial cells and Diploid Renal Epithelial cells, and between these two cell types. Many of these interactions involve integrins (e.g., FN1_integrin, COL4A1_integrin, integrin_avb1_complex_ADGRE5) and components of the Notch signaling pathway (e.g., DLL1_NOTCH1, DLL4_NOTCH1, JAG1_NOTCH1).
CCI for Tumor Tissue:
- The Y-axis displays interacting cell pairs: Mac|Mac (Macrophage to Macrophage), Mac|Aneuploid Renal Epi (Macrophage to Aneuploid Renal Epithelial cell), Aneuploid Renal Epi|Mac (Aneuploid Renal Epithelial cell to Macrophage), and Aneuploid Renal Epi|Aneuploid Renal Epi (Aneuploid Renal Epithelial cell to Aneuploid Renal Epithelial cell).
- The X-axis lists a distinct set of ligand-receptor pairs, which are largely different from those observed in normal tissue.
- Similar to the normal plot, dot size and color denote significance and strength, respectively.
- In tumor tissue, the predominant interactions involve Macrophages and Aneuploid Renal Epithelial cells. Key interactions include those related to immune modulation (SIRPA_CD47, LGALS9_HAVCR2, IL10_IL10RB), growth factor signaling (HBEGF_EGFR/HERB2/HERB3), angiogenesis (VEGFA_NRP2), chemokine signaling (CCL3_CCR1/CCR5), and lipid/steroid metabolism (Cholesterol_byDHCR24_RORA, Dihydrotestosterone_bySRD5A2_AR). Many of these interactions are highly significant and strong.
Biological Interpretation
The analysis reveals a dramatic shift in cellular communication patterns between normal kidney tissue and the RCC tumor microenvironment, consistent with the inferred disease context.
- Normal Tissue Homeostasis: In normal kidney, cell-cell interactions primarily support tissue structural integrity and normal physiological functions. The strong presence of integrin-mediated interactions (e.g., FN1_integrin_a3b1_complex, COL4A1_integrin_a1b1_complex) reflects the importance of extracellular matrix (ECM) adhesion and cell-matrix interactions for epithelial and endothelial cell organization. Notch signaling (DLL/JAG_NOTCH pairs) is crucial for kidney development, cell fate specification, and vascular patterning. These interactions maintain a stable tissue architecture.
- Tumor Microenvironment Remodeling: The tumor context exhibits a clear shift in interacting cell populations and molecular pathways, with Aneuploid Renal Epithelial cells and Macrophages becoming central players. This highlights the critical role of tumor-associated macrophages (TAMs) in the RCC microenvironment.
- Immune Evasion and Immunosuppression: Numerous strong interactions indicate mechanisms by which tumor cells evade immune surveillance and suppress anti-tumor responses. Examples include:
- SIRPA_CD47: This "don't eat me" signal prevents phagocytosis of tumor cells by macrophages. PubMed Search: CD47 SIRPA cancer
- LGALS9_HAVCR2 (Galectin-9-TIM-3 axis): This pathway contributes to T-cell exhaustion and immune tolerance. UniProt: P17931 (LGALS9_HUMAN)
- IL10_IL10RB: Interleukin-10 signaling is a potent immunosuppressive pathway, often exploited by tumors.
- LAIR1_LILRB3/LILRB4: These interactions involve inhibitory receptors on immune cells, potentially contributing to immune suppression.
- TNF_TNFRSF1A/B: TNF signaling is complex, contributing to both pro- and anti-tumor immunity, but can also promote inflammation and tumor progression.
- Immune Evasion and Immunosuppression: Numerous strong interactions indicate mechanisms by which tumor cells evade immune surveillance and suppress anti-tumor responses. Examples include:
Tumor Growth and Angiogenesis:
- HBEGF_EGFR/HERB2/HERB3: Heparin-binding EGF-like growth factor (HBEGF) binding to EGFR or HER2/HER3 promotes tumor cell proliferation, survival, and migration. GeneCards: HBEGF
- VEGFA_NRP2: Vascular endothelial growth factor A (VEGFA) interaction with Neuropilin-2 (NRP2) is a key pathway for tumor angiogenesis, facilitating new blood vessel formation to supply the growing tumor.
- Inflammation and Macrophage Recruitment: CCL3_CCR1/CCR5 interactions suggest chemokine-mediated recruitment of macrophages and other immune cells to the tumor site, where they can be reprogrammed into pro-tumor TAMs.
- Metabolic Reprogramming: Interactions involving Cholesterol_byDHCR24_RORA, Cholesterol_byLDLR_LRP2, and Dihydrotestosterone_bySRD5A2_AR point towards altered lipid and steroid metabolism within the tumor microenvironment. Cancer cells often exhibit metabolic reprogramming to support their rapid proliferation, and interactions with stromal cells can contribute to this.
- ECM Remodeling and Metastasis: SPP1_CD44 (Osteopontin-CD44) and PLAUR_uPAR (uPA-uPAR) signaling are involved in cell adhesion, migration, and invasion, facilitating tumor metastasis.
The absence of Fibroblast, T cell, and B cell interactions in the top 80 pairs for both normal and tumor conditions implies that their interactions, while potentially present, are either less significant or less strong compared to the highlighted interactions involving epithelial cells, endothelial cells, and macrophages under the applied cutoffs and ranking.
Clinical or Translational Implications
The distinct and prominent cell-cell interaction patterns observed in the tumor microenvironment of RCC offer several compelling targets for therapeutic intervention and opportunities for experimental validation.
- Immunotherapeutic Targets: The strong presence of immune-modulatory interactions presents high-priority targets:
- SIRPA-CD47 blockade: Interrupting this "don't eat me" signal could promote macrophage-mediated phagocytosis of tumor cells, synergizing with existing immunotherapies. PubMed Search: CD47 SIRPA cancer immunotherapy
- LGALS9-HAVCR2 (TIM-3) pathway inhibition: Blocking this interaction could reverse T-cell exhaustion, enhancing anti-tumor immune responses. PubMed Search: LGALS9 HAVCR2 cancer therapy
- IL-10 signaling inhibition: Targeting IL-10 or its receptor could reduce immunosuppression in the TME.
- Macrophage Reprogramming: Given the extensive macrophage involvement, strategies to deplete TAMs, block their recruitment (e.g., via CCL3_CCR1/CCR5), or reprogram them from a pro-tumor to an anti-tumor phenotype could be highly effective.
- Targeting Tumor Growth and Angiogenesis:
- EGFR/HER pathway inhibitors: The activation of HBEGF_EGFR/HERB2/HERB3 signaling reinforces the rationale for utilizing EGFR/HER2 inhibitors, which are established anticancer agents, potentially in combination therapies for RCC.
- VEGFA-NRP2 blockade: Targeting the VEGFA_NRP2 axis could complement existing anti-VEGF therapies by inhibiting angiogenesis and reducing tumor blood supply. UniProt: P15692 (VEGFA_HUMAN)
- Metabolic Intervention: The identified lipid and steroid metabolism-related CCIs suggest that targeting these metabolic pathways, possibly through specific enzyme inhibitors or dietary interventions, could be explored as a novel therapeutic strategy in RCC.
- Inhibiting Metastasis: Targeting interactions like SPP1_CD44 or PLAUR_uPAR could potentially impede tumor cell migration, invasion, and metastasis, offering avenues for preventing disease progression.
These findings provide a basis for prioritizing specific ligand-receptor pairs for further experimental validation in in vitro and in vivo models of RCC, and for exploring their potential as biomarkers for disease progression or response to therapy.
13. Cell-Cell Interaction Analysis of Immune Checkpoint and Cell Cycle Genes in Renal Cell Carcinoma
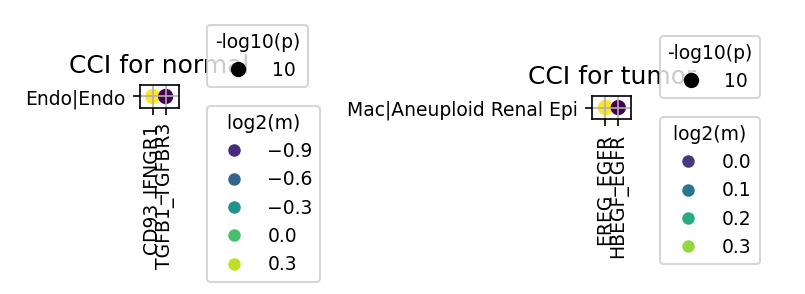
[Analysis Visualization Results]...
Analysis Overview
This analysis investigates significant cell-cell interactions (CCIs) involving a curated list of genes associated with immune checkpoint and cell cycle pathways, comparing interactions in 'normal' kidney tissue versus 'tumor' tissue. The data originates from single-cell RNA sequencing of human kidney samples, with an inferred disease context of Renal Cell Carcinoma, characterized by the presence of tumor-origin Renal Epithelial cells and aneuploidy. The plot_cci_dots tool was used to visualize these interactions, focusing on highly significant ligand-receptor pairs between specific cell types. The analysis aims to highlight key communication pathways that may be altered in the tumor microenvironment.
Visual Summary
The provided visualizations display selected highly significant cell-cell interactions for the target immune checkpoint and cell cycle genes, aggregated by 'normal' and 'tumor' conditions. The size of each dot represents the -log10(p-value) of the interaction (with larger dots indicating higher statistical significance), and the color represents the log2-transformed mean expression of the ligand-receptor pair (with yellow indicating higher mean expression and dark blue indicating lower mean expression).
- CCI for normal condition:
- Cell Pair: Endothelial cell interacting with Endothelial cell (Endo|Endo).
- Gene Pairs: Two significant interactions are displayed: CD93_IFNGR1 and TGFB1_TGFBR3.
- Significance and Expression: Both CD93_IFNGR1 and TGFB1_TGFBR3 show high statistical significance (large dot size, indicating -log10(p) ~ 10). The TGFB1_TGFBR3 interaction exhibits a high mean expression level (yellow color, log2(m) ~ 0.3), while CD93_IFNGR1 shows a lower mean expression level (dark blue color, log2(m) ~ -0.9).
- CCI for tumor condition:
- Cell Pair: Macrophage interacting with Aneuploid Renal Epithelial cell (Mac|Aneuploid Renal Epi). The 'Aneuploid Renal Epi' cell type is consistent with the inferred tumor-origin cell type in Renal Cell Carcinoma.
- Gene Pair: One highly significant interaction is displayed: HBEGF_EGFR.
- Significance and Expression: The HBEGF_EGFR interaction demonstrates high statistical significance (large dot size, indicating -log10(p) ~ 10) and a high mean expression level (yellow color, log2(m) ~ 0.3).
Biological Interpretation
The analysis reveals distinct and highly significant cell-cell interaction patterns in normal kidney tissue compared to the renal tumor microenvironment, specifically involving genes related to cell cycle and immune regulation.
Normal Tissue Homeostasis (Endo|Endo interactions):
- The prominent TGFB1_TGFBR3 interaction between endothelial cells in normal tissue suggests active autocrine/paracrine TGF-beta signaling within the vasculature. TGF-beta is a pleiotropic cytokine essential for maintaining vascular integrity, regulating angiogenesis, and mediating cell growth and differentiation in a context-dependent manner. TGFBR3 (betaglycan) can modulate TGFB1 signaling, contributing to endothelial cell function and stability UniProt: TGFB1, UniProt: TGFBR3.
- The CD93_IFNGR1 interaction, though with lower mean expression, indicates a statistically significant communication pathway involving CD93, an endothelial cell surface protein involved in angiogenesis and survival, and IFNGR1, a subunit of the interferon-gamma receptor. This suggests a potential role for immune modulation of endothelial cells even in healthy tissue, perhaps in basal immune surveillance or response to minor stresses.
Tumor Microenvironment Remodeling (Mac|Aneuploid Renal Epi interactions):
- The striking HBEGF_EGFR interaction between Macrophages and Aneuploid Renal Epithelial cells in the tumor condition highlights a crucial pro-tumorigenic axis. Heparin-binding EGF-like growth factor (HBEGF) is a potent mitogen that activates the Epidermal Growth Factor Receptor (EGFR) pathway, promoting cell proliferation, survival, and migration.
- Macrophages within the tumor microenvironment (often tumor-associated macrophages or TAMs) are known to secrete various growth factors, including HBEGF, to support tumor growth and progression PubMed search: "tumor associated macrophages HBEGF renal cell carcinoma". The interaction with aneuploid renal epithelial cells directly implicates this pathway in the characteristic features of Renal Cell Carcinoma, which often exhibits EGFR pathway activation and is driven by uncontrolled epithelial cell proliferation.
The shift in predominant ligand-receptor interactions from maintaining endothelial homeostasis in normal tissue to promoting tumor cell growth via macrophage-tumor cell crosstalk in the tumor environment underscores how the tumor hijacks and reshapes cellular communication pathways using genes critical for growth regulation.
Clinical or Translational Implications
The observed cell-cell interactions provide potential avenues for therapeutic intervention and biomarker development in Renal Cell Carcinoma.
- Targeting the HBEGF-EGFR Axis in RCC: The highly significant and highly expressed HBEGF_EGFR interaction between macrophages and aneuploid renal epithelial cells in tumor tissue strongly suggests that this axis could be a valuable therapeutic target. EGFR inhibitors are approved for various cancers, and specific targeting of HBEGF or the HBEGF-EGFR binding in RCC could reduce tumor cell proliferation and survival. This highlights a need for exploring combination therapies that target both tumor cells and the supportive tumor microenvironment. GeneCards: HBEGF, GeneCards: EGFR
- Modulating Tumor-Associated Macrophages (TAMs): The involvement of macrophages in providing pro-tumorigenic signals via HBEGF emphasizes the importance of TAMs in RCC progression. Strategies to deplete TAMs, reprogram their phenotype, or block their pro-tumorigenic signaling (e.g., HBEGF secretion) could complement existing therapies and improve patient outcomes.
- Considerations for TGF-beta Pathway Targeting: While TGF-beta signaling is often implicated in tumor progression, the strong TGFB1_TGFBR3 interaction observed in normal endothelial cells highlights its crucial role in healthy tissue. This suggests that broad systemic inhibition of TGF-beta signaling might lead to off-target effects on normal vasculature and other healthy tissues, warranting caution and potentially more targeted approaches if TGF-beta inhibition is pursued in RCC.
14. Condition-Specific Cell-Cell Interaction Patterns in Renal Cell Carcinoma
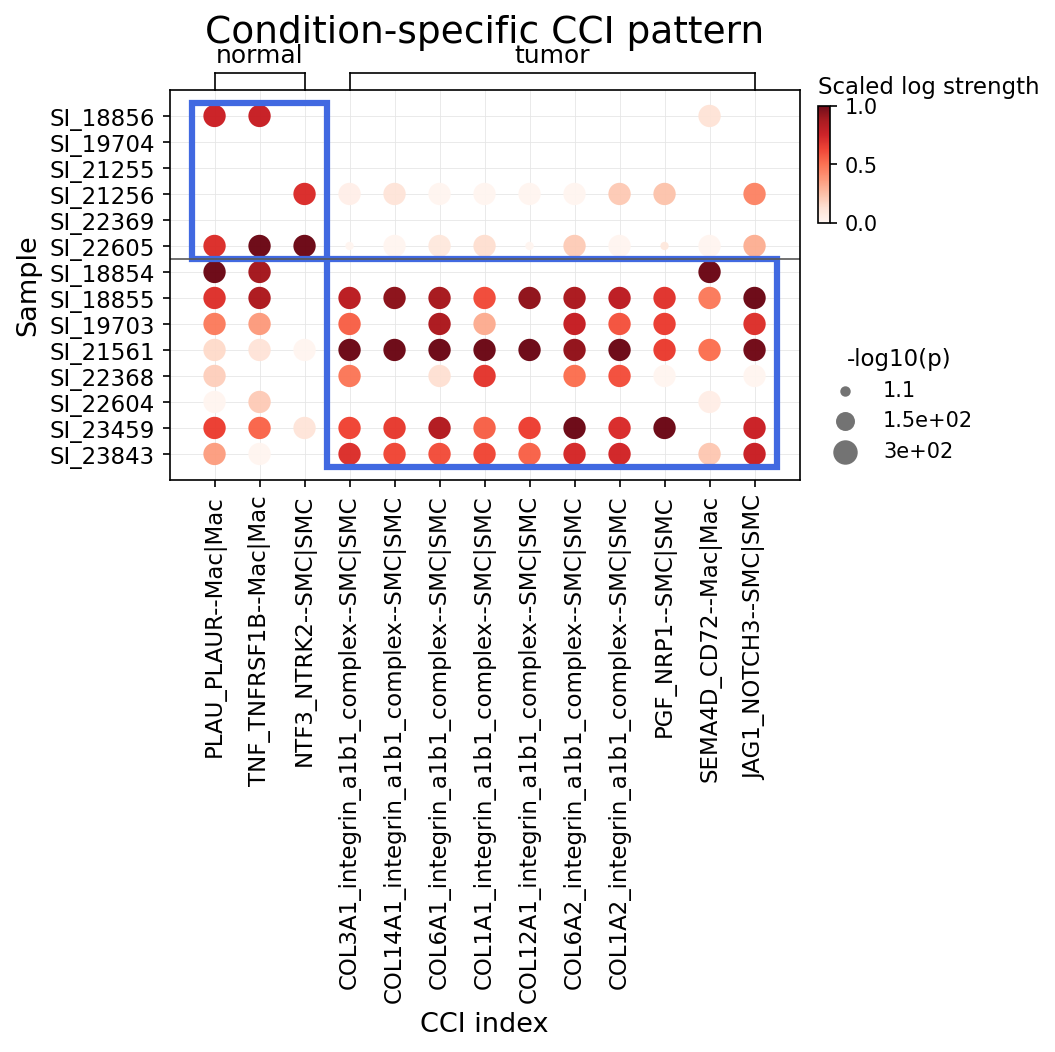
[Analysis Visualization Results]...
Analysis Overview
This analysis investigates cell-cell interactions (CCI) between major immune and stromal cell types (Myeloid cell, T cell, Endothelial cell, Stromal cell, Mast cell, B cell) that show significant differences between normal and tumor kidney tissues. The results are visualized as a dot plot, where dot size represents the significance of the interaction (-log10(p)) and dot color indicates the scaled log strength of the interaction. This helps identify key communicative pathways altered in the tumor microenvironment (TME) of Renal Cell Carcinoma (RCC).
Visual Summary
The dot plot, titled "Condition-specific CCI pattern," effectively highlights distinct cell-cell interaction landscapes between normal and tumor conditions.
- Normal Condition: In the 'normal' samples (top left quadrant), cell-cell interactions are generally sparser and exhibit lower interaction strengths (lighter red colors) and smaller dot sizes, indicating fewer significant and weaker interactions compared to the tumor condition. Some notable interactions are observed, such as EFNB1-EPHA4--Endo|Endo and PLAU-PLAUR--Endo|Mac, suggesting baseline tissue homeostasis and immune surveillance.
- Tumor Condition: A dramatic increase in both the number and strength of cell-cell interactions is evident in the 'tumor' samples (bottom right quadrant). Most tumor samples display a dense cluster of large, dark red dots, particularly involving interactions between Endothelial cells (Endo) and Smooth Muscle Cells (SMC), and also within Endothelial cells (Endo|Endo) and Macrophages (Endo|Mac, Mac|Mac). This indicates a highly active and remodelled tumor microenvironment.
Key Interaction Categories in Tumor:
- Extracellular Matrix (ECM) Interactions: A large cluster of strong interactions involves various Collagen (COL1A1, COL3A1, COL4A1/A2, COL6A2, COL15A1, COL18A1) and Fibronectin (FN1) ligands interacting with Integrin complexes (e.g., integrin_a1b1, integrin_a5b1, integrin_avb5, integrin_avb1) primarily between Endothelial cells and Smooth Muscle Cells. These interactions are almost universally strong and significant across all tumor samples.
- Notch Signaling: Multiple Notch ligand-receptor pairs, including JAG1-NOTCH1/2/3/4, JAG2-NOTCH1/2/3/4, and DLL1-NOTCH3/4, are highly active, predominantly between Endothelial cells and Smooth Muscle Cells, and also among Endothelial cells or with Macrophages.
- Growth Factor Signaling: Interactions such as PDGFB-PDGFRB (Endo|SMC), VEGFA-FLT1 (Endo|Endo), ANGPT2-TEK (Endo|Endo), and PGF-NRP1/NRP2 (Endo|SMC) are notably strong in tumor samples, underscoring active angiogenesis and stromal support.
- Immune Cell Interactions: While less prominent than the stromal-endothelial interactions, some interactions involving immune cells like PLAU-PLAUR (Endo|Mac) and TNF-TNFRSF1B (Mac|Mac) show increased activity in the tumor context, indicating immune modulation.
Overall, the visualization clearly demonstrates a profound shift in cell-cell communication patterns from a relatively quiescent normal state to a highly interconnected and active tumor microenvironment, particularly emphasizing interactions critical for angiogenesis, ECM remodeling, and cell fate regulation.
Biological Interpretation
The observed surge in cell-cell interactions in the tumor condition reflects the complex and dynamic nature of the Renal Cell Carcinoma (RCC) tumor microenvironment (TME), which is critical for tumor progression.
- Extracellular Matrix Remodeling and Cell Adhesion (Collagen/Fibronectin-Integrin Axes):
- Mechanism: Integrins are transmembrane receptors that link the extracellular matrix (ECM) to the intracellular cytoskeleton, mediating cell adhesion, migration, proliferation, and survival. Collagens and Fibronectin are major structural components of the ECM. The robust interactions between various collagen and fibronectin ligands and integrin complexes (e.g., COL1A1/FN1-integrin_a1b1_complex) predominantly between Endothelial cells and Smooth Muscle Cells in tumor samples highlight significant ECM remodeling and altered cell-matrix adhesion. This process is crucial for neo-angiogenesis, tumor cell invasion, and the recruitment and differentiation of stromal cells, which often contribute to a desmoplastic reaction. These interactions trigger downstream signaling pathways (e.g., FAK, Src, Rho GTPases) that promote cell survival and migration [1].
- Context in RCC: RCCs, particularly clear cell RCCs, are often highly vascularized with extensive ECM remodeling, facilitating tumor growth and metastasis. The interactions between endothelial cells (forming new vessels) and smooth muscle cells (often involved in vessel maturation or pericyte function) are integral to these processes.
Notch Signaling for Angiogenesis and Cell Fate:
- Mechanism: Notch signaling is a conserved cell-to-cell communication pathway that plays a critical role in development, tissue homeostasis, and disease, including cancer. Ligands (JAG1, JAG2, DLL1) on one cell bind to Notch receptors (NOTCH1-4) on an adjacent cell, leading to sequential proteolytic cleavages of the receptor, releasing the Notch intracellular domain (NICD). NICD then translocates to the nucleus to regulate target gene expression, influencing cell proliferation, differentiation, and survival. In the context of angiogenesis, Notch signaling is essential for coordinating endothelial cell behavior, regulating tip versus stalk cell specification, and vessel maturation [2].
- Context in RCC: Dysregulated Notch signaling is implicated in RCC pathogenesis, promoting tumor angiogenesis and proliferation. The strong Notch interactions between Endothelial cells, Smooth Muscle Cells, and Macrophages suggest its involvement in orchestrating the angiogenic switch and shaping the cellular composition of the TME.
Growth Factor Signaling in Angiogenesis and Stromal Support:
Mechanism:
- PDGFB-PDGFRB: Platelet-Derived Growth Factor B (PDGFB) is a potent chemokine and mitogen for mesenchymal cells. Its interaction with PDGFRB on Smooth Muscle Cells, often released by Endothelial cells, drives the recruitment and differentiation of pericytes or smooth muscle cells, which are crucial for stabilizing newly formed tumor blood vessels.
- VEGFA-FLT1 (VEGFR1) and ANGPT2-TEK (TIE2): VEGFA and ANGPT2 are key regulators of angiogenesis. VEGFA-FLT1 interactions primarily on Endothelial cells promote endothelial cell survival, proliferation, and migration. ANGPT2, in conjunction with VEGFA, can promote vessel destabilization and sprouting or, conversely, vessel maturation depending on the context and expression of its receptor TEK (TIE2) [3].
- PGF-NRP1/NRP2: Placental Growth Factor (PGF) is structurally similar to VEGFA and binds to VEGFR1 (FLT1) and co-receptors Neuropilins (NRP1/NRP2) to stimulate angiogenesis and increase vascular permeability.
- Context in RCC: RCC, particularly clear cell RCC, is notoriously hypervascular due to mutations (e.g., in VHL gene) leading to constitutive activation of HIF and subsequent overexpression of angiogenic factors like VEGFA and PDGFB. These interactions are the hallmarks of aggressive angiogenesis in RCC.
Immune Cell Cross-talk and TME Modulation:
- PLAU-PLAUR (uPA-uPAR): The Urokinase Plasminogen Activator (PLAU) and its receptor (PLAUR) system is a critical component of pericellular proteolysis, facilitating ECM degradation and cell migration. Interactions between Endothelial cells and Macrophages suggest their coordinated roles in matrix remodeling, immune cell infiltration, and tumor invasion [4].
- TNF-TNFRSF1B: Tumor Necrosis Factor (TNF) family ligands and receptors are central to inflammatory and immune responses. Interactions between Macrophages could indicate their activation state or involvement in chronic inflammation within the TME, which can be pro-tumorigenic.
- TNFSF10 (TRAIL)-TNFRSF10A/10B (TRAIL-R1/R2): TRAIL signaling can induce apoptosis in susceptible cells, but also has non-apoptotic roles that can modulate immune responses or contribute to tumor survival in resistant cells.
Clinical or Translational Implications
The identified cell-cell interactions represent promising targets for therapeutic intervention in Renal Cell Carcinoma.
Targeting Angiogenesis:
- The prominent role of VEGFA, PGF, ANGPT2, and PDGFB signaling underscores the importance of anti-angiogenic therapies.
- Therapeutic Agents: Multi-kinase inhibitors targeting VEGFRs (e.g., sunitinib, pazopanib, axitinib, cabozantinib, lenvatinib) and anti-VEGF antibodies (e.g., bevacizumab) are standard-of-care in RCC. Agents like lenvatinib also target FGFR, KIT, PDGFR, and RET, highlighting the benefit of broader inhibition [5]. Further research could explore specific inhibitors for PGF-NRP1/NRP2 and ANGPT2-TEK pathways to enhance anti-angiogenic effects. [PubMed Search: "VEGFR inhibitors renal cell carcinoma"]
Inhibiting ECM Remodeling and Integrin Signaling:
- The extensive collagen/fibronectin-integrin interactions suggest that targeting these pathways could disrupt tumor progression, invasion, and angiogenesis.
- Therapeutic Agents: Integrin inhibitors, such as specific antibodies or small molecules, could block tumor cell adhesion, migration, and survival, as well as normalize the TME. While clinical success for pan-integrin inhibitors has been mixed, targeting specific integrin subtypes (e.g., αvβ3, α5β1) or the enzymes responsible for ECM deposition/cross-linking could be beneficial. [PubMed Search: "integrin inhibitors cancer therapy"]
Modulating Notch Signaling:
- The widespread activation of Notch interactions in the tumor TME suggests Notch pathway inhibition as a therapeutic strategy.
- Therapeutic Agents: Gamma-secretase inhibitors (GSIs) prevent the cleavage and activation of Notch receptors, and monoclonal antibodies targeting Notch receptors or ligands are under investigation in various cancer types. Inhibiting Notch signaling could suppress angiogenesis, proliferation, and potentially sensitize tumor cells to other therapies. [PubMed Search: "Notch signaling cancer therapy"]
Reprogramming the Tumor Immune Microenvironment:
- Interactions involving macrophages and other immune cells (e.g., PLAU-PLAUR, TNF-TNFRSF1B) indicate opportunities to modulate immune responses.
- Therapeutic Agents: Strategies aimed at repolarizing pro-tumorigenic (M2-like) macrophages or inhibiting immune checkpoint pathways could be considered. Combining immune checkpoint inhibitors with anti-angiogenic agents is already a successful strategy in RCC, and these CCI findings provide further mechanistic insights into why this combination works. [PubMed Search: "macrophage targeting cancer therapy"]
Biomarker Discovery and Combination Therapies:
- These specific CCI patterns could serve as prognostic biomarkers or predict response to specific targeted or immunotherapies. Given the complexity and redundancy of TME signaling, combination therapies targeting multiple key pathways (e.g., anti-angiogenic agents with Notch or integrin inhibitors) are likely to yield more robust and durable responses in RCC patients.
---
References:
- Integrin Signaling in Cancer:
PubMed Search: "integrin signaling cancer"
- Notch Signaling in Cancer Angiogenesis:
PubMed Search: "Notch signaling angiogenesis cancer"
- Angiopoietin-Tie2 System in Tumor Angiogenesis:
PubMed Search: "Angiopoietin Tie2 tumor angiogenesis"
- uPA-uPAR System in Cancer Progression:
PubMed Search: "uPA uPAR cancer progression"
- Targeted Therapies for Renal Cell Carcinoma:
PubMed Search: "targeted therapy renal cell carcinoma"
15. Renal Epithelial Cell Condition-Specific Surfaceome Markers in Kidney Tumor
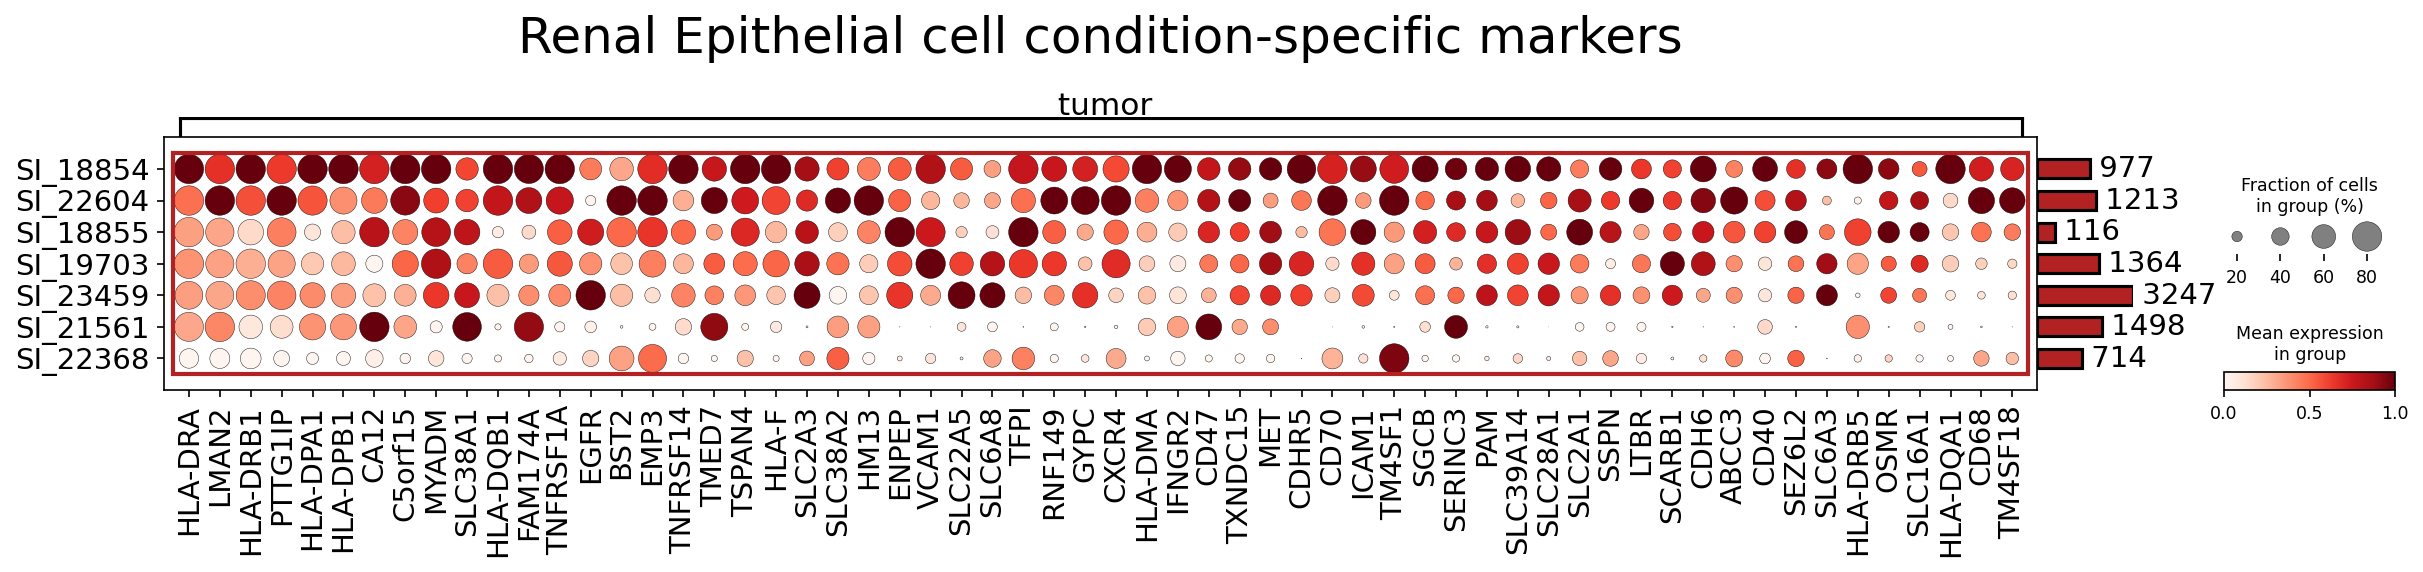
[Analysis Visualization Results]...
Analysis Overview
This analysis identifies and visualizes surfaceome markers specifically expressed in Renal Epithelial cells, comparing 'normal' and 'tumor' conditions within kidney tissue. The goal is to highlight potential diagnostic, prognostic, and therapeutic targets. The dot plot displays the mean expression level (color intensity) and the fraction of cells expressing each marker (dot size) across different samples classified as either 'normal' or 'tumor'. The Renal Epithelial cell type is designated as the tumor-origin cell type for the inferred Renal Cell Carcinoma context.
Visual Summary
The dot plot clearly differentiates two major groups of Renal Epithelial cells based on their surfaceome marker expression:
- Normal-specific markers (top-left red box): A cluster of markers, including EPCAM, CLDN10, DPEP1, SLC22A8, GPR160, PTH1R, BCAM, and TACSTD2, exhibit high expression levels (dark red dots) and high prevalence (large dot size) in Renal Epithelial cells from 'normal' samples (SI_18856, SI_22605, SI_21256, SI_19704). Conversely, their expression is largely absent or very low in cells from 'tumor' samples.
- Tumor-specific markers (bottom-right red box): A distinct and much larger cluster of markers shows high expression and prevalence specifically in Renal Epithelial cells from 'tumor' samples (SI_18854, SI_22604, SI_18855, SI_19703, SI_23459, SI_21561, SI_22368). These include genes like HLA-DRA, LMAN2, CD151, PTTG1IP, CA12, EGFR, MET, CD47, CD70, and various MHC class II related genes (HLA-DRB1, HLA-DPA1, HLA-DPB1, HLA-DQB1). Their expression is minimal or absent in 'normal' cells.
The observed patterns indicate a significant molecular rewiring of the cell surface proteome in Renal Epithelial cells transitioning from a normal to a tumor state, providing a robust set of differentially expressed surface markers.
Biological Interpretation
The distinct expression profiles of surfaceome markers in normal versus tumor Renal Epithelial cells align with the inferred diagnosis of Renal Cell Carcinoma (RCC). These markers offer insights into altered cellular functions, immune evasion, and potential vulnerabilities in tumor cells.
Markers Upregulated in Normal Renal Epithelial Cells
While the focus is often on tumor-specific targets, understanding markers lost in cancer can also provide insights into disease progression or identify subsets.
EPCAM (Epithelial Cell Adhesion Molecule)
- Pathway/Mechanism: EPCAM is a homophilic cell adhesion molecule involved in cell proliferation, differentiation, and tissue architecture maintenance. It is commonly expressed on normal epithelial cells. Its downregulation in tumor cells, as observed here, can signify a loss of epithelial characteristics, often associated with epithelial-mesenchymal transition (EMT), which promotes cell motility, invasion, and metastasis in cancer.
- Therapeutic Agents: Antibody-drug conjugates (ADCs) and bispecific antibodies targeting EPCAM have been explored in other cancers where EPCAM is overexpressed. However, its downregulation in this RCC context suggests that the tumor cells might have lost the target, potentially reducing the efficacy of such agents unless specifically targeting residual EPCAM-positive cells or specific RCC subtypes.
- Evidence: GeneCards: https://www.genecards.org/cgi-bin/carddisp.pl?gene=EPCAM. For EPCAM in cancer and EMT: PubMed search for "EPCAM epithelial-mesenchymal transition cancer"
TACSTD2 (TROP2)
- Pathway/Mechanism: TROP2 is a transmembrane glycoprotein involved in cell proliferation, invasion, and survival. While often overexpressed in various epithelial cancers (e.g., breast, lung), driving tumor growth and metastasis, its higher expression in normal Renal Epithelial cells compared to tumor cells in this dataset is noteworthy. This might suggest a specific subtype of RCC or a stage where TROP2 expression is lost by tumor cells.
- Therapeutic Agents: Antibody-drug conjugates (ADCs) like Sacituzumab govitecan (Trodelvy) successfully target TROP2 in other cancer types. If TROP2 expression is indeed lost or significantly reduced in a majority of RCC tumor cells, its utility as a direct therapeutic target might be limited for these particular tumor cells, but it could serve as a marker to differentiate normal from tumor tissue or identify specific tumor subsets.
- Evidence: GeneCards: https://www.genecards.org/cgi-bin/carddisp.pl?gene=TACSTD2. For TROP2-targeting ADCs: PubMed search for "TROP2 ADC cancer therapy"
Markers Upregulated in Tumor Renal Epithelial Cells
These markers are highly relevant as potential diagnostic, prognostic, and therapeutic targets in Renal Cell Carcinoma.
Established Therapeutic Targets
EGFR (Epidermal Growth Factor Receptor)
- Pathway/Mechanism: EGFR is a receptor tyrosine kinase that, upon ligand binding (e.g., EGF), activates downstream signaling pathways such as MAPK/ERK and PI3K/Akt, promoting cell proliferation, survival, angiogenesis, and metastasis. Overexpression and activation of EGFR are common oncogenic drivers in many cancers.
- Therapeutic Agents: Tyrosine kinase inhibitors (TKIs, e.g., erlotinib, gefitinib) and monoclonal antibodies (mAbs, e.g., cetuximab, panitumumab) targeting EGFR are widely used in other cancer types. While EGFR-targeted monotherapy has shown limited success in RCC, it is an established pathway frequently dysregulated in tumors, and combination therapies are under investigation.
- Evidence: GeneCards: https://www.genecards.org/cgi-bin/carddisp.pl?gene=EGFR. For EGFR in RCC: PubMed search for "EGFR renal cell carcinoma therapy"
MET (Hepatocyte Growth Factor Receptor)
- Pathway/Mechanism: MET is a receptor tyrosine kinase activated by its ligand HGF, leading to diverse cellular responses including cell proliferation, survival, invasion, angiogenesis, and metastasis. Dysregulation of the MET pathway, often through overexpression or activating mutations, is a known oncogenic event in RCC, contributing to aggressive disease.
- Therapeutic Agents: Multi-kinase inhibitors with MET activity (e.g., cabozantinib) are approved for advanced RCC, targeting MET alongside VEGFR2 and AXL. Selective MET inhibitors (e.g., tepotinib, capmatinib) are also approved for MET-driven non-small cell lung cancer and are being explored in other cancers.
- Evidence: GeneCards: https://www.genecards.org/cgi-bin/carddisp.pl?gene=MET. For MET in RCC therapy: PubMed search for "MET inhibitor renal cell carcinoma"
CD47 ("Don't Eat Me" Signal)
- Pathway/Mechanism: CD47 is a transmembrane glycoprotein that interacts with SIRPα on myeloid cells (e.g., macrophages), transmitting an inhibitory signal that prevents phagocytosis. Many cancer cells upregulate CD47 to evade immune surveillance by macrophages. Its high expression on tumor Renal Epithelial cells suggests a mechanism of immune escape.
- Therapeutic Agents: Anti-CD47 monoclonal antibodies (e.g., magrolimab, lemzoparlimab) are in clinical trials for various solid tumors and hematological malignancies. These agents aim to block the CD47-SIRPα interaction, allowing macrophages to recognize and engulf tumor cells, thus reactivating innate anti-tumor immunity.
- Evidence: GeneCards: https://www.genecards.org/cgi-bin/carddisp.pl?gene=CD47. For CD47 as a therapeutic target: PubMed search for "CD47 inhibitor cancer immunotherapy"
CA12 (Carbonic Anhydrase XII)
- Pathway/Mechanism: Carbonic anhydrases are enzymes that catalyze the reversible hydration of CO2. CAXII, a transmembrane isoform, contributes to pH regulation. In clear cell RCC (ccRCC), often driven by VHL mutations and HIF activation, CAXII (along with CAIX) is frequently overexpressed. This overexpression helps maintain an acidic extracellular tumor microenvironment, which supports tumor growth, invasion, and immune evasion.
- Therapeutic Agents: While specific CAXII inhibitors are less developed compared to CAIX inhibitors, the broad class of carbonic anhydrase inhibitors has been investigated. CAIX inhibitors are in clinical trials and are particularly relevant for ccRCC. CAXII's co-expression and similar function make it a strong candidate for targeted approaches aiming to normalize tumor pH and inhibit tumor progression.
- Evidence: GeneCards: https://www.genecards.org/cgi-bin/carddisp.pl?gene=CA12. For CAXII in RCC biology: PubMed search for "renal cell carcinoma CA12 CAIX"
Less Well-Characterized Markers with Potential as Therapeutic Targets
CD151 (Tetraspanin-151)
- Pathway/Mechanism: CD151 is a member of the tetraspanin family, functioning as a molecular organizer on the cell surface. It forms complexes with integrins and other transmembrane proteins, influencing cell adhesion, migration, invasion, and metastatic potential. Its overexpression is frequently associated with increased tumor aggressiveness and poor prognosis in many cancers, including RCC.
- Therapeutic Agents: Currently, no approved therapies directly target CD151. However, its crucial role in cancer cell motility and invasion makes it an attractive candidate for novel antibody-based therapies or ADCs designed to disrupt its function or deliver cytotoxic payloads.
- Evidence: GeneCards: https://www.genecards.org/cgi-bin/carddisp.pl?gene=CD151. For CD151 in cancer metastasis: PubMed search for "CD151 cancer metastasis"
VCAM1 (Vascular Cell Adhesion Molecule 1)
- Pathway/Mechanism: VCAM1 (CD106) is a cell surface glycoprotein that mediates cell-cell adhesion, primarily by binding to integrin α4β1 (VLA-4). While typically expressed on endothelial cells, its upregulation on tumor cells can play a dual role: facilitating immune cell infiltration into the tumor microenvironment or, conversely, promoting tumor cell extravasation and metastasis. Its presence on tumor Renal Epithelial cells suggests altered cell adhesion properties critical for tumor progression.
- Therapeutic Agents: Antibodies targeting VCAM1 have been explored in inflammatory diseases. In cancer, approaches could involve blocking VCAM1 to inhibit metastasis or using it as a target for ADCs to deliver therapies specifically to VCAM1-positive tumor cells.
- Evidence: GeneCards: https://www.genecards.org/cgi-bin/carddisp.pl?gene=VCAM1. For VCAM1 in cancer: PubMed search for "VCAM1 cancer metastasis"
- HLA-DRA, HLA-DRB1, HLA-DPA1, HLA-DPB1, HLA-DQB1 (MHC Class II Genes)
- Pathway/Mechanism: Major Histocompatibility Complex (MHC) Class II molecules are central to adaptive immunity, presenting exogenous antigens to CD4+ T helper cells. While usually restricted to professional antigen-presenting cells (APCs), ectopic expression of MHC Class II on tumor cells, as seen here, is a complex phenomenon. It can sometimes indicate an attempt by tumor cells to present antigens and initiate an anti-tumor immune response, or it might be a mechanism to engage specific immune cells, potentially contributing to immune evasion or specific inflammatory states within the tumor microenvironment.
- Therapeutic Agents: These are not direct therapeutic targets in the conventional sense. However, their expression on tumor cells has significant implications for immunotherapy. Understanding their role can inform strategies for T-cell engaging therapies, vaccine development, or predict responsiveness to immune checkpoint inhibitors.
- Evidence: GeneCards: https://www.genecards.org/cgi-bin/carddisp.pl?gene=HLA-DRA. For MHC Class II on tumor cells and immune response: PubMed search for "MHC Class II tumor expression immunotherapy"
Clinical or Translational Implications
The identification of these condition-specific surfaceome markers in Renal Epithelial cells carries significant clinical and translational implications for Renal Cell Carcinoma:
- Diagnostic and Prognostic Biomarkers: Markers like EPCAM and TACSTD2 (if lost in tumor) or EGFR, MET, CD47, and CA12 (if gained in tumor) could serve as valuable biomarkers for early detection, differentiation of tumor from normal tissue, and potentially for monitoring disease progression or recurrence, especially when combined with imaging or liquid biopsy approaches.
- Therapeutic Target Identification:
- Established Targets: The high expression of EGFR, MET, CD47, and CA12 in tumor cells highlights their potential as therapeutic targets in RCC. Existing drugs (e.g., MET inhibitors like cabozantinib, anti-CD47 antibodies) or those in advanced development could be directly applicable or explored further in RCC.
- Novel/Emerging Targets: Markers like CD151 and VCAM1 represent promising novel targets. Their roles in cell adhesion, migration, and metastasis make them attractive candidates for developing new antibody-drug conjugates (ADCs) or specific blocking antibodies to inhibit tumor progression and spread.
- Immunotherapy Strategy Refinement: The upregulation of MHC Class II genes (HLA-DRA, etc.) on tumor cells provides an intriguing insight into tumor-immune interactions. While not direct drug targets, their presence might influence the efficacy of various immunotherapies by affecting antigen presentation to T cells. Further studies are warranted to understand if this expression is protective, permissive for immune evasion, or indicative of an immune-responsive tumor phenotype.
- Targeting Heterogeneity: The dot plot reveals sample-to-sample variability in marker expression. This underscores the importance of considering tumor heterogeneity in treatment strategies. A subset of markers might be highly expressed in certain patients but not others, suggesting the need for personalized medicine approaches based on individual tumor marker profiles.
Overall, this analysis provides a rich resource of surfaceome markers in Renal Epithelial cells that are differentially expressed between normal and tumor conditions, paving the way for further investigation into their roles in RCC biology and their potential translation into clinical applications.
16. Macrophage Condition-Specific Surfaceome Markers in Renal Cell Carcinoma
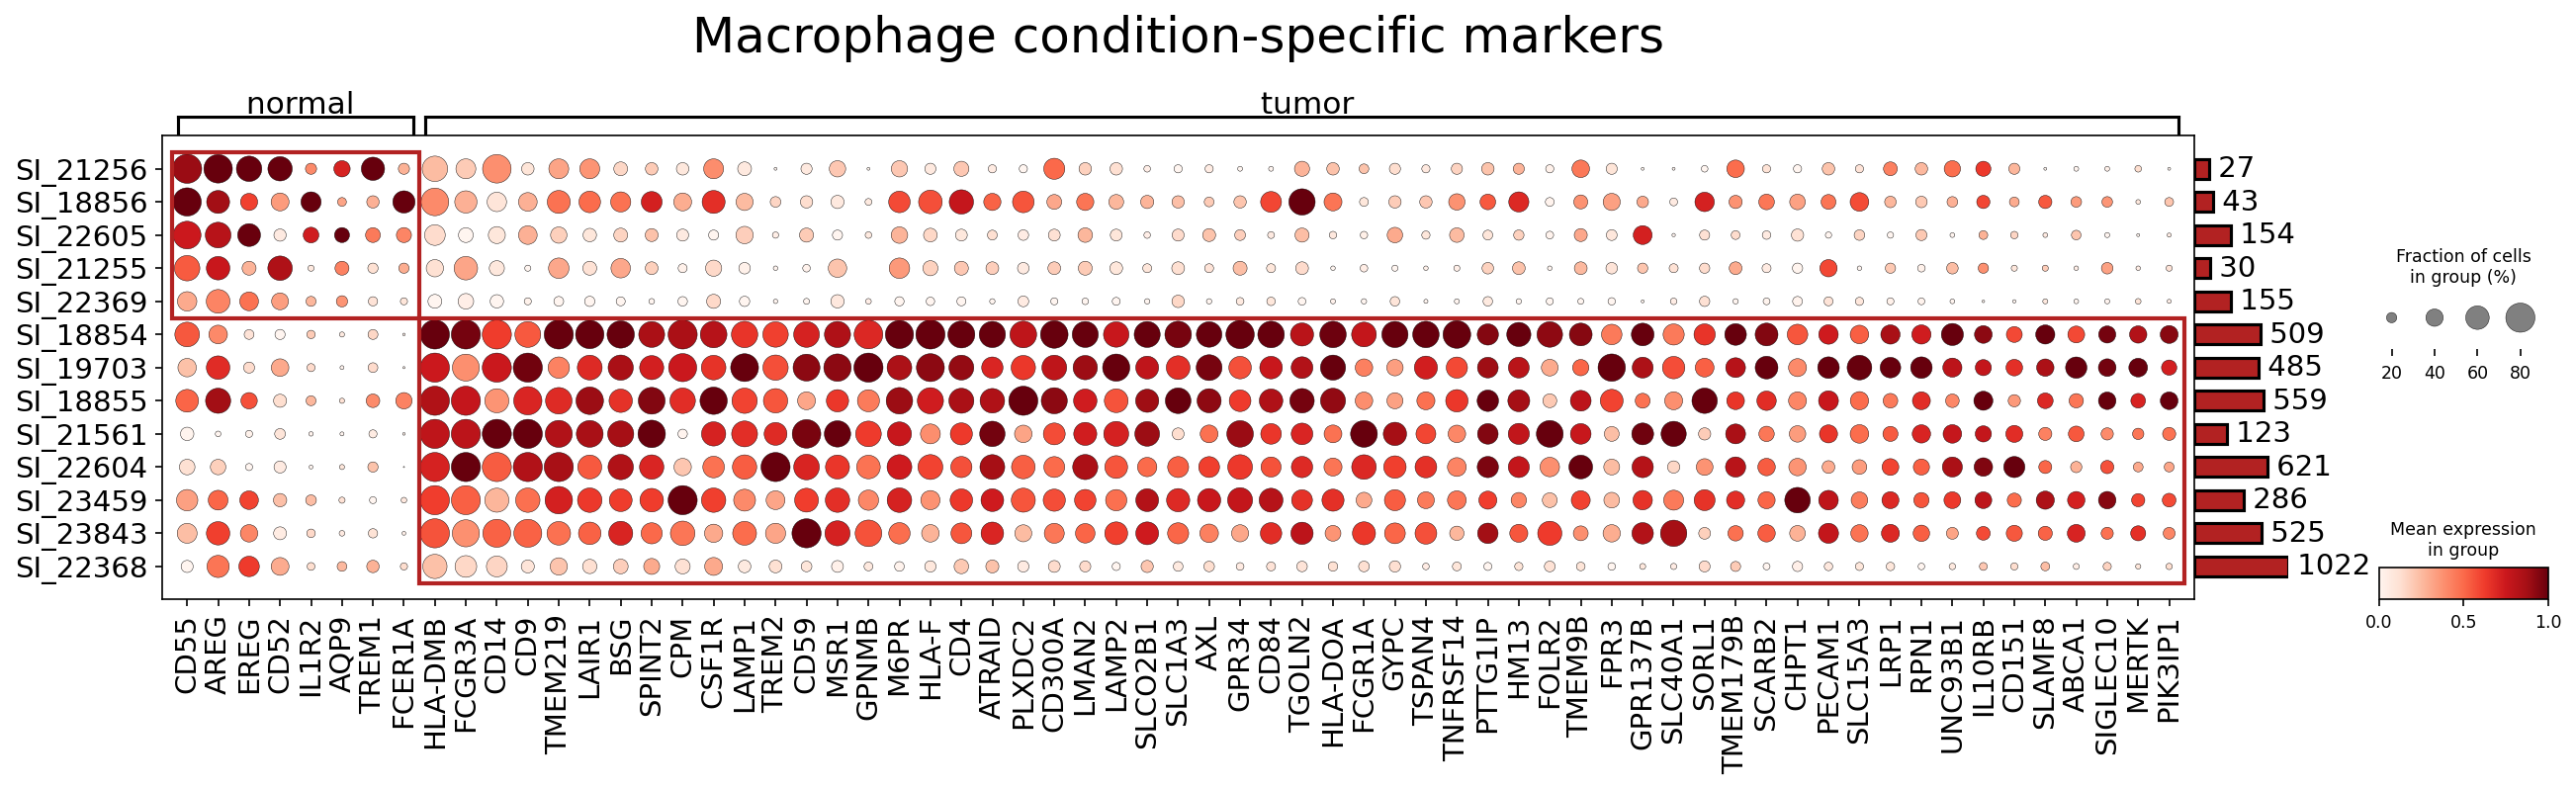
[Analysis Visualization Results]...
Analysis Overview
This analysis identifies surfaceome marker expression in Macrophage cells, comparing 'normal' and 'tumor' conditions within the kidney tissue context. The goal is to uncover differentially expressed surface markers that could serve as biological insights into macrophage function in the tumor microenvironment (TME) of Renal Cell Carcinoma (RCC) and as potential therapeutic targets. The dot plot visualizes the mean expression level (color intensity) and the fraction of cells expressing the marker (dot size) for each gene across different samples clustered by condition. A maximum of 40 surfaceome markers per condition were selected for plotting.
Visual Summary
The dot plot clearly differentiates two major groups of macrophage surface markers based on their expression patterns in 'normal' versus 'tumor' conditions:
- Normal-specific Markers (Top Red Box): A set of genes, including CD55, AREG, EREG, CD52, IL1R2, TREM1, and AQP9, show high mean expression and prevalence across various 'normal' macrophage samples. Their expression is largely absent or very low in 'tumor' macrophages. This suggests a distinct phenotype for macrophages in healthy kidney tissue.
- Tumor-specific Markers (Bottom Red Box): A large cluster of markers, prominently including FCER1A, HLA-DMB, FCGR3A, CD14, CD9, TMEM219, LAIR1, BSG, SPINT2, CPM, CSF1R, LAMP1, TREM2, MSR1, GPNMB, HLA-F, ATRAID, PLXDC2, CD300A, LMAN2, SLC2B1, SLC1A3, AXL, GPR34, CD84, TGOLN2, HLA-DOA, FCGR1A, GPYC, TSPAN4, TNFRSF14, HM13, PTTG1IP, FOLR2, TMEM9B, FPR3, and GPR137B, exhibit significantly higher mean expression and higher cell prevalence in 'tumor' macrophages compared to 'normal' macrophages. These markers represent a distinct phenotypic signature associated with tumor-associated macrophages (TAMs) in RCC.
The overall pattern indicates a profound shift in the surfaceome landscape of macrophages when transitioning from a healthy kidney environment to the RCC TME.
Biological Interpretation
Macrophages are highly plastic immune cells and key players in the tumor microenvironment (TME), often adopting a pro-tumorigenic phenotype (Tumor-Associated Macrophages, TAMs) in various cancers, including Renal Cell Carcinoma (RCC). The observed differential expression of surface markers highlights this phenotypic reprogramming.
Macrophages in the Normal Kidney Microenvironment
Macrophages in the healthy kidney likely contribute to tissue homeostasis, immune surveillance, and debris clearance. The markers predominantly found in 'normal' macrophages reflect these functions:
- CD55 (Decay Accelerating Factor): A complement regulatory protein that protects host cells from complement-mediated damage. Its presence suggests a role in maintaining immune quiescence and preventing aberrant inflammation in normal tissue. UniProt CD55
- AREG (Amphiregulin) and EREG (Epiregulin): Both are ligands for the Epidermal Growth Factor Receptor (EGFR). Their expression may indicate a role in tissue maintenance, repair, or trophic support functions in the healthy kidney, potentially influencing epithelial cell survival or proliferation in a controlled manner. GeneCards AREG, GeneCards EREG
- TREM1 (Triggering Receptor Expressed on Myeloid Cells 1): Typically expressed on myeloid cells, TREM1 amplifies inflammatory responses. Its presence in normal macrophages might indicate a readiness for rapid inflammatory responses against pathogens or tissue damage, which is distinct from the chronic inflammation often seen in cancer. GeneCards TREM1
The downregulation of these markers in tumor-associated macrophages suggests a suppression of their normal homeostatic and acute inflammatory roles.
Tumor-Associated Macrophages (TAMs) in Renal Cell Carcinoma TME
The extensive upregulation of numerous surface markers in 'tumor' macrophages signifies their distinct pro-tumorigenic phenotype, characteristic of TAMs in RCC. These markers collectively point towards roles in immunosuppression, angiogenesis, tumor growth, and metastasis.
Key tumor-associated macrophage markers and their biological implications:
- CSF1R (Colony Stimulating Factor 1 Receptor): This is a critical receptor for macrophage survival, proliferation, and differentiation. High CSF1R expression is a hallmark of M2-like, pro-tumorigenic TAMs, whose accumulation is driven by CSF1 secreted by tumor cells and stromal cells. CSF1R signaling promotes TAM survival, migration, and an immunosuppressive phenotype, contributing to tumor growth, angiogenesis, and metastasis. GeneCards CSF1R
- AXL (AXL Receptor Tyrosine Kinase): AXL is a receptor tyrosine kinase often overexpressed in cancer and TAMs. It binds its ligand GAS6 and promotes cell survival, proliferation, migration, and angiogenesis. In TAMs, AXL signaling can promote an immunosuppressive, M2-like phenotype and contribute to resistance to chemotherapy and immunotherapy. GeneCards AXL
- BSG (Basigin, CD147): This transmembrane glycoprotein regulates matrix metalloproteinases (MMPs), which are crucial for extracellular matrix remodeling and tumor invasion. CD147 on TAMs can facilitate tumor cell invasion and metastasis, and it is also involved in lactate transport, contributing to the acidic TME. GeneCards BSG
- GPNMB (Glycoprotein Non-metastatic Melanoma Protein B): Overexpressed in various cancers and TAMs, GPNMB is involved in cell adhesion, migration, and immune regulation. It can promote tumor progression, angiogenesis, and an immunosuppressive microenvironment. GeneCards GPNMB
- FOLR2 (Folate Receptor Beta): Expressed on activated macrophages, particularly M2-like TAMs, FOLR2 is involved in folate uptake. Its presence marks a distinct population of macrophages contributing to immunosuppression and tumor growth, making it an attractive target for selective drug delivery. GeneCards FOLR2
- TREM2 (Triggering Receptor Expressed on Myeloid Cells 2): TREM2+ TAMs are increasingly recognized in various cancers. They are often associated with an immunosuppressive, pro-tumorigenic phenotype, particularly in contexts of high tumor cell death, where TREM2 facilitates the clearance of apoptotic cells and promotes a wound-healing, pro-tumorigenic response. GeneCards TREM2
- CD14 (Cluster of Differentiation 14): A co-receptor for TLR4, CD14 is highly expressed on monocytes and macrophages. In the TME, CD14+ TAMs are often associated with an M2-like phenotype, contributing to immunosuppression, angiogenesis, and tumor progression. GeneCards CD14
- HLA-DMB, HLA-DOA, HLA-F (MHC Class II molecules): While classical MHC class II molecules (like HLA-DRA, DRB1) are involved in antigen presentation, genes like HLA-DMB, HLA-DOA, and HLA-F are non-classical MHC class II molecules. Their altered expression on TAMs can influence antigen presentation pathways, potentially leading to T cell anergy or immune evasion. HLA-F, in particular, has been implicated in immune checkpoint regulation. PubMed search for HLA-F cancer
- FCGR1A (Fc Gamma Receptor Ia, CD64) and FCGR3A (Fc Gamma Receptor IIIa, CD16a): These Fc receptors bind the Fc region of IgG antibodies. Upregulation on TAMs can reflect their activation state or involvement in antibody-dependent cellular functions. While they can mediate anti-tumor responses (e.g., ADCC), they can also contribute to pro-tumor inflammation depending on the immune complex context. GeneCards FCGR1A, GeneCards FCGR3A
Clinical or Translational Implications
The identification of numerous surface markers highly and specifically expressed on macrophages within the RCC tumor microenvironment opens several avenues for clinical and translational applications:
- Therapeutic Targeting of TAMs:
- CSF1R: Inhibitors targeting CSF1R (e.g., pexidartinib, cabiralizumab, emactuzumab) are in various stages of clinical development for different cancers, aiming to deplete TAMs or reprogram them towards an anti-tumor phenotype. Given its strong upregulation, CSF1R is a prime candidate for TAM-directed therapy in RCC. PubMed search for CSF1R inhibitors cancer
- AXL: AXL inhibitors (e.g., bemcentinib, BGB324) are being investigated, often in combination with chemotherapy or immunotherapy, to overcome resistance and suppress tumor progression by targeting both tumor cells and TAMs. PubMed search for AXL inhibitors cancer
- BSG (CD147) and GPNMB: These are established targets in other cancers. Antibody-drug conjugates (ADCs) targeting CD147 (e.g., metuximab) or GPNMB (e.g., glembatumumab vedotin) could be explored for targeted delivery of cytotoxic agents to TAMs in RCC. PubMed search for CD147 cancer therapy, PubMed search for GPNMB cancer therapy
- FOLR2: Its selective expression on M2-like TAMs makes FOLR2 an attractive target for delivering anti-cancer drugs, immunomodulators, or imaging agents specifically to the pro-tumor macrophage population, minimizing off-target effects. PubMed search for FOLR2 TAMs therapy
- TREM2: Modulating TREM2 activity, for example, through blocking antibodies, could be a strategy to shift TAM polarization and enhance anti-tumor immunity. PubMed search for TREM2 cancer therapy
- Biomarkers for Disease Prognosis and Response to Therapy:
- The expression levels of these TAM-specific markers could potentially serve as prognostic indicators in RCC patients, with higher expression of pro-tumor markers possibly correlating with poorer outcomes.
- Monitoring the expression of these markers on circulating monocytes or tissue macrophages could assess the effectiveness of TAM-targeting therapies or immunotherapies.
- Combination Therapies:
- Targeting TAMs by inhibiting key surface receptors like CSF1R or AXL could synergize with existing immunotherapies (e.g., checkpoint inhibitors) or conventional chemotherapies by alleviating the immunosuppressive TME and enhancing anti-tumor immune responses.
Further validation through in vitro functional studies, in vivo preclinical models of RCC, and analysis of human RCC patient samples using techniques like multiplex immunofluorescence or spatial transcriptomics would be crucial to confirm the functional significance of these markers and their therapeutic potential.
17. T cell CD4+ Condition-Specific Surfaceome Markers in Renal Cell Carcinoma
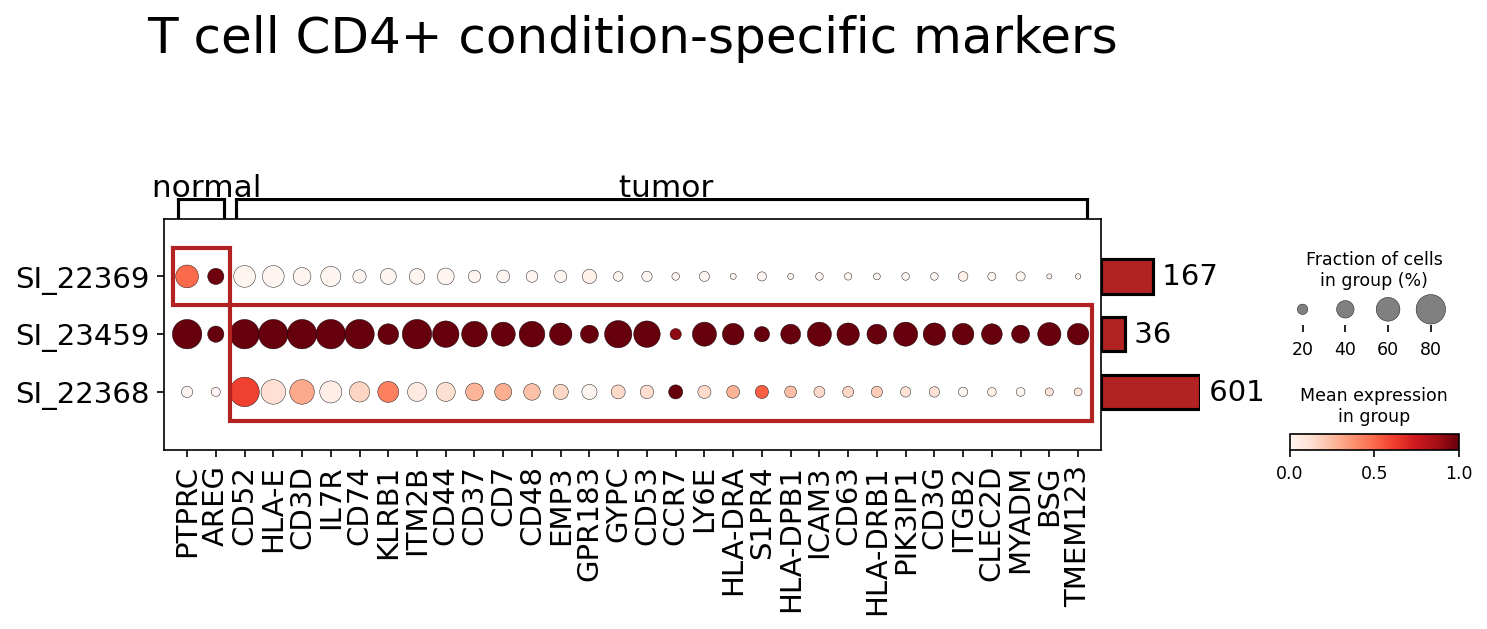
[Analysis Visualization Results]...
Analysis Overview
This analysis identifies and visualizes surfaceome marker expression in T cell CD4+ populations across different samples/conditions, distinguishing between "normal" and "tumor" associated phenotypes. The dot plot displays mean expression levels (color intensity) and the fraction of expressing cells (dot size) for a selection of surface markers. This approach helps to identify cell-type-specific markers that are differentially regulated in the tumor microenvironment (TME) of Renal Cell Carcinoma, providing insights into T cell function and potential therapeutic targets. The analysis specifically focused on surfaceome markers, with a maximum of 40 markers displayed per condition, as requested.
Visual Summary
The dot plot visualizes the expression of specific surface markers across three distinct samples/groups: SI_22369, SI_23459, and SI_22368. The markers are categorized under "normal" and "tumor" conditions, indicating their general association with either a non-diseased or cancerous state, respectively, within the CD4+ T cell population.
- Sample SI_23459 (middle row) stands out for its robust and widespread expression of nearly all markers identified under the "tumor" condition (from CD52 to TMEM123). These markers show high mean expression (dark red circles) and a large fraction of expressing cells (large dot size). This suggests that the CD4+ T cells in sample SI_23459 exhibit a strong tumor-associated or activated phenotype. Interestingly, this sample has the lowest cell count (36 cells) among the three displayed, potentially indicating a specific, highly activated, or numerically constrained T cell subset within the tumor.
- Sample SI_22368 (bottom row) also expresses many "tumor"-associated markers, but generally at lower mean expression levels (lighter red/orange) and with smaller fractions of expressing cells compared to SI_23459. This sample has the highest cell count (601 cells), suggesting a more heterogeneous or less profoundly activated CD4+ T cell population within this tumor sample.
- Sample SI_22369 (top row) displays a distinct pattern. It shows moderate expression of "normal"-associated markers, PTPRC (CD45) and AREG, with a high fraction of expressing cells. In contrast, this sample exhibits very low to no expression (white/small dots) for most of the "tumor"-associated markers. This suggests that the CD4+ T cells in sample SI_22369 maintain a more "normal-like" phenotype or originate from a less perturbed tissue environment. This sample contains 167 T cell CD4+ cells.
The distinct expression profiles highlight heterogeneity in CD4+ T cell states across different tumor samples, or between tumor and normal tissue contexts, particularly regarding markers associated with tumor progression or immune response.
Biological Interpretation
The observed differential expression of surface markers in T cell CD4+ cells between "normal" and "tumor"-associated contexts provides critical insights into their roles in the Renal Cell Carcinoma microenvironment. Focusing on markers highly expressed in tumor-associated samples (e.g., SI_23459) can reveal potential mechanisms of immune evasion, T cell activation/dysfunction, and therapeutic targets.
Key Markers Identified in T cell CD4+ Cells (Tumor-Associated Context):
- CD44
- Associated Signaling Pathways: CD44 is a major cell adhesion molecule and a receptor for hyaluronan, involved in cell-cell and cell-matrix interactions. It interacts with various signaling molecules, including receptor tyrosine kinases, leading to activation of pathways like PI3K/Akt, MAPK, and Rho GTPases, influencing cell survival, proliferation, and migration. GeneCards: CD44
- Role in the TME: In the TME, CD44 plays a multifaceted role. It is critical for T cell activation, differentiation, and homing to inflamed tissues and tumor sites. High CD44 expression is often associated with activated and memory T cells, as well as T regulatory cells (Tregs). It can enhance T cell-APC interactions and contribute to immune evasion by promoting cancer stemness and metastatic potential in tumor cells, but also mediating T cell anti-tumor responses.
- Potential as a Therapeutic Target: Targeting CD44 in the TME is complex due to its diverse functions. However, its high expression on certain immune subsets (e.g., highly activated T cells) or in specific tumor contexts could make it a useful biomarker or a target for directing therapies, especially in conjunction with other targets.
- Relevant Therapeutic Agents: Monoclonal antibodies targeting CD44 are under investigation in preclinical and early clinical studies, often aimed at inhibiting tumor growth or metastasis. Some strategies focus on blocking CD44-hyaluronan interactions.
- HLA-DRA (and other MHC Class II genes like HLA-DPB1, HLA-DRB1)
- Associated Signaling Pathways: HLA-DRA encodes an alpha chain of the Major Histocompatibility Complex (MHC) class II, essential for presenting antigenic peptides to CD4+ T cells. Its signaling involves T cell receptor (TCR) activation upon antigen binding, leading to downstream cascades like Zap70, LAT, and activation of NFAT and NF-κB pathways, culminating in T cell activation and cytokine production. GeneCards: HLA-DRA
- Role in the TME: While classically expressed by professional antigen-presenting cells (APCs), CD4+ T cells can upregulate MHC Class II molecules upon activation or in certain inflammatory/tumor contexts. This "ectopic" expression on T cells could signify highly activated T cells with some capacity for antigen presentation (e.g., to other T cells, or antigen "re-presentation") or may reflect a specific T cell subset like follicular helper T cells (Tfh) or highly activated effector T cells. In RCC, robust MHC Class II expression on CD4+ T cells in tumor samples suggests an active, potentially anti-tumor, immune response, or alternatively, a highly plastic regulatory phenotype.
- Potential as a Therapeutic Target: Directly targeting MHC Class II on T cells is not a common therapeutic strategy, as it's crucial for immune recognition. However, its expression level serves as an excellent biomarker for T cell activation status and engagement within the TME. Modulating the signals that induce or maintain MHC Class II expression on T cells could be part of broader immunotherapeutic strategies aimed at enhancing antigen presentation and T cell activation.
- Other Pertinent Information: High expression of MHC Class II molecules on tumor-infiltrating lymphocytes (TILs) often correlates with better prognosis in some cancers, indicating a more robust anti-tumor immune response.
- BSG (CD147)
- Associated Signaling Pathways: BSG (Basigin, CD147, EMMPRIN) is a transmembrane glycoprotein involved in cell adhesion, migration, and extracellular matrix (ECM) remodeling. It activates various signaling pathways, including MAPK, PI3K/Akt, and NF-κB, through interactions with cyclophilins and other surface molecules. GeneCards: BSG
- Role in the TME: In the TME, CD147 is known to promote tumor growth, invasion, and metastasis by inducing matrix metalloproteinase (MMP) production in surrounding stromal cells. On immune cells, including T cells, CD147 plays roles in cell adhesion, migration, and immune cell activation. Its expression on tumor-infiltrating T cells could contribute to their motility within the tumor or influence their interaction with tumor cells and stromal components.
- Potential as a Therapeutic Target: CD147 is considered a promising therapeutic target in various cancers due to its pro-tumorigenic roles. Inhibiting CD147 could reduce tumor invasion, angiogenesis, and potentially modulate immune cell function within the TME.
- Relevant Therapeutic Agents: Monoclonal antibodies and small molecule inhibitors targeting CD147 are under investigation for cancer therapy. For example, Meplazumab, an anti-CD147 antibody, has been explored in clinical trials for certain malignancies. PubMed search: CD147 cancer therapy
- CD52
- Associated Signaling Pathways: CD52 is a glycosylphosphatidylinositol (GPI)-anchored glycoprotein highly expressed on lymphocytes, monocytes, and other immune cells. Its exact signaling pathways are not fully elucidated, but it is thought to play a role in cell adhesion, costimulation, and apoptosis. UniProt: P31358 (CD52)
- Role in the TME: CD52 is broadly expressed on most leukocytes, including CD4+ T cells. Its high expression in the tumor context indicates the presence of these immune cells.
- Potential as a Therapeutic Target: CD52 is a well-established therapeutic target in lymphoproliferative disorders and autoimmune diseases. Its widespread expression on lymphocytes makes it an effective target for inducing immunosuppression or lymphodepletion.
- Relevant Therapeutic Agents: Alemtuzumab (anti-CD52 monoclonal antibody) is a widely used drug for conditions like chronic lymphocytic leukemia (CLL) and multiple sclerosis. In oncology, its use is primarily for lymphodepletion prior to other cell therapies or in specific leukemias. Its high expression in tumor-infiltrating CD4+ T cells suggests a potential strategy to deplete specific T cell subsets if they are deemed pathogenic or immunosuppressive.
- CCR7
- Associated Signaling Pathways: CCR7 is a G-protein coupled receptor (GPCR) that binds chemokines CCL19 and CCL21. Activation of CCR7 by its ligands initiates signaling pathways involving Gαi proteins, leading to activation of PI3K/Akt, MAPK, and Rho GTPases, which regulate cell migration, survival, and proliferation. GeneCards: CCR7
- Role in the TME: CCR7 is crucial for lymphocyte homing to secondary lymphoid organs (SLOs) like lymph nodes and spleen, and for their migration within these organs. Naive T cells and central memory T cells typically express high levels of CCR7. In the TME, its expression on CD4+ T cells can indicate their migratory potential, particularly towards lymphatic vessels or regional lymph nodes, which might be relevant for anti-tumor immunity (e.g., priming in lymph nodes) or for immune escape mechanisms (e.g., egress from the tumor microenvironment). Upregulation in a tumor-associated sample like SI_23459 could suggest a particular subset of T cells that are actively trafficking.
- Potential as a Therapeutic Target: Modulating CCR7 signaling could be a strategy to control lymphocyte trafficking in cancer. For instance, blocking CCR7 might prevent regulatory T cells (Tregs) from entering lymph nodes where they could suppress anti-tumor responses, or enhance the retention of effector T cells within the tumor. Conversely, enhancing CCR7 signaling could improve the homing of engineered T cells to desired sites.
- Other Pertinent Information: Dysregulation of CCR7 expression and its ligands in the TME is associated with altered immune cell trafficking and can impact clinical outcomes.
Normal-Associated Markers (in SI_22369):
- PTPRC (CD45): A transmembrane glycoprotein tyrosine phosphatase universally expressed on hematopoietic cells (excluding mature erythrocytes). It is critical for T cell receptor signaling and T cell activation. Its presence in SI_22369 merely confirms the identity of the cells as leukocytes (T cells), consistent with a normal T cell phenotype.
- AREG (Amphiregulin): A ligand for the epidermal growth factor receptor (EGFR). While primarily known for its role in cell growth and proliferation in various tissues, it can be expressed by immune cells and play a role in immune regulation and tissue repair. Its expression in a "normal"-like T cell context could suggest a role in maintaining tissue homeostasis or mediating regulatory functions.
Clinical or Translational Implications
The differential expression of surface markers on CD4+ T cells in Renal Cell Carcinoma samples highlights potential avenues for diagnostic, prognostic, and therapeutic intervention:
- Biomarker Identification: Markers such as CD44, HLA-DRA, BSG, and CCR7, which show altered expression in tumor-associated CD4+ T cells, can serve as valuable biomarkers to characterize the immune landscape of RCC. Their expression patterns could differentiate between active anti-tumor responses, T cell exhaustion, or immunosuppressive phenotypes.
Therapeutic Targeting:
- CD52: The robust expression of CD52 on tumor-associated CD4+ T cells (e.g., in SI_23459) suggests that anti-CD52 antibodies like Alemtuzumab could be explored to deplete specific CD4+ T cell subsets if these populations are found to be suppressive or contribute to tumor progression. However, such a broad depletion would require careful consideration of off-target effects on beneficial immune cells.
- BSG (CD147): As CD147 promotes tumor invasion and has roles in immune cell function, targeting it with specific antibodies or inhibitors could be beneficial in RCC by simultaneously impacting tumor cell behavior and modulating the TME, including T cell function.
- CD44: Given its role in T cell activation and migration, strategies to modulate CD44 signaling (e.g., blocking hyaluronan interaction) could impact T cell localization and function within the tumor.
- Understanding TME Dynamics: The varied expression profiles across samples (e.g., strong activation markers in SI_23459 vs. milder in SI_22368) underscore the heterogeneity of immune responses in RCC. This information can help refine patient stratification for immunotherapy, identifying patients more likely to respond based on their T cell activation status and functional markers.
- Cell Therapy Optimization: For adoptive cell therapies, understanding the expression of trafficking receptors like CCR7 is crucial for engineering T cells with enhanced homing capabilities to tumor sites or for modulating their persistence and distribution.
18. Differential Expression Trends of Cell Cycle Pathway Genes in Renal Epithelial Cells
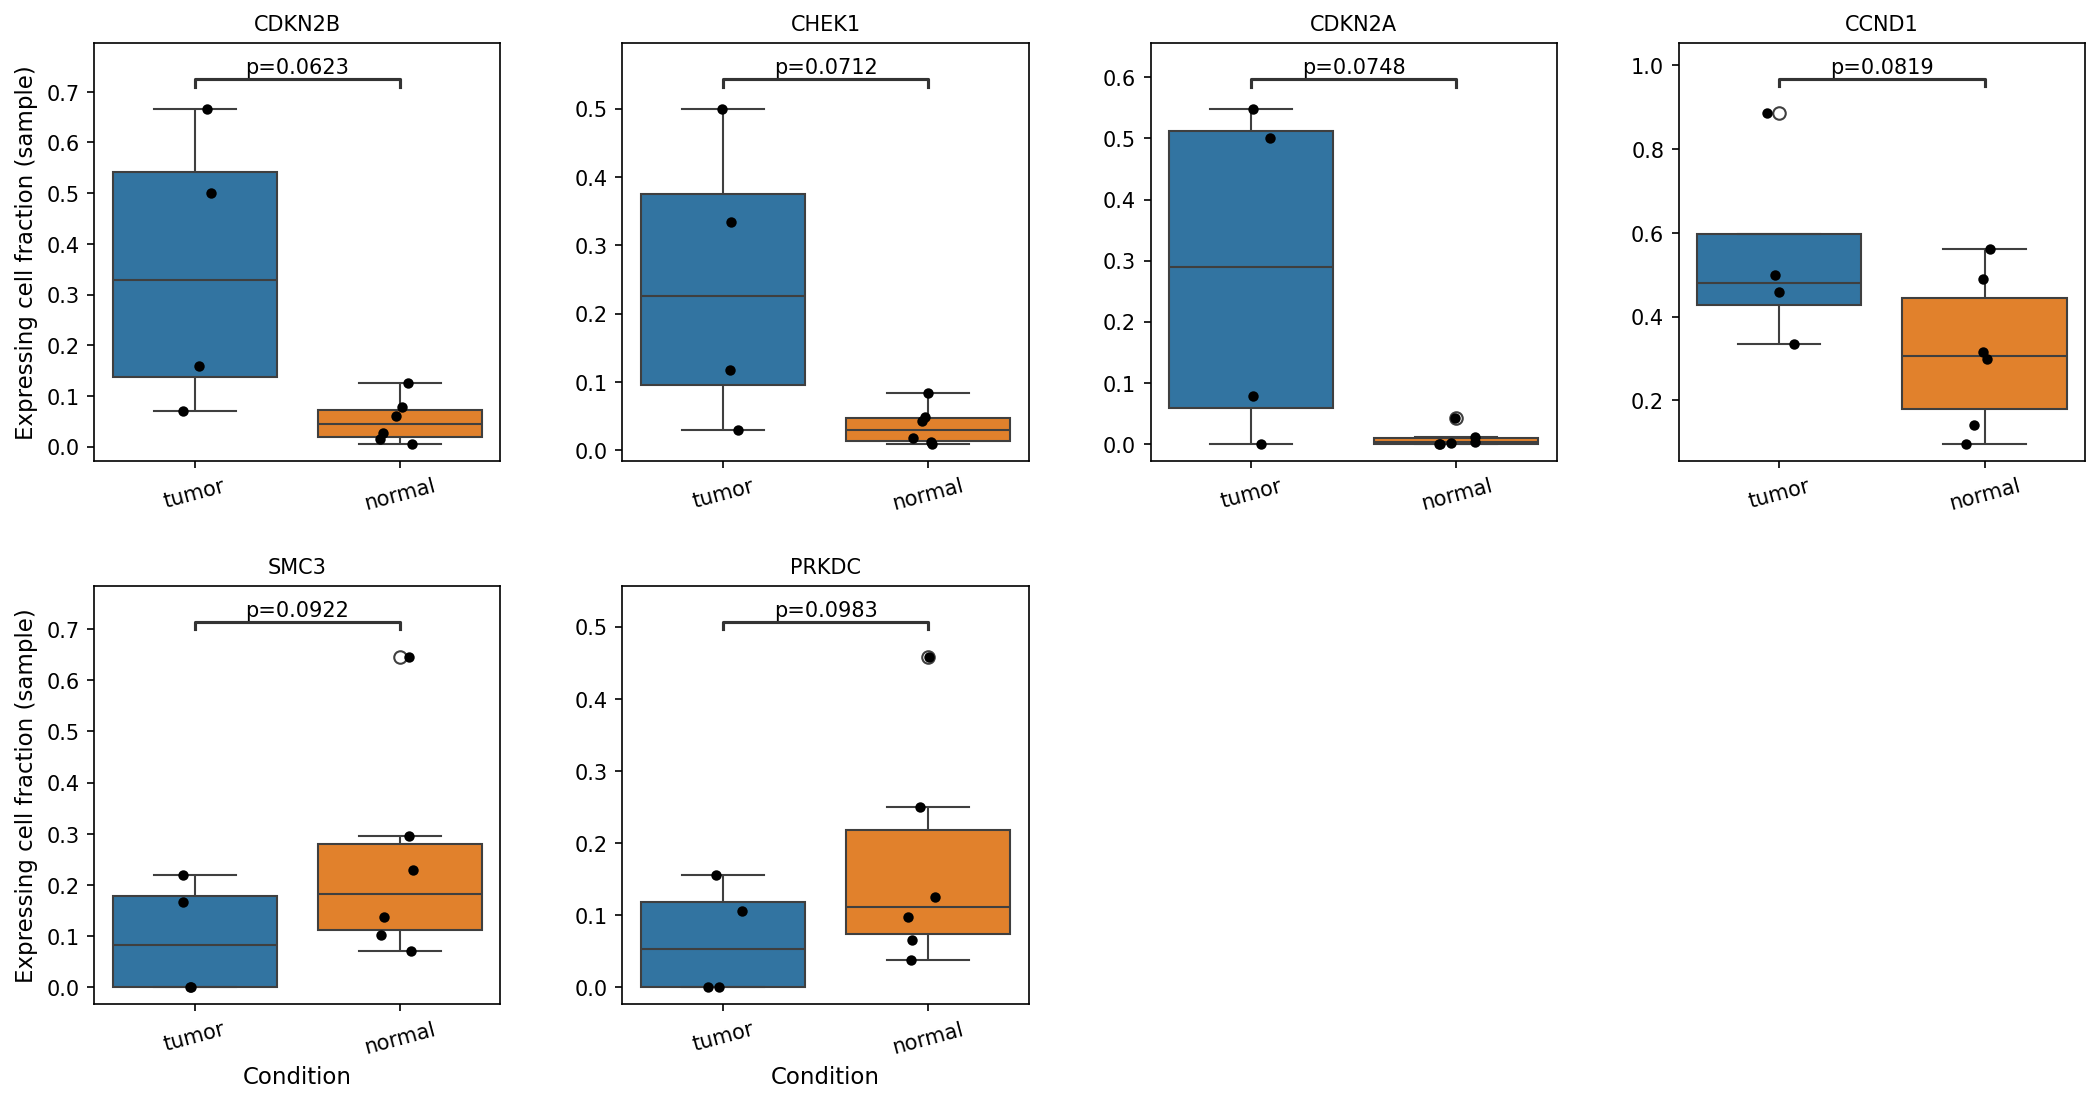
[Analysis Visualization Results]...
Analysis Overview
This analysis aimed to investigate the expression differences of a predefined set of cell cycle pathway genes in Renal Epithelial cells, comparing tumor tissue samples to normal tissue samples. Renal Epithelial cells were selected as they are the inferred cell of origin for Renal Cell Carcinoma (RCC) in this dataset. The plot_box_for_gene_expression_with_signif_difference tool was used to visualize the fraction of cells expressing each gene per sample (rather than mean expression) and to evaluate statistical significance using a t-test with a p-value cutoff of 0.05.
Visual Summary
The box plots display the "Expressing cell fraction (sample)" for six cell cycle-related genes across tumor and normal conditions within Renal Epithelial cells.
Genes with higher expressing cell fraction in tumor (trends):
- CDKN2B (p=0.0623): The fraction of cells expressing CDKN2B appears higher in tumor samples compared to normal samples.
- CHEK1 (p=0.0712): A similar trend is observed for CHEK1, with a seemingly increased fraction of expressing cells in the tumor condition.
- CDKN2A (p=0.0748): The expressing cell fraction for CDKN2A also shows a trend towards higher levels in tumor samples.
- CCND1 (p=0.0819): There is a modest trend of higher CCND1 expressing cell fraction in tumor cells compared to normal.
Genes with lower expressing cell fraction in tumor (trends):
- SMC3 (p=0.0922): The fraction of cells expressing SMC3 appears lower in tumor samples compared to normal samples.
- PRKDC (p=0.0983): A similar trend is observed for PRKDC, with a seemingly decreased fraction of expressing cells in the tumor condition.
It is important to note that none of the displayed genes met the strict statistical significance threshold of p < 0.05. However, several genes show p-values marginally above this cutoff, suggesting a potential biological trend that warrants further investigation.
Biological Interpretation
The analysis, though not yielding strictly significant results (p < 0.05) for individual genes in this visualization, reveals compelling trends in cell cycle gene expression within Renal Epithelial cells, consistent with the inferred context of Renal Cell Carcinoma. Cancer is fundamentally characterized by dysregulated cell proliferation and genomic instability, both of which are intimately linked to cell cycle control and DNA repair mechanisms.
Drivers of Proliferation and DNA Damage Response in Tumor Cells:
- CCND1 (Cyclin D1) is a key cell cycle regulator that promotes progression through the G1 phase. Its trend of increased expressing cell fraction in tumor samples aligns with the hyperproliferative state of cancer cells, where G1-S transition is often accelerated [GeneCards].
- CHEK1 (Checkpoint Kinase 1) plays a critical role in the DNA damage response and activating cell cycle checkpoints, particularly at G2/M. The observed trend of higher CHEK1 expressing cell fraction in tumor cells could indicate increased DNA damage and genomic stress, necessitating activated checkpoints for repair, or it could reflect a compensatory mechanism that tumor cells use to survive despite accumulating DNA damage [GeneCards].
Cell Cycle Inhibitors and Chromosome Dynamics:
- CDKN2A (p16INK4a) and CDKN2B (p15INK4b) are cyclin-dependent kinase inhibitors (CDKIs) that typically halt cell cycle progression. While their loss of function is common in many cancers, the observed trend of an *increased* expressing cell fraction in tumor cells is intriguing. This could represent a stress response where some tumor cells attempt to arrest the cell cycle, or it could point to a subset of cells undergoing senescence, which can be induced in tumors as a defense mechanism or a state of arrested proliferation [GeneCards].
- SMC3 (Structural Maintenance of Chromosomes 3), a component of the cohesin complex, is crucial for sister chromatid cohesion and genomic stability. Its trend of decreased expressing cell fraction in tumor cells might suggest alterations in chromosomal dynamics or integrity within the cancerous cells, which could contribute to aneuploidy, a characteristic often observed in cancer [GeneCards].
- PRKDC (Protein Kinase, DNA-Activated, Catalytic Polypeptide), also known as DNA-PKcs, is central to DNA double-strand break repair via non-homologous end joining (NHEJ). The trend of decreased expressing cell fraction in tumor cells could imply impaired DNA repair capacity, leading to increased genomic instability, a hallmark of cancer. However, DNA-PKcs also supports tumor cell survival, so its role can be context-dependent [GeneCards].
Overall, these trends suggest a complex dysregulation of cell cycle control, DNA damage response, and genomic maintenance mechanisms in Renal Epithelial cells from tumor tissues, even if individual gene differences did not reach stringent statistical significance in this particular analysis. The shift in expressing cell fractions implies changes in the proportion of cells actively engaging in these pathways within the tumor microenvironment.
Clinical or Translational Implications
The observed trends, particularly for genes involved in cell cycle progression and DNA damage response, have potential clinical and translational relevance for Renal Cell Carcinoma, despite not reaching strict statistical significance here.
- Biomarker Candidates: Genes like CCND1, CHEK1, CDKN2A, and CDKN2B are well-known cancer-associated genes. The consistent directionality of their expression trends in tumor cells, even with marginal p-values, suggests they could be investigated as potential biomarkers for RCC. For instance, increased CHEK1 expression could indicate a higher reliance on DNA damage checkpoints in aggressive RCC, while CCND1 upregulation is often linked to proliferation.
- Therapeutic Opportunities: If validated in larger cohorts, the trends for CHEK1 and CCND1 could point towards therapeutic vulnerabilities. CHEK1 inhibitors are being explored in clinical trials to sensitize tumor cells to chemotherapy or radiation by crippling DNA repair mechanisms [PubMed Search]. Similarly, targeting CCND1 (indirectly via CDK4/6 inhibitors) is an established strategy in other cancers [PubMed Search]. Conversely, understanding the implications of reduced SMC3 or PRKDC expression in tumor cells could reveal vulnerabilities related to genomic instability that might be exploited therapeutically, for example, by targeting alternative DNA repair pathways.
- Further Research: The "expressing cell fraction" metric offers insights into cellular heterogeneity. Further investigation with a larger number of samples or alternative statistical approaches (e.g., considering batch effects if samples are from different sources) could help confirm the statistical significance of these biological trends and solidify their potential as prognostic markers or therapeutic targets in Renal Cell Carcinoma.
19. Gene Ontology (GSA) Analysis for Renal Epithelial Cells in Kidney Tissue
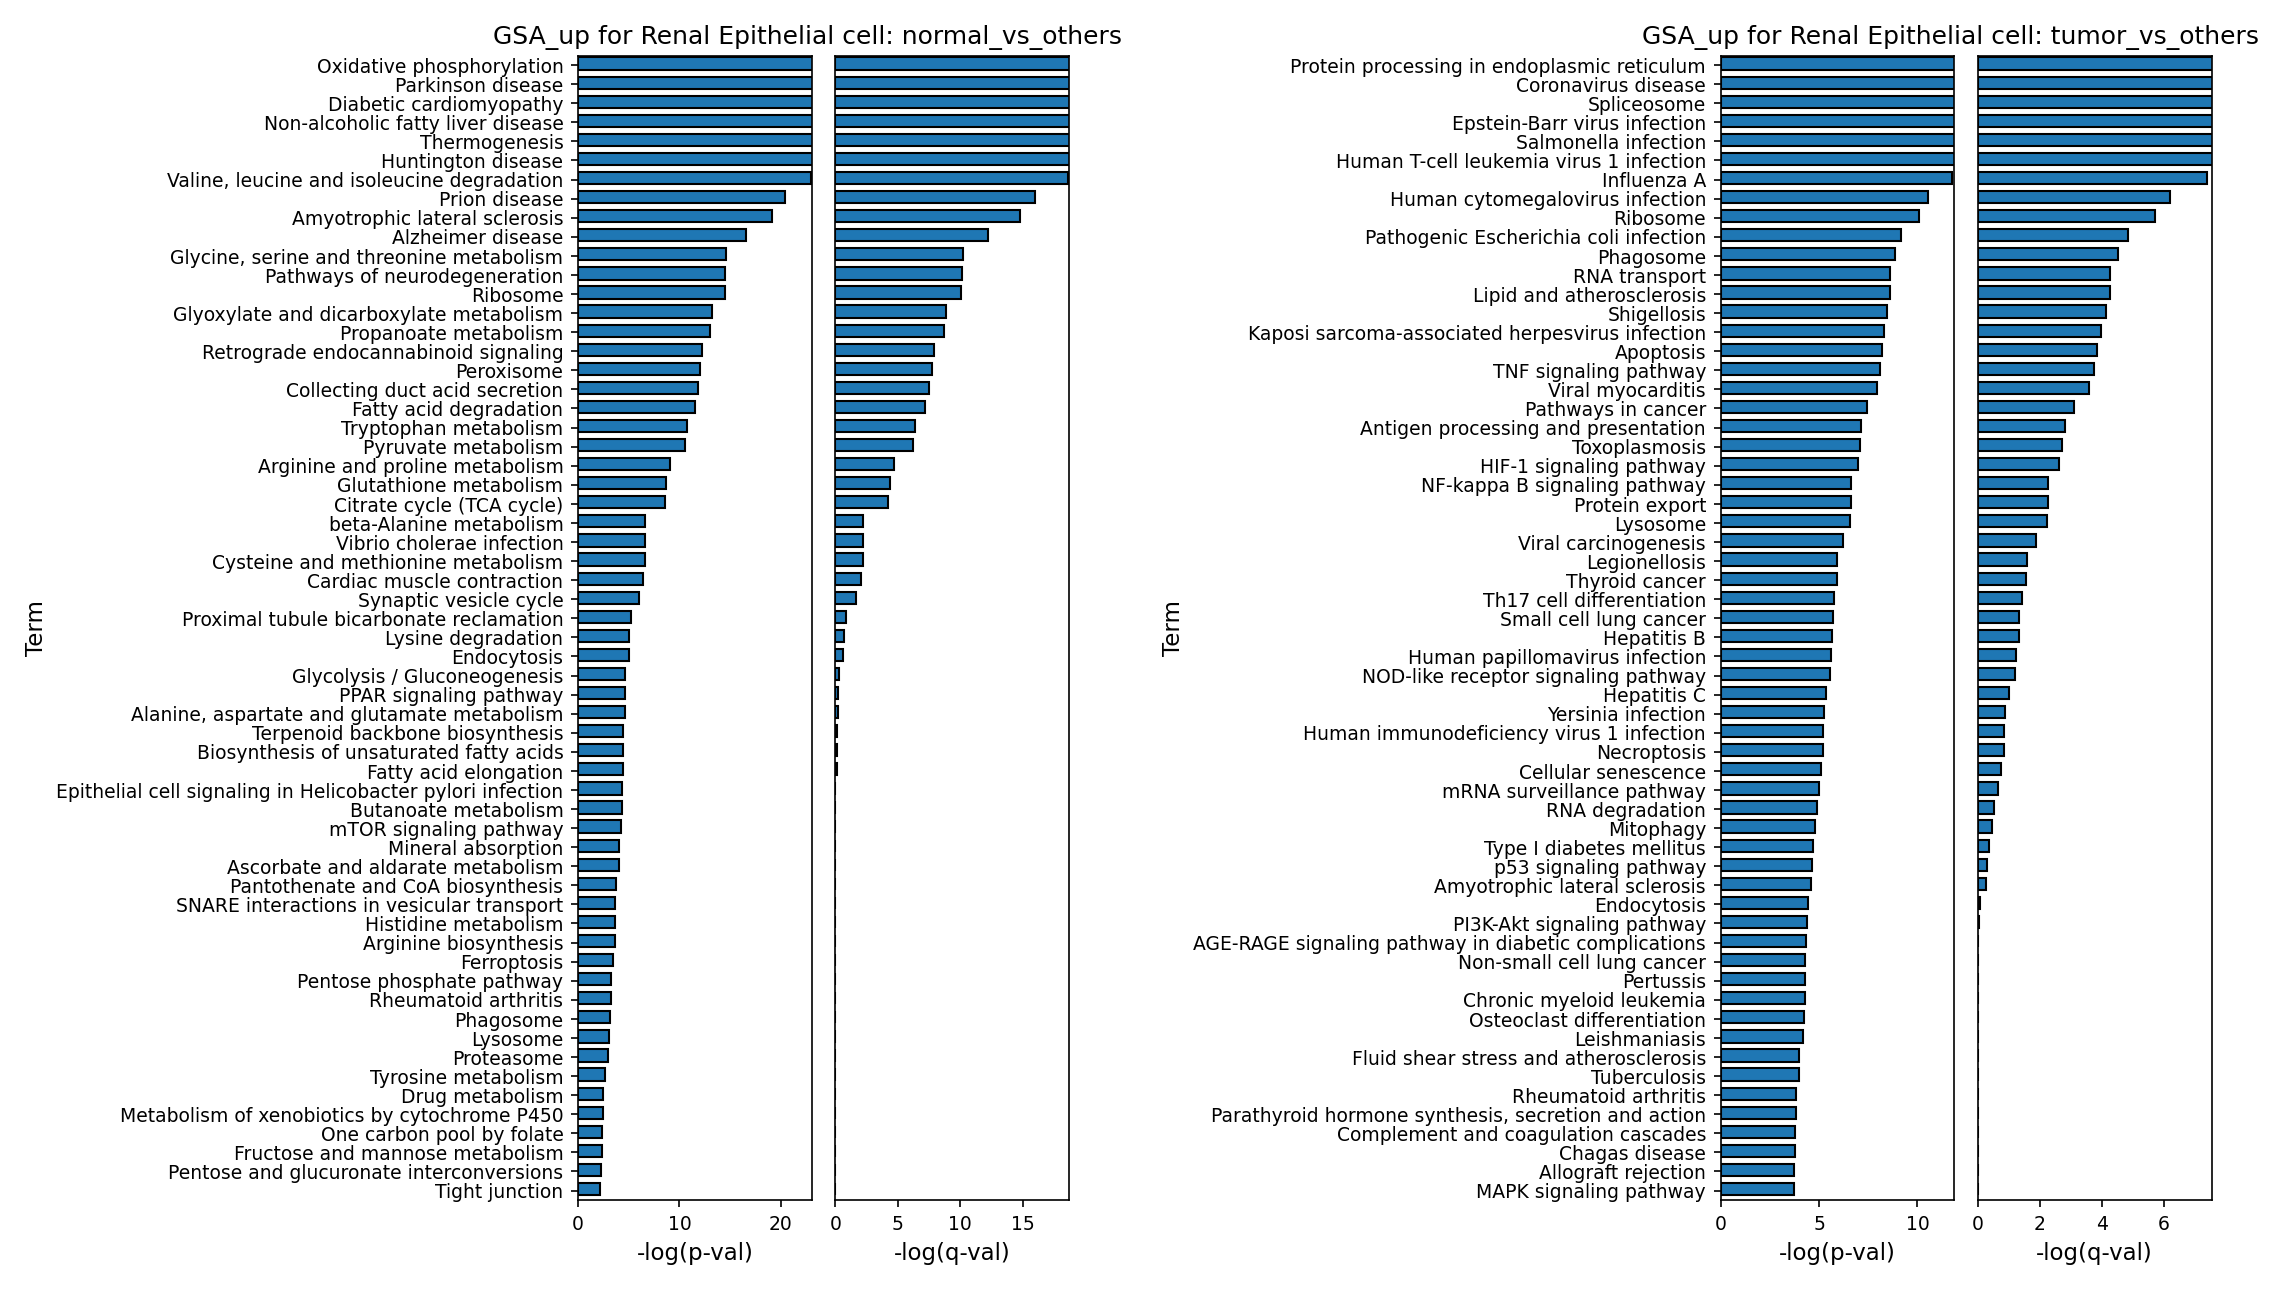
[Analysis Visualization Results]...
Analysis Overview
This analysis presents Gene Ontology (GO) enrichment results, specifically Gene Set Analysis (GSA), for Renal Epithelial cells. The results are displayed as bar plots comparing gene sets enriched (upregulated) in two conditions: "normal_vs_others" (normal renal epithelial cells compared to all other cells) and "tumor_vs_others" (tumor renal epithelial cells compared to all other cells). This aims to identify distinct biological processes and pathways characteristic of healthy versus cancerous renal epithelial cells within the kidney tissue context, aiding in understanding the molecular shifts associated with Renal Cell Carcinoma.
Visual Summary
The provided bar plots illustrate the top enriched GO terms, ranked by statistical significance, for Renal Epithelial cells in normal and tumor conditions. The x-axis represents the negative logarithm of the p-value and FDR-adjusted q-value, with longer bars indicating higher statistical significance of enrichment.
Renal Epithelial cell: normal_vs_others
- Dominant Theme: The most significantly enriched pathways in normal renal epithelial cells are overwhelmingly related to metabolism and energy production.
- Top Pathways: "Oxidative phosphorylation" and "Diabetic cardiomyopathy" are the most highly enriched terms, followed by a wide array of metabolic processes such as "Non-alcoholic fatty liver disease", "Valine, leucine and isoleucine degradation", "Propanoate metabolism", "Fatty acid degradation", "Tryptophan metabolism", "Pyruvate metabolism", "Arginine and proline metabolism", "Glutamine metabolism", and "Citrate cycle (TCA cycle)".
- Other Metabolic Pathways: Further down the list, pathways like "beta-Alanine metabolism", "Glycolysis / Gluconeogenesis", and "PPAR signaling pathway" are also significantly enriched, reinforcing a strong metabolic signature.
Renal Epithelial cell: tumor_vs_others
- Dominant Theme: In stark contrast, tumor renal epithelial cells exhibit significant enrichment in pathways associated with protein synthesis and processing, immune responses, infection, and classic cancer-related signaling pathways.
- Top Pathways: "Protein processing in endoplasmic reticulum" and "Spliceosome" are the most significant, indicating high synthetic activity.
- Immune and Infection Signatures: A prominent feature is the enrichment of numerous infection-related pathways, including those for "Epstein-Barr virus infection", "Salmonella infection", "Human T-cell leukemia virus 1 infection", "Influenza A", "Human cytomegalovirus infection", "Pathogenic Escherichia coli infection", "Shigellosis", "Kaposi sarcoma-associated herpesvirus infection", and many others. This suggests altered immune surveillance or response. Terms like "TNF signaling pathway", "Antigen processing and presentation", and "NF-kappa B signaling pathway" also highlight inflammatory and immune activation.
- Cancer Hallmarks: Critically, "Pathways in cancer", "HIF-1 signaling pathway", "p53 signaling pathway", "PI3K-AKT signaling pathway", and "MAPK signaling pathway" are highly enriched, directly implicating oncogenic processes.
- Cellular Stress and Dysregulation: Pathways like "Apoptosis", "Necroptosis", "Cellular senescence", "RNA transport", "Ribosome", "Lysosome", and "mRNA surveillance pathway" point to dysregulated cellular homeostasis and increased stress.
Biological Interpretation
The GSA results reveal a profound shift in the biological landscape of Renal Epithelial cells when transitioning from a normal to a tumor state, consistent with the inferred context of Renal Cell Carcinoma.
- Metabolic Reprogramming in Normal vs. Tumor Cells:
- Normal Renal Epithelial Cells: The strong enrichment of oxidative phosphorylation, fatty acid metabolism, and various amino acid metabolism pathways reflects the high metabolic demand and specialized functions of healthy kidney epithelial cells, which are crucial for active transport, reabsorption, and energy generation. This suggests a reliance on oxidative metabolism for energy production [1].
- Tumor Renal Epithelial Cells: The absence of these oxidative metabolic pathways in the tumor context, coupled with the enrichment of pathways related to rapid protein synthesis (ER processing, spliceosome, ribosome), suggests a metabolic reprogramming often observed in cancer cells (e.g., Warburg effect, though not directly shown here) that prioritizes biomass accumulation for proliferation over efficient energy production [2]. The high activity of the spliceosome, for instance, is increasingly recognized as a dependency in many cancers.
- Oncogenic Signaling and Cell Cycle Dysregulation:
- The enrichment of "Pathways in cancer", "HIF-1 signaling pathway", "p53 signaling pathway", "PI3K-AKT signaling pathway", and "MAPK signaling pathway" in tumor cells directly points to the activation of well-known oncogenic signaling cascades that drive cell proliferation, survival, and angiogenesis in cancer [3, 4]. HIF-1 activation is particularly relevant in clear cell RCC, where loss of VHL often leads to constitutive HIF activation.
- Pathways related to apoptosis, necroptosis, and cellular senescence, which are crucial for maintaining tissue homeostasis, are also implicated, suggesting dysregulation of programmed cell death and cell cycle control in tumor cells.
- Immune Evasion and Inflammation:
- The striking enrichment of numerous viral and bacterial infection pathways in tumor cells is a significant finding. While not directly implying active infection in all tumor cells, it could indicate:
- Altered Immune Microenvironment: Tumor cells often create an immunosuppressive microenvironment, making them more susceptible to opportunistic infections or altering their response to pathogens [5].
- Oncovirus Link: Some of the listed viruses (e.g., Epstein-Barr virus, Human T-cell leukemia virus 1, Kaposi sarcoma-associated herpesvirus, Human papillomavirus, Hepatitis B) are known oncoviruses, and their pathways might be activated even without active infection, potentially through viral proteins or epigenetic mechanisms contributing to oncogenesis [6].
- Inflammatory Response: The activation of "TNF signaling pathway" and "NF-kappa B signaling pathway" points to chronic inflammation, a known driver of tumor progression and metastasis. "Antigen processing and presentation" also indicates changes in how tumor cells interact with the immune system, potentially in an attempt to evade detection.
- The striking enrichment of numerous viral and bacterial infection pathways in tumor cells is a significant finding. While not directly implying active infection in all tumor cells, it could indicate:
Clinical or Translational Implications
The distinct GO term enrichments between normal and tumor Renal Epithelial cells offer several clinical and translational insights:
- Biomarker Discovery: The identified enriched metabolic pathways in normal cells could serve as markers for healthy renal function, while the cancer-specific pathways (e.g., HIF-1, PI3K-AKT, MAPK signaling, specific spliceosome components) could be potential diagnostic or prognostic biomarkers for Renal Cell Carcinoma.
- Therapeutic Targeting: The highly enriched oncogenic signaling pathways (HIF-1, PI3K-AKT, MAPK) represent established targets for anti-cancer therapies. For instance, drugs targeting the PI3K/AKT/mTOR pathway are already used or under investigation for RCC [7]. Further investigation into the specific genes within these enriched pathways could identify novel therapeutic vulnerabilities.
- Understanding Tumor Microenvironment: The strong signature of immune and infection-related pathways suggests a significant interplay between tumor cells and the immune system. This could inform strategies for immunotherapy, potentially identifying specific immune checkpoints or inflammatory mediators that can be modulated to enhance anti-tumor responses.
References
- Metabolism in kidney: PubMed Search: "renal epithelial cell metabolism"
https://pubmed.ncbi.nlm.nih.gov/?term=renal+epithelial+cell+metabolism
- Cancer metabolism: PubMed Search: "cancer metabolic reprogramming"
https://pubmed.ncbi.nlm.nih.gov/?term=cancer+metabolic+reprogramming
- HIF-1 pathway in RCC: GeneCards: HIF1A
https://www.genecards.org/cgi-bin/carddisp.pl?gene=HIF1A
- PI3K-AKT-MAPK pathways in cancer: PubMed Search: "PI3K AKT MAPK cancer signaling"
https://pubmed.ncbi.nlm.nih.gov/?term=PI3K+AKT+MAPK+cancer+signaling
- Tumor immune evasion: PubMed Search: "tumor immune microenvironment evasion"
https://pubmed.ncbi.nlm.nih.gov/?term=tumor+immune+microenvironment+evasion
- Oncoviruses: PubMed Search: "oncoviruses cancer"
https://pubmed.ncbi.nlm.nih.gov/?term=oncoviruses+cancer
- Targeting PI3K-AKT-mTOR in RCC: PubMed Search: "PI3K AKT mTOR inhibitors renal cell carcinoma"
https://pubmed.ncbi.nlm.nih.gov/?term=PI3K+AKT+mTOR+inhibitors+renal+cell+carcinoma
20. Gene Set Enrichment Analysis (GSEA) Across Renal Cell Carcinoma Cell Types
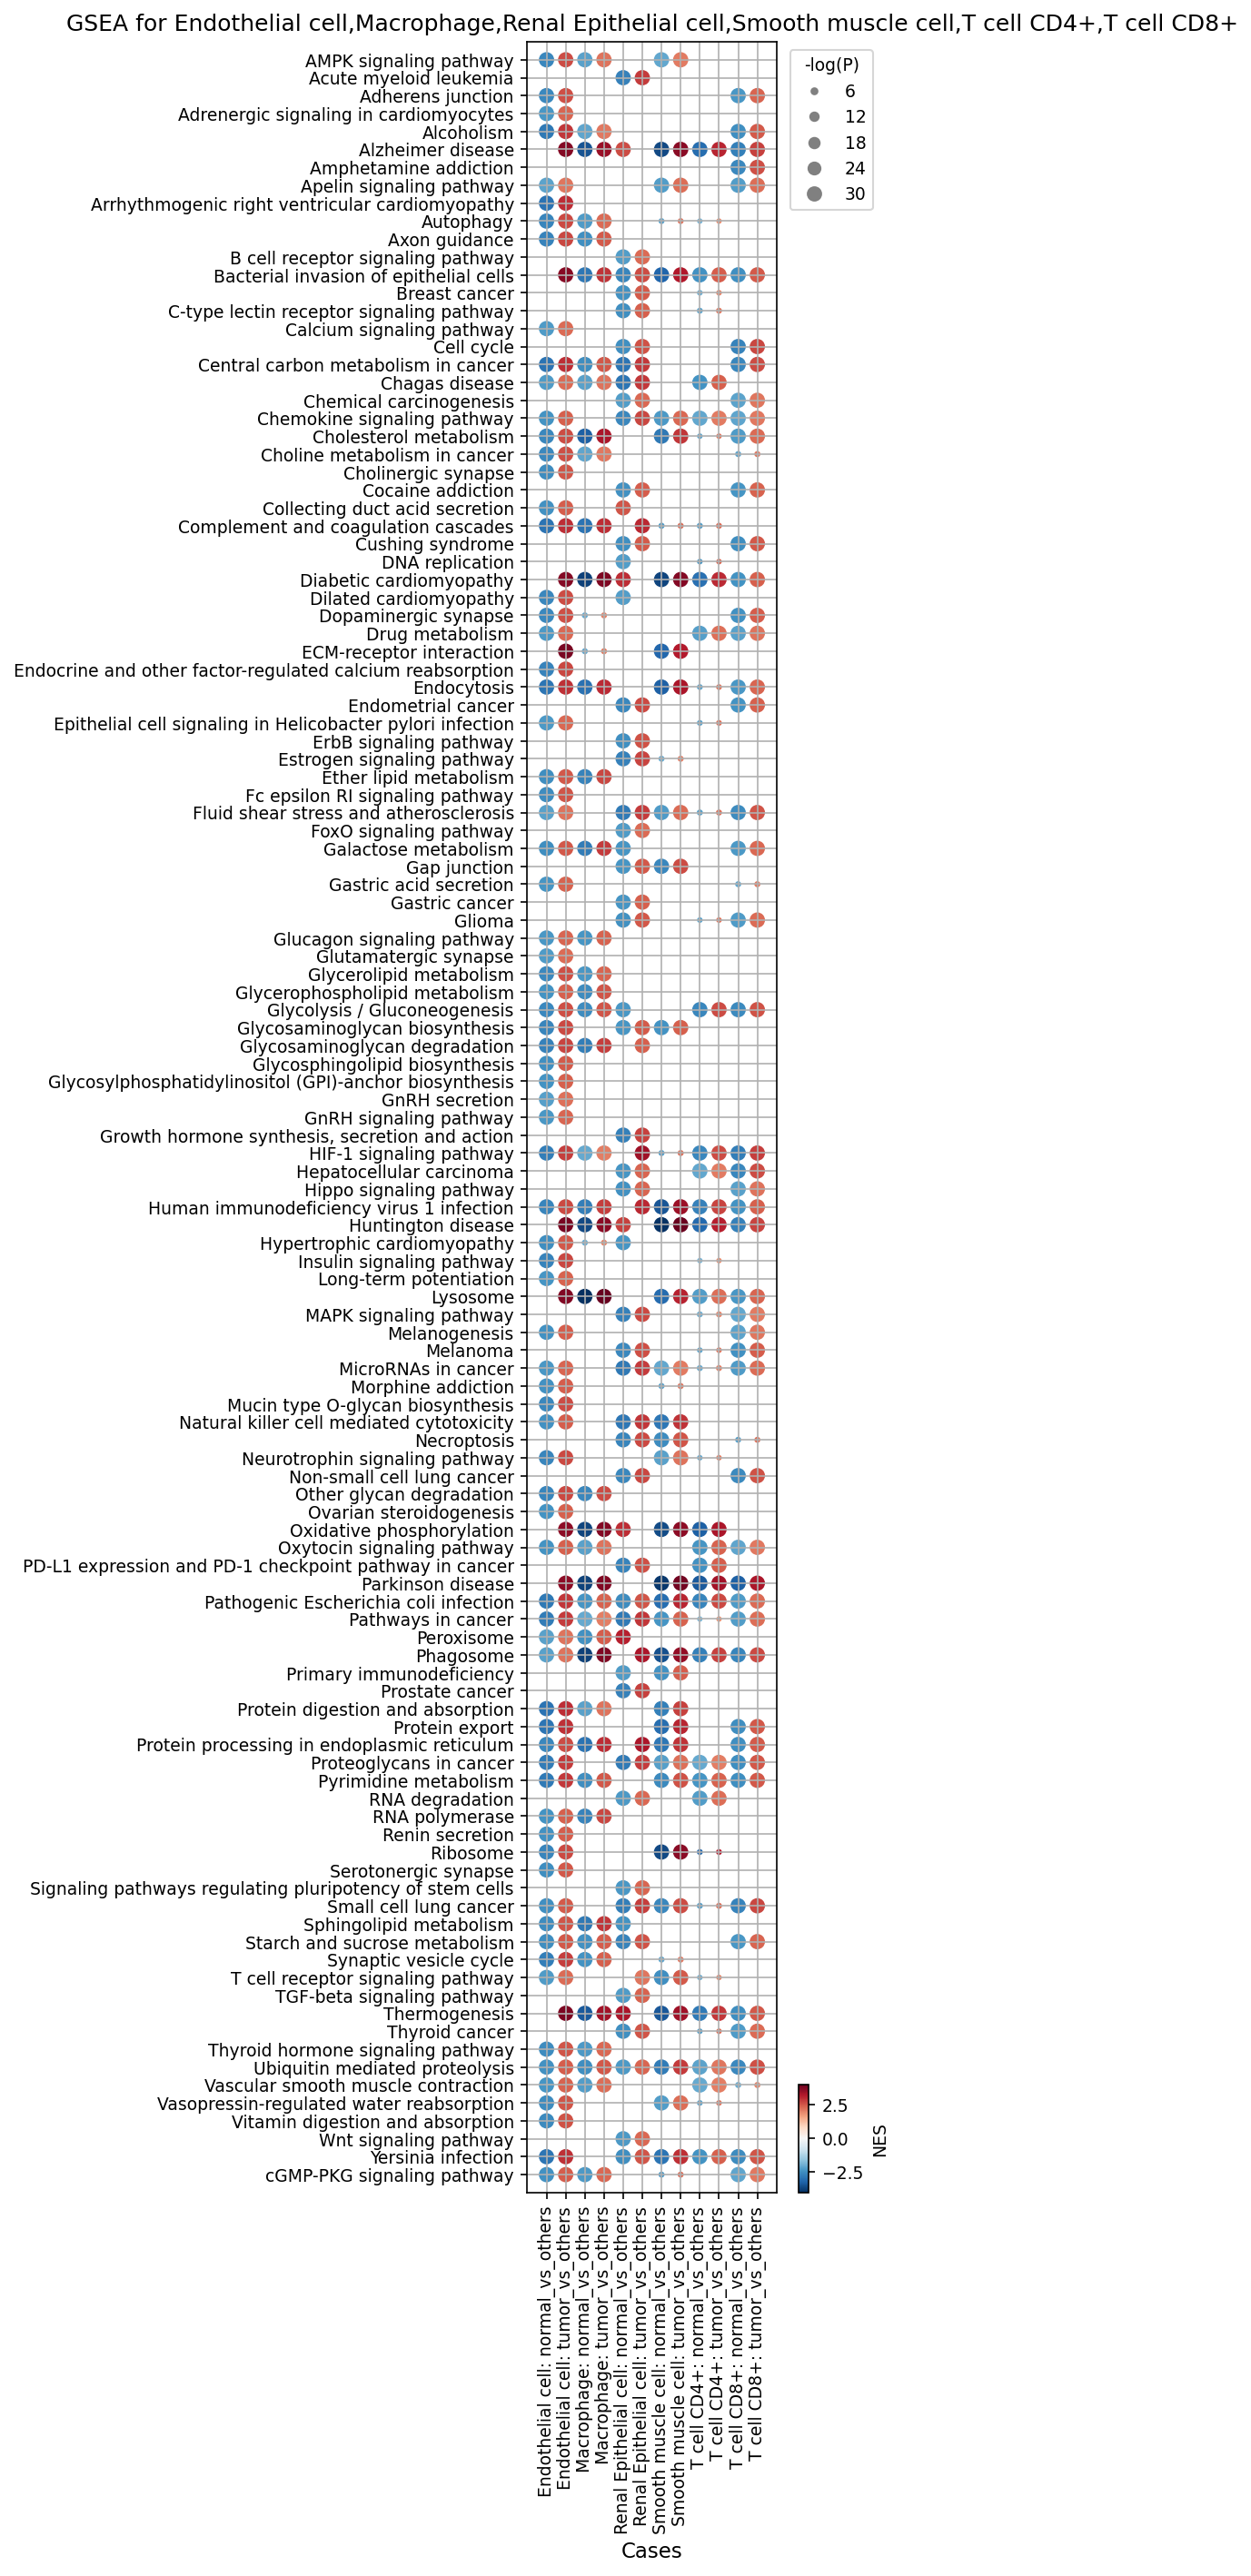
[Analysis Visualization Results]...
Analysis Overview
This analysis presents Gene Set Enrichment Analysis (GSEA) results visualized as a dot plot. The plot displays the Normalized Enrichment Score (NES) and statistical significance (-log(p-value)) for 120 gene sets across various cell types found in the kidney, comparing 'normal' and 'tumor' conditions. The inferred disease context is Renal Cell Carcinoma (RCC), given the kidney tissue, 'tumor' vs 'normal' conditions, and the identification of 'Renal Epithelial cell' as the resolved tumor-origin cell type, alongside significant aneuploidy.
For each cell type (Endothelial cell, Macrophage, Renal Epithelial cell, Smooth muscle cell, T cell CD4+, T cell CD8+), two comparisons are shown:
- normal_vs_others: Genes in cells of this type from 'normal' condition are compared against all other conditions (presumably 'tumor' in this two-condition context).
- tumor_vs_others: Genes in cells of this type from 'tumor' condition are compared against all other conditions (presumably 'normal' in this two-condition context).
Visual Summary
The dot plot uses color to represent the Normalized Enrichment Score (NES), where red indicates positive enrichment (upregulation of the pathway/genes) and blue indicates negative enrichment (downregulation). The intensity of the color reflects the magnitude of the NES. The size of each dot corresponds to the statistical significance, specifically -log(p-value), with larger dots indicating more significant enrichment or depletion.
Key visual patterns include:
- Many pathways show strong enrichment (dark red, large dots) or depletion (dark blue, large dots) in the 'tumor_vs_others' comparisons for various cell types.
- The 'Renal Epithelial cell: tumor_vs_others' column shows a distinct profile with prominent enrichment of metabolism-related pathways, cell cycle, and general cancer pathways.
- Immune cell types (Macrophage, T cell CD4+, T cell CD8+) exhibit characteristic immune-related pathway changes in the tumor context, including significant enrichment of chemokine signaling and immune checkpoint pathways.
- Stromal components (Endothelial cell, Smooth muscle cell) also display distinct patterns related to ECM remodeling and signaling in the tumor microenvironment.
Biological Interpretation
The GSEA results provide insight into the functional shifts occurring in different cell populations within the Renal Cell Carcinoma microenvironment.
1. Metabolic Reprogramming in Tumor Epithelial Cells
- Renal Epithelial cell: tumor_vs_others shows strong positive enrichment of "Glycolysis / Gluconeogenesis" and "HIF-1 signaling pathway" (dark red, large dots). This aligns with the Warburg effect, a metabolic hallmark of cancer where cells preferentially use glycolysis even in the presence of oxygen. HIF-1 activation is a known driver of this metabolic shift and is frequently implicated in RCC, particularly clear cell RCC. [PubMed search for "HIF-1 signaling glycolysis renal cell carcinoma"]
- Interestingly, "Oxidative phosphorylation" is also enriched in tumor epithelial cells, suggesting complex metabolic adaptations beyond a simple Warburg effect, potentially reflecting increased energy demands or different subtypes of RCC.
2. Proliferation and Oncogenic Signaling in Tumor Epithelial Cells
- Pathways such as "Cell cycle", "DNA replication", and "Pathways in cancer" are highly enriched in Renal Epithelial cell: tumor_vs_others. This indicates active cellular proliferation and activation of general oncogenic signaling cascades driving tumor growth.
- "Proteoglycans in cancer" is also enriched in tumor epithelial cells, suggesting changes in the extracellular matrix composition that can promote cancer progression. [GeneCards: Proteoglycans in cancer: GeneCards]
3. Immune Microenvironment Modulation
- In Macrophage, T cell CD4+, and T cell CD8+ cells from tumor_vs_others conditions:
- "Chemokine signaling pathway" is significantly enriched, indicating active recruitment and communication of immune cells within the tumor microenvironment (TME).
- "PD-L1 expression and PD-1 checkpoint pathway in cancer" is notably enriched in tumor-associated Macrophages and CD8+ T cells. This is a critical finding, highlighting the activation of immune checkpoint mechanisms in the TME, which cancer cells utilize to evade immune surveillance. [PubMed search for "PD-1 PD-L1 renal cell carcinoma immunotherapy"]
- "T cell receptor signaling pathway" (in T cells) and "Phagosome" / "Antigen processing and presentation" (in Macrophages and T cells) are also enriched, suggesting ongoing immune cell activation and antigen-specific responses, albeit potentially dampened by checkpoint activation.
4. Stromal Remodeling in the Tumor Microenvironment
- Endothelial cell: tumor_vs_others and Smooth muscle cell: tumor_vs_others show enrichment for pathways like "ECM-receptor interaction" and "Proteoglycans in cancer". This points to significant remodeling of the extracellular matrix by stromal cells, crucial for tumor invasion, metastasis, and angiogenesis.
- "HIF-1 signaling pathway" is also enriched in tumor endothelial cells, consistent with its role in driving angiogenesis in hypoxic tumor environments. [PubMed search for "HIF-1 angiogenesis renal cell carcinoma"]
- Pathways related to cell adhesion and motility, such as "Focal adhesion" and "Regulation of actin cytoskeleton", are enriched in tumor Smooth muscle cells, reflecting their role in tissue remodeling and potentially tumor desmoplasia.
Clinical or Translational Implications
The GSEA results offer several insights with potential clinical and translational relevance for Renal Cell Carcinoma:
- Immunotherapy Targets: The prominent enrichment of the "PD-L1 expression and PD-1 checkpoint pathway in cancer" across multiple immune cell types in the tumor microenvironment strongly supports the rationale for immune checkpoint blockade (e.g., anti-PD-1/PD-L1 therapies) in treating RCC, which is a standard of care for advanced disease. This dataset provides cellular-level evidence for its activation.
- Metabolic Intervention: The significant upregulation of "Glycolysis / Gluconeogenesis" and "HIF-1 signaling pathway" in tumor Renal Epithelial cells identifies metabolic vulnerabilities. Targeting these pathways (e.g., with HIF-2α inhibitors or glycolysis inhibitors) could represent effective therapeutic strategies, potentially in combination with other treatments.
- Stromal-Targeted Therapies: The activation of ECM remodeling and signaling pathways in endothelial and smooth muscle cells suggests that therapies targeting the tumor microenvironment, such as anti-angiogenic agents or inhibitors of ECM deposition, could complement direct anti-tumor approaches.
- Biomarker Discovery: The identified enriched or depleted pathways in specific cell types under tumor conditions could serve as candidate biomarkers for disease progression, prognosis, or response to specific therapies. For example, high activity in HIF-1 signaling in tumor epithelial cells might predict response to HIF inhibitors.
21. Discussion
The single-cell RNA sequencing analysis of kidney tissue provides a high-resolution view of the Renal Cell Carcinoma (RCC) tumor microenvironment (TME) and the malignant renal epithelial cells. A central finding is the clear distinction between normal and tumor cells, with aneuploid Renal Epithelial cells forming the core of the malignant population, exhibiting profound genomic instability and distinct transcriptomic profiles.
The malignant renal epithelial cells undergo significant metabolic reprogramming, shifting from the oxidative phosphorylation and diverse metabolic pathways characteristic of normal kidney cells towards increased glycolysis, HIF-1 signaling, and robust protein synthesis machinery (ER processing, spliceosome). This metabolic rewiring supports rapid proliferation, a hallmark of cancer, and underscores a potential vulnerability that could be targeted therapeutically. Furthermore, these tumor cells activate key oncogenic pathways, including PI3K-AKT and MAPK signaling, which drive cell survival and growth.
The TME in RCC is extensively remodeled, with substantial alterations in immune and stromal cell compositions and interactions. A notable shift includes the increased proportion of Macrophage (M2C) subsets and Regulatory T cells (Tregs) in tumor samples, both known contributors to immunosuppression. Concurrently, there is a marked reduction in NK cells and various ILC subsets in the tumor, suggesting a weakened innate anti-tumor immune surveillance. These changes establish an immunosuppressive milieu that facilitates tumor escape from immune destruction.
Cell-cell interaction (CCI) analyses further delineate the intricate communication networks driving tumor progression. Tumor-associated macrophages (TAMs) emerge as central players, engaging in pro-tumorigenic crosstalk with aneuploid renal epithelial cells. Key interactions involve the HBEGF-EGFR axis, promoting tumor cell proliferation, and the SIRPA-CD47 "don't eat me" signal, enabling immune evasion. Significant interactions related to extracellular matrix remodeling (collagen/fibronectin-integrin axes), angiogenesis (VEGFA, ANGPT2, PDGFB signaling), and Notch pathway activation are highly prevalent between endothelial cells and smooth muscle cells in tumor samples, collectively fostering tumor growth and metastasis.
The distinct surfaceome marker profiles observed on both tumor-origin Renal Epithelial cells and TAMs provide actionable insights. Tumor epithelial cells upregulate known oncogenic receptors like EGFR and MET, alongside immune evasion molecules like CD47 and metabolism-associated markers like CA12. TAMs, in turn, highly express pro-tumorigenic receptors such as CSF1R and AXL, further emphasizing their role in tumor sustenance and immune modulation.
Collectively, these findings paint a comprehensive picture of RCC pathogenesis, driven by intrinsic tumor cell dysregulation, active metabolic reprogramming, and a highly conducive, immunosuppressive TME shaped by extensive cell-cell interactions. The identified molecular targets and pathways offer a strong foundation for developing or refining diagnostic tools and therapeutic strategies.
Hypotheses:
- Renal Cell Carcinoma cells undergo a metabolic shift characterized by increased reliance on glycolysis and active protein synthesis, driven by HIF-1 signaling pathway activation.
- The tumor microenvironment in Renal Cell Carcinoma promotes immune evasion through the enrichment of immunosuppressive Macrophage (M2C) cells and Regulatory T cells (Tregs), and the downregulation of innate immune cells like NK and ILCs.
- The HBEGF-EGFR signaling axis between tumor-associated macrophages and aneuploid renal epithelial cells is a critical driver of tumor cell proliferation and survival in Renal Cell Carcinoma.
- Tumor cells evade phagocytosis by macrophages through the upregulation of CD47, which interacts with SIRPα on myeloid cells.
- Extensive extracellular matrix remodeling, angiogenesis, and Notch signaling pathways are hyperactive in the Renal Cell Carcinoma tumor microenvironment, primarily driven by endothelial-stromal cell interactions.
- The specific surfaceome signatures of tumor renal epithelial cells (e.g., high EGFR, MET, CD47, CA12) and tumor-associated macrophages (e.g., high CSF1R, AXL, GPNMB, FOLR2) are predictive of patient outcomes and therapeutic response in Renal Cell Carcinoma.
Potential therapeutic targets:
- EGFR (Epidermal Growth Factor Receptor): Upregulated and highly active HBEGF-EGFR interactions between tumor-associated macrophages and aneuploid Renal Epithelial cells, along with high EGFR expression on tumor cells, strongly indicate its role in promoting tumor cell proliferation and survival. This is a common oncogenic driver in many cancers. Evidence: Section 13 highlights HBEGF_EGFR interaction as highly significant in tumor. Section 15 shows EGFR as a highly expressed surfaceome marker on tumor Renal Epithelial cells. GSEA (Section 20) also shows enrichment in "Pathways in cancer" which include EGFR signaling. Validation: In vitro experiments with EGFR inhibitors (e.g., erlotinib, gefitinib) on RCC cell lines and co-cultures to assess impact on proliferation and survival. In vivo testing in RCC patient-derived xenograft models.
- MET (Hepatocyte Growth Factor Receptor): High expression of MET on tumor Renal Epithelial cells indicates dysregulation of the HGF/MET pathway, a known driver of proliferation, invasion, and metastasis in RCC, contributing to aggressive disease. Evidence: Section 15 identifies MET as a highly expressed surfaceome marker on tumor Renal Epithelial cells. Validation: Functional assays using MET inhibitors (e.g., cabozantinib, tepotinib) on RCC cell lines to assess impact on proliferation, migration, and survival. Efficacy testing in RCC animal models.
- CD47 ("Don't Eat Me" Signal): Upregulation of CD47 on tumor Renal Epithelial cells suggests a mechanism of immune evasion by preventing phagocytosis by macrophages. Blocking this interaction could re-enable innate anti-tumor immunity. Evidence: Section 12 identifies SIRPA_CD47 as a prominent interaction in tumor tissue. Section 15 shows CD47 as a highly expressed surfaceome marker on tumor Renal Epithelial cells. Validation: In vitro macrophage-tumor cell phagocytosis assays with anti-CD47 antibodies. In vivo studies combining anti-CD47 agents with existing immunotherapies in RCC models.
- CSF1R (Colony Stimulating Factor 1 Receptor): CSF1R is highly expressed on tumor-associated macrophages (TAMs), driving their survival, proliferation, and pro-tumorigenic phenotype. Inhibiting CSF1R can deplete or reprogram TAMs, reducing immunosuppression and promoting anti-tumor responses. Evidence: Section 16 identifies CSF1R as a highly expressed surfaceome marker on tumor Macrophage cells. CCI analyses (Section 12) show extensive macrophage involvement. Validation: Testing CSF1R inhibitors (e.g., pexidartinib, cabiralizumab) in RCC models to assess macrophage infiltration, polarization, and tumor growth.
- AXL (AXL Receptor Tyrosine Kinase): High expression of AXL on tumor-associated macrophages (TAMs) suggests its role in promoting an immunosuppressive, M2-like phenotype and contributing to resistance mechanisms in the tumor microenvironment. Evidence: Section 16 identifies AXL as a highly expressed surfaceome marker on tumor Macrophage cells. Validation: Evaluate AXL inhibitors (e.g., bemcentinib) in RCC models, particularly in combination with other agents, to overcome resistance and modulate TAM function.
- PD-1/PD-L1 Immune Checkpoint Pathway: GSEA reveals significant enrichment of the "PD-L1 expression and PD-1 checkpoint pathway in cancer" across multiple immune cell types in the tumor microenvironment. This indicates active immune evasion via this pathway, which is a known vulnerability in RCC. Evidence: Section 20 (GSEA) shows strong enrichment of "PD-L1 expression and PD-1 checkpoint pathway in cancer" in Macrophage, T cell CD4+, and T cell CD8+ from tumor samples. Validation: Clinical validation is already established for anti-PD-1/PD-L1 therapies in RCC. Preclinical validation could involve exploring novel combination strategies with other identified targets (e.g., CSF1R, AXL inhibitors).
Follow-up validation ideas:
- Targeted qPCR or Western Blot: Validate the differential expression of key genes (e.g., HIF1A, CCND1, CHEK1, EGFR, MET, CSF1R, AXL, CD47, CA12) at the mRNA and protein level in bulk tumor versus normal kidney tissue samples, and potentially in isolated cell populations using flow cytometry or cell sorting.
- Immunohistochemistry/Immunofluorescence: Spatially validate the expression patterns of specific surface markers (e.g., EGFR, MET, CD47, CA12 on tumor cells; CSF1R, AXL, FOLR2 on macrophages) and cell type proportions (e.g., Treg, M2C macrophage infiltration) in human RCC tissue sections, correlating with clinical outcomes.
- Flow Cytometry: Quantify the proportions of T cell subsets (e.g., Tregs, NK cells), macrophage subsets (M1/M2C), and the expression of surface markers (e.g., CD47, CD151, VCAM1, CSF1R) on these populations in dissociated tumor and normal kidney samples.
- In vitro Perturbation Assays: Use RCC cell lines and co-culture systems with macrophages or other stromal cells to functionally validate key cell-cell interactions (e.g., HBEGF-EGFR, SIRPA-CD47). This could involve blocking ligand/receptor activity with antibodies or genetic knockdowns/overexpressions and observing effects on proliferation, survival, or phagocytosis.
- In vivo Preclinical Models: Test the efficacy of targeting identified pathways (e.g., EGFR, MET, CD47, CSF1R, AXL) using specific inhibitors or antibodies in patient-derived xenograft (PDX) or syngeneic mouse models of RCC, assessing tumor growth, metastasis, and immune cell infiltration.
- Spatial Transcriptomics/Proteomics: Investigate the spatial distribution and co-localization of key cell types and their interacting ligand-receptor pairs within the tumor microenvironment to understand their precise roles in tumor progression.
- Validation Cohorts: Confirm identified biomarkers (e.g., gene expression signatures, cell type proportions) and therapeutic targets in independent, larger cohorts of RCC patients, correlating with prognosis and response to therapy.
- CRISPR/Cas9 Screening: Perform in vitro or in vivo CRISPR screens to identify novel genes or pathways essential for tumor cell survival or immune evasion in RCC.
Limitations:
This report, derived from single-cell RNA-seq data, provides robust insights into the cellular and molecular landscape of Renal Cell Carcinoma. However, it has several limitations. The inference of Renal Cell Carcinoma is provisional and not a clinical diagnosis. While CNV data supports malignancy, the specific grade, stage, or molecular subtype of RCC cannot be determined. All findings are correlative, and direct causality cannot be inferred without functional experimental validation. The "unassigned" cell population, particularly prominent in tumor samples, likely includes malignant epithelial cells but could also encompass novel or poorly characterized cell states, requiring further detailed characterization. The analysis focuses on predefined cell types and pathways, and other important interactions or markers might exist beyond the scope of the precomputed analyses. Finally, single-cell RNA-seq provides a snapshot of gene expression and cannot fully capture dynamic cellular processes, protein activity, or post-translational modifications.
22. Query List
- Show and save UMAPs for condition, sample, major cell type, minor cell type, ploidy_dec, and celltype_subset in two columns.
- Show major cell type scores on UMAP and save the result.
- Show and save a marker expression dot plot for celltype_subset. SET target_cell = None and var_group_rotation = 45. Leave all other arguments at their default values.
- Select Renal Epithelial cells (tumor-origin cells), show a CNV heatmap grouped by sample together with a summary of regions with significantly amplified copy numbers, and save the results.
- Show and save UMAPs of CNV patterns colored by major cell type, minor cell type, ploidy results, condition, and sample in two columns.
- Show and save a population bar plot of minor cell types.
- Show and save a population bar plot of T cell subsets.
- Show and save box plots of T cell subset populations with statistically significant differences between conditions, if any. Choose ncols based on the total number of panels.
- Show and save a population bar plot of macrophage subsets.
- Show and save box plots of macrophage subset populations with statistically significant differences between conditions, if any. Choose ncols based on the total number of panels.
- Select Renal Epithelial cells (tumor-origin cells), show their ploidy populations as a bar plot, and save the result.
- Show and save cell-cell interaction patterns involving Renal Epithelial cells (tumor-origin cells), Fibroblasts, Macrophages, T cells, Endothelial cells, and B cells. Select at most 80 cell-cell interactions per group.
- Select only genes associated with immune checkpoint and cell cycle pathways, show cell-cell interactions for these genes, and save the result.
- Find cell-cell interactions involving major immune and stromal cells that differ significantly between conditions, show them as a dot plot, and save the result. Set max_n_items_per_group to 60. For each interaction identified under each condition, using the provided dataset context, describe the associated signaling pathways and mechanisms, its potential as a therapeutic target, and relevant therapeutic agents.
- Show marker expressions for Renal Epithelial cells (tumor-origin cells) in a dot plot, and save the result. Use only surfaceome markers, with at most 60 markers per condition. For the markers identified under each condition, distinguish between established therapeutic targets and less well-characterized markers with potential as therapeutic targets. For each marker, using the provided dataset context, describe the associated signaling pathways and mechanisms, relevant therapeutic agents, and supporting evidence.
- Show marker expressions for Macrophage cells in a dot plot, and save the result. Use only surfaceome markers, with at most 40 markers per condition. For each marker identified under each condition, using the provided dataset context, describe the associated signaling pathways, the role of the corresponding cell type in the tumor microenvironment, the marker’s potential as a therapeutic target, relevant therapeutic agents, and other pertinent information.
- Show marker expressions for T cell CD4+ cells in a dot plot, and save the result. Use only surfaceome markers, with at most 40 markers per condition. For each marker identified under each condition, using the provided dataset context, describe the associated signaling pathways, the role of the corresponding cell type in the tumor microenvironment, the marker’s potential as a therapeutic target, relevant therapeutic agents, and other pertinent information.
- Among cell cycle pathway genes, select those with statistically significant expression differences between conditions in Renal Epithelial cells, show box plots, and save the result. Set max_n_items_to_plot to 24 and choose ncols based on the total number of panels for an overall width-to-height ratio of approximately 2:3.
- Show and save Gene Ontology (GSA) analysis results for Renal Epithelial cells (tumor-origin cells) as a bar plot.
- Show Gene Set Enrichment Analysis results as a dot plot, and save it. Set the color map to RdBu_r, n_pws_to_show to 120, and target_cells to None.