Single-Cell Atlas of Human Liver Cirrhosis Reveals Dysregulated Cellular Landscape, Intercellular Communication, and Therapeutic Targets
This study provides a high-resolution single-cell atlas of human liver cirrhosis, characterizing profound shifts in cell type populations, functional states, and intercellular communication networks compared to healthy controls. Key findings include a notable reduction in hepatocytes and innate lymphoid cells, coupled with an expansion of pro-inflammatory macrophages, activated hepatic stellate cells, and specific T cell subsets. Macrophages exhibit a pro-inflammatory M1-like polarization, while CD4+ T cells show increased activation and migratory potential, and cytotoxic T cells are diminished. Cell-cell interaction analysis highlights activated pro-fibrotic and inflammatory axes, particularly involving macrophages, hepatic stellate cells, and endothelial cells. Gene Ontology and GSEA reveal widespread metabolic reprogramming, inflammatory pathway activation, and ECM remodeling across diverse cell types. These integrated insights underscore the multifaceted pathogenesis of cirrhosis and identify several promising therapeutic targets.
Contents
- Dataset overview
- UMAP Visualization of Single-Cell Transcriptome Data in Liver Cirrhosis
- Major Cell Type Score Visualization on UMAP for Annotation Validation
- Marker Gene Expression Across Liver Cell Subsets
- Cell Type Population Shifts in Cirrhosis vs. Healthy Liver
- T Cell and Innate Lymphoid Cell Subpopulation Analysis in Cirrhosis
- T Cell Subset Population Shifts in Liver Cirrhosis
- Macrophage Subset Population Analysis in Cirrhosis
- Differential Abundance of Macrophage Subsets in Cirrhosis
- Cell-Cell Interaction Patterns in Healthy and Cirrhotic Liver
- Condition-Specific Cell-Cell Interaction Patterns in Cirrhotic Liver
- Cholangiocyte Condition-Specific Surfaceome Markers in Liver Cirrhosis
- Macrophage Condition-Specific Surfaceome Markers in Liver Cirrhosis
- Condition-Specific Surfaceome Markers in Hepatic Stellate Cells
- T cell CD4+ Condition-Specific Surfaceome Markers in Liver Cirrhosis
- Gene Ontology (GSA) Analysis for Hepatic Stellate Cells in Liver Cirrhosis
- Gene Set Enrichment Analysis (GSEA) of Cell-type Specific Pathways in Liver Cirrhosis
- Discussion
- Query List
0. Dataset overview
데이터셋 요약
- 데이터 크기: 총 60,503개의 단일 세포와 22,784개의 유전자로 구성되어 있습니다.
- 종 및 조직: 인간(human) 간(Liver) 조직 데이터입니다.
- 조건: 'healthy'와 'cirrhosis' 두 가지 조건이 존재하며, 'healthy'가 대조군으로 설정되어 있습니다.
- 세포 유형: Major, Minor, Subset 수준으로 세포 유형이 분류되어 있습니다.
- Major: Myeloid cell, T cell, B cell, Stromal cell, Liver Epithelial cell, Mast cell, Endothelial cell
- Minor: Macrophage, T cell CD4+, T cell CD8+, ILC, NK cell, B cell, Dendritic cell, Plasma cell, Hepatic stellate cell, Hepatocyte, Mast cell, Endothelial cell, Cholangiocyte, Smooth muscle cell, Fibroblast, unassigned
- Subset: 다양한 세분화된 세포 유형이 포함됩니다.
- 관측치(obs) 열: sample, condition, celltype_major, celltype_minor, celltype_subset, cluster 등 다양한 세포 메타데이터를 포함합니다.
- 유전자(var) 열: gene_symbol, gene_id, variable_genes 등의 유전자 정보를 포함합니다.
- 종양 식별: 이 데이터셋에서는 종양 세포가 식별되지 않았습니다.
- CNV (Copy Number Variation): CNV 추정 결과는 제공되지 않습니다.
사전 계산된 분석 결과
- CCI (Cell-Cell Interaction): 'CCI' 및 'CCI_sample' 키로 조건별, 샘플별 세포-세포 상호작용 분석 결과가 저장되어 있습니다.
- DEG (Differential Expression Genes): 'DEG' 키로 각 minor 세포 유형별 조건 간 차등 발현 유전자 분석 결과가 저장되어 있습니다.
- GSEA (Gene Set Enrichment Analysis): 'GSEA' 키로 각 minor 세포 유형별 유전자 세트 농축 분석 결과가 저장되어 있습니다.
- GSA_up (Gene Set Analysis / GO): 'GSA_up' 키로 각 minor 세포 유형별 GO(Gene Ontology) 분석 결과가 저장되어 있습니다.
- 분석 가능한 세포 유형: DEG, GSA/GO, GSEA 분석은 B cell, Cholangiocyte, Dendritic cell, Endothelial cell, Hepatic stellate cell, ILC, Macrophage, NK cell, Plasma cell, Smooth muscle cell, T cell CD4+, T cell CD8+ 세포 유형에 대해 수행되었습니다.
1. UMAP Visualization of Single-Cell Transcriptome Data in Liver Cirrhosis
[Analysis Visualization Results]...
Analysis Overview
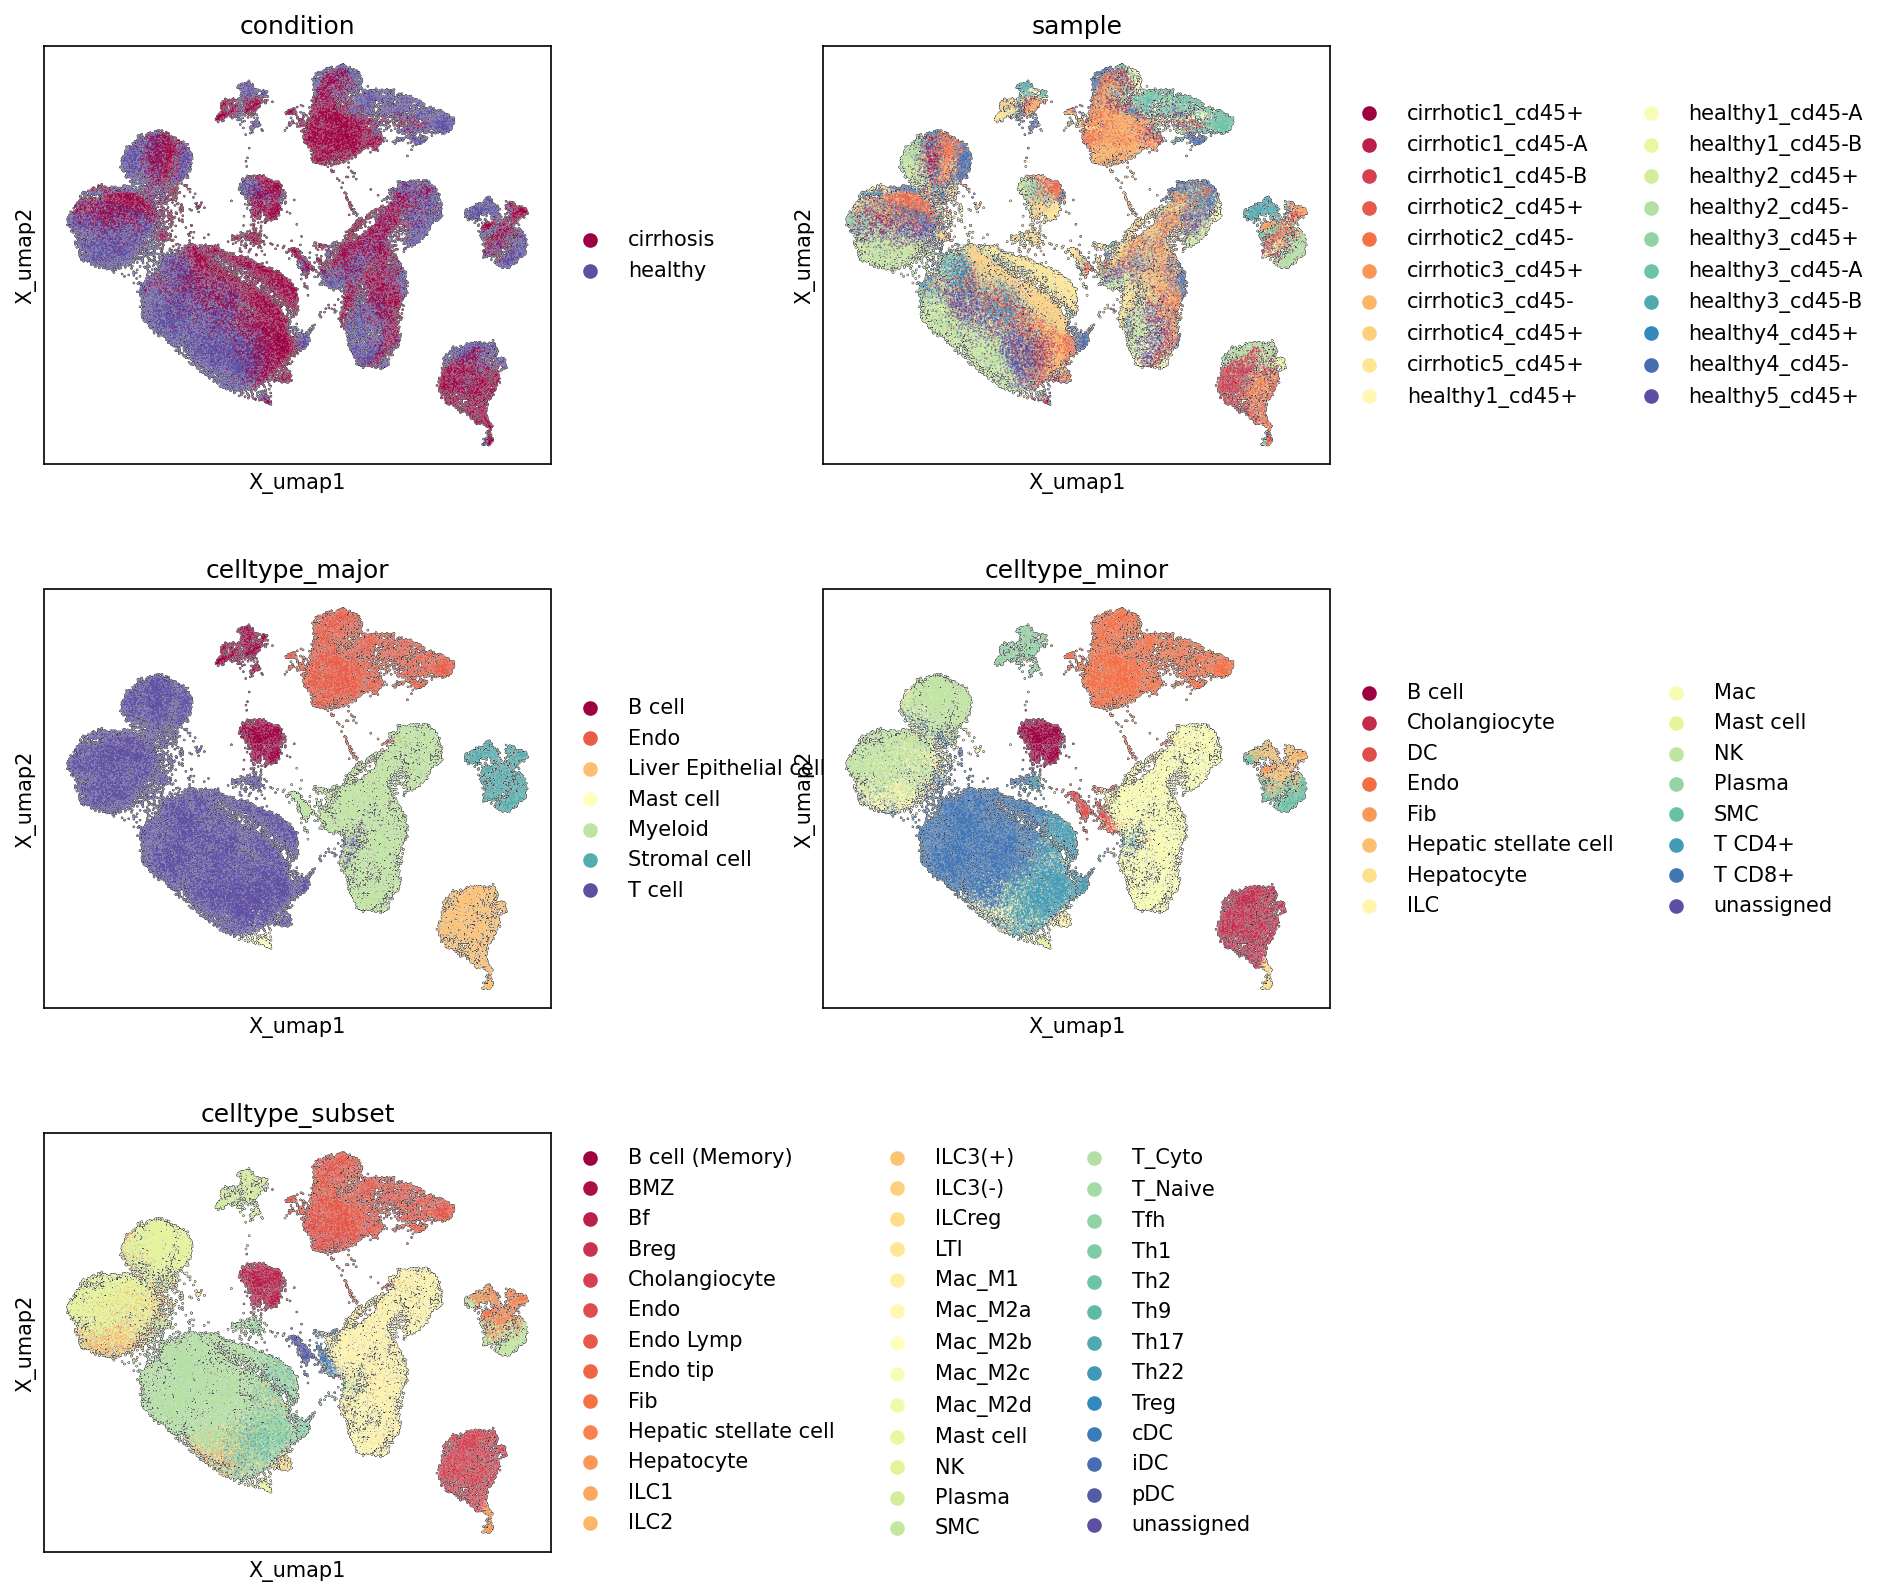
This analysis presents UMAP (Uniform Manifold Approximation and Projection) plots, a dimensionality reduction technique used to visualize high-dimensional single-cell RNA sequencing data in a 2D space. The purpose is to observe the overall structure of the dataset, evaluate the separation of cells based on different metadata categories (condition, sample, major cell type, minor cell type, and celltype_subset), and assess the quality of cell type annotations and potential batch effects. These visualizations provide a foundational understanding of the cellular landscape and how it changes across healthy and cirrhotic liver conditions.
Visual Summary
The UMAP plots display the relationships between 60,503 cells, colored according to different attributes:
- Condition UMAP: Cells from 'healthy' (purple) and 'cirrhosis' (maroon) conditions show significant overlap across many clusters, indicating shared cell populations and transcriptional states. However, there are also distinct regions enriched with cells from one condition over the other. Notably, several smaller, more peripheral clusters appear predominantly or exclusively enriched with 'cirrhosis' cells, suggesting condition-specific cell states or unique cell populations.
- Sample UMAP: The UMAP colored by 'sample' demonstrates a generally good mixing of cells from different samples within the larger clusters, particularly for cells shared between healthy and cirrhotic conditions. This suggests that major batch effects related to individual samples are largely mitigated, or at least not overtly driving the primary clustering structure. However, the condition-specific clusters noted in the 'condition' UMAP also show sample-specific contributions, reflecting the individual origin of these unique populations.
- Celltype_major UMAP: This plot shows a clear and distinct separation of most major cell types into well-defined clusters, indicating robust identification. 'T cell' (dark purple) forms a large, central cluster, with 'Myeloid cell' (light green) and 'B cell' (dark red) forming separate, distinct clusters. 'Liver Epithelial cell' (orange) and 'Stromal cell' (blue-green) also form recognizable clusters. This good separation supports the quality of the major cell type annotations.
- Celltype_minor UMAP: At the minor cell type level, the separation remains largely distinct. For instance, 'T cell CD4+' and 'T cell CD8+' are distinct sub-clusters within the broader T cell major cluster. 'Macrophage' (light yellow) clusters within the Myeloid cell region. 'Hepatocyte' (light orange) forms a prominent, largely isolated cluster, as do 'Hepatic stellate cell' (light yellow-orange) and 'Endothelial cell' (light red). Some closely related cell types might show partial overlap, which is expected.
- Celltype_subset UMAP: This most granular annotation level further refines the distinctness of cell populations. Within the larger clusters, various subsets like 'Macrophage (M1)', 'Macrophage (M2A)', 'T cell (Cytotoxic)', 'T cell (Naive)', etc., are resolved into individual or closely related sub-clusters. The fine-grained distinctions, such as different B cell subsets (e.g., B cell (Memory), BMZ, Bf, Breg) or ILC subsets (ILC1, ILC2, ILC3), demonstrate the high resolution of the single-cell data and the annotation quality.
Biological Interpretation
The UMAP visualizations provide critical insights into the cellular heterogeneity of the human liver in healthy and cirrhotic states.
- Disease-Associated Cellular Remodeling: The 'condition' UMAP clearly shows that while many cell populations are shared between healthy and cirrhotic livers, there are specific cell clusters that are predominantly or exclusively associated with cirrhosis. This indicates a significant cellular remodeling and activation of disease-specific cell states in cirrhosis. These unique clusters may represent immune cell infiltration, activation of specific stromal populations, or altered states of resident cells in response to chronic injury and fibrosis. For example, some peripheral clusters, rich in cirrhotic cells, might represent activated myofibroblasts (derived from hepatic stellate cells) or specific immune cell subsets involved in liver inflammation and fibrosis progression.
- Robust Cell Type Annotation: The clear separation of cell populations across all levels of cell type annotation (major, minor, subset) validates the quality and reliability of the cell type assignments. This robust clustering suggests that the gene expression profiles are distinct enough to differentiate between diverse cell types and their subtypes, forming a strong basis for downstream differential expression or pathway analyses. The presence of distinct subsets like different macrophage polarizations (M1, M2A, M2B, M2C, M2D) or T helper cell subsets (Th1, Th2, Th9, Th17, Th22, Tfh, Treg) underscores the biological complexity being captured.
- Minimal Batch Effects: The 'sample' UMAP indicates that cells from different samples are generally well-interspersed within the major clusters. This suggests that the primary biological variations (e.g., cell type identity, disease state) are more influential in shaping the UMAP embedding than technical variations between samples, which is crucial for reliable biological interpretation.
- Cellular Landscape of Cirrhosis: The data highlights the complexity of the liver microenvironment in cirrhosis. Specific cell subsets that appear enriched in the cirrhosis condition warrants further investigation. For instance, activated Hepatic stellate cells are key drivers of fibrosis in cirrhosis [Source: PubMed search for "hepatic stellate cell cirrhosis fibrosis": PubMed Search]. The observed distinct clusters in cirrhotic samples could represent these activated states or novel immune cell populations contributing to disease pathogenesis. The presence of various immune cell subsets (Myeloid, T cell, B cell, ILC, Mast cell) across both conditions, with potential enrichment or altered states in cirrhosis, points to the profound immune system involvement in chronic liver disease.
Annotation Notes
The UMAP plots demonstrate high-quality cell type annotation, with distinct clustering for most cell populations at major, minor, and subset levels. The clear separation observed provides confidence in the assigned cell identities. A small proportion of cells are labeled as 'unassigned' in the minor and subset UMAPs, indicating some cells did not definitively cluster with known populations. These 'unassigned' cells are sparsely distributed and do not form large, distinct clusters, suggesting they are either rare populations, transitional states, or cells with ambiguous transcriptional profiles. Overall, the consistent and well-separated clusters across different levels of annotation strongly support the biological validity of the cell type classifications.
2. Major Cell Type Score Visualization on UMAP for Annotation Validation
[Analysis Visualization Results]...
Analysis Overview
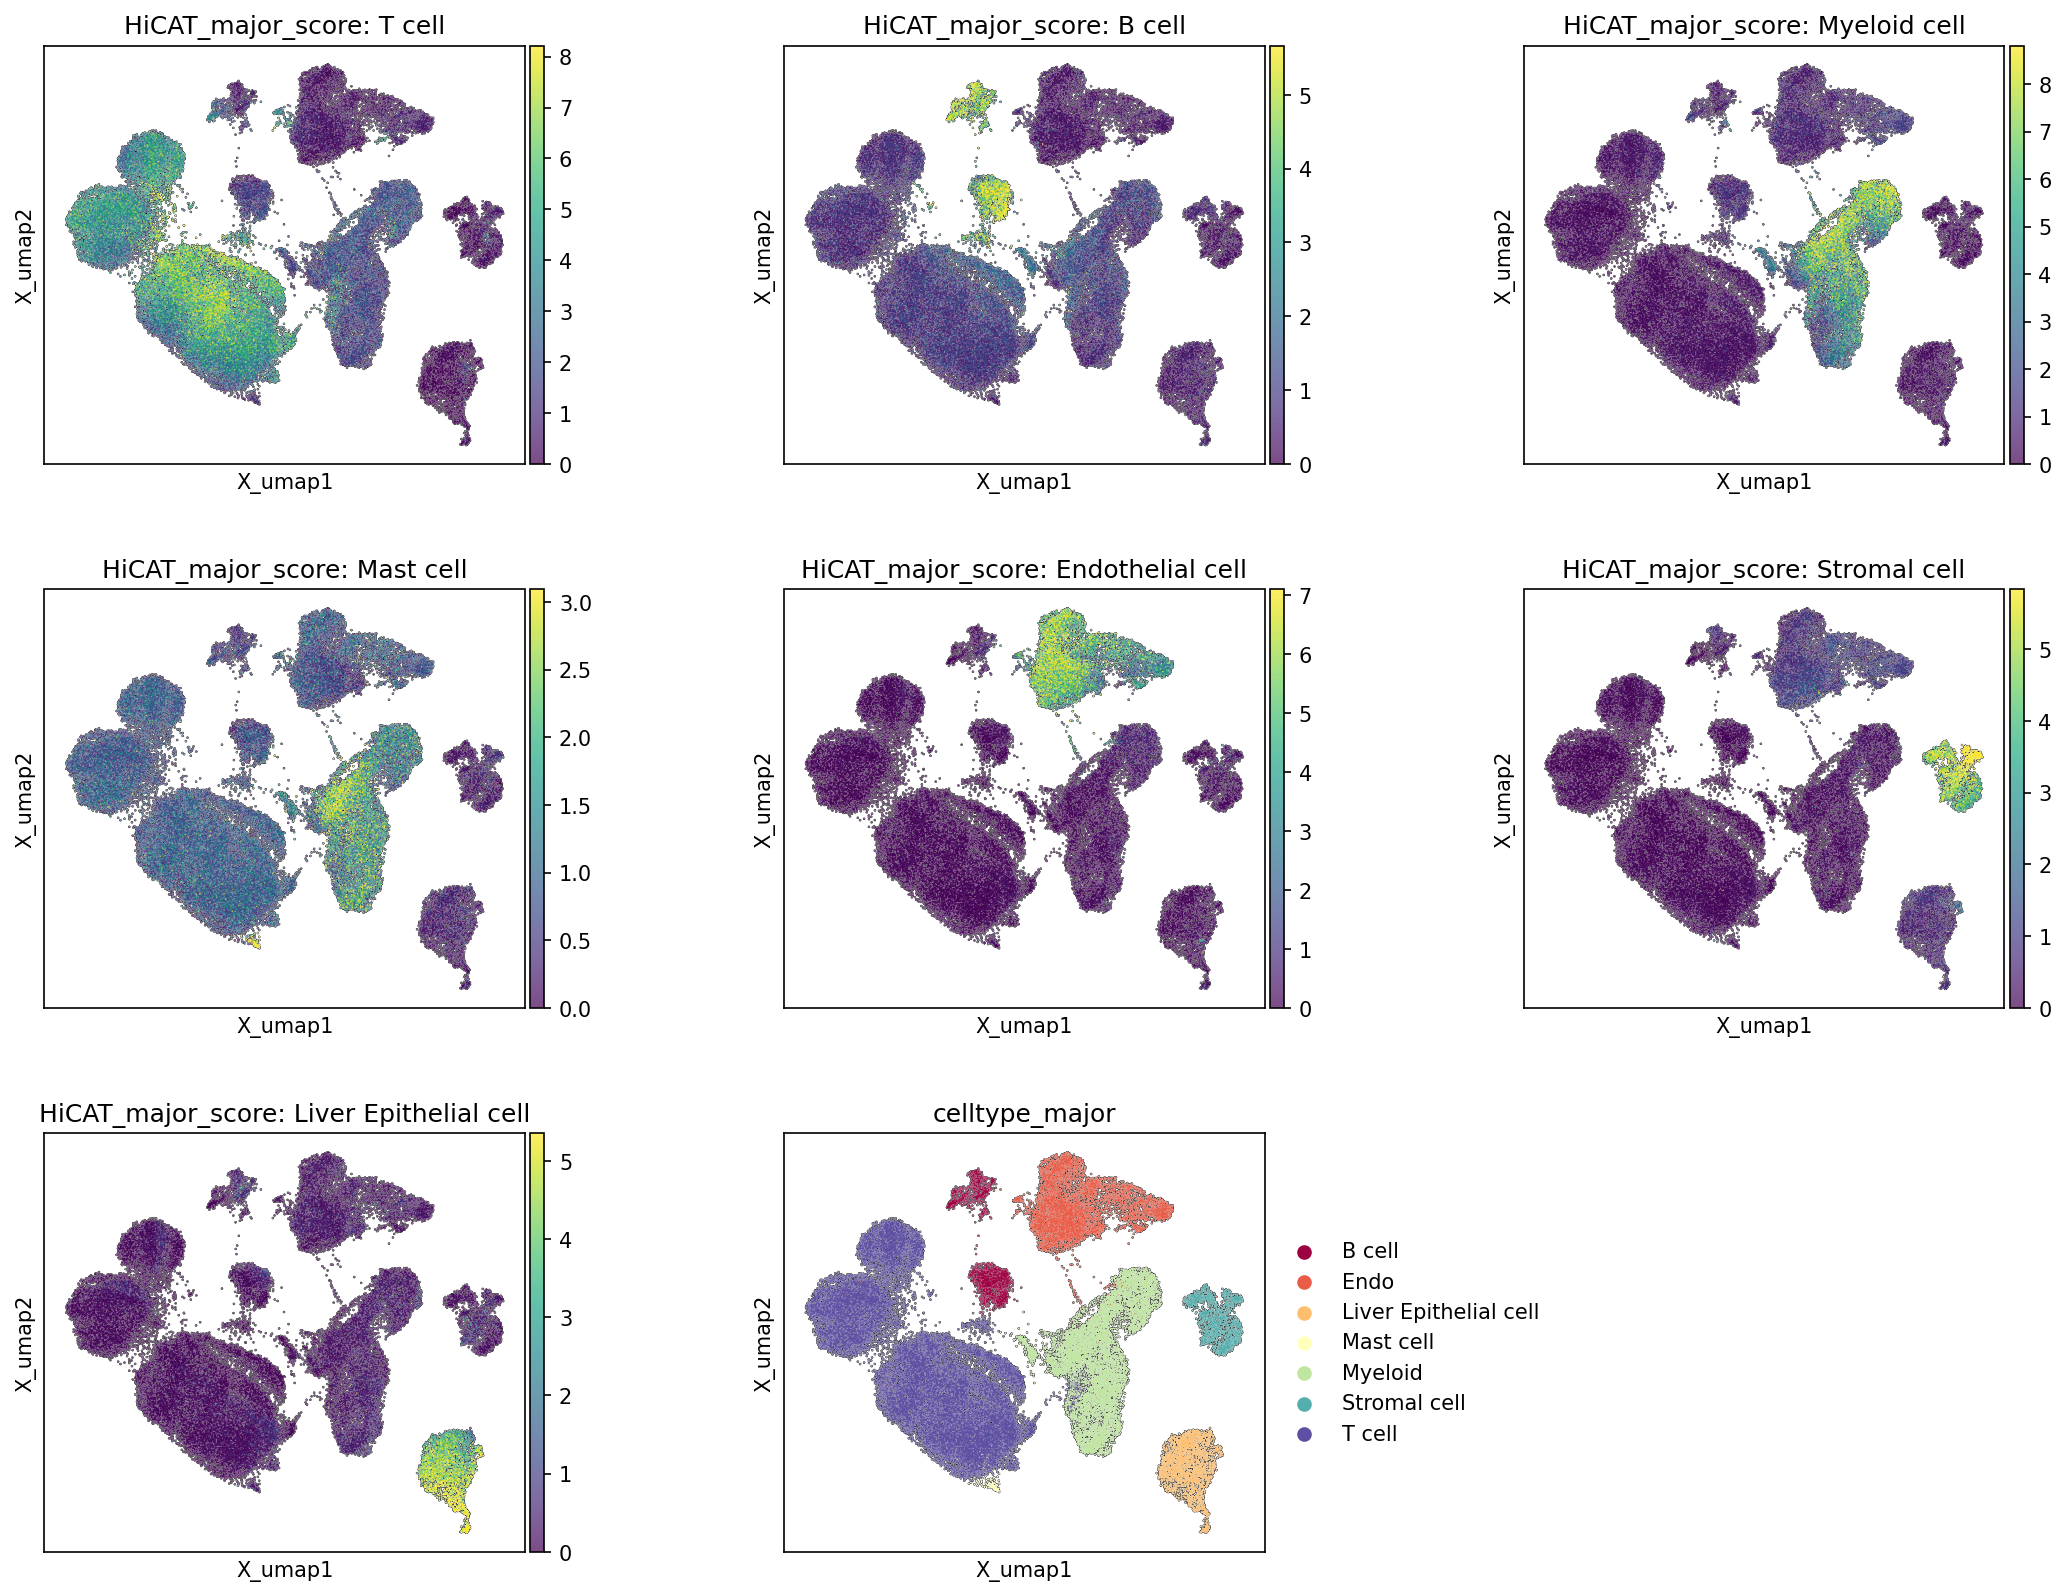
This analysis visualizes the distribution of major cell type scores across the UMAP embedding, alongside the final celltype_major annotation. The purpose is to assess the robustness and consistency of the assigned major cell types by examining how well marker gene-derived scores for each cell type align with their respective annotated clusters in the dimensionality reduction space. This is a critical step for validating cell identity and the overall quality of the single-cell RNA-seq data annotation.
Visual Summary
The UMAP plots display the HICAT-derived major cell type scores, where higher scores (yellow/green) indicate stronger expression of marker genes characteristic of that cell type, and lower scores (purple) indicate weaker expression. The final plot shows the UMAP colored by the celltype_major annotation.
- Distinct Clustering: The overall UMAP embedding reveals well-separated clusters, suggesting a good resolution of distinct cell populations within the liver tissue.
- High Correspondence of Scores and Annotations:
- Each HiCAT_major_score plot shows a clear enrichment of high scores (bright yellow/green) in distinct regions of the UMAP.
- Crucially, these high-score regions correspond almost perfectly with the clusters manually or algorithmically assigned to that specific celltype_major in the bottom-right plot. For example:
- High T cell scores are localized to the large cluster annotated as "T cell" (dark purple).
- High B cell scores are found in the "B cell" cluster (maroon).
- High Myeloid cell scores align with the "Myeloid cell" cluster (light green).
- High Mast cell scores delineate the "Mast cell" cluster (yellowish green).
- High Endothelial cell scores define the "Endothelial cell" cluster (orange).
- High Stromal cell scores are specific to the "Stromal cell" cluster (light purple).
- High Liver Epithelial cell scores accurately map to the "Liver Epithelial cell" cluster (light yellow).
- Specificity and Minimal Overlap: The scores are largely specific, with minimal "bleed-through" of high scores into clusters assigned to other major cell types. This indicates that the marker gene sets used for scoring are highly characteristic of their intended cell populations and that the clustering effectively segregates these cell types.
Biological Interpretation
The strong concordance between the HiCAT_major_score and the celltype_major annotations provides robust evidence for the accurate identification and demarcation of major cell populations within the human liver. This validation is particularly important in the context of disease such as cirrhosis, where changes in cell type composition or state can be critical.
- Reliable Cell Identity: The analysis confirms that the major cell type annotations (Myeloid cell, T cell, B cell, Stromal cell, Liver Epithelial cell, Mast cell, Endothelial cell) are well-supported by their respective marker gene expression profiles. This strengthens the foundation for downstream differential gene expression, pathway enrichment, and cell-cell interaction analyses that rely on accurate cell type definitions.
- Clustering Fidelity: The distinct separation of cell types on the UMAP, validated by specific marker scores, indicates that the underlying dimensionality reduction and clustering captured meaningful biological distinctions between these major cell populations.
- Liver Cell Composition: The presence of a diverse range of immune cells (T cell, B cell, Myeloid cell, Mast cell), structural cells (Endothelial cell, Stromal cell), and parenchymal cells (Liver Epithelial cell, which includes hepatocytes and cholangiocytes as per celltype_minor) reflects the complex cellular ecosystem of the liver, which undergoes significant remodeling in conditions like cirrhosis.
Annotation Notes
This visualization serves as a crucial check for annotation quality. The observed strong agreement between cell type scores and assigned labels suggests that the celltype_major annotations are robust and reliable. This provides a high level of confidence for subsequent analyses built upon these cell type assignments. No significant misannotations or ambiguous cell type boundaries are apparent at the major cell type level based on these score distributions.
3. Marker Gene Expression Across Liver Cell Subsets
[Analysis Visualization Results]...
Analysis Overview
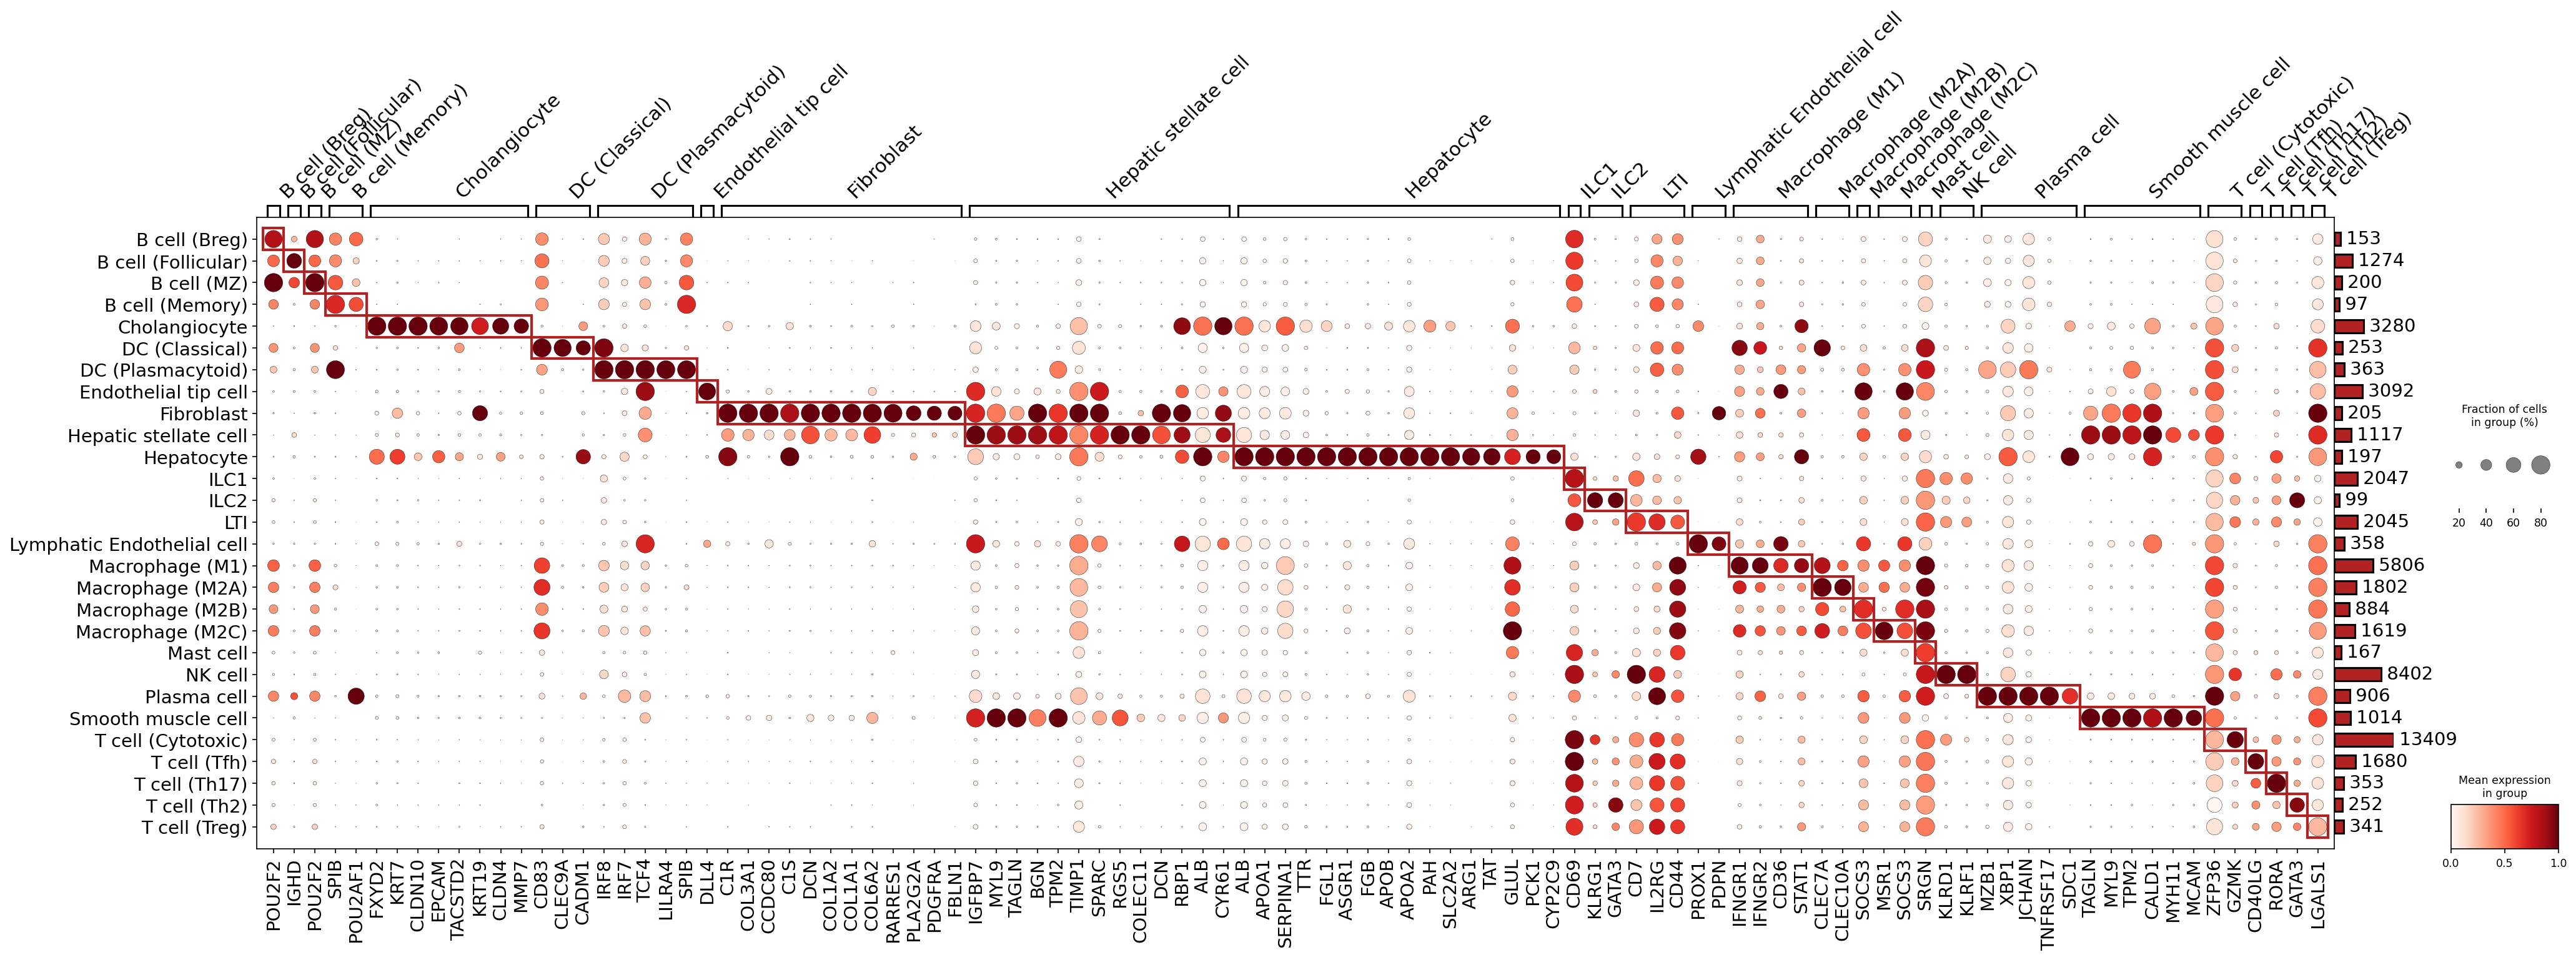
This analysis presents a dot plot illustrating the expression of marker genes across various cell subsets identified in the AnnData object. The celltype_subset annotations are used as categories for cell groups on the y-axis, and selected marker genes are displayed on the x-axis. The purpose of this plot is to visually assess the specificity and expression levels of these markers, which in turn helps to validate or refine the existing cell type annotations. The user query specifically requested a marker expression dot plot for celltype_subset, with target_cell set to None, implying a broad marker discovery and visualization across all subsets. The plot is configured to highlight specific markers for each cell group, with var_group_rotation set to 45 degrees for readability of gene symbols.
Visual Summary
The dot plot visualizes gene expression characteristics for 37 distinct celltype_subset populations. Each row represents a cell subset, and each column represents a gene.
- Dot Size: The size of each circle corresponds to the percentage of cells within that celltype_subset that express the given gene. Larger dots indicate a higher proportion of expressing cells.
- Dot Color: The color intensity of each circle represents the mean expression level of the gene within the expressing cells of that celltype_subset. Darker red indicates higher mean expression.
- Marker Grouping: Genes are grouped horizontally along the x-axis, and these groups are outlined by brackets at the top, often aligning with the specific celltype_subset they are intended to mark (indicated by the red boxes outlining clusters of markers specific to certain cell types).
- Cell Counts: A bar graph on the right side of the plot shows the total number of cells identified for each celltype_subset, providing context on the sample size for each group.
- Specificity and Expression: The plot clearly shows a diagonal pattern of highly specific and highly expressed markers (large, dark red dots) for many of the celltype_subset groups. For instance, Hepatocyte cells show strong, specific expression of genes like ALB, TTR, and FGB. Similarly, Cholangiocytes express KRT7, KRT19, and CLDN10 specifically.
Biological Interpretation
This dot plot serves as a crucial identity-check for the celltype_subset annotations by examining the expression of known and putative marker genes. The overall pattern of discrete blocks of high expression (large, dark red dots) along the diagonal strongly supports the distinct identities of most annotated cell subsets within the human liver.
Here's a breakdown of key observations related to specific cell populations:
- B cells: Various B cell subsets (B cell (Breg), B cell (Follicular), B cell (MZ), B cell (Memory)) show shared expression of classic B cell markers like POU2F2 (OCT2), IGHD, and MZB1, with MZB1 and JCHAIN becoming more prominent in Plasma cell populations, as expected. SDC1 (CD138) and TNFRSF17 (BCMA) further confirm Plasma cell identity. GeneCards: POU2F2, UniProt: SDC1
Liver Epithelial Cells:
- Cholangiocytes: Are well-defined by strong expression of epithelial markers KRT7, KRT19, EPCAM, and CLDN10. GeneCards: KRT7
- Hepatocytes: Show robust and specific expression of liver-specific metabolic and synthetic genes such as ALB (Albumin), TTR (Transthyretin), FGB (Fibrinogen Beta Chain), APOB (Apolipoprotein B), PAH, GLUL, PCK1, and CYP2C9. This confirms their primary parenchymal cell identity. GeneCards: ALB
Stromal Cells:
- Hepatic stellate cells: Display high expression of genes associated with myofibroblastic differentiation and extracellular matrix remodeling, including TAGLN (Transgelin), MYL9 (Myosin Light Chain 9), BGN (Biglycan), TPM2 (Tropomyosin 2), TIMP1 (TIMP Metallopeptidase Inhibitor 1), SPARC, and DCN (Decorin). This profile is consistent with their role in liver fibrosis. GeneCards: TAGLN
- Fibroblasts: Share some markers with hepatic stellate cells like DCN, FBLN1, and PDGFRA, consistent with their general stromal function.
- Endothelial cells: Endothelial cell, Endothelial tip cell, and Lymphatic Endothelial cell subsets express CD36. PROX1 is a key marker for Lymphatic Endothelial cell, as expected. GeneCards: PROX1
- Smooth muscle cell: Clearly identified by TAGLN and MYL9 expression, consistent with contractile functions.
Myeloid Cells:
- Dendritic cells (DC): DC (Classical) and DC (Plasmacytoid) subsets show distinct marker profiles. CD83 and CLEC9A are observed in DC (Classical), while LILRA4 and IRF7 are more prominent in DC (Plasmacytoid) DCs. GeneCards: LILRA4
- Macrophages: Various macrophage subtypes (Macrophage (M1), Macrophage (M2A), Macrophage (M2B), Macrophage (M2C), Macrophage (M2D)) generally express common myeloid markers like CD68 and MSR1 (CD204), with subtle differences in other markers like STAT1 for M1 and SOCS3 for some M2 subtypes, supporting the distinct functional polarization states within liver macrophages (Kupffer cells and monocyte-derived macrophages). GeneCards: CD68
Lymphoid Cells:
- NK cell and ILCs: NK cell and ILC1 populations show expression of cytotoxic markers like KLRD1 (CD94) and GZMK, consistent with their roles in innate immunity. ILC2 shows expression of GATA3 and IL2RG. GeneCards: KLRD1
- T cells: T cell (Cytotoxic), T cell (Tfh), T cell (Th17), T cell (Th2), and T cell (Treg) are largely defined by classical T cell markers like CD69, CD3, CD7, and CD44. Subtype-specific markers are also visible, such as GZMK for T cell (Cytotoxic), CD40LG for T cell (Tfh), and GATA3 for T cell (Th2). LGALS1 (Galectin-1) shows some broad expression across T cell subsets and other immune cells. GeneCards: GZMK
The overall strong diagonal expression pattern with minimal off-target expression for the prominent markers indicates that the celltype_subset annotations are generally well-supported by these gene expression profiles.
Annotation Notes
The marker expression dot plot effectively validates the distinct identities of the majority of celltype_subset annotations. The presence of highly specific and highly expressed markers for most cell groups confirms that the clustering and annotation process has successfully segregated biologically meaningful populations.
- Robust Annotation: Cell types such as Hepatocytes, Cholangiocytes, Hepatic stellate cells, B cells, Plasma cells, and specific T cell subsets show very clear and specific marker gene expression profiles, bolstering confidence in their annotations.
- Subtype Resolution: The plot demonstrates good resolution in distinguishing closely related cell types and their subtypes, for example, within the B cell, DC, Macrophage, and T cell compartments, based on unique marker combinations.
- Potential Overlaps/Ambiguities: While most annotations are distinct, some genes (e.g., DCN, MYL9, TAGLN) show broader expression across related stromal cell types like Fibroblasts and Hepatic stellate cells, which is biologically plausible given their shared mesenchymal origins and functions in the liver microenvironment. Similarly, some immune cell markers might show low-level expression across several immune populations, reflecting common immune signaling pathways or differentiation states.
In conclusion, the marker gene expression patterns overwhelmingly support the current celltype_subset annotations, indicating a high quality of cell type identification in this single-cell RNA-seq dataset from the human liver.
4. Cell Type Population Shifts in Cirrhosis vs. Healthy Liver
[Analysis Visualization Results]...
Analysis Overview
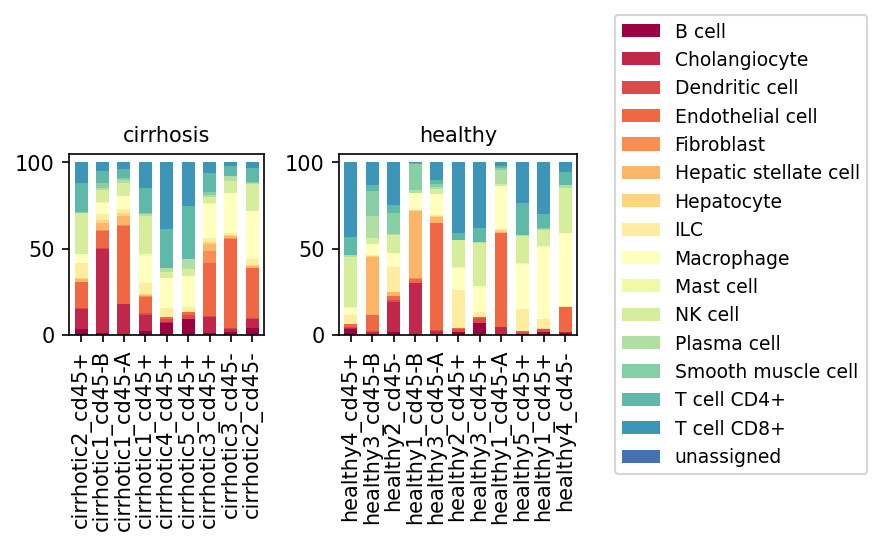
This analysis presents a population bar plot displaying the relative proportions of minor cell types within individual samples from human liver tissue. The samples are categorized into two conditions: 'cirrhosis' and 'healthy'. Each bar represents a single sample, with stacked segments showing the percentage contribution of different celltype_minor populations. The visualization helps to identify differences in cellular composition that may be associated with liver cirrhosis.
Visual Summary
The stacked bar plots illustrate the cellular heterogeneity across individual liver samples from both healthy and cirrhotic conditions.
- Overall Composition: A clear distinction in cellular profiles is observable between the healthy and cirrhotic liver samples. While healthy samples tend to exhibit varying proportions of different cell types, cirrhotic samples show more consistent patterns indicative of disease.
- Hepatocyte Reduction in Cirrhosis: In healthy samples, Hepatocytes (light orange/yellow) constitute a substantial proportion of cells in several samples (e.g., 'healthy1_cd45-A', 'healthy4_cd45-'). Conversely, most cirrhotic samples show a marked decrease in the relative abundance of Hepatocytes, consistent with parenchymal loss in chronic liver disease.
Increase in Immune Cells in Cirrhosis:
- Macrophages (light yellow) appear significantly expanded in many cirrhotic samples (e.g., 'cirrhotic1_cd45-B', 'cirrhotic1_cd45-A', 'cirrhotic3_cd45+') compared to most healthy controls, suggesting heightened inflammatory activity.
- T cells (CD4+ and CD8+, teal/blue) are notably elevated in several cirrhotic samples (e.g., 'cirrhotic2_cd45+', 'cirrhotic4_cd45+') compared to healthy controls, indicating increased immune infiltration.
Increase in Stromal/Biliary Cells in Cirrhosis:
- Fibroblasts (salmon) and Hepatic stellate cells (orange), key players in liver fibrosis, show increased and more consistent proportions in cirrhotic samples, reflecting active fibrogenesis.
- Cholangiocytes (red), representing biliary epithelial cells, also appear more prominent in cirrhotic samples, suggesting a potential ductular reaction.
- Variability within Conditions: While general trends are observed, there is sample-to-sample variability in cell type proportions within both the healthy and cirrhotic groups, highlighting the individual differences in disease presentation and tissue composition.
Biological Interpretation
The observed shifts in cell type populations are highly consistent with the known pathology of liver cirrhosis.
- Hepatocyte Loss: The reduction in Hepatocyte populations in cirrhotic livers reflects the progressive destruction of liver parenchyma and replacement by fibrous tissue, a hallmark of cirrhosis. This loss of functional liver cells contributes to impaired liver function.
- Inflammation and Immune Activation: The substantial increase in Macrophages, CD4+ T cells, and CD8+ T cells in cirrhotic samples indicates a strong inflammatory response and active immune cell infiltration. Macrophages (including Kupffer cells and monocyte-derived macrophages) are crucial mediators of inflammation and contribute significantly to fibrotic processes by secreting pro-fibrotic and pro-inflammatory cytokines. T cells play diverse roles in chronic liver diseases, contributing to both hepatocyte injury and modulation of fibrosis.
- Fibrogenesis and Ductular Reaction: The expansion of Fibroblasts and Hepatic stellate cells (HSCs) directly points to active fibrogenesis. Activated HSCs are the primary source of extracellular matrix components that accumulate during fibrosis. The increased proportion of Cholangiocytes suggests a compensatory proliferative response of bile duct cells (ductular reaction), which is a common feature in chronic liver injury and a marker of severity in cirrhosis, contributing to fibrogenesis and chronic inflammation.
- Vascular Remodeling: The sustained presence or potential increase of Endothelial cells can be linked to the extensive vascular remodeling and angiogenesis that occurs in cirrhotic livers, contributing to portal hypertension and altered liver architecture.
Clinical or Translational Implications
The changes in cell type composition observed here provide valuable insights into the pathophysiology of cirrhosis and may have several clinical implications:
- Biomarker Identification: The relative abundance of specific cell types, such as Macrophages, T cells, Fibroblasts, and Hepatic stellate cells, could serve as potential biomarkers for the diagnosis, staging, or progression of liver cirrhosis. Longitudinal studies could assess their utility for monitoring disease severity or response to therapy.
- Therapeutic Targets: Cell types significantly expanded in cirrhosis, particularly Macrophages, activated Hepatic stellate cells, and T cells, represent attractive therapeutic targets. Strategies aimed at modulating their activation, proliferation, or specific functions could potentially mitigate inflammation and fibrosis progression in cirrhosis. For example, targeting activated HSCs to inhibit collagen production or modulating macrophage polarization to promote resolution of inflammation are active areas of research.
- Disease Heterogeneity: The sample-to-sample variability within the cirrhotic group underscores the heterogeneous nature of cirrhosis among individuals. This highlights the need for personalized medicine approaches that consider the unique cellular landscape of each patient for more effective treatment strategies.
5. T Cell and Innate Lymphoid Cell Subpopulation Analysis in Cirrhosis
[Analysis Visualization Results]...
Analysis Overview
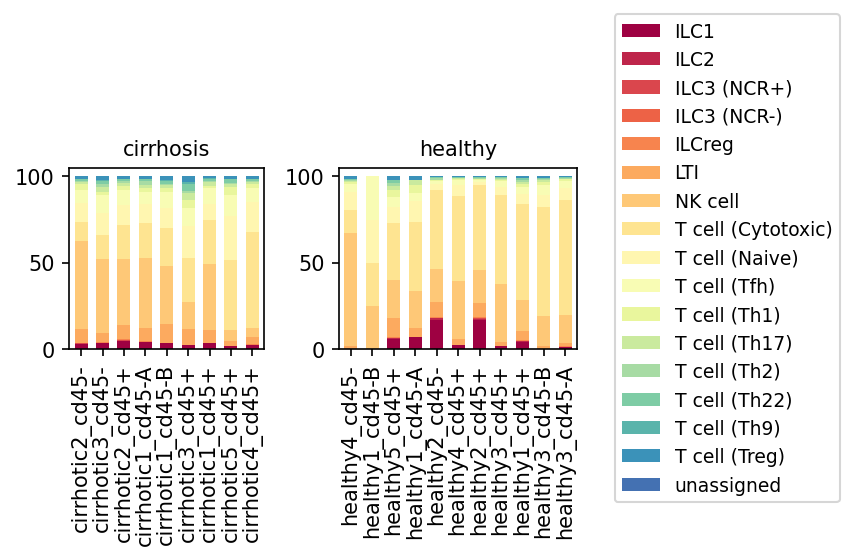
This analysis presents a population bar plot illustrating the relative proportions of various T cell and Innate Lymphoid Cell (ILC) subsets across individual samples from both 'healthy' and 'cirrhosis' conditions. The data is derived from single-cell RNA sequencing of liver tissue, with samples grouped by disease state to highlight differences in immune cell composition at the 'celltype_subset' level.
Visual Summary
The stacked bar plots display the proportional distribution of T cell subsets and ILCs for each sample, separated into 'cirrhosis' and 'healthy' conditions. Each bar represents a single sample, with the height of colored segments indicating the percentage contribution of a specific cell type subset.
- Reduced Innate Lymphoid Cells (ILCs) and NK cells in Cirrhosis: A striking observation is the marked reduction, and in many samples near absence, of ILC1, ILC2, ILC3 (NCR+), ILC3 (NCR-), ILCreg, and NK cells in the 'cirrhosis' samples compared to 'healthy' samples. In healthy livers, these innate lymphocyte populations consistently contribute a noticeable proportion to the overall immune cell compartment, occupying the lower part of the stacked bars with darker red and orange hues.
- Dominance of T cell Subsets in Cirrhosis: In contrast to the healthy samples, the immune cell composition in cirrhotic livers is overwhelmingly dominated by various T cell subsets, particularly T cell (Cytotoxic), T cell (Naive), and T cell (Tfh). While these T cell subsets are also present in healthy samples, their relative proportion appears amplified in cirrhosis due to the substantial decrease in ILCs and NK cells.
- Consistency within Conditions: Within the 'cirrhosis' group, the pattern of reduced ILCs/NK cells and T cell dominance is largely consistent across all analyzed samples. Similarly, the presence of ILCs/NK cells is generally consistent across healthy samples, although there is some sample-to-sample variability in the exact proportions of each subset.
- T regulatory cells (Treg) and other T cell subsets: T cell (Treg) cells are present in both conditions, appearing as a thin dark blue segment towards the top of the bars. No dramatic proportional shifts are visually apparent for T cell (Treg) or other minor T helper (Th) cell subsets (Th1, Th17, Th2, Th22, Th9) based on this visualization, although their relative contributions are more discernible in healthy samples where the overall T cell compartment is less compressed by the lack of ILCs.
Biological Interpretation
The observed shift in immune cell populations, specifically the significant reduction of innate lymphoid cells (ILCs) and NK cells in cirrhotic livers compared to healthy ones, suggests profound changes in the liver's immune landscape during disease progression.
- Impaired Innate Immunity: ILCs and NK cells are critical components of the liver's innate immune system, playing vital roles in initial responses to pathogens, inflammation, and immune surveillance against transformed cells.
- ILC1s are known for their IFN-γ production and antiviral/antitumor activities, similar to Th1 cells.
- ILC2s are involved in type 2 immune responses, tissue repair, and fibrosis.
- ILC3s contribute to barrier immunity and lymphoid tissue development.
- NK cells are key cytotoxic lymphocytes involved in antiviral defense and tumor surveillance, and their dysfunction or depletion is often implicated in chronic liver diseases and hepatocellular carcinoma development [1].
The reduced proportions of these innate immune cells in cirrhosis could indicate a compromised ability of the liver to mount effective early immune responses, clear senescent or damaged cells, or control chronic viral infections, potentially exacerbating liver damage and contributing to disease progression. This reduction could result from cell death, egress from the liver, or altered differentiation pathways under chronic inflammatory conditions.
- Adaptive Immune Over-representation: The relative enrichment of various T cell subsets in cirrhosis, particularly cytotoxic T cells, T naive cells, and T follicular helper (Tfh) cells, points towards an adaptive immune response that may be dysregulated. While T cells are crucial for specific immunity, an imbalance or chronic activation can contribute to ongoing inflammation and fibrogenesis in the liver. For instance, cytotoxic T cells can mediate hepatocyte damage, and certain T helper subsets (e.g., Th1 and Th17 cells, though not dramatically altered in proportion here, their activation state could differ) are known to drive pro-inflammatory and profibrotic pathways in chronic liver disease [2].
Clinical or Translational Implications
The distinct immune cell composition in cirrhotic livers has several potential clinical implications:
- Biomarker Potential: The marked reduction in specific ILC and NK cell subsets could serve as potential biomarkers for distinguishing cirrhotic from healthy livers, or even for monitoring disease severity or prognosis.
- Therapeutic Targeting: Understanding the depletion of innate immune cells and the relative abundance of adaptive T cells opens avenues for immunomodulatory therapies. Strategies to restore or enhance the function of beneficial innate lymphocytes like NK cells or ILCs, or to modulate specific T cell responses (e.g., dampen pro-fibrotic T cell subsets, or enhance regulatory T cell function), could be explored to slow disease progression or prevent complications such as hepatocellular carcinoma in patients with cirrhosis [3].
- Disease Pathogenesis Insights: These findings underscore the dynamic interplay between innate and adaptive immunity in chronic liver disease and provide insights into the immune mechanisms contributing to cirrhosis pathogenesis, which can guide further mechanistic studies.
---
References
- Sun, R., et al. (2015). Natural killer cells in liver injury and repair. *Journal of Autoimmunity*, 65, 52-61. PubMed Search: "NK cells liver cirrhosis"
- Trautwein, C., et al. (2020). Immune Cells in Liver Fibrosis. *Seminars in Liver Disease*, 40(2), 162-177. PubMed Search: "T cells liver fibrosis"
- Li, P., et al. (2021). The immune landscape of liver cirrhosis: mechanisms and therapeutic implications. *Frontiers in Immunology*, 12, 706225. PubMed Search: "immunotherapy cirrhosis"
6. T Cell Subset Population Shifts in Liver Cirrhosis
[Analysis Visualization Results]...
Analysis Overview
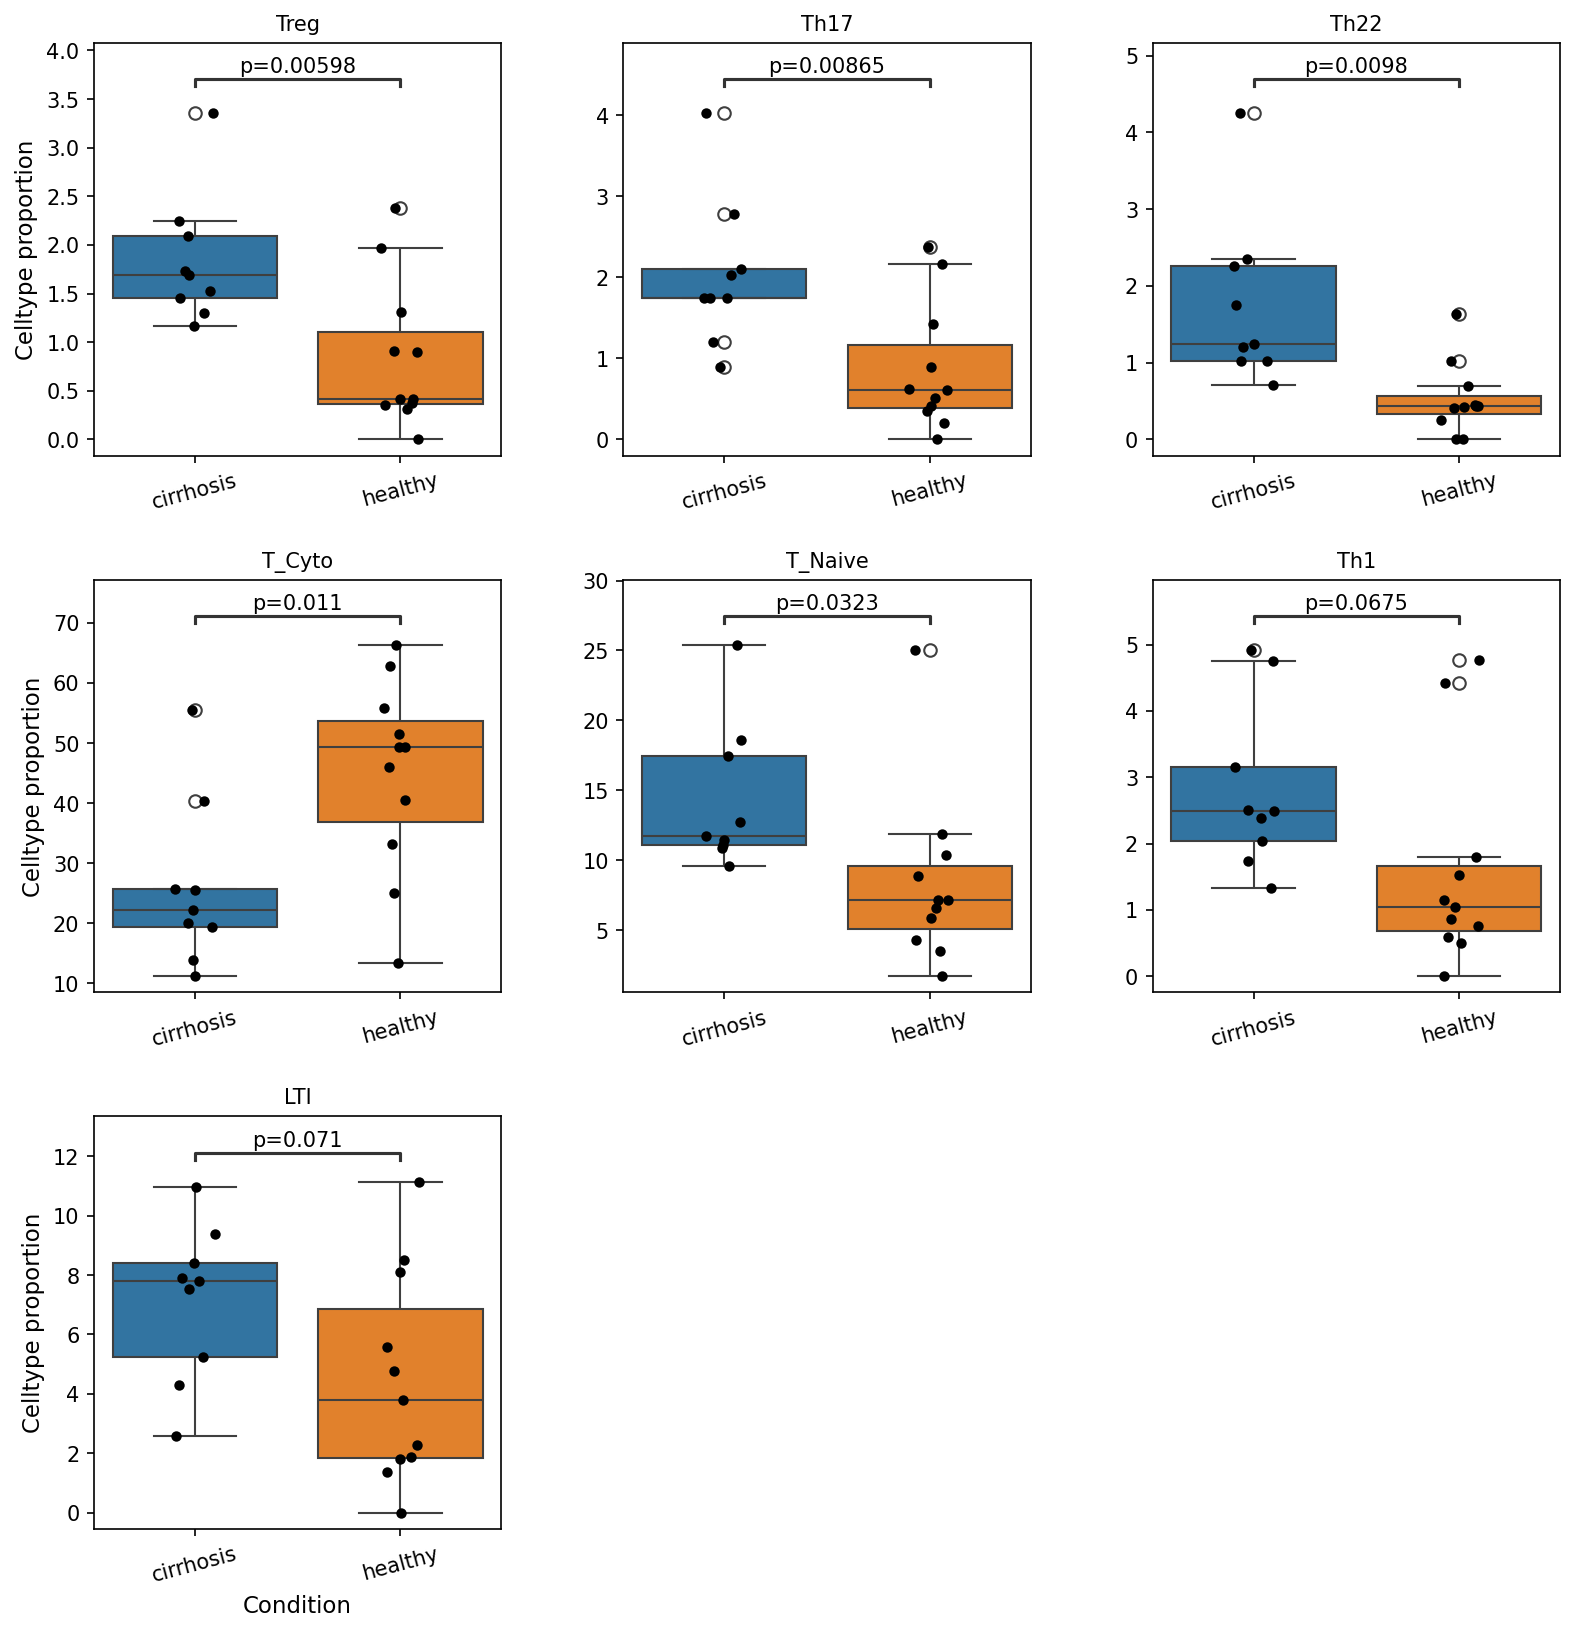
This analysis presents box plots illustrating the proportions of various T cell subsets in liver tissue, comparing individuals with cirrhosis against healthy controls. The plots highlight statistically significant differences (p-value < 0.1) in the relative abundance of six specific T cell subsets: Regulatory T cells (Treg), T helper 17 cells (Th17), T helper 22 cells (Th22), Cytotoxic T cells (T_Cyto), Naive T cells (T_Naive), and T helper 1 cells (Th1).
Visual Summary
The visualization displays six individual box plots, each representing a different T cell subset, comparing its proportion (Y-axis) between 'cirrhosis' (blue boxes) and 'healthy' (orange boxes) conditions (X-axis). Each plot includes individual data points (black dots for actual values, open circles for outliers) to show the distribution of observations.
Key observations from the plots are:
Increased Proportions in Cirrhosis:
- Treg cells are significantly elevated in cirrhosis (median ~1.75%) compared to healthy controls (median ~0.5%) (p=0.00598).
- Th17 cells show a significantly higher proportion in cirrhosis (median ~2%) relative to healthy individuals (median ~0.75%) (p=0.00865).
- Th22 cells are also significantly more abundant in cirrhosis (median ~1.25%) compared to healthy controls (median ~0.5%) (p=0.0098).
- T_Naive cells exhibit a higher median proportion in cirrhosis (median ~11-12%) than in healthy samples (median ~6-7%) (p=0.0323).
- Th1 cells show a trend towards higher proportions in cirrhosis (median ~2.5-2.75%) compared to healthy (median ~1-1.25%) (p=0.0675), although with slightly higher variability.
Decreased Proportions in Cirrhosis:
- T_Cyto (Cytotoxic T cells) are significantly reduced in cirrhosis (median ~22-23%) compared to healthy controls (median ~47-48%) (p=0.011).
In summary, most of the T helper subsets (Treg, Th17, Th22, Th1) along with Naive T cells show increased proportions in cirrhosis, while Cytotoxic T cells are notably decreased.
Biological Interpretation
The observed shifts in T cell subset populations underscore a profound immune dysregulation within the liver microenvironment during cirrhosis.
- Elevated Pro-Inflammatory T Helper Cells (Th1, Th17, Th22): The significant increase in Th1, Th17, and Th22 cells in cirrhosis suggests a heightened inflammatory state.
- Th1 cells produce IFN-γ, which is crucial for cell-mediated immunity but can also contribute to chronic inflammation and liver injury.
- Th17 cells secrete IL-17 and IL-22, playing roles in host defense and autoimmune diseases. Their increased presence often correlates with inflammation and fibrosis progression in various liver pathologies.
- Th22 cells primarily produce IL-22, which has dual roles in liver disease – promoting tissue repair but also contributing to inflammation and fibrosis depending on the context. The elevated levels of these subsets point towards a persistent, possibly maladaptive, inflammatory response driving liver damage in cirrhosis.
- Increased Regulatory T cells (Treg): The significant expansion of Treg cells in cirrhotic livers could represent a compensatory mechanism by the immune system to suppress excessive inflammation and limit tissue damage. However, in chronic liver diseases, an increase in Tregs can sometimes be detrimental, potentially impairing anti-viral or anti-tumor immunity and contributing to immune tolerance or exhaustion in the context of unresolved chronic infection or hepatocellular carcinoma development. PubMed search: Treg cells cirrhosis liver
- Decreased Cytotoxic T cells (T_Cyto): The substantial reduction in Cytotoxic T cells is a critical finding. These cells are essential for eliminating virus-infected cells and tumor cells. Their diminished proportion in cirrhosis might indicate:
- Immune Exhaustion: A common feature of chronic infections and cancer, where T cells lose their effector functions.
- Impaired Anti-Viral/Anti-Tumor Immunity: Patients with cirrhosis are at high risk for hepatocellular carcinoma and can have persistent viral infections (e.g., HCV, HBV). A lack of effective cytotoxic T cell responses could contribute to disease progression and susceptibility to complications.
- Increased Naive T cells: An increase in Naive T cells in a chronically inflamed organ like a cirrhotic liver is somewhat unexpected, as chronic inflammation typically leads to their differentiation into effector or memory cells. This could suggest:
- Altered T cell Homing/Trafficking: Changes in chemokine expression patterns in the cirrhotic liver might favor the recruitment or retention of naive T cells, or impair their exit.
- Impaired Activation/Differentiation: The microenvironment in cirrhosis might not be conducive to effective naive T cell activation and differentiation into effector subsets, leading to their accumulation.
Collectively, these findings paint a picture of an imbalanced immune response in cirrhosis, characterized by an ongoing pro-inflammatory milieu alongside compromised cytotoxic immunity, potentially contributing to disease progression and complications.
Clinical or Translational Implications
The distinct shifts in T cell subset proportions observed in cirrhotic livers hold significant clinical and translational implications:
- Biomarker Potential: The proportions of these T cell subsets, particularly the ratio of pro-inflammatory to cytotoxic or regulatory cells, could serve as novel biomarkers for diagnosing cirrhosis, staging disease severity, predicting disease progression, or monitoring response to therapy.
- Therapeutic Targets: Modulating the balance of these T cell populations represents a promising therapeutic strategy. For example, strategies aimed at suppressing pathogenic Th1/Th17/Th22 responses or enhancing cytotoxic T cell function could ameliorate liver inflammation, fibrosis, and improve immune surveillance against hepatocellular carcinoma. Conversely, understanding the context-dependent role of Tregs in cirrhosis could guide targeted immunomodulation.
- Understanding Pathogenesis: These results provide deeper insights into the immunological mechanisms driving cirrhosis. For instance, the reduction in cytotoxic T cells highlights a potential immunodeficiency that could be addressed to reduce the risk of infection and cancer.
- Monitoring Immunotherapy: If immunomodulatory therapies are developed for cirrhosis, monitoring these T cell subset populations could be crucial for assessing treatment efficacy and guiding personalized medicine approaches.
7. Macrophage Subset Population Analysis in Cirrhosis
[Analysis Visualization Results]...
Analysis Overview
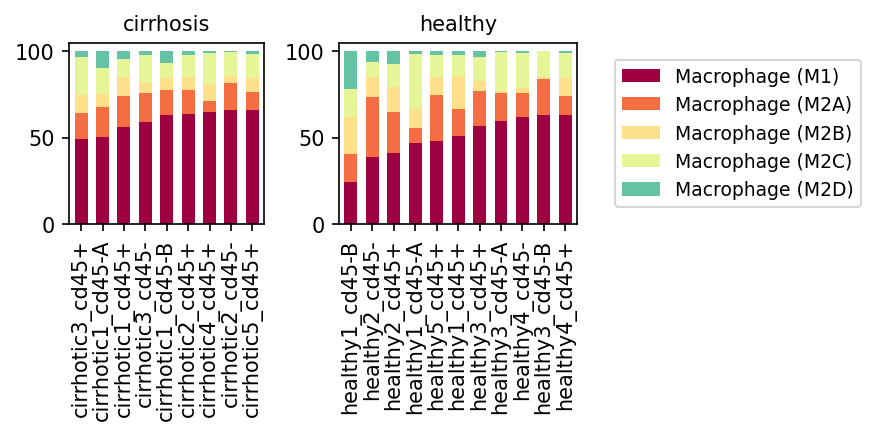
This analysis presents a population bar plot illustrating the relative proportions of different macrophage subsets (Macrophage M1, M2A, M2B, M2C, M2D) within individual liver samples from both healthy individuals and patients with cirrhosis. The purpose is to identify potential shifts in macrophage polarization patterns associated with the progression of liver cirrhosis.
Visual Summary
The stacked bar plots display the proportional distribution of five macrophage subsets (M1, M2A, M2B, M2C, M2D) across various samples, segregated by 'cirrhosis' and 'healthy' conditions.
- In cirrhotic samples: Macrophage (M1) (dark red) is the most prominent subset, consistently comprising the largest proportion (approximately 50-65%) of total macrophages across all cirrhotic samples. Macrophage (M2A) (orange) is the second most abundant, followed by Macrophage (M2B) (light yellow). Macrophage (M2C) (pale yellow) and (M2D) (teal) are present in smaller, more variable proportions.
- In healthy samples: Macrophage (M1) is also a significant component, but its average proportion appears slightly lower and more variable compared to the cirrhotic samples. Notably, Macrophage (M2A) shows considerable variability and, in several healthy samples (e.g., healthy1_cd45-B, healthy2_cd45-A, healthy1_cd45-A, healthy3_cd45-A), it constitutes a substantial proportion, sometimes even exceeding that of M1.
- Comparison between conditions: There is a clear trend of increased relative abundance of Macrophage (M1) in cirrhotic samples compared to healthy samples. Conversely, while M2A is present in both conditions, its contribution appears more variable and relatively lower on average in cirrhosis, suggesting a shift in the overall M1/M2 balance.
Biological Interpretation
Macrophages, including tissue-resident Kupffer cells and monocyte-derived macrophages, are crucial immune cells in the liver, demonstrating significant plasticity. Their polarization into distinct functional phenotypes, broadly categorized as M1 (pro-inflammatory) and M2 (anti-inflammatory, pro-resolving, pro-fibrotic), plays a pivotal role in liver homeostasis and disease pathogenesis.
- The observed dominance and relative increase of Macrophage (M1) in cirrhotic livers strongly indicates a sustained pro-inflammatory environment. M1 macrophages are characterized by their ability to produce pro-inflammatory cytokines (e.g., TNF-α, IL-1β, IL-6), express high levels of MHC class II molecules, and have potent phagocytic and antimicrobial activities. In the context of chronic liver injury leading to cirrhosis, persistent M1-driven inflammation exacerbates hepatocyte damage and activates hepatic stellate cells, which are the primary cells responsible for extracellular matrix deposition and fibrosis development.
- While M2 macrophages are generally associated with anti-inflammatory responses and tissue repair, certain M2 subtypes (e.g., M2A and M2C) can also contribute to fibrogenesis by secreting pro-fibrotic mediators and promoting wound healing responses that become dysregulated in chronic injury. The altered proportion and potential relative reduction of M2A in cirrhosis, compared to some healthy samples where it is quite prominent, suggest a disturbed balance that favors chronic inflammation and potentially impaired resolution or dysregulated repair mechanisms.
- This shift towards a predominant M1 phenotype underscores the critical role of inflammation in driving cirrhosis progression. The liver microenvironment in cirrhosis appears to favor macrophage polarization towards a pro-inflammatory state, contributing to the ongoing tissue damage and fibrotic remodeling characteristic of the disease.
https://pubmed.ncbi.nlm.nih.gov/?term=macrophage+polarization+cirrhosis
Clinical or Translational Implications
The distinct shift in macrophage subset populations observed in cirrhotic livers has important clinical and translational implications:
- Biomarker Potential: The elevated proportion of M1 macrophages could serve as a potential diagnostic or prognostic biomarker for cirrhosis severity or progression.
- Therapeutic Targeting: Modulating macrophage polarization represents a promising therapeutic strategy. Interventions aimed at suppressing M1 macrophage activation or promoting the beneficial functions of specific M2 subsets could attenuate inflammation, reduce liver fibrosis, and potentially slow or reverse disease progression in cirrhosis. This could involve targeting specific signaling pathways that drive M1 polarization or developing strategies to re-educate macrophages towards a pro-resolving phenotype.
- Drug Development: These findings could guide the development of novel immunomodulatory drugs that specifically target macrophage phenotypes to restore immune homeostasis in the cirrhotic liver.
8. Differential Abundance of Macrophage Subsets in Cirrhosis
[Analysis Visualization Results]...
Analysis Overview
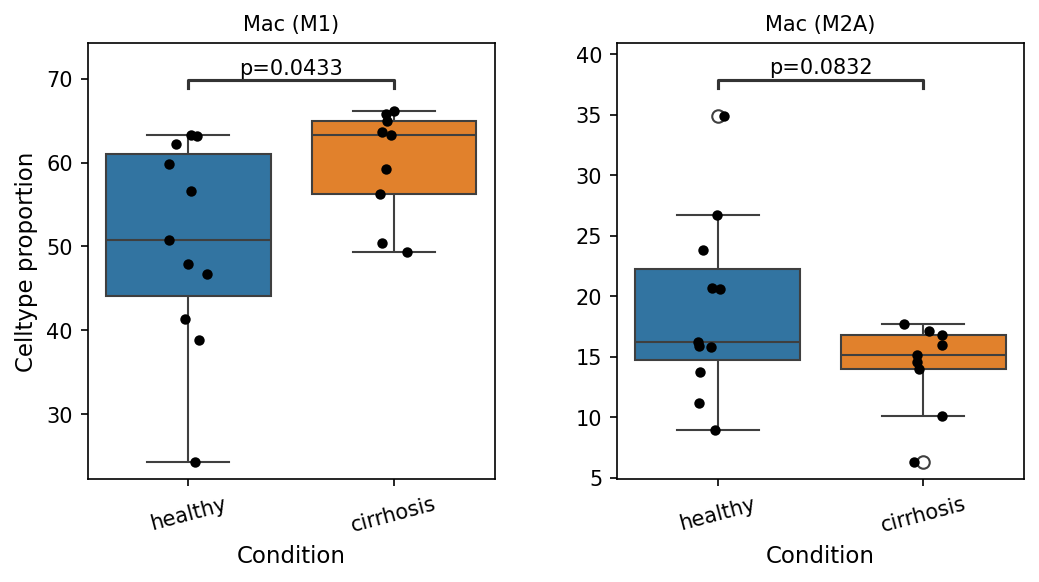
This analysis investigates the proportional representation of specific macrophage subsets, Macrophage (M1) and Macrophage (M2A), within the liver across two conditions: healthy and cirrhosis. The objective is to identify any statistically significant shifts in these cell populations that may contribute to the pathology of cirrhosis, a chronic liver disease characterized by inflammation and fibrosis. Box plots are employed to visualize the distribution of celltype proportions for each subset, and statistical testing identifies differences between conditions with a p-value cutoff of 0.1.
Visual Summary
The box plots display the celltype proportions for two macrophage subsets that exhibited statistically significant differences between healthy and cirrhotic liver samples:
- Macrophage (M1): The proportion of Macrophage (M1) cells is significantly increased in the cirrhosis condition compared to the healthy condition (p=0.0433). The median M1 proportion in healthy livers is around 50%, while in cirrhotic livers, it rises to approximately 60%. This suggests a higher prevalence of M1 macrophages in the diseased state.
- Macrophage (M2A): Conversely, the proportion of Macrophage (M2A) cells is significantly decreased in the cirrhosis condition when compared to the healthy condition (p=0.0832). The median M2A proportion is around 16% in healthy samples, dropping to about 15% in cirrhotic samples. Both plots include individual data points, providing insight into the variability within each group.
Biological Interpretation
The observed shifts in macrophage subset proportions in cirrhosis are biologically significant, indicating a reprogramming of the immune microenvironment in the liver during disease progression.
- Skew Towards Pro-inflammatory Macrophage (M1) Phenotype: The significant increase in Macrophage (M1) cells in cirrhotic livers points to an enhanced pro-inflammatory state. M1 macrophages are classically activated and are known producers of inflammatory cytokines (e.g., TNF-α, IL-1β, IL-6) and reactive oxygen species, which contribute to hepatocyte damage and perpetuate chronic inflammation and fibrosis in the liver PubMed search: M1 macrophages liver fibrosis. This sustained inflammatory environment is a critical driver of liver disease progression to cirrhosis.
- Reduction in Reparative Macrophage (M2A) Phenotype: The corresponding decrease in Macrophage (M2A) cells suggests an impaired capacity for anti-inflammatory responses and tissue repair. M2A macrophages are generally associated with resolving inflammation, promoting tissue remodeling, and clearing debris, although their roles are complex and context-dependent. A reduction in this subset could imply a failure of the liver to properly regulate the inflammatory response and initiate effective repair mechanisms, thereby exacerbating chronic injury and contributing to unchecked fibrogenesis PubMed search: M2 macrophages liver repair.
In summary, the data indicates a dysregulation of macrophage polarization in cirrhosis, characterized by an increased proportion of pro-inflammatory M1-like macrophages and a decreased proportion of M2A-like macrophages, which normally contribute to tissue repair and immune regulation. This imbalance is a hallmark of chronic inflammatory diseases and plays a central role in the pathogenesis of liver cirrhosis.
Clinical or Translational Implications
The findings regarding macrophage subset dynamics in cirrhosis have several important clinical and translational implications:
- Pathogenic Mechanism: These results provide a clearer understanding of the immune cell dysfunction that underpins cirrhosis. The observed shift in macrophage polarization highlights the central role of these cells in driving chronic inflammation and fibrosis.
- Biomarker Potential: The altered proportions of M1 and M2A macrophages could serve as potential cellular biomarkers for the diagnosis, prognosis, or monitoring of disease severity and progression in patients with cirrhosis.
- Therapeutic Targets: Modulating macrophage polarization represents a promising therapeutic strategy. Interventions aimed at restoring the balance between M1 and M2 macrophage populations, for example, by dampening M1 activation or enhancing M2A differentiation and function, could potentially attenuate inflammation, halt fibrotic progression, and promote liver regeneration in cirrhosis PubMed search: macrophage polarization cirrhosis therapy.
9. Cell-Cell Interaction Patterns in Healthy and Cirrhotic Liver
[Analysis Visualization Results]...
Analysis Overview
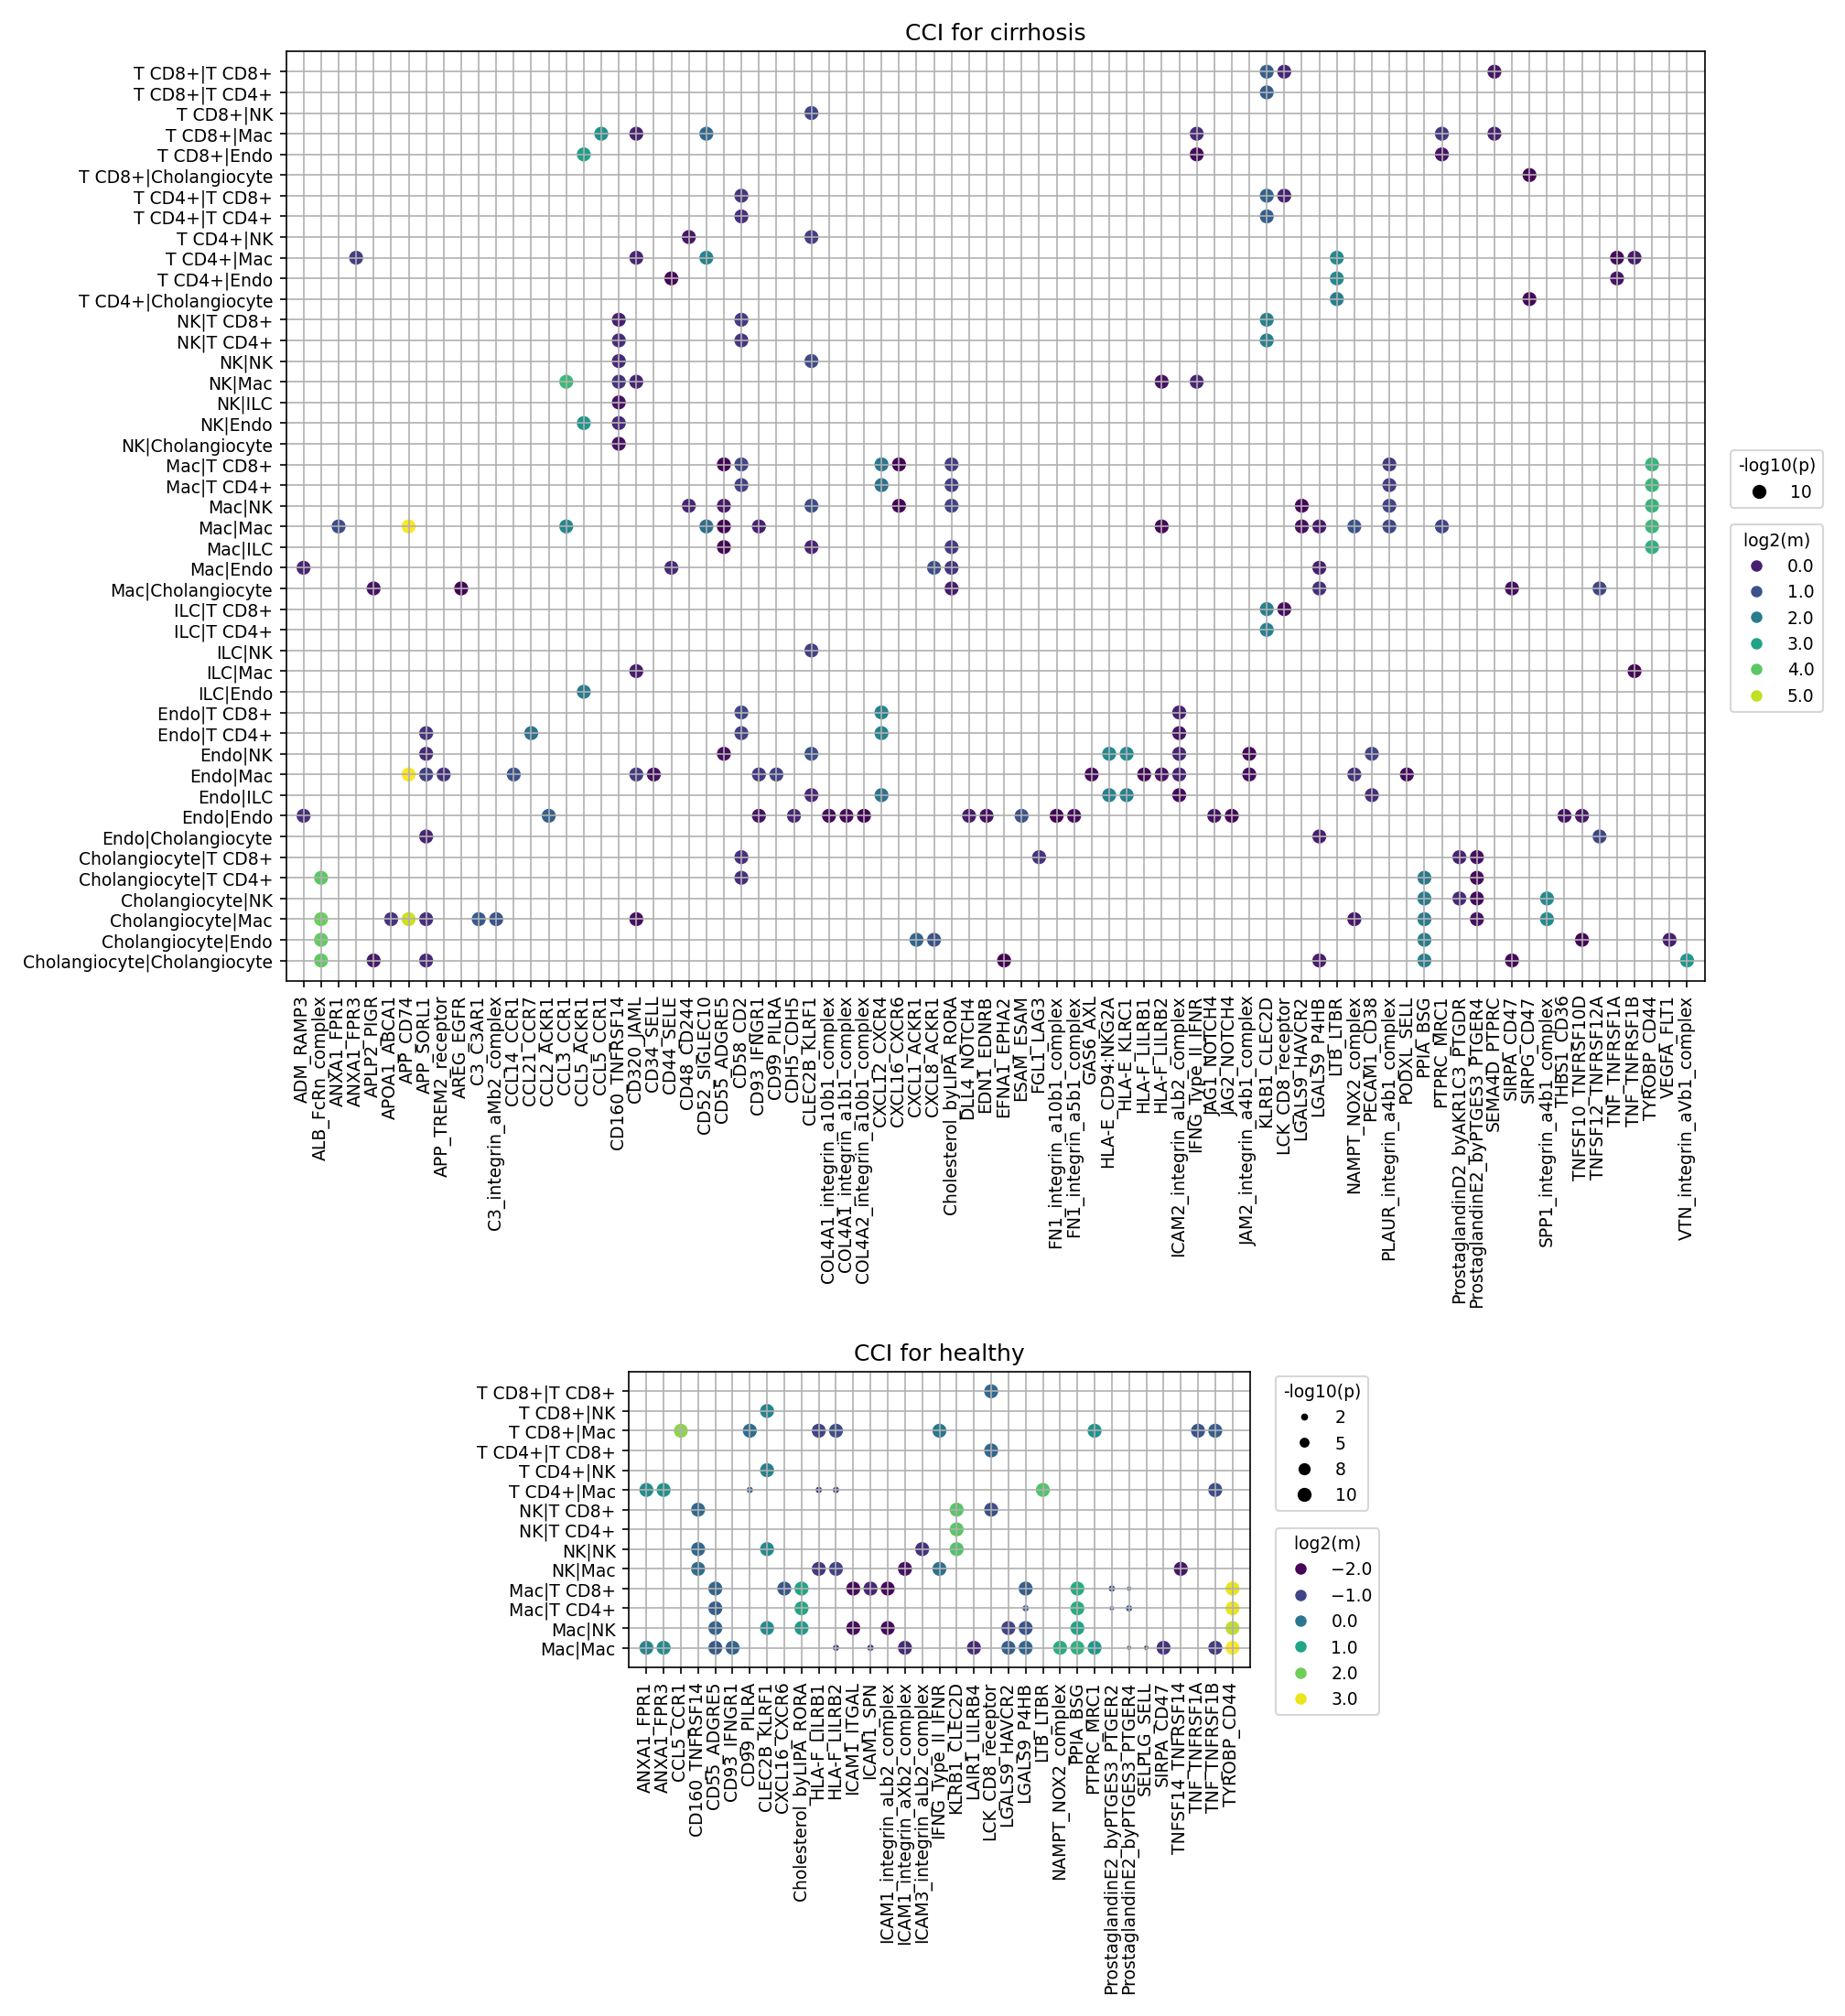
This analysis investigates cell-cell interaction (CCI) patterns in single-cell RNA-seq data from human liver tissue, comparing healthy individuals to those with cirrhosis. CellPhoneDB was used to identify potential ligand-receptor interactions between various cell types. The results are visualized as dot plots, where the size of each dot represents the statistical significance (-log10(p-value)) of the interaction, and the color intensity indicates the mean expression level (log2(mean)) of the interacting ligand-receptor pair. The analysis was configured to display up to 80 significant interactions per condition.
Visual Summary
The provided dot plots illustrate distinct cell-cell interaction landscapes in healthy and cirrhotic liver conditions.
CCI for Cirrhosis:
- The plot for cirrhosis reveals a dense network of interactions, characterized by numerous highly significant (large dot size) and strongly expressed (bright green/yellow color) ligand-receptor pairs.
- Macrophages emerge as central players, showing strong interactions with T cells (CD4+ and CD8+), Endothelial cells, and Cholangiocytes, as well as self-interactions (Mac|Mac).
Key interactions highly prominent in cirrhosis include
- SPP1 (Osteopontin) with multiple Integrins (e.g., ITGAV:ITGB3_complex, ITGAV:ITGB5_complex, ITGAX:ITGB2_complex, ITGA4:ITGB1_complex, ITGA9:ITGB1_complex): This axis is highly active across various cell pairs, notably Mac|Mac, Mac|T CD4+, Mac|Endo, Mac|Cholangiocyte, Endo|Mac, and Cholangiocyte|Mac. These interactions are among the most significant and highly expressed.
- FN1 (Fibronectin) with Integrins: Another prominent interaction (e.g., FN1-integrin_a1b1_complex) seen between Mac|Mac and Mac|Endo, indicative of extracellular matrix (ECM) remodeling.
- APP (Amyloid Precursor Protein) with TREM2: Strongly observed in Mac|Mac interactions, suggesting specific macrophage activation.
- CXCL12-CXCR4: Important for immune cell trafficking, seen across T cell-macrophage, NK cell-macrophage, and macrophage self-interactions.
- VEGFA with FLT1 (VEGFR1) and KDR (VEGFR2): Appears prominently in Endothelial cell self-interactions (Endo|Endo) and between Cholangiocytes and Endothelial cells, signaling angiogenesis.
- TNFSF10 (TRAIL) with TNFRSF10B (DR5): Observed in Endothelial cell self-interactions, potentially involved in apoptosis.
- Prostaglandins (PTGEs) and their receptors: Various prostaglandin-receptor pairs are active across Mac|Mac, T CD4+|Mac, and T CD8+|Mac interactions.
CCI for Healthy:
- The plot for healthy liver shows a comparatively sparser interaction landscape within the top 80 pairs, with fewer highly significant and highly expressed interactions compared to cirrhosis.
- Interactions involving Macrophages, T cells, and NK cells are present, but many of the pathways highlighted in cirrhosis are less pronounced or absent.
Notable interactions in healthy liver include
- ANXA1 (Annexin A1) with FPR1: Observed across Mac|Mac, Mac|T CD4+, Mac|NK.
- CCL5 (RANTES) with CCR1: Seen in Mac|Mac interactions.
- ICAM1 (CD54) with Integrins: Present in Mac|Mac and T CD4+|Mac interactions.
- HLA-F with LLRB1: Seen in T CD8+|T CD8+ and NK|NK interactions.
- Crucially, the extensive and strong SPP1-integrin and FN1-integrin interactions that dominate the cirrhotic liver are markedly less prominent or absent in the healthy condition's top interactions.
Biological Interpretation
The differential cell-cell interaction patterns observed provide critical insights into the pathophysiology of liver cirrhosis. The dramatic increase and strengthening of specific ligand-receptor interactions in cirrhosis compared to healthy liver point towards active disease mechanisms:
- Extracellular Matrix Remodeling and Fibrogenesis: The most striking finding is the robust activation of SPP1-integrin and FN1-integrin signaling axes.
- SPP1 (Osteopontin) is a matricellular protein known to be significantly upregulated in chronic liver diseases and is a key driver of liver fibrosis. It mediates cell adhesion, migration, and survival, and modulates immune responses. Its interaction with multiple integrins across macrophages, T cells, endothelial cells, and cholangiocytes strongly implicates it in perpetuating inflammation and fibrotic scar formation. [GeneCards SPP1: GeneCards] [PubMed search SPP1 liver fibrosis: PubMed Search]
- Fibronectin (FN1) is another crucial component of the ECM that interacts with integrins, contributing to tissue stiffness and fibrogenesis. Its increased interactions further underscore the dysregulated ECM dynamics in cirrhosis.
- The involvement of various cell types, particularly macrophages (known for their role in fibrosis through M1/M2 polarization and production of fibrogenic mediators), endothelial cells (angiogenesis and fibrogenesis), and cholangiocytes (bile duct proliferation and fibrosis), highlights the multi-cellular coordination in fibrotic progression.
- Macrophage Activation and Immune Modulation:
- The strong APP-TREM2 interaction in macrophages suggests the presence of a specific macrophage phenotype (potentially disease-associated macrophages) involved in sensing cellular damage and regulating inflammatory and reparative processes. TREM2+ macrophages are increasingly recognized for their roles in chronic inflammatory and neurodegenerative diseases, where they can contribute to tissue remodeling and fibrosis. [GeneCards TREM2: GeneCards]
- CXCL12-CXCR4 signaling is critical for the recruitment and retention of various immune cells, including T cells and macrophages, to sites of inflammation and injury. Its prominence in cirrhosis suggests ongoing immune cell trafficking and potential contributions to chronic inflammation and fibrosis.
- The prostaglandin-receptor interactions (e.g., Prostaglandine2_byPTGES3-PTGER4) also point to active immunomodulation by macrophages and T cells in the cirrhotic environment.
- Angiogenesis and Vascular Remodeling: The activation of VEGFA-FLT1/KDR signaling, particularly among endothelial cells and between cholangiocytes and endothelial cells, indicates increased angiogenesis. Angiogenesis is a hallmark of chronic liver disease, contributing to pathological vascular changes and exacerbating portal hypertension.
- Apoptosis and Cell Homeostasis: The TNFSF10 (TRAIL)-TNFRSF10B (DR5) interaction could reflect ongoing cellular stress and programmed cell death in the cirrhotic liver, potentially impacting endothelial cell integrity or contributing to tissue injury.
In contrast, the healthy liver exhibits a more homeostatic pattern, with interactions like ANXA1-FPR1 and CCL5-CCR1 that are typically associated with basal immune surveillance and anti-inflammatory functions, rather than extensive tissue remodeling and inflammation.
Clinical or Translational Implications
The identified differential cell-cell interaction patterns offer several potential clinical and translational avenues for understanding and managing liver cirrhosis:
- Therapeutic Target Prioritization:
- SPP1 and Integrins: The consistent and strong activation of the SPP1-integrin axis across multiple cell types in cirrhosis makes it a compelling therapeutic target. Strategies to block SPP1 production, inhibit its binding to integrins (e.g., using integrin-blocking antibodies), or interfere with downstream signaling pathways could mitigate liver fibrosis and inflammation.
- TREM2: Modulating TREM2 activity in macrophages could represent a novel approach to reprogram macrophage functions from pro-fibrotic to anti-fibrotic or pro-resolving phenotypes.
- CXCL12-CXCR4 axis: Targeting this pathway could reduce pathological immune cell infiltration and activation within the cirrhotic liver, potentially slowing disease progression.
- VEGFA signaling: Anti-angiogenic therapies, already used in other diseases, could be explored to normalize liver vasculature and reduce portal hypertension in cirrhosis.
- Biomarker Discovery: Elevated levels of SPP1, soluble forms of integrins, or specific cytokines/chemokines associated with these prominent interaction pathways could serve as circulating or tissue-based biomarkers for disease activity, prognosis, or response to therapy in cirrhotic patients.
- Experimental Validation: These findings provide strong hypotheses for further experimental validation:
- *In vitro* studies could investigate the precise mechanisms by which SPP1-integrin interactions drive fibrosis in specific liver cell types (e.g., hepatic stellate cells, macrophages, cholangiocytes).
- *In vivo* animal models of liver fibrosis could test the efficacy of inhibiting SPP1, TREM2, or CXCL12-CXCR4 signaling on disease progression, inflammation, and fibrotic burden.
- Flow cytometry or spatial transcriptomics could be used to validate the presence of interacting cell types and the expression of relevant ligand-receptor pairs in human cirrhotic liver samples.
The clear distinction in CCI patterns between healthy and cirrhotic livers underscores the importance of these interactions in disease pathogenesis and highlights novel therapeutic opportunities for a condition with significant unmet medical need.
10. Condition-Specific Cell-Cell Interaction Patterns in Cirrhotic Liver
[Analysis Visualization Results]...
Analysis Overview
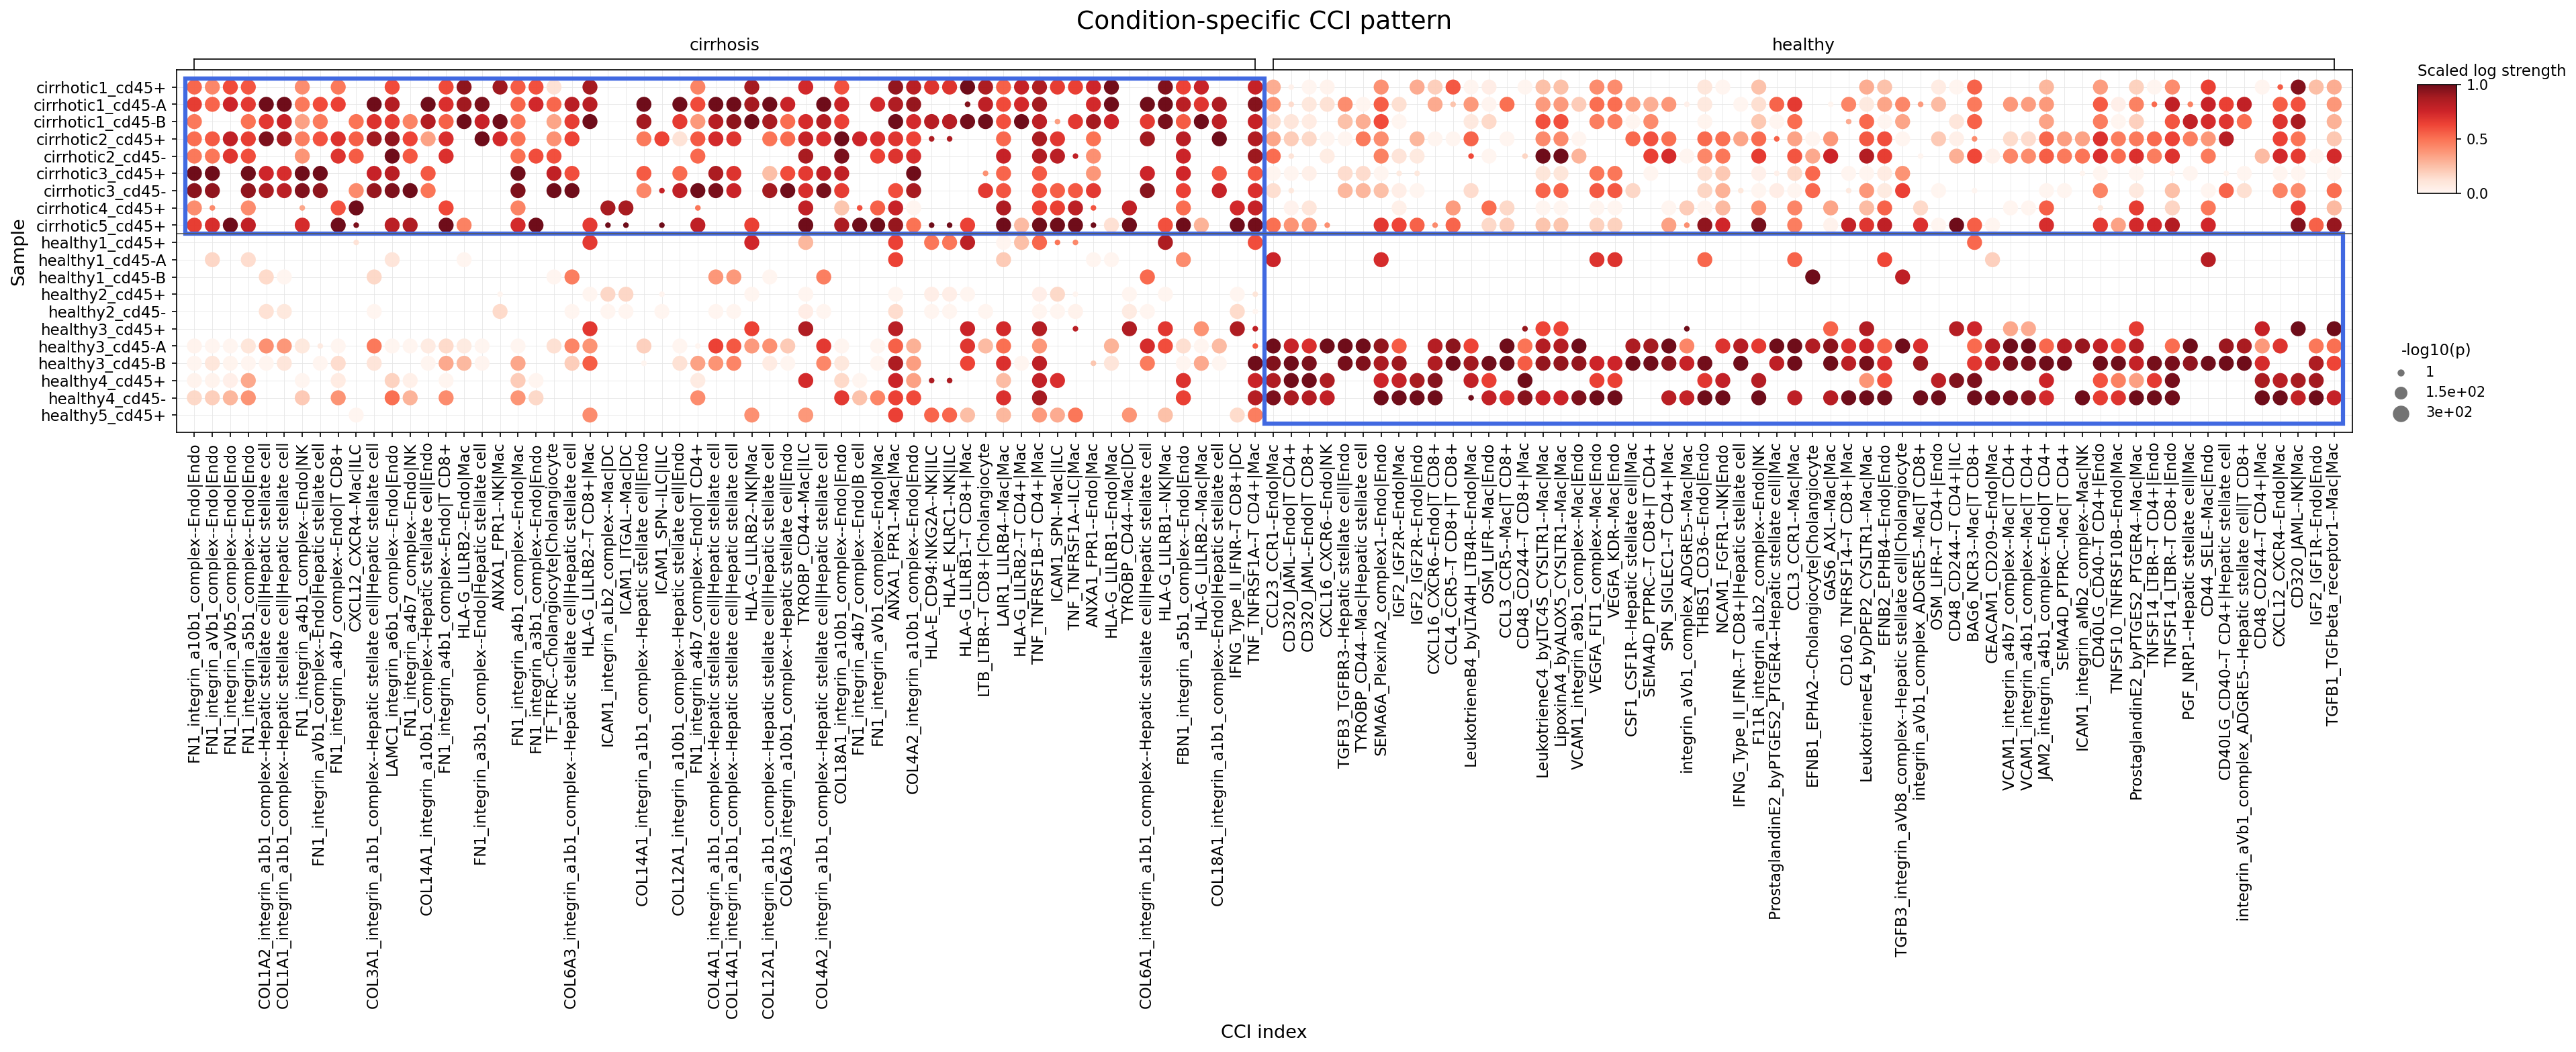
This analysis utilizes a dot plot to visualize cell-cell interaction (CCI) patterns between major immune and stromal cell types in liver samples, comparing cirrhotic conditions to healthy controls. The plot displays the scaled log strength of interactions (color intensity, red hues) and their statistical significance (-log10(p-value), dot size) across individual samples. The primary goal is to identify CCIs that are significantly different between cirrhotic and healthy states, highlighting those potentially driving disease pathology. The analysis focuses on interactions involving Myeloid cells (Macrophage, Dendritic cell), T cells, B cells, Stromal cells (Hepatic stellate cell, Fibroblast, Smooth muscle cell), Mast cells, and Endothelial cells.
Visual Summary
The dot plot clearly segregates cell-cell interaction patterns by condition. The upper section, corresponding to cirrhotic samples (highlighted by the blue box), shows a distinctly higher frequency and intensity of interactions compared to the healthy samples in the lower section.
- Increased Activity in Cirrhosis: Almost all CCI pairs displayed on the x-axis exhibit stronger signals (darker red colors) and greater significance (larger dot sizes) across the cirrhotic samples (e.g., cirrhotici_cd45+, cirrhotic1_cd45-A, etc.). This indicates a widespread activation and modulation of intercellular communication networks in the diseased liver.
- Specific Interaction Hotspots: Numerous interactions are particularly prominent in cirrhosis, showing dark red, large dots in nearly all cirrhotic samples. Examples include:
- Interactions involving TYROBP with CD44 on Macrophages, Dendritic cells, ILCs, and Hepatic stellate cells.
- Chemokine receptor interactions such as CCL3-CCR5 and CCL5-CCR5 involving T cells (CD8+, CD4+), Macrophages, and Endothelial cells.
- CXCL12-CXCR4 interactions between Hepatic stellate cells and T cells (CD4+), and Endothelial cells and Macrophages.
- Multiple collagen (COL1A1, COL3A1, COL6A1, COL4A2, COL4A1, COL18A1) interactions with integrin_a1b1_complex on Hepatic stellate cells.
- ANXA1-FPR1 interactions across various cell types including Macrophages, Endothelial cells, DCs, and T cells.
- HLA-E interactions with NKG2A/KLRC1 on NK cells and ILCs.
- Reduced Activity in Healthy Samples: Conversely, healthy samples largely show faint or absent signals for most of these interactions, indicating that these CCIs are either less active or not present in the healthy liver environment, or are not significantly different from the reference group. Some interactions, like TYROBP-CD44 between Macrophages and DCs, and certain CCL3-CCR5 interactions, show moderate activity in a few healthy samples but are consistently much stronger in cirrhosis.
The overall pattern strongly suggests a pro-inflammatory, pro-fibrotic, and immune-active microenvironment in cirrhotic livers, characterized by complex interplay between diverse immune and stromal cell populations.
Biological Interpretation
The observed condition-specific CCI patterns in cirrhosis reflect profound changes in the liver microenvironment, indicative of chronic inflammation, tissue remodeling, and immune dysregulation. Several key interaction pathways stand out:
- TYROBP-CD44 axis:
- Interactions: TYROBP (TREM2 signaling adaptor) interacting with CD44. Observed across various cell pairs including Macrophage-DC, Macrophage-ILC, Macrophage-Hepatic stellate cell.
- Mechanism: TYROBP is a key signaling adaptor involved in myeloid cell activation and function, often associated with receptors like TREM2, which are important in neuroinflammation, Alzheimer's disease, and increasingly recognized in liver diseases. CD44 is a major cell adhesion molecule involved in cell-cell and cell-matrix interactions, lymphocyte activation, and retention in inflammatory sites.
- Relevance to Cirrhosis: Upregulated TYROBP-CD44 interactions, particularly involving macrophages and hepatic stellate cells, suggest an activated myeloid cell phenotype contributing to inflammation and fibrosis. Macrophages (Kupffer cells and monocyte-derived macrophages) are central to the initiation and progression of liver inflammation and fibrosis. CD44 is known to mediate hepatic stellate cell activation and migration.
- Potential as Therapeutic Target: Targeting the TYROBP signaling pathway or CD44 could modulate macrophage activation and HSC fibrogenic responses. Anti-CD44 therapies have been explored in various cancers and inflammatory conditions, aiming to inhibit cell migration and adhesion.
- CCL3/CCL5-CCR5 Chemokine Axis:
- Interactions: CCL3-CCR5 (Macrophage-T cell CD8+, Macrophage-T cell CD4+, Endothelial cell-Macrophage, Endothelial cell-T cell CD8+) and CCL5-CCR5 (T cell CD8+-T cell CD8+, T cell CD8+-Macrophage).
- Mechanism: CCL3 (MIP-1α) and CCL5 (RANTES) are potent chemokines that bind to CCR5. This axis is crucial for the recruitment and activation of various immune cells, including T cells, macrophages, and NK cells, to sites of inflammation.
- Relevance to Cirrhosis: Elevated expression of CCL3, CCL5, and CCR5 is a hallmark of chronic liver inflammation and fibrosis. These interactions drive the influx of inflammatory cells into the liver, perpetuating tissue damage and promoting fibrogenesis. CCR5 is particularly important for T cell and macrophage migration.
- Potential as Therapeutic Target: CCR5 inhibitors, such as maraviroc (an FDA-approved drug for HIV, which targets CCR5), have shown promise in preclinical models of liver fibrosis by reducing immune cell infiltration and fibrogenic responses. PubMed search: Maraviroc liver fibrosis
- CXCL12-CXCR4 Axis:
- Interactions: CXCL12-CXCR4 (Hepatic stellate cell-T cell CD4+, Endothelial cell-Macrophage).
- Mechanism: CXCL12 (SDF-1α) and its receptor CXCR4 play critical roles in cell trafficking, survival, proliferation, and angiogenesis.
- Relevance to Cirrhosis: In cirrhosis, the CXCL12-CXCR4 axis is highly active. Hepatic stellate cells express CXCR4, and its activation by CXCL12 promotes their migration, proliferation, and fibrogenic differentiation. This axis also contributes to the recruitment of immune cells and neovascularization, which are features of advanced liver disease.
- Potential as Therapeutic Target: CXCR4 antagonists, such as plerixafor, are used in hematology for stem cell mobilization. Preclinical studies suggest that targeting CXCR4 could reduce liver fibrosis and improve outcomes in chronic liver disease. GeneCards: CXCR4
- Collagen-Integrin α1β1 Interactions:
- Interactions: Multiple collagen types (COL1A1, COL3A1, COL6A1, COL4A2, COL4A1, COL18A1) interacting with integrin_a1b1_complex on Hepatic stellate cells.
- Mechanism: Integrins are cell surface receptors that mediate cell-extracellular matrix (ECM) interactions. The α1β1 integrin is a collagen receptor. These interactions are fundamental for cell adhesion, migration, proliferation, and differentiation.
- Relevance to Cirrhosis: Accumulation of ECM proteins, particularly collagen, is the hallmark of liver fibrosis. Hepatic stellate cells, when activated, become the primary producers of ECM. Their interactions with collagen via integrins are critical for perpetuating fibrogenesis, regulating their phenotype, and contributing to tissue stiffness.
- Potential as Therapeutic Target: Blocking specific integrin-ECM interactions could inhibit HSC activation and reduce collagen deposition. Integrin antagonists are a focus of research for fibrotic diseases.
- ANXA1-FPR1 Axis:
- Interactions: ANXA1-FPR1 (Macrophage-DC, Macrophage-Endothelial cell, Macrophage-T cell CD8+).
- Mechanism: Annexin A1 (ANXA1) is a glucocorticoid-regulated protein with anti-inflammatory properties, acting as a ligand for Formyl peptide receptor 1 (FPR1). ANXA1-FPR1 signaling can modulate immune cell migration and inflammation resolution.
- Relevance to Cirrhosis: While ANXA1 often has anti-inflammatory roles, its expression and function can be context-dependent. Its increased interactions in cirrhosis might reflect ongoing attempts at inflammation resolution that are overwhelmed, or in some contexts, FPR1 activation can also be pro-inflammatory. FPR1 is also a receptor for bacterial peptides, playing a role in innate immunity.
- Potential as Therapeutic Target: Modulating the ANXA1-FPR1 axis could offer a strategy to control inflammation and promote resolution in the cirrhotic liver.
- HLA-E-NKG2A/KLRC1 Interactions:
- Interactions: HLA-E-NKG2A (T cell, NK cell, ILC), HLA-E-KLRC1 (T cell, NK cell, ILC).
- Mechanism: HLA-E is a non-classical MHC class I molecule that presents peptides derived from other MHC class I molecules. It interacts with the inhibitory receptor NKG2A (encoded by *KLRC1*) expressed on NK cells and a subset of T cells (CD8+ T cells, NKT cells). This interaction leads to inhibition of cytolytic activity.
- Relevance to Cirrhosis: Upregulation of HLA-E on liver cells and immune cells, coupled with increased interaction with NKG2A/KLRC1, can suppress anti-viral or anti-tumor immune responses, potentially contributing to immune evasion and persistent inflammation or HCC development in the context of cirrhosis.
- Potential as Therapeutic Target: Blocking the HLA-E-NKG2A interaction could enhance the cytotoxic activity of NK cells and T cells against diseased hepatocytes or potential tumor cells, a strategy being explored in cancer immunotherapy.
Clinical or Translational Implications
The identified cell-cell interactions represent a rich landscape of potential therapeutic targets for liver cirrhosis:
- Targeting Chemokine/Cytokine Axes: The prominent activation of the CCL3/CCL5-CCR5 and CXCL12-CXCR4 axes suggests that inhibitors of these receptors could be highly effective in reducing immune cell infiltration and mitigating fibrogenesis in the cirrhotic liver. Clinical trials for CCR5 inhibitors are already underway for other fibrotic diseases, potentially paving the way for repurposing in liver cirrhosis. CXCR4 inhibitors could similarly block HSC activation and recruitment of inflammatory cells.
- Modulating Fibrotic Signaling: The extensive collagen-integrin α1β1 interactions on hepatic stellate cells underscore their central role in fibrosis. Developing small molecules or antibodies that specifically disrupt these integrin-ECM interactions could directly impact the progression of liver fibrosis by inhibiting HSC activation and matrix deposition.
- Immunomodulation: The HLA-E-NKG2A/KLRC1 interactions point towards strategies for modulating immune responses in cirrhosis. Given that cirrhosis often involves chronic immune activation but also elements of immune exhaustion or suppression, targeting inhibitory pathways like NKG2A could 'release the brakes' on beneficial anti-fibrotic or anti-viral immune responses. This aligns with approaches in cancer immunotherapy.
- Multi-target Strategies: Given the complexity of cirrhosis, a multi-target approach simultaneously addressing inflammation, fibrosis, and immune dysregulation might be most effective. For instance, combining a CCR5 antagonist with an integrin inhibitor could offer synergistic benefits.
- Biomarker Discovery: The identified strong CCI patterns in cirrhotic samples could serve as novel biomarkers for disease progression, severity, or response to therapy. Monitoring the activity of these specific interactions through advanced imaging or liquid biopsy techniques could provide valuable clinical insights.
11. Cholangiocyte Condition-Specific Surfaceome Markers in Liver Cirrhosis
[Analysis Visualization Results]...
Analysis Overview
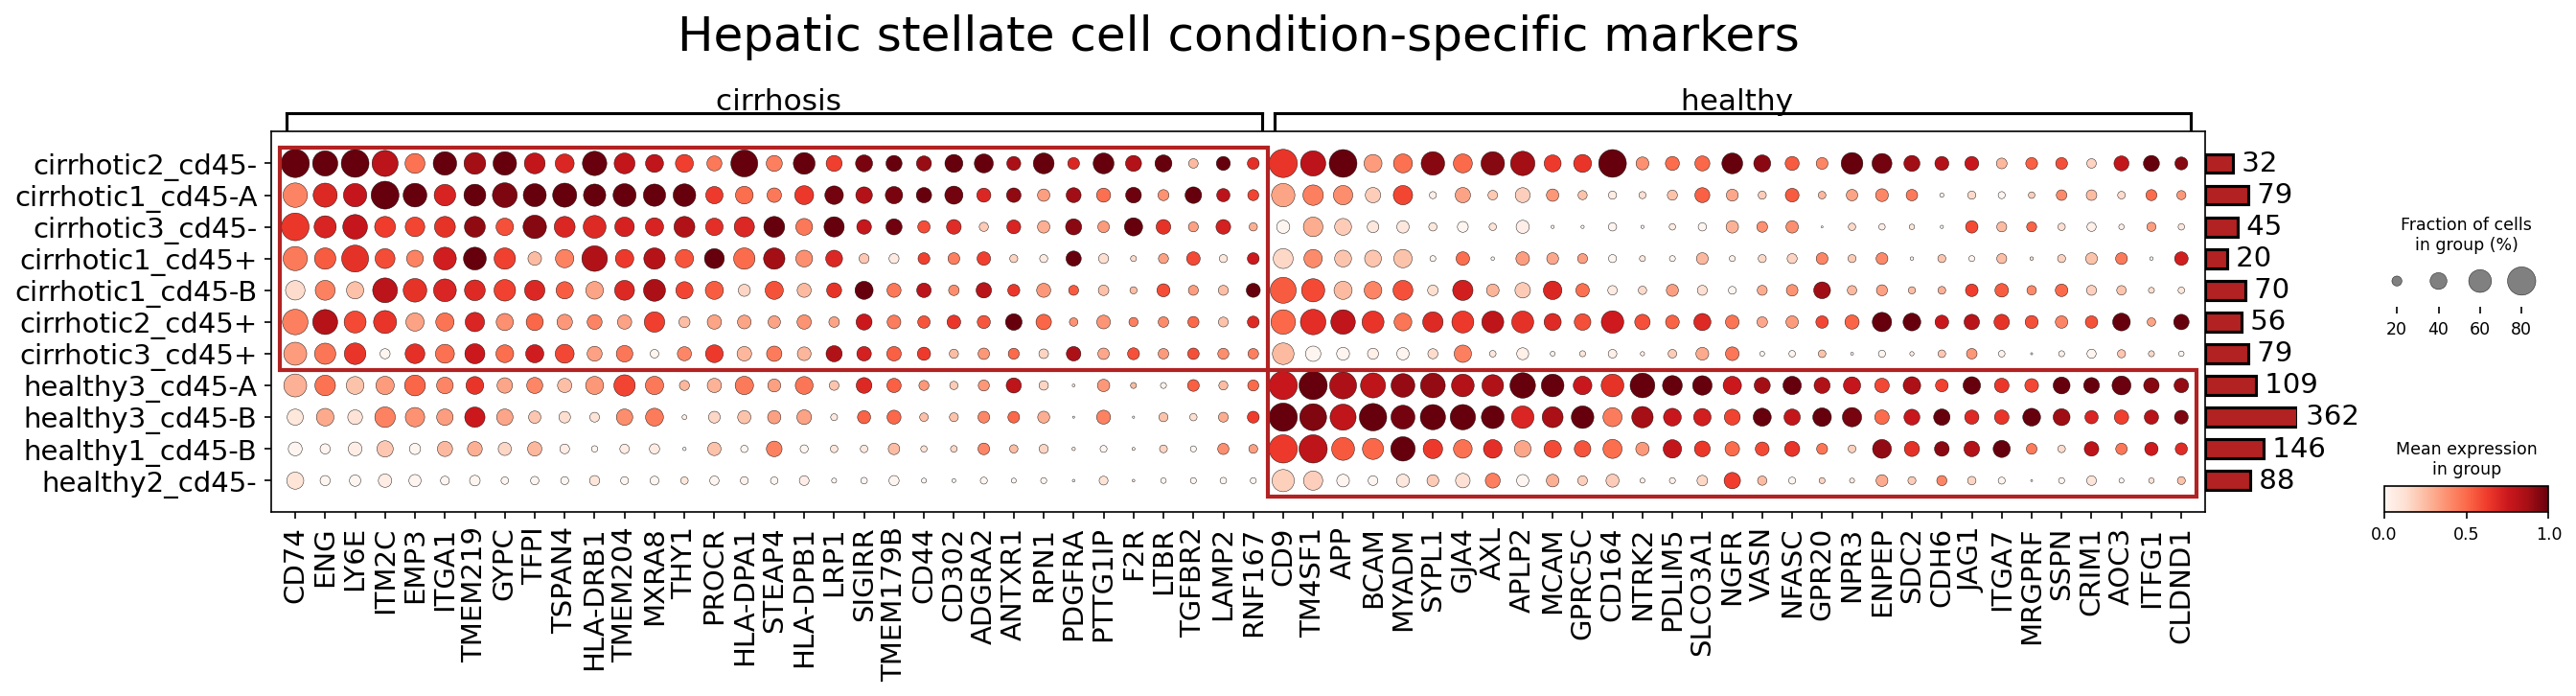
This analysis presents a dot plot illustrating the expression of surfaceome markers in Cholangiocytes across various individual samples, categorized by their condition: "cirrhosis" or "healthy". The dataset comprises single-cell RNA-seq data from human liver tissue. The dot plot effectively visualizes two key aspects for each marker: the fraction of cells expressing the marker (indicated by dot size) and the mean expression level within those cells (indicated by color intensity, ranging from light red for low to dark red for high expression). The analysis aimed to identify condition-specific markers, with a focus on surfaceome proteins, which are particularly relevant for cell-cell interactions and potential therapeutic targeting.
Visual Summary
The dot plot clearly differentiates two major groups of markers based on their expression patterns: those highly expressed in cholangiocytes from cirrhotic samples and those predominantly expressed in healthy samples.
- Cirrhosis-Associated Markers: The majority of markers are clustered on the left side of the plot and show consistently high mean expression (dark red dots) and a high fraction of expressing cells (large dots) across most cirrhotic samples (e.g., cirrhotic3_cd45-, cirrhotic2_cd45-, cirrhotic1_cd45-A, cirrhotic1_cd45-B, cirrhotic2_cd45+, cirrhotic1_cd45+). Notable examples include LMAN2, ASGR2, EFNA1, GJB1, ERBB3, EMP2, TSPAN6, HLA-DRB1, SIGIRR, SCARB2, PLXNB2, and CADM1. These markers generally show very low or no expression in healthy samples.
- Healthy-Associated Markers: A smaller cluster of markers on the right side of the plot exhibits high expression (dark red, large dots) predominantly in healthy samples (e.g., healthy1_cd45-A, healthy1_cd45-B, healthy3_cd45-A, healthy4_cd45+). The most prominent markers in this category are SCTR and MYADM. These markers are largely absent or expressed at very low levels in cirrhotic samples.
- Sample Representation: The rightmost bar chart indicates the number of cholangiocytes in each sample group. There is a wide range of cell counts, with cirrhotic1_cd45-B having the highest number (871 cells) and healthy1_cd45-A having a lower number (36 cells). Despite varying cell numbers, the expression patterns within each condition group are largely consistent.
Overall, the plot reveals a distinct transcriptional shift in the surfaceome of cholangiocytes in the cirrhotic liver compared to healthy tissue, suggesting significant changes in cell identity, function, and interaction profiles during disease progression.
Biological Interpretation
The observed differential expression of surfaceome markers in cholangiocytes between healthy and cirrhotic livers points to profound changes in cellular processes, cell-cell communication, and interaction with the microenvironment in the context of cirrhosis.
Markers Upregulated in Cirrhotic Cholangiocytes
The markers highly expressed in cirrhotic cholangiocytes often relate to cellular stress, altered proliferation, inflammation, and remodeling of cell adhesion and signaling.
- LMAN2 (Lectin, mannose-binding 2): Involved in quality control and transport of glycoproteins within the ER-Golgi intermediate compartment. Its upregulation may indicate increased protein synthesis, processing, or endoplasmic reticulum (ER) stress in activated cholangiocytes, reflecting their altered metabolic and secretory demands in cirrhosis. GeneCards: LMAN2
- ASGR2 (Asialoglycoprotein receptor 2): A subunit of the asialoglycoprotein receptor, typically known for clearing desialylated glycoproteins from circulation by hepatocytes. Its expression on cholangiocytes might suggest altered glycoprotein metabolism, cellular stress, or a shift in the cholangiocyte phenotype in response to the disease microenvironment. GeneCards: ASGR2
- EFNA1 (Ephrin A1): A ligand for Eph receptor tyrosine kinases, critical for regulating cell migration, adhesion, and proliferation. In the context of liver fibrosis and cancer, EFNA1/Eph signaling often promotes cell survival, epithelial-mesenchymal transition (EMT), and angiogenesis, all contributing to pathological tissue remodeling and disease progression. Its upregulation in cholangiocytes suggests an active role in these processes. GeneCards: EFNA1
- GJB1 (Gap Junction Beta 1 / Connexin 32): Forms gap junctions, which mediate direct intercellular communication. Altered gap junction function is a hallmark of various liver diseases, affecting cholangiocyte proliferation, differentiation, and abnormal bile duct remodeling. Upregulation could indicate dysfunctional or altered communication within the proliferating ductular reaction. GeneCards: GJB1
- ERBB3 (Erb-B2 Receptor Tyrosine Kinase 3): A member of the epidermal growth factor receptor (EGFR) family, often functioning as a co-receptor (e.g., with ERBB2) to activate cell survival and proliferation pathways (e.g., PI3K/Akt, MAPK/ERK). Its activation is implicated in promoting cell proliferation and survival in many cancers and fibrotic conditions, potentially driving cholangiocyte proliferation in cirrhosis. GeneCards: ERBB3
- EMP2 (Epithelial Membrane Protein 2): Involved in cell adhesion, migration, and apoptosis, EMP2 can modulate integrin trafficking and cell surface expression. Its upregulation may contribute to altered cholangiocyte interactions with the extracellular matrix or other cells, influencing their migratory and adhesive properties during fibrogenesis. GeneCards: EMP2
- TSPAN6 (Tetraspanin 6): Representative of the tetraspanin family (TSPAN4, TSPAN15 also upregulated), these proteins act as molecular scaffolds in the plasma membrane, forming "tetraspanin-enriched microdomains." They regulate the localization and function of various transmembrane proteins, influencing cell adhesion, migration, proliferation, and signaling. Their upregulation suggests a significant remodeling of the cholangiocyte plasma membrane and altered cell communication in cirrhosis. GeneCards: TSPAN6
- HLA-DRB1 (HLA Class II Histocompatibility Antigen, DR Beta 1 Chain): A component of the Major Histocompatibility Complex (MHC) class II, involved in presenting exogenous antigens to CD4+ T cells. Its presence on cholangiocytes indicates an enhanced capacity for antigen presentation, suggesting that cholangiocytes become more immunologically active under inflammatory conditions like cirrhosis, contributing to chronic immune responses and inflammation within the liver. PubMed search: cholangiocyte HLA-DRB1 cirrhosis
- SIGIRR (Single Ig And TIR Domain Containing Adaptor Protein / TIR8): An inhibitory receptor that limits inflammatory responses by interfering with IL-1R/TLR signaling pathways. Its upregulation could represent a compensatory mechanism to dampen excessive inflammation in the cirrhotic liver, or it could contribute to altered immune regulation and perpetuation of inflammation. GeneCards: SIGIRR
- SCARB2 (Scavenger Receptor Class B Member 2 / LIMP-2): A lysosomal integral membrane protein involved in lysosomal biogenesis, cargo transport (e.g., glucocerebrosidase), and lipid metabolism. Its upregulation might reflect increased cellular stress, altered metabolic demands, or changes in lysosomal function in cholangiocytes during cirrhosis. GeneCards: SCARB2
- PLXNB2 (Plexin B2): A receptor for semaphorins, which regulate cell migration, adhesion, and morphology. In non-neuronal contexts, PLXNB2 signaling plays roles in angiogenesis, cell migration, and tumor progression. Its upregulation in cirrhotic cholangiocytes could mediate their migratory behavior and contribute to pathological tissue remodeling and ductular reaction. GeneCards: PLXNB2
- CADM1 (Cell Adhesion Molecule 1 / TSLC1): An Ig superfamily cell adhesion molecule involved in homophilic and heterophilic cell-cell adhesion and cell polarity. Altered cell adhesion is a characteristic of fibrotic processes and tissue remodeling, suggesting CADM1's role in changing cholangiocyte adhesive properties in cirrhosis. GeneCards: CADM1
Markers Upregulated in Healthy Cholangiocytes
These markers are associated with normal cholangiocyte function and differentiation, and their downregulation in cirrhosis signifies a loss of healthy cellular identity and function.
- SCTR (Secretin Receptor): A G protein-coupled receptor crucial for normal cholangiocyte function. Upon binding secretin, it stimulates bicarbonate and fluid secretion, maintaining bile flow and pH. Its significant downregulation in cirrhotic cholangiocytes indicates a severe impairment of normal bile duct physiology, contributing to cholestasis and further liver injury. It serves as a strong indicator of cholangiocyte dedifferentiation or dysfunction. GeneCards: SCTR
- MYADM (Myeloid Associated Differentiation Marker): While its precise function in cholangiocytes is less characterized, its presence in healthy and absence in cirrhotic cells suggests a role in maintaining the differentiated state or specific functions of healthy cholangiocytes. Its loss in cirrhosis further supports the notion of dedifferentiation and pathological remodeling. GeneCards: MYADM
Clinical or Translational Implications
The distinct expression profiles of surfaceome markers in cholangiocytes offer valuable insights for understanding cirrhosis pathogenesis and identifying potential therapeutic strategies.
- Diagnostic and Prognostic Biomarkers: Markers like SCTR (downregulated in cirrhosis) and ERBB3, EFNA1, or HLA-DRB1 (upregulated in cirrhosis) could serve as highly specific biomarkers for diagnosing cirrhosis, monitoring disease progression, or assessing treatment response. Detecting these markers in easily accessible samples (e.g., via liquid biopsy of extracellular vesicles from cholangiocytes) could be a non-invasive diagnostic tool.
Therapeutic Targets for Cholangiocyte-Driven Fibrosis and Dysfunction:
- ERBB3: Its upregulation points to enhanced proliferative and survival signaling in cirrhotic cholangiocytes. Targeting ERBB3, potentially in combination with other ERBB family members, could inhibit pathological cholangiocyte proliferation (ductular reaction) and subsequent fibrosis. Therapeutic agents like patritumab (monoclonal antibody against ERBB3) or small molecule kinase inhibitors, currently in cancer trials, could be explored for liver fibrosis. PubMed search: ERBB3 inhibitor fibrosis
- EFNA1 / Eph-Ephrin Signaling: Given its role in proliferation, migration, and EMT, disrupting EFNA1-Eph receptor interactions could mitigate cholangiocyte-mediated fibrotic processes. This pathway can be targeted by specific antibodies or small molecule inhibitors against EphA receptors.
- SCTR: The significant downregulation of SCTR in cirrhosis suggests a loss of normal cholangiocyte function, leading to impaired bile secretion and cholestasis. Therapeutic strategies aimed at restoring SCTR expression or signaling, for example, using secretin analogs or SCTR agonists, could potentially improve bile flow, alleviate cholestasis, and support the regeneration of functional cholangiocytes. PubMed search: secretin receptor agonists cholestasis
- HLA-DRB1: Its increased expression indicates augmented antigen-presenting capabilities of cholangiocytes, contributing to chronic inflammation. Modulating the inflammatory response through specific immune checkpoints or blocking T-cell activation pathways engaged by cholangiocytes could be a therapeutic avenue, especially in immune-mediated forms of cirrhosis.
- Tetraspanins (TSPAN6, TSPAN4, TSPAN15) and Adhesion Molecules (EMP2, PLXNB2, CADM1): The widespread changes in these surface proteins indicate significant alterations in cholangiocyte interactions with their microenvironment. Future research into blocking or modulating these interactions could disrupt key processes like excessive cell adhesion, migration, and signaling that drive fibrosis.
In conclusion, this analysis highlights several promising surfaceome markers in cholangiocytes that are differentially regulated in cirrhosis. These markers not only provide insights into the molecular mechanisms underlying liver fibrosis but also represent potential therapeutic targets for precision medicine approaches to manage and treat cirrhosis.
12. Macrophage Condition-Specific Surfaceome Markers in Liver Cirrhosis
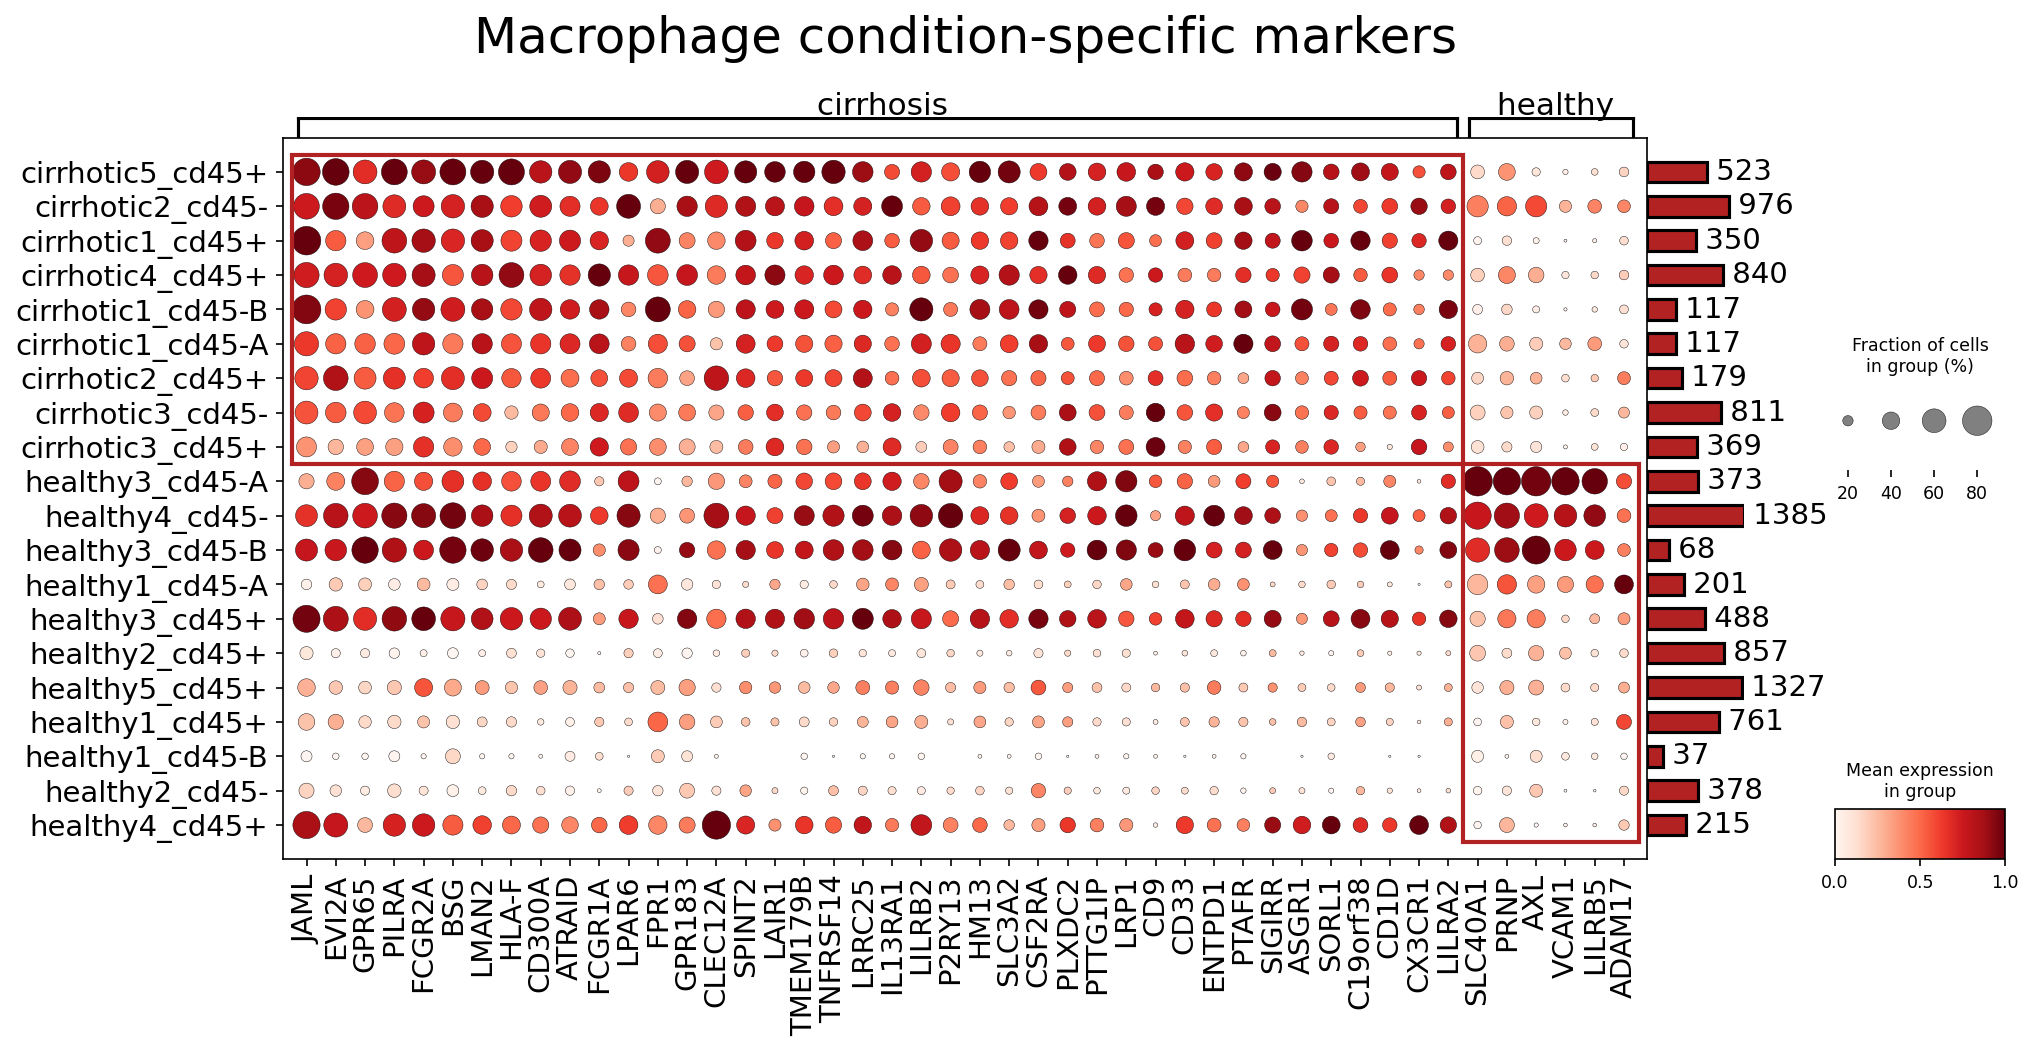
[Analysis Visualization Results]...
Analysis Overview
This analysis identifies and visualizes surfaceome marker expression in Macrophages from liver tissue, comparing cirrhotic conditions to healthy controls using a dot plot. The goal is to highlight markers that are differentially expressed in macrophages between these two conditions, providing insights into disease mechanisms and potential therapeutic targets in cirrhosis. The plot displays the top distinguishing surfaceome markers found, primarily emphasizing those upregulated in cirrhosis.
Visual Summary
The dot plot visualizes the expression of 40 surfaceome markers across individual samples, grouped by condition (cirrhosis and healthy).
- Cirrhosis-Associated Markers: The majority of the markers displayed on the X-axis (from *JAML* to *ADAM17*) show consistently high expression (dark red color intensity) and high prevalence (large dot size) across most cirrhotic samples (top rows). This indicates a robust upregulation of these surface proteins in macrophages from cirrhotic livers.
- Healthy Controls: In contrast, macrophages from healthy samples (bottom rows) exhibit generally low or absent expression (lighter red to white dots, smaller dot size) for most of these same markers. This clear distinction highlights a significant shift in the surface proteome of macrophages in cirrhosis compared to health.
- Clustering: Samples within each condition show some variability, but the overall pattern clearly separates the cirrhotic samples from the healthy ones based on the expression profile of these markers. The strong upregulation of a distinct set of surface markers characterizes macrophages in the cirrhotic liver.
Biological Interpretation
The observed upregulation of numerous surfaceome markers in cirrhotic macrophages points towards their active and altered roles in the pathology of liver cirrhosis. These markers are involved in cell adhesion, immune signaling, tissue remodeling, and inflammatory responses, reflecting the complex environment of the cirrhotic liver. Here, we interpret a few prominent markers:
- BSG (CD147): This marker shows strong upregulation in cirrhotic macrophages.
- Signaling Pathways/Mechanisms: BSG (Basigin), also known as Extracellular Matrix Metalloproteinase Inducer (EMMPRIN), is a transmembrane glycoprotein that stimulates the production of matrix metalloproteinases (MMPs) by various cell types, including macrophages. MMPs are critical for degrading the extracellular matrix (ECM). In cirrhosis, dysregulated MMP activity contributes to both ECM degradation and excessive synthesis, leading to fibrosis. BSG also modulates immune responses and cell adhesion. Increased BSG on macrophages suggests their active participation in the aberrant ECM remodeling characteristic of liver fibrosis. [GeneCards: GeneCards]
- AXL: Highly expressed in cirrhotic macrophages.
- Signaling Pathways/Mechanisms: AXL is a receptor tyrosine kinase that, upon binding its ligand Gas6 (Growth Arrest-specific 6), activates intracellular signaling pathways (e.g., PI3K/Akt, MAPK/ERK). This axis regulates cell survival, proliferation, migration, and efferocytosis (clearance of apoptotic cells). In the context of liver fibrosis, AXL signaling in macrophages can promote their pro-fibrotic activation, enhance efferocytosis of damaged hepatocytes (which can be immunosuppressive), and contribute to the survival of hepatic stellate cells (HSCs), thereby exacerbating fibrosis and chronic inflammation. [GeneCards: GeneCards]
- VCAM1: Shows substantial upregulation in cirrhotic macrophages.
- Signaling Pathways/Mechanisms: Vascular Cell Adhesion Molecule 1 (VCAM1) is an adhesion protein crucial for leukocyte trafficking. While typically associated with activated endothelial cells, its expression on macrophages indicates their activated state. VCAM1 interacts with integrins (e.g., VLA-4 on lymphocytes and monocytes/macrophages) to facilitate the recruitment of immune cells from the bloodstream into inflamed liver tissue. Elevated VCAM1 on macrophages in cirrhosis suggests enhanced cellular interactions within the inflammatory milieu, contributing to sustained inflammation and progressive fibrosis. [GeneCards: GeneCards]
- IL13RA1: Demonstrates significant upregulation in cirrhotic macrophages.
- Signaling Pathways/Mechanisms: Interleukin-13 Receptor Alpha 1 (IL13RA1) is a component of the receptor complex for IL-13, a key cytokine involved in type 2 immune responses. IL-13 is a potent pro-fibrotic cytokine in many organs, including the liver, where it can directly stimulate collagen production by HSCs and promote the differentiation of macrophages towards an alternatively activated (M2-like) phenotype. Upregulation of IL13RA1 on macrophages suggests increased responsiveness to IL-13, which can drive these macrophages to adopt pro-fibrotic functions, contributing to ECM accumulation and perpetuating the fibrotic process in cirrhosis. [GeneCards: GeneCards]
- FCGR2A: Shows elevated expression in cirrhotic macrophages.
- Signaling Pathways/Mechanisms: FCGR2A (Fc-gamma receptor IIa) is an activating Fc receptor for IgG antibodies, expressed predominantly on myeloid cells. Upon binding to antibody-antigen immune complexes, FCGR2A triggers various effector functions in macrophages, including phagocytosis, cytokine release, and antigen presentation, contributing to inflammatory responses. Its upregulation in cirrhotic macrophages suggests an activated immune state, potentially involving the clearance of immune complexes or the exacerbation of inflammation through antibody-dependent mechanisms in the diseased liver. [GeneCards: GeneCards]
Clinical or Translational Implications
The identified surfaceome markers in cirrhotic macrophages represent potential targets for novel therapeutic interventions in liver cirrhosis.
- BSG (CD147): Targeting BSG could disrupt macrophage-mediated ECM remodeling and inflammation. Inhibitors of CD147 or antibodies blocking its function, currently explored in cancer and inflammatory diseases, could be investigated for their ability to attenuate liver fibrosis by modulating MMP activity and macrophage behavior.
- AXL: Given its role in cell survival, efferocytosis, and pro-fibrotic signaling, AXL inhibition presents a promising strategy. AXL inhibitors are already in clinical trials for oncology, and their repurposing for fibrotic diseases like cirrhosis could modulate macrophage activation, reduce HSC survival, and dampen the overall pro-fibrotic environment. [PubMed search: PubMed Search]
- VCAM1: Blocking VCAM1-mediated interactions could reduce the recruitment of inflammatory immune cells, including macrophages, to the liver. Therapeutic approaches involving anti-VCAM1 antibodies or antagonists of its ligand (VLA-4) could alleviate chronic inflammation and slow fibrosis progression in cirrhosis. [PubMed search: PubMed Search]
- IL13RA1: As IL-13 is a key fibrogenic cytokine, modulating its signaling via IL13RA1 on macrophages could counteract pro-fibrotic responses. Therapies targeting IL-13 or its receptors, such as monoclonal antibodies (e.g., tralokinumab, lebrikizumab), are under development for various fibrotic conditions and could be explored to specifically reprogram pro-fibrotic macrophages in cirrhosis. [PubMed search: PubMed Search]
- FCGR2A: Modulating FCGR2A activity could fine-tune macrophage inflammatory responses. Strategies aimed at blocking excessive FCGR2A signaling might reduce immune complex-driven inflammation and tissue damage in cirrhosis, though careful consideration of immune surveillance roles would be necessary.
13. Condition-Specific Surfaceome Markers in Hepatic Stellate Cells
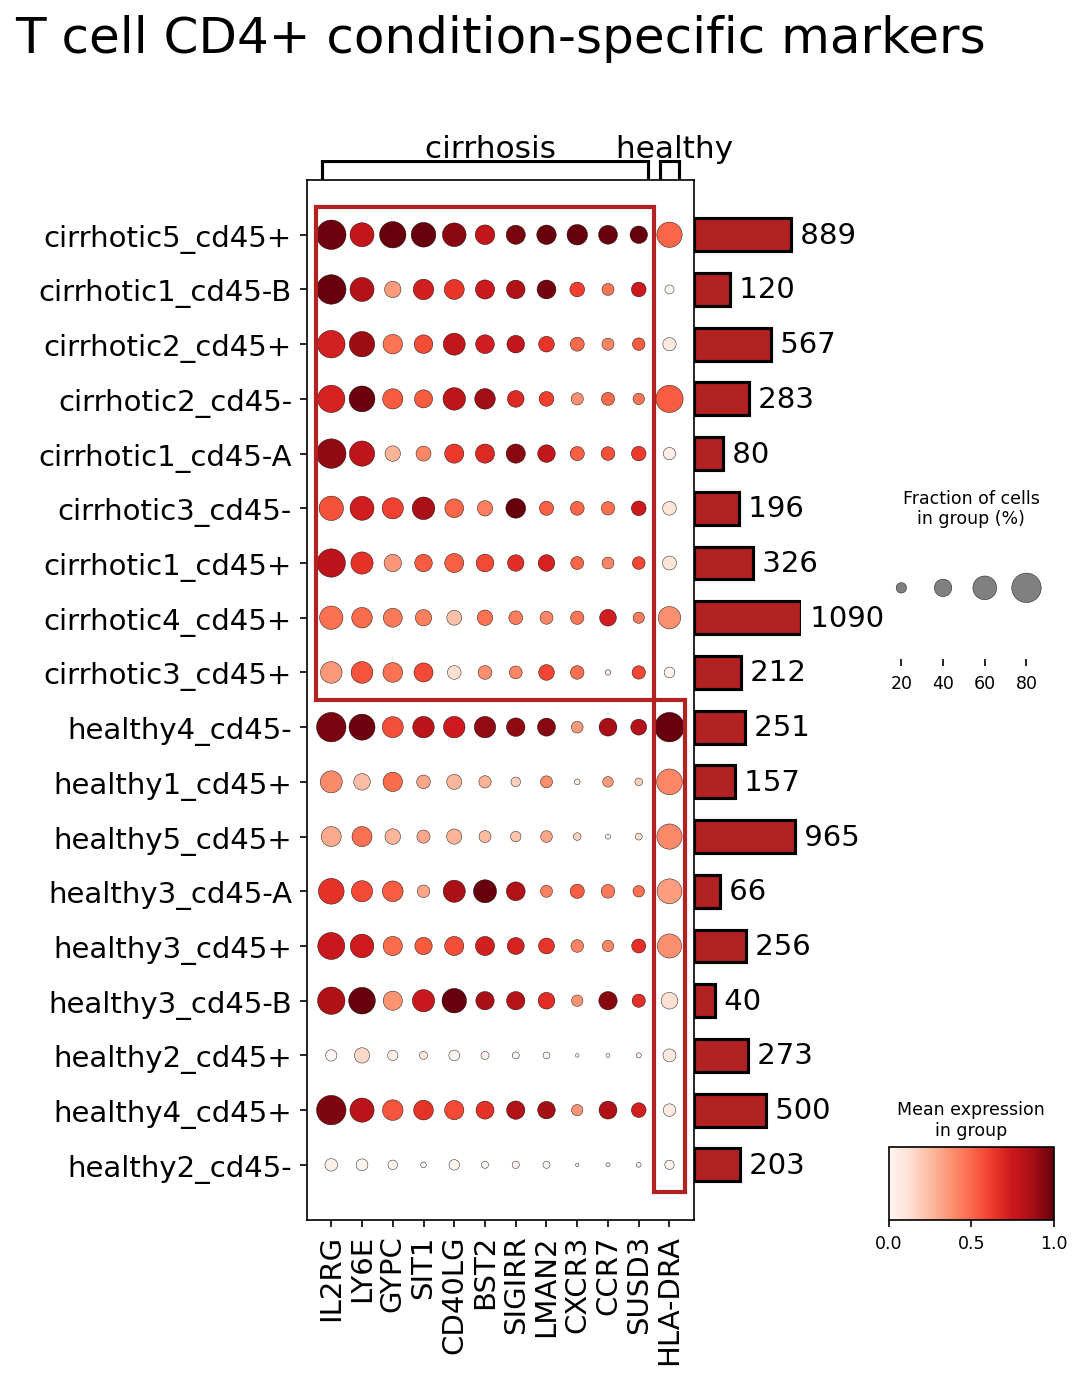
[Analysis Visualization Results]...
Analysis Overview
This analysis identifies condition-specific surfaceome markers in Hepatic stellate cells (HSCs) by comparing expression profiles between cirrhosis and healthy liver samples. The results are visualized using a dot plot, which displays the mean expression level (color intensity) and the fraction of cells expressing the marker (dot size) for each gene across different samples grouped by condition (cirrhosis vs. healthy). The primary goal is to identify surface proteins that are distinctly regulated in HSCs during cirrhosis, providing insights into disease mechanisms and potential therapeutic targets.
Visual Summary
The dot plot clearly illustrates distinct surfaceome expression patterns in Hepatic stellate cells between cirrhotic and healthy conditions.
- Cirrhosis-Associated Markers: A large cluster of genes on the left side of the plot shows high mean expression (dark red dots) and a high fraction of expressing cells (large dots) predominantly in the samples from cirrhotic patients. Key markers prominently upregulated in cirrhosis include: CD74, ENG, LY6E, ITM2C, ITGA1, EMP3, TMEM219, GYPC, TSPAN4, HLA-DRB1, MXRA8, THY1, PROCR, STEAP4, LRP1, SIGIRR, CD44, CD302, ADGRA2, ANTXR1, RPN1, PDGFRA, F2R, LTBR, TGFBR2, LAMP2, and RNF167. These markers are notably absent or expressed at very low levels in healthy samples.
- Healthy-Associated Markers: Conversely, a distinct set of genes on the right side of the plot exhibits strong expression in healthy samples but very low or no expression in cirrhotic samples. These include: CD9, TM4SF1, APP, BCAM, MYADM, SYPL1, GJA4, AXL, APLP2, MCAM, GPRC5C, CD164, NTRK2, PDLIM5, SLCO3A1, NGFR, VASN, NFASC, NPR3, ENPEP, SDC2, CDH6, JAG1, ITGA7, MRGPRF, SSPN, CRIM1, AOC3, ITFG1, and CLDND1. These markers likely characterize quiescent or homeostatic Hepatic stellate cells.
- Overall Pattern: The visualization highlights a striking shift in the surface proteome of Hepatic stellate cells in the context of cirrhosis, reflecting their activation and altered functional state compared to healthy conditions.
Biological Interpretation
Hepatic stellate cells (HSCs) are central players in liver fibrosis and cirrhosis. In a healthy liver, HSCs are quiescent, storing vitamin A. Upon liver injury, they activate, proliferate, migrate, and differentiate into myofibroblast-like cells, becoming the primary producers of extracellular matrix (ECM) components, leading to fibrosis. The identified surfaceome markers provide insights into these activation processes and phenotypic changes.
Markers Upregulated in Cirrhosis
- ENG (Endoglin/CD105):
- Signaling Pathways/Mechanisms: ENG is a coreceptor for the TGF-β superfamily, crucial for its pro-fibrogenic signaling. It modulates TGF-β1 bioavailability and receptor affinity, enhancing TGF-β signaling. ENG is also involved in angiogenesis. Its upregulation on activated HSCs promotes fibrogenesis and vascular remodeling in the diseased liver.
- Tissue Context: In the liver, elevated ENG expression on activated HSCs is a hallmark of fibrosis, contributing to the excessive ECM deposition and hepatic angiogenesis associated with cirrhosis.
References
- GeneCards: https://www.genecards.org/cgi-bin/carddisp.pl?gene=ENG
- PubMed search: "endoglin liver fibrosis" https://pubmed.ncbi.nlm.nih.gov/?term=endoglin+liver+fibrosis
- THY1 (CD90):
- Signaling Pathways/Mechanisms: THY1 is a glycosylphosphatidylinositol-anchored protein involved in cell adhesion, migration, and signaling. It is a well-established marker for activated fibroblasts and myofibroblasts in various fibrotic diseases. Its presence on HSCs indicates their activation state.
- Tissue Context: Upregulation of THY1 on HSCs in cirrhosis reflects their differentiation into myofibroblasts, which are highly profibrogenic. THY1 expression is often associated with the initiation and progression of fibrotic responses.
References
- GeneCards: https://www.genecards.org/cgi-bin/carddisp.pl?gene=THY1
- PubMed search: "THY1 hepatic stellate cell fibrosis" https://pubmed.ncbi.nlm.nih.gov/?term=THY1+hepatic+stellate+cell+fibrosis
- PDGFRA (Platelet-Derived Growth Factor Receptor Alpha):
- Signaling Pathways/Mechanisms: PDGFRA is a receptor tyrosine kinase that binds PDGF ligands. Activation of PDGFRA leads to downstream signaling cascades (e.g., PI3K/Akt, MAPK) that promote cell proliferation, migration, and survival. PDGF is a potent mitogen and chemoattractant for HSCs, driving their expansion and activation during fibrosis.
- Tissue Context: High PDGFRA expression on activated HSCs is a key driver of their proliferative capacity and migration to sites of injury in the liver, exacerbating fibrogenesis.
References
- GeneCards: https://www.genecards.org/cgi-bin/carddisp.pl?gene=PDGFRA
- PubMed search: "PDGFRA hepatic stellate cell proliferation" https://pubmed.ncbi.nlm.nih.gov/?term=PDGFRA+hepatic+stellate+cell+proliferation
- TGFBR2 (Transforming Growth Factor Beta Receptor 2):
- Signaling Pathways/Mechanisms: TGFBR2 is a serine/threonine kinase receptor that forms a heteromeric complex with TGFBR1 upon ligand binding (e.g., TGF-β1). This initiates the canonical Smad signaling pathway, leading to transcription of profibrotic genes (e.g., collagen I, alpha-SMA). TGF-β signaling is considered the most potent profibrotic pathway in the liver.
- Tissue Context: Upregulation of TGFBR2 on HSCs in cirrhosis indicates enhanced sensitivity and responsiveness to TGF-β1, significantly contributing to ECM production and fibrosis progression.
References
- GeneCards: https://www.genecards.org/cgi-bin/carddisp.pl?gene=TGFBR2
- PubMed search: "TGFBR2 liver fibrosis signaling" https://pubmed.ncbi.nlm.nih.gov/?term=TGFBR2+liver+fibrosis+signaling
- CD44:
- Signaling Pathways/Mechanisms: CD44 is a cell surface glycoprotein that acts as a receptor for hyaluronan and other ECM components. It is involved in cell-cell and cell-matrix interactions, cell adhesion, migration, proliferation, and survival. CD44 signaling can cross-talk with growth factor receptors and contribute to pro-fibrotic processes.
- Tissue Context: In cirrhosis, CD44 expression on activated HSCs facilitates their interaction with the altered ECM, promotes their migration, and potentially enhances their survival and fibrogenic activity within the fibrotic niche.
References
- GeneCards: https://www.genecards.org/cgi-bin/carddisp.pl?gene=CD44
- PubMed search: "CD44 hepatic stellate cell cirrhosis" https://pubmed.ncbi.nlm.nih.gov/?term=CD44+hepatic+stellate+cell+cirrhosis
- ITGA1 (Integrin Alpha 1):
- Signaling Pathways/Mechanisms: ITGA1 forms a heterodimer with ITGB1 (integrin beta 1) to form VLA-1, an integrin receptor for collagen and laminin. Integrins mediate cell-ECM adhesion and transmit mechanical and biochemical signals that regulate cell proliferation, differentiation, and survival. Its upregulation promotes cell adhesion to fibrotic matrix.
- Tissue Context: Elevated ITGA1 on activated HSCs strengthens their adhesion to the accumulating collagen and laminin in the fibrotic liver, contributing to their survival and perpetuation of fibrosis.
References
- GeneCards: https://www.genecards.org/cgi-bin/carddisp.pl?gene=ITGA1
- PubMed search: "ITGA1 hepatic stellate cell collagen" https://pubmed.ncbi.nlm.nih.gov/?term=ITGA1+hepatic+stellate+cell+collagen
- CD74 (MHC Class II Invariant Chain):
- Signaling Pathways/Mechanisms: CD74 acts as a chaperone for MHC class II molecules but also serves as a receptor for macrophage migration inhibitory factor (MIF). MIF-CD74 signaling promotes inflammation, cell proliferation, and survival in various contexts.
- Tissue Context: Upregulation of CD74 on HSCs may indicate their involvement in inflammatory responses within the cirrhotic liver, potentially through interactions with immune cells or by responding to inflammatory mediators like MIF, thereby contributing to disease progression.
References
- GeneCards: https://www.genecards.org/cgi-bin/carddisp.pl?gene=CD74
- PubMed search: "CD74 hepatic stellate cell inflammation" https://pubmed.ncbi.nlm.nih.gov/?term=CD74+hepatic+stellate+cell+inflammation
Markers Upregulated in Healthy Conditions
- CD9 (Tetraspanin 29):
- Signaling Pathways/Mechanisms: CD9 is a member of the tetraspanin family, involved in organizing multiprotein complexes on the cell surface. It plays roles in cell adhesion, migration, proliferation, and fusion. In quiescent HSCs, CD9 is thought to maintain their resting state and prevent activation. Its downregulation is associated with HSC activation.
- Tissue Context: High expression of CD9 characterizes quiescent HSCs in the healthy liver, supporting their non-fibrogenic phenotype and proper regulation within the tissue microenvironment.
References
- GeneCards: https://www.genecards.org/cgi-bin/carddisp.pl?gene=CD9
- PubMed search: "CD9 hepatic stellate cell quiescence" https://pubmed.ncbi.nlm.nih.gov/?term=CD9+hepatic+stellate+cell+quiescence
- APP (Amyloid Beta Precursor Protein):
- Signaling Pathways/Mechanisms: APP is widely known for its role in Alzheimer's disease, but it has diverse functions in cell adhesion, differentiation, neurogenesis, and synaptogenesis. Its extracellular domain can mediate cell-cell interactions. Its specific role in quiescent HSCs is less defined but may relate to maintaining cell-cell communication or matrix interactions.
- Tissue Context: APP expression in healthy HSCs could contribute to maintaining the integrity of the liver microenvironment or specific intercellular signaling pathways crucial for HSC quiescence.
References
- AXL (AXL Receptor Tyrosine Kinase):
- Signaling Pathways/Mechanisms: AXL is a receptor tyrosine kinase that binds Growth Arrest-Specific 6 (GAS6). AXL-GAS6 signaling is involved in cell survival, proliferation, migration, and efferocytosis (clearance of apoptotic cells). It often plays a role in regulating cellular responses to stress and maintaining tissue homeostasis or promoting tumor progression.
- Tissue Context: In healthy HSCs, AXL signaling might contribute to their survival and homeostatic functions, potentially by clearing cellular debris or modulating responses to minor injuries, keeping them in a quiescent state.
References
- NGFR (Nerve Growth Factor Receptor/p75NTR):
- Signaling Pathways/Mechanisms: NGFR is a member of the TNF receptor superfamily. It can bind neurotrophins (like NGF, BDNF) and pro-neurotrophins, initiating signaling pathways that regulate cell survival, apoptosis, differentiation, and migration. In many cell types, NGFR promotes apoptosis or modulates cell fate decisions.
- Tissue Context: NGFR is expressed on quiescent HSCs, and its expression decreases upon HSC activation. It is considered a marker of HSC quiescence, suggesting it may play a role in maintaining the quiescent phenotype or promoting apoptosis of activated HSCs, thereby resolving fibrosis.
References
- GeneCards: https://www.genecards.org/cgi-bin/carddisp.pl?gene=NGFR
- PubMed search: "NGFR hepatic stellate cell quiescence" https://pubmed.ncbi.nlm.nih.gov/?term=NGFR+hepatic+stellate+cell+quiescence
- SDC2 (Syndecan 2):
- Signaling Pathways/Mechanisms: SDC2 is a heparan sulfate proteoglycan that functions as a coreceptor for various growth factors, cytokines, and ECM components. It plays roles in cell adhesion, migration, proliferation, and differentiation by influencing the availability and signaling of its binding partners.
- Tissue Context: In healthy HSCs, SDC2 could be involved in maintaining their interactions with the healthy liver ECM and modulating growth factor responses to preserve quiescence or orchestrate normal tissue turnover.
References
- CDH6 (Cadherin-6):
- Signaling Pathways/Mechanisms: CDH6 is a classical cadherin, mediating homophilic, calcium-dependent cell-cell adhesion. Cadherins are crucial for tissue morphogenesis, cell sorting, and maintaining epithelial and mesenchymal tissue integrity.
- Tissue Context: The presence of CDH6 on healthy HSCs may contribute to their specific cell-cell interactions within the healthy liver microenvironment, potentially regulating their spatial organization and signaling, which are altered upon activation.
References
- JAG1 (Jagged Canonical Notch Ligand 1):
- Signaling Pathways/Mechanisms: JAG1 is a ligand for Notch receptors, initiating Notch signaling. The Notch pathway is a highly conserved cell-cell communication system involved in regulating cell fate decisions, differentiation, proliferation, and apoptosis in various tissues.
- Tissue Context: Notch signaling has complex roles in liver development and disease. JAG1 expression in healthy HSCs suggests a role in maintaining their quiescent state or in specific cell-cell interactions that prevent aberrant activation, potentially by signaling to neighboring cells (e.g., hepatocytes, endothelial cells).
References
Clinical or Translational Implications
The identification of distinct surfaceome markers on Hepatic stellate cells in cirrhosis versus healthy liver has significant clinical and translational potential for the management of cirrhosis.
Therapeutic Targets for Cirrhosis
- Fibrosis Inhibition: Markers highly upregulated in cirrhotic HSCs, such as ENG, THY1, PDGFRA, and TGFBR2, represent critical pathways driving HSC activation and fibrogenesis.
- Targeting TGF-β signaling (via TGFBR2 or ENG) with inhibitors (e.g., galunisertib, fresolimumab) could attenuate fibrosis progression.
- Inhibitors of PDGFRA (e.g., imatinib, nintedanib) are already used in other fibrotic diseases and could be repurposed or developed for liver fibrosis to reduce HSC proliferation.
- Antibodies targeting THY1 or CD44 could potentially block their pro-fibrogenic functions or selectively deplete activated HSCs.
- Cell-Specific Delivery: Since these are surfaceome markers, they offer opportunities for antibody-drug conjugates (ADCs) or cell-specific gene therapy delivery systems to target activated HSCs, minimizing off-target effects on other liver cells.
Biomarkers for Diagnosis and Prognosis
- The differential expression of these surface markers could serve as diagnostic or prognostic biomarkers for cirrhosis. For example, high levels of ENG, THY1, or PDGFRA on circulating HSCs (if detectable) or in liver biopsies could indicate disease severity or progression.
- Conversely, the presence of NGFR or CD9 could indicate residual quiescent HSCs or response to anti-fibrotic therapies.
Monitoring Treatment Response
- Changes in the expression profiles of these markers could be used to monitor the efficacy of anti-fibrotic treatments. A decrease in cirrhosis-associated markers and an increase in healthy-associated markers (e.g., NGFR, CD9) in HSCs could indicate successful therapy and fibrosis regression.
Understanding Disease Mechanisms
- Further research into the specific roles of markers like LY6E, ITM2C, EMP3, MXRA8, PROCR (cirrhosis-associated) or APP, AXL, SDC2, CDH6, JAG1 (healthy-associated) in HSC biology could unveil novel pathways and mechanisms critical for HSC activation or quiescence, leading to the discovery of new therapeutic targets.
In summary, this analysis provides a rich set of surfaceome targets on Hepatic stellate cells that are highly relevant to the pathogenesis of cirrhosis. These findings are crucial for developing targeted interventions that specifically modulate HSC behavior to prevent or reverse liver fibrosis.
14. T cell CD4+ Condition-Specific Surfaceome Markers in Liver Cirrhosis
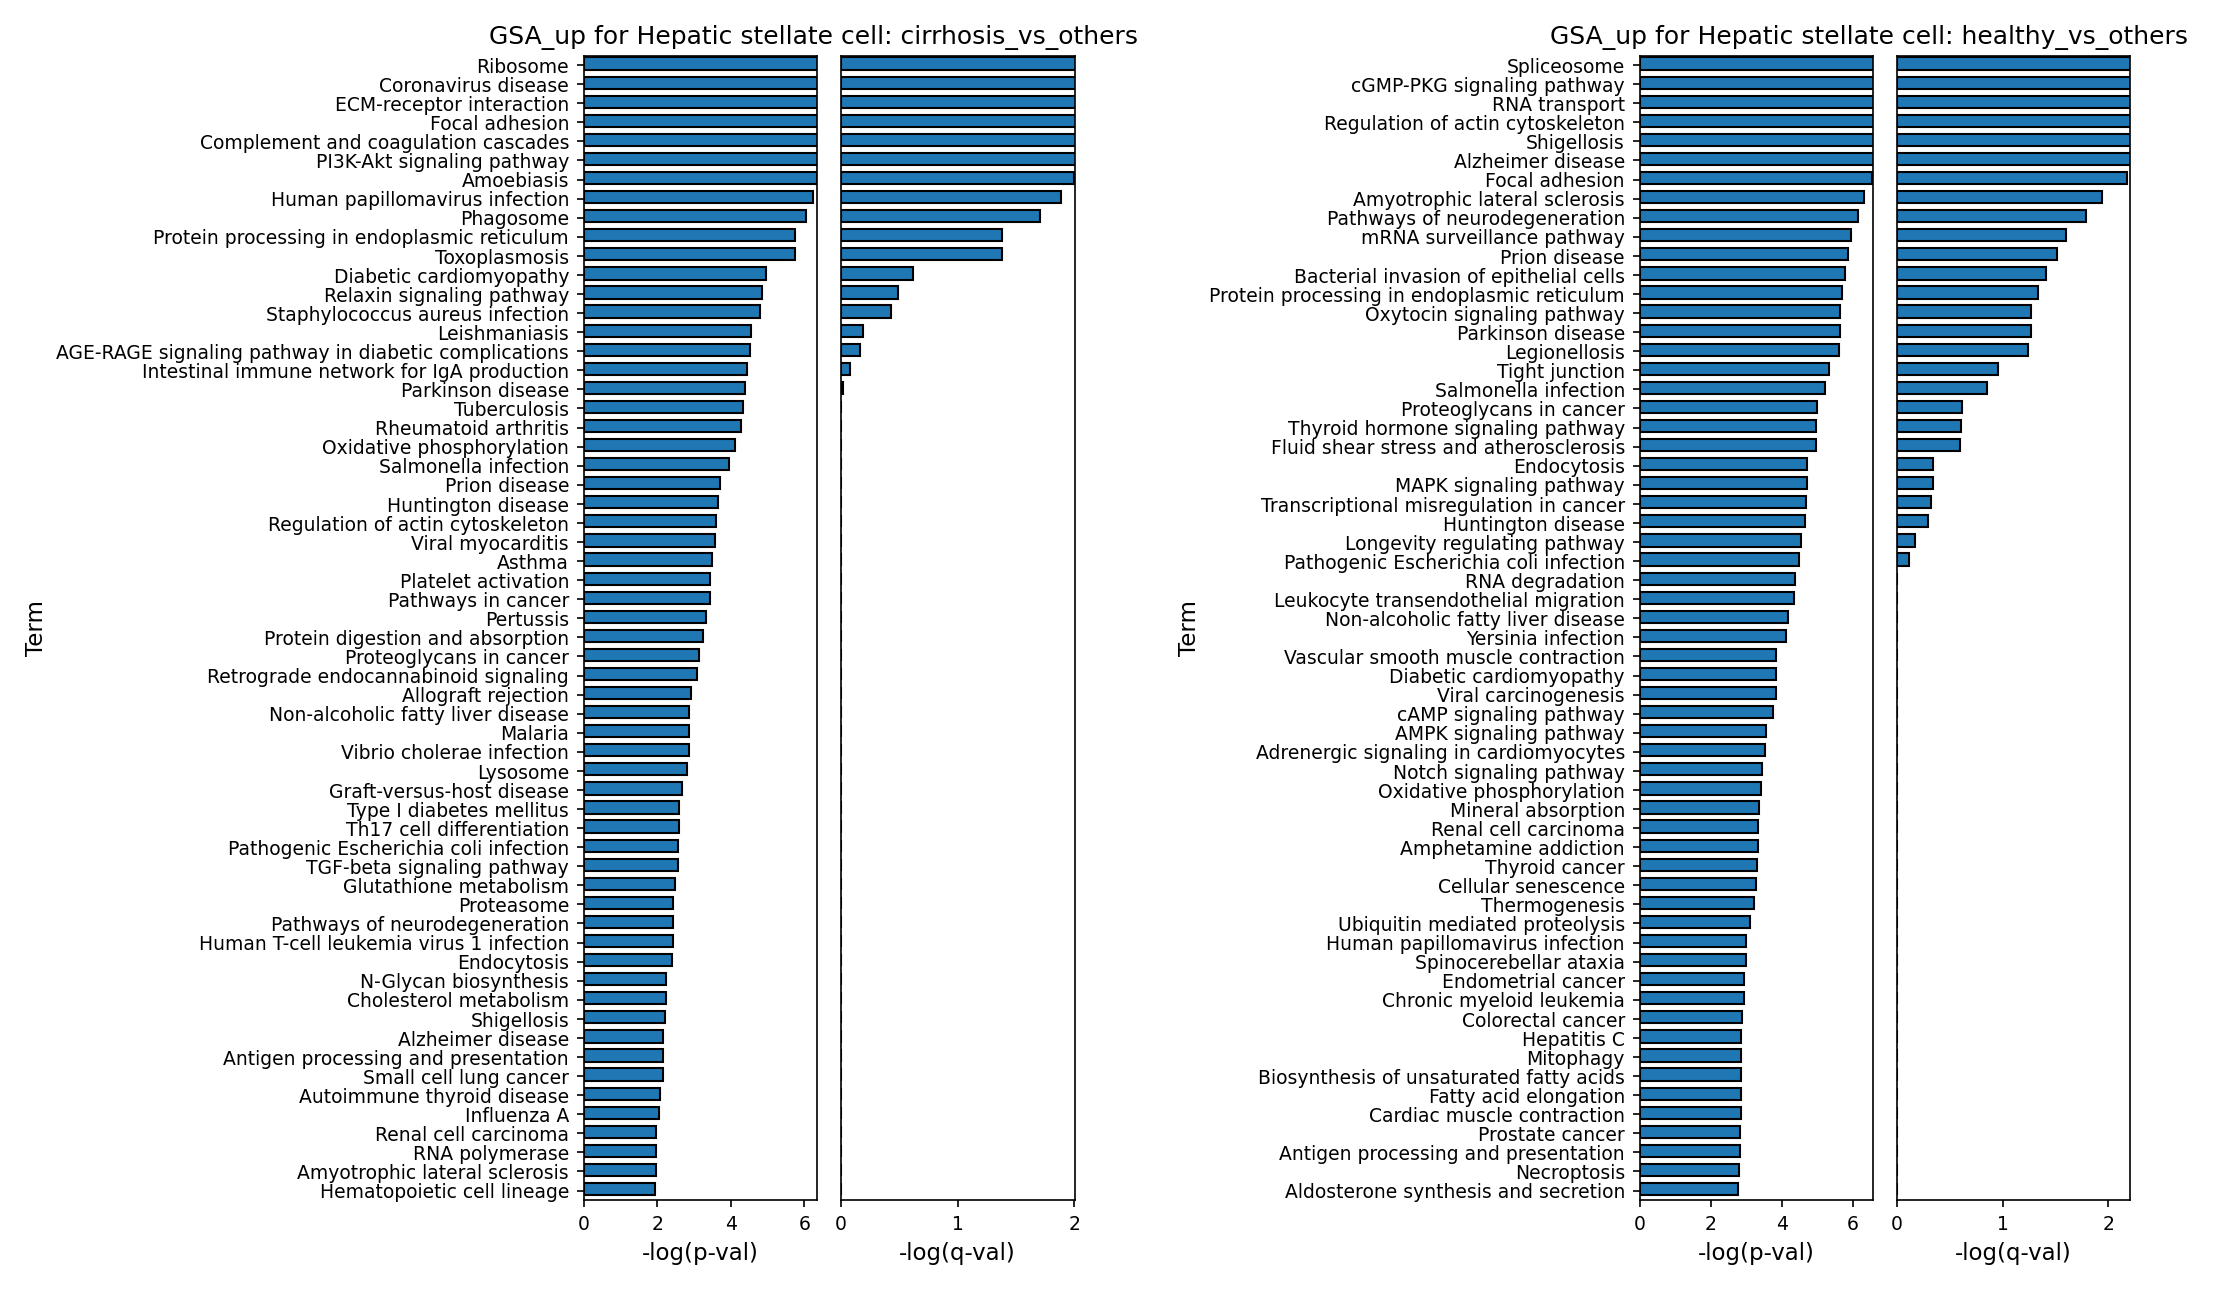
[Analysis Visualization Results]...
Analysis Overview
This analysis presents a dot plot visualizing the expression patterns of selected surfaceome markers in CD4+ T cells across individual samples from healthy and cirrhotic liver tissues. The markers were identified based on their differential expression between conditions, specifically focusing on surface-expressed proteins to highlight potential targets for therapeutic intervention or diagnostic utility. The aim is to discern how the surface phenotype of CD4+ T cells is altered in the context of liver cirrhosis, providing insights into their functional state and interactions within the diseased liver microenvironment.
Visual Summary
The dot plot effectively stratifies CD4+ T cell marker expression by condition (cirrhosis vs. healthy) and individual samples.
- X-axis: Displays the names of the identified surfaceome markers.
- Y-axis: Represents individual samples, clustered by condition (cirrhosis samples grouped at the top, healthy samples at the bottom).
- Dot Color Intensity (Mean Expression): A gradient from white (low) to dark red (high) indicates the mean expression level of a marker within the CD4+ T cells of that specific sample.
- Dot Size (Fraction of Cells): The size of each dot corresponds to the percentage of CD4+ T cells in that sample expressing the marker.
- Bar Chart (Right): Shows the total number of CD4+ T cells analyzed per sample.
Key Observations:
- Cirrhosis-Associated Markers: A distinct cluster of markers, including IL2RG, LY6E, GYPC, SIT1, CD40LG, BST2, SIGIRR, LMAN2, and CXCR3, exhibits consistently high mean expression (dark red dots) and a large fraction of expressing cells (large dot size) across most cirrhotic samples. This indicates a prevalent and upregulated expression of these surface proteins on CD4+ T cells in liver cirrhosis. Notably, CD40LG and CXCR3 show particularly strong and widespread upregulation in the cirrhotic samples.
- Healthy-Associated Markers: Conversely, markers such as CCR7, SUSD3, and HLA-DRA show higher mean expression and larger dot sizes in several healthy samples compared to cirrhotic samples. This suggests these markers are more characteristic of CD4+ T cells in a healthy liver environment.
- Condition Specificity: The plot clearly delineates two major groups of markers: those prominently expressed in cirrhosis and those more associated with healthy tissue, highlighting condition-specific changes in CD4+ T cell surface phenotypes. The red boxes visually emphasize these distinct patterns.
- Sample Heterogeneity: While general trends are clear, there is some variability in expression levels and cell fractions even within the same condition, indicating potential individual differences or varying disease stages.
Biological Interpretation
The observed surfaceome marker profiles provide critical insights into the altered biology of CD4+ T cells in liver cirrhosis.
Markers Upregulated in Cirrhosis
The upregulation of these markers suggests an activated, inflammatory, and potentially migratory phenotype for CD4+ T cells in the cirrhotic liver:
- IL2RG (Interleukin-2 Receptor Gamma Chain): This is a common gamma chain subunit shared by receptors for several cytokines (IL-2, -4, -7, -9, -15, -21). Its increased expression on CD4+ T cells suggests an enhanced capacity to respond to these cytokines, driving T cell proliferation, survival, and differentiation into effector cells within the inflammatory milieu of cirrhosis. This can amplify immune responses contributing to liver damage and fibrosis. GeneCards: IL2RG
- LY6E (Lymphocyte Antigen 6 Family Member E): Involved in T cell activation and signaling, its upregulation often correlates with T cell activation and participation in immune responses. In cirrhosis, this may reflect the ongoing activation and effector functions of CD4+ T cells. GeneCards: LY6E
- CD40LG (CD40 Ligand / CD154): A critical co-stimulatory molecule expressed on activated T cells, which interacts with CD40 on antigen-presenting cells (APCs), B cells, and non-immune cells like hepatic stellate cells. The CD40LG-CD40 axis is pivotal in promoting chronic inflammation, B cell activation for antibody production, and fibrogenesis. Its high expression indicates active T cell-mediated immune responses and intercellular communication driving pathology in cirrhosis. GeneCards: CD40LG
- BST2 (Bone Marrow Stromal Antigen 2 / CD317 / tetherin): An interferon-inducible protein, often upregulated during viral infections or general inflammatory states. Its presence on CD4+ T cells in cirrhosis may suggest ongoing viral challenges (e.g., in viral hepatitis-induced cirrhosis) or a heightened interferon-driven inflammatory environment, influencing immune cell trafficking and activation. GeneCards: BST2
- SIGIRR (Single Ig And IL-1 Related Receptor): A negative regulator of TLR and IL-1R signaling, involved in dampening inflammatory responses. Its upregulation could represent a feedback mechanism attempting to control excessive inflammation, or it could be part of a dysregulated immune response where such inhibitory pathways are overwhelmed. GeneCards: SIGIRR
- CXCR3 (C-X-C Motif Chemokine Receptor 3): A chemokine receptor whose ligands (CXCL9, CXCL10, CXCL11) are strongly induced by IFN-gamma during inflammation. Upregulation of CXCR3 on CD4+ T cells suggests their active migration into the liver, where they contribute to tissue damage and fibrogenesis. This is a hallmark of T helper 1 (Th1) responses and cytotoxic T cell infiltration, highly relevant in chronic liver inflammation. GeneCards: CXCR3
Markers such as GYPC, SIT1, and LMAN2, while upregulated, have less clearly defined roles on the surface of CD4+ T cells in cirrhosis and warrant further investigation to elucidate their specific contributions.
Markers Upregulated in Healthy Conditions
The higher expression of these markers in healthy samples suggests roles in immune surveillance, homeostasis, or specific T cell subsets. Their relative downregulation in cirrhosis might indicate a shift from these states.
- CCR7 (C-C Motif Chemokine Receptor 7): Essential for T cell homing to secondary lymphoid organs (e.g., lymph nodes) via interactions with CCL19 and CCL21. Its higher expression in healthy tissue CD4+ T cells suggests a greater proportion of circulating naive or central memory T cells, or T cells maintaining their capacity for lymphoid recirculation. Its downregulation in cirrhosis could reflect T cell retention in the inflamed liver tissue or differentiation towards effector phenotypes that lose CCR7. GeneCards: CCR7
- HLA-DRA (Major Histocompatibility Complex, Class II, DR Alpha): Encodes an alpha chain of MHC Class II molecules, which are crucial for presenting exogenous antigens to CD4+ T cells. While primarily on professional APCs, T cells can express MHC Class II under specific activation or regulatory conditions. Its varied expression (higher in some healthy, lower in some cirrhotic) could reflect changes in antigen presentation capacity or immune regulation within the liver. GeneCards: HLA-DRA
Clinical or Translational Implications
The identification of these cell-type-specific surfaceome markers provides valuable insights for understanding the pathogenesis of cirrhosis and developing targeted therapies.
- Therapeutic Targets for Cirrhosis:
- CD40LG: Given its crucial role in promoting inflammation and fibrosis via the CD40-CD40LG axis, CD40LG represents a strong therapeutic candidate. Blocking this interaction could dampen T cell-mediated immune activation, reduce B cell responses, and inhibit fibrogenic pathways involving hepatic stellate cells. Anti-CD40LG antibodies have been investigated in other inflammatory and autoimmune conditions, suggesting a viable strategy for cirrhosis. PubMed: CD40LG cirrhosis
- CXCR3: The high expression of CXCR3 on CD4+ T cells in cirrhosis indicates their active migration into the inflamed liver. Targeting CXCR3 or its ligands (CXCL9/10/11) could inhibit the recruitment of pathogenic T cells, thereby reducing inflammation and fibrosis. This approach has shown promise in preclinical models of various inflammatory diseases, including liver fibrosis. PubMed: CXCR3 liver fibrosis
- IL2RG: While a broadly expressed subunit, its upregulation suggests increased T cell responsiveness. Modulating specific downstream signaling pathways or cytokine interactions involving IL2RG could be explored, though direct targeting might lead to widespread immunosuppression.
- Biomarkers: The identified condition-specific markers could serve as diagnostic or prognostic biomarkers for cirrhosis, particularly if they can be detected via non-invasive means (e.g., flow cytometry of peripheral blood T cells if correlating with liver-resident cells) or in liver biopsies to assess disease severity or progression.
- Validation and Functional Studies: Further experimental validation is crucial. This would involve:
- Functional assays: *In vitro* experiments to investigate the impact of perturbing these pathways (e.g., blocking CD40LG or CXCR3) on CD4+ T cell activation, proliferation, cytokine production, and migratory capacity.
- Preclinical models: Testing the efficacy of targeting these markers in animal models of liver cirrhosis to assess their impact on liver inflammation, fibrosis, and overall liver function.
- Clinical correlation: Investigating the correlation of these markers with disease severity, response to therapy, and clinical outcomes in human patients with cirrhosis.
In conclusion, the surfaceome markers identified in this analysis, particularly CD40LG and CXCR3, provide compelling evidence for altered CD4+ T cell function in cirrhosis and present promising avenues for the development of targeted therapies to mitigate liver inflammation and fibrosis.
15. Gene Ontology (GSA) Analysis for Hepatic Stellate Cells in Liver Cirrhosis
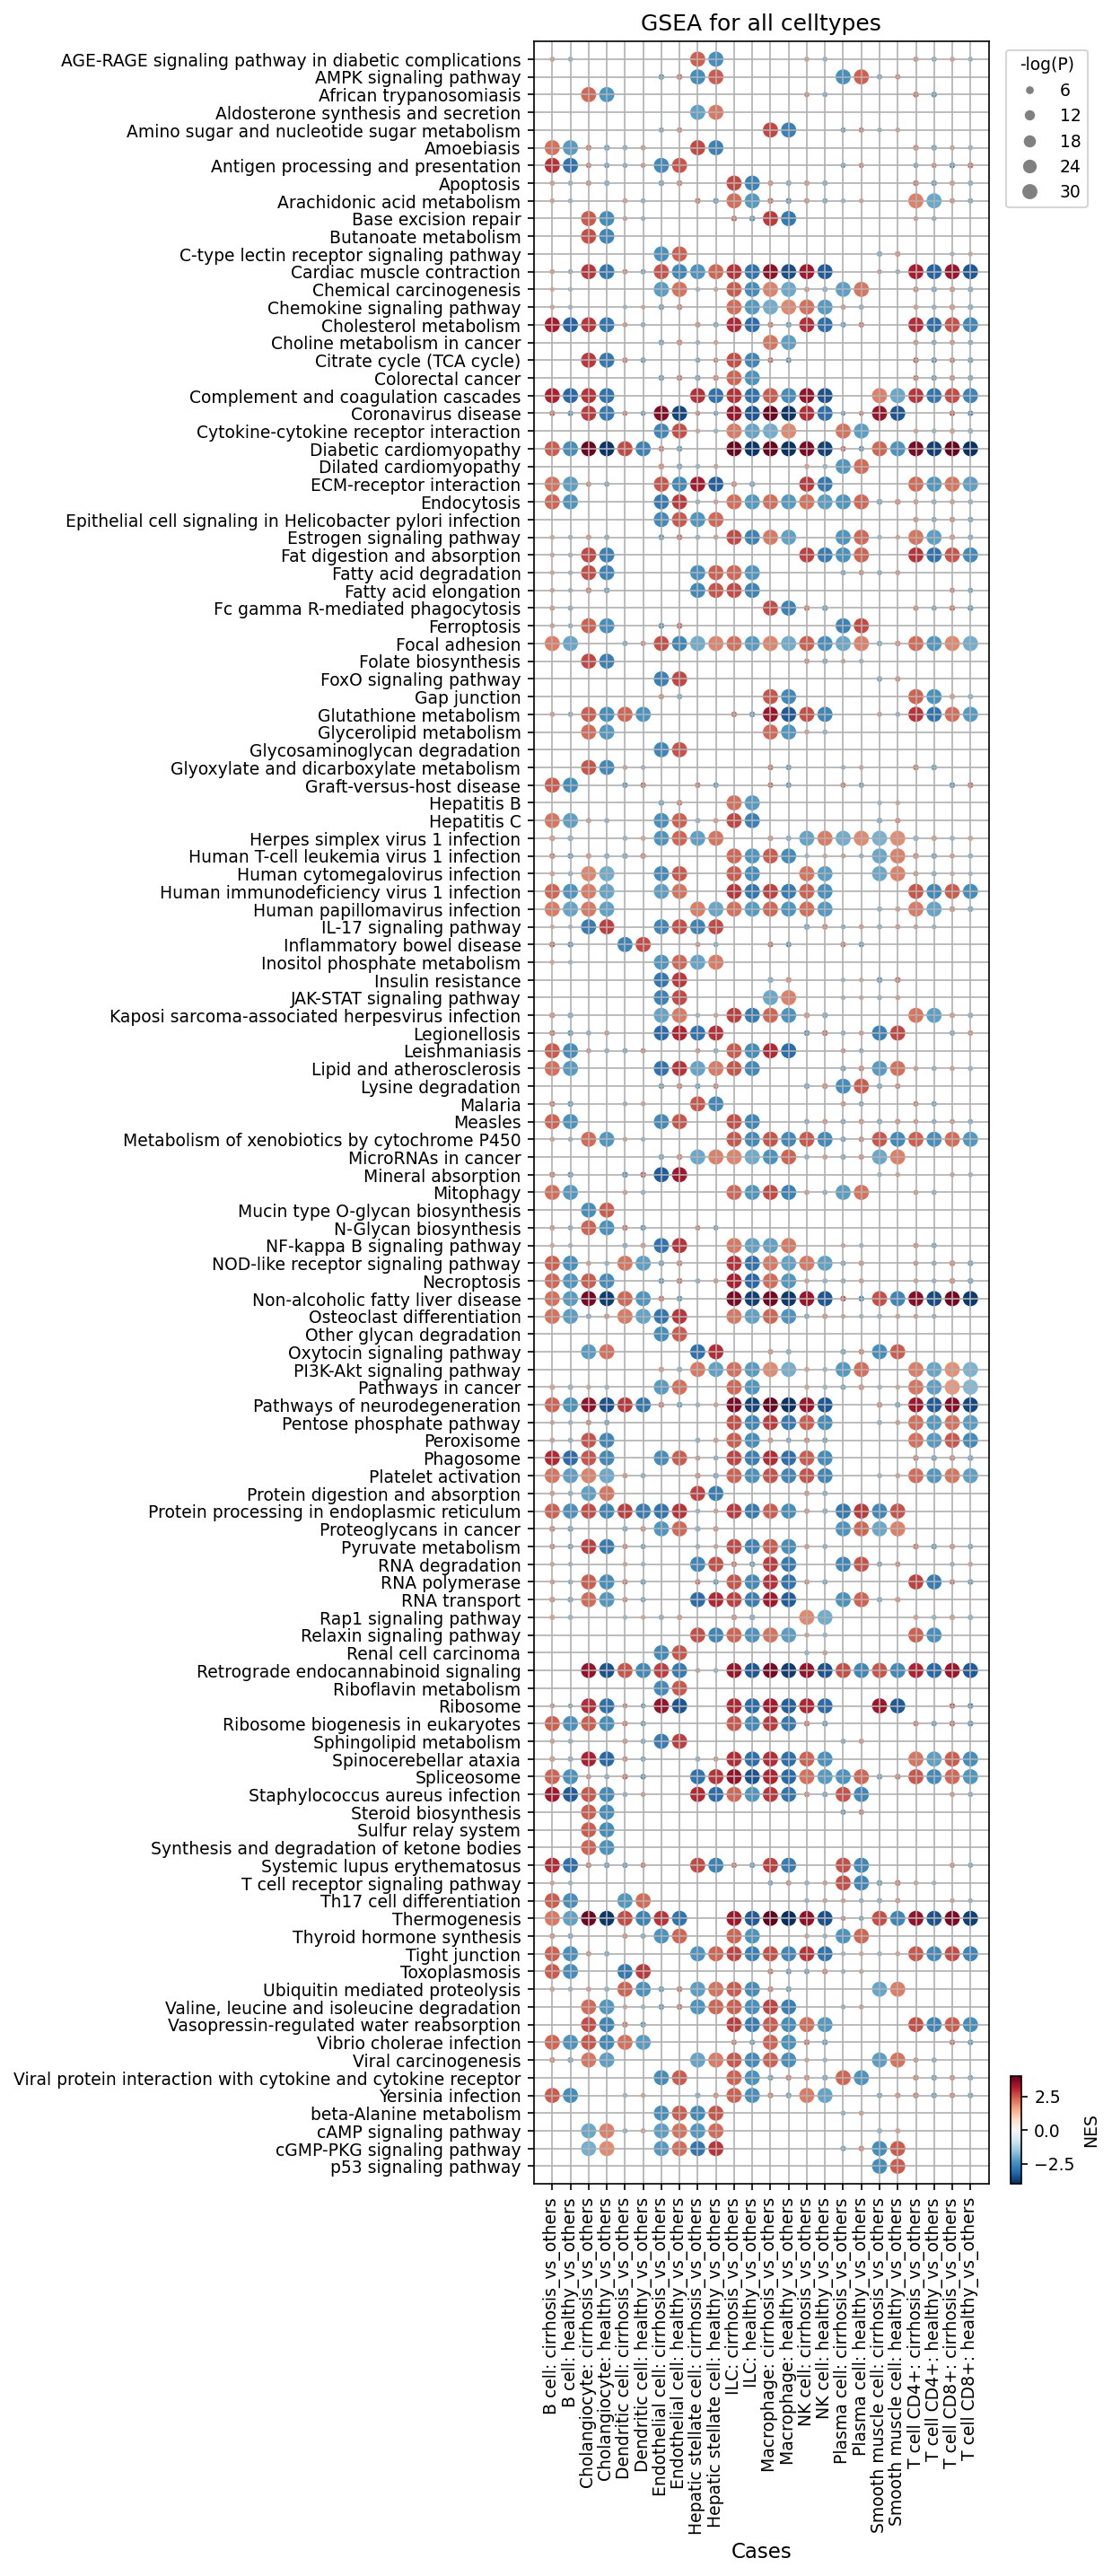
[Analysis Visualization Results]...
Analysis Overview
This analysis presents Gene Ontology (GO) enrichment results for Hepatic stellate cells (HSCs), a key cell type in the liver, comparing two conditions: "cirrhosis vs others" and "healthy vs others". The "others" in this context refers to the complementary condition present in the dataset (i.e., healthy samples for the cirrhosis comparison, and cirrhotic samples for the healthy comparison). The results are visualized as bar plots, displaying the top enriched GO terms sorted by their statistical significance (-log(p-value) and -log(q-value)), indicating pathways that are significantly upregulated in HSCs within each respective condition.
Visual Summary
Hepatic Stellate Cells in Cirrhosis
The bar plot for Hepatic stellate cells in the cirrhosis condition reveals a strong enrichment of pathways associated with extracellular matrix (ECM) remodeling, cellular adhesion, and inflammatory processes.
- Highly significant terms (high -log(p-val) and -log(q-val)) include "Ribosome", "ECM-receptor interaction", "Focal adhesion", "Complement and coagulation cascades", and "PI3K-Akt signaling pathway".
- "Ribosome" suggests increased protein synthesis, which is crucial for ECM production by activated HSCs.
- "ECM-receptor interaction" and "Focal adhesion" are critical for cell-matrix interactions, cell migration, and mechanical signaling, all vital in fibrogenesis.
- "Complement and coagulation cascades" points towards an active immune and inflammatory environment.
- "PI3K-Akt signaling pathway" is a known mediator of cell proliferation, survival, and differentiation, highly relevant to HSC activation.
- Other notable terms include "Phagosome" and several infection-related pathways (e.g., "Amoebiasis", "Human papillomavirus infection", "Staphylococcus aureus infection"), which may reflect a generalized immune activation or stress response in the cirrhotic microenvironment.
Hepatic Stellate Cells in Healthy Liver
The bar plot for Hepatic stellate cells in the healthy condition highlights pathways primarily related to fundamental cellular machinery and regulatory processes.
- Top enriched terms include "Spliceosome", "cGMP-PKG signaling pathway", "RNA transport", "Regulation of actin cytoskeleton", and "Alzheimer disease".
- "Spliceosome" and "RNA transport" indicate active regulation of gene expression and RNA processing, essential for basic cell maintenance.
- "cGMP-PKG signaling pathway" and "Regulation of actin cytoskeleton" are involved in various cellular functions, including cell contractility and morphology, relevant for quiescent HSCs.
- "Focal adhesion" is also present, albeit with a lower rank and significance compared to the cirrhosis condition, suggesting its basal importance in HSC function even in a healthy state.
- A number of neurodegenerative disease terms (e.g., "Alzheimer disease", "Pathways of neurodegeneration", "Prion disease") are observed. While not directly implying neurological disease in HSCs, these pathways often encompass general cellular stress responses, protein misfolding, or metabolic dysregulation common across different cell types and disease states.
Biological Interpretation
The Gene Ontology analysis effectively distinguishes the biological states of Hepatic stellate cells in healthy versus cirrhotic livers.
In cirrhosis, HSCs undergo activation, transitioning from a quiescent, vitamin A-storing phenotype to a myofibroblast-like cell that is highly proliferative and fibrogenic. The enriched pathways directly reflect this activation:
- The prominence of ECM-receptor interaction and Focal adhesion underscores the critical role of HSCs in remodeling the extracellular matrix during fibrosis. These pathways mediate cell adhesion, migration, and mechanotransduction, which drive the deposition and contraction of fibrotic tissue. GeneCards: ITGA5 (Focal Adhesion, ECM-Receptor Interaction)
- PI3K-Akt signaling pathway is a well-established regulator of HSC activation, proliferation, and survival, making its enrichment highly consistent with their pro-fibrotic behavior in cirrhosis. PubMed Search: PI3K-Akt hepatic stellate fibrosis
- The enrichment of Ribosome indicates high protein synthesis capacity, likely to support the massive production of ECM proteins (e.g., collagen) that characterize fibrosis.
- Complement and coagulation cascades activation suggests an inflammatory milieu where HSCs interact with immune cells and participate in inflammatory responses, contributing to chronic liver injury and fibrosis progression.
In contrast, healthy Hepatic stellate cells show enrichment for fundamental cellular processes, consistent with their quiescent state:
- Pathways like Spliceosome, RNA transport, and Protein processing in endoplasmic reticulum highlight the maintenance of basic cellular machinery required for gene expression, protein synthesis, and cellular homeostasis.
- Regulation of actin cytoskeleton is involved in maintaining cell shape and motility, which is part of normal HSC function even in quiescence.
- The presence of cGMP-PKG signaling pathway is interesting, as this pathway has been implicated in regulating HSC contractility and relaxation, potentially involved in maintaining the quiescent state or modulating sinusoidal blood flow.
The comparative analysis clearly indicates a shift in HSC biology during cirrhosis, moving from a metabolically balanced, quiescent state to a highly active, matrix-producing, and inflammation-responsive phenotype.
Clinical or Translational Implications
The identified pathways in Hepatic stellate cells during cirrhosis offer potential targets for therapeutic intervention in liver fibrosis and cirrhosis:
- Targeting ECM-receptor interaction and Focal adhesion: Modulating these pathways could inhibit HSC migration, adhesion to the fibrotic matrix, and subsequent ECM deposition, potentially halting or reversing fibrosis progression.
- Inhibiting PI3K-Akt signaling: Given its central role in HSC activation and proliferation, targeting this pathway could reduce the fibrogenic activity of HSCs. Specific inhibitors could be explored as anti-fibrotic agents.
- Modulating inflammatory pathways: Intervening with the "Complement and coagulation cascades" or related immune pathways could attenuate the chronic inflammation that perpetuates HSC activation and fibrosis.
- Understanding the metabolic shift (e.g., increased protein synthesis indicated by "Ribosome" enrichment) in cirrhotic HSCs could lead to novel metabolic interventions to disarm their fibrogenic capacity.
These findings underscore the importance of Hepatic stellate cells as central players in cirrhosis pathogenesis and highlight specific biological processes that could be leveraged for developing targeted anti-fibrotic therapies.
16. Gene Set Enrichment Analysis (GSEA) of Cell-type Specific Pathways in Liver Cirrhosis

[Analysis Visualization Results]...
Analysis Overview
This analysis presents Gene Set Enrichment Analysis (GSEA) results across various liver cell types (celltype_minor) in the context of cirrhosis. The dot plot visualizes pathways that are significantly enriched or depleted in cells from cirrhotic livers compared to healthy controls, as well as the inverse comparison (healthy versus cirrhotic cells). The objective is to identify cell-type specific biological processes and molecular pathways dysregulated in cirrhosis.
Visual Summary
The dot plot displays the GSEA results for 120 gene sets (pathways) across 12 distinct cell types, each compared between "cirrhosis vs. others" (referring to healthy controls for that cell type) and "healthy vs. others" (referring to cirrhotic samples for that cell type).
- Dot Color (Normalized Enrichment Score - NES): The color of each dot indicates the Normalized Enrichment Score (NES), with a color gradient from deep blue to deep red (using the 'RdBu_r' colormap). Red signifies a positive NES, indicating pathways are upregulated or enriched in the "test" condition (e.g., in cirrhosis when comparing "cirrhosis_vs_others"). Blue signifies a negative NES, indicating pathways are downregulated or depleted.
- Dot Size (-log(p-value)): The size of each dot corresponds to the -log(p-value) of the enrichment. Larger dots represent more statistically significant enrichment or depletion of the pathway.
- Comparison Context: For each celltype_minor, two columns are shown: [celltype]: cirrhosis_vs_others and [celltype]: healthy_vs_others. These columns effectively represent a comparison of that specific cell type in the cirrhotic condition versus the healthy condition, and vice-versa. As expected, pathways enriched in cirrhosis are generally depleted in healthy cells, leading to inverse color patterns between these paired columns (e.g., a red dot in "cirrhosis_vs_others" typically corresponds to a blue dot of similar magnitude in "healthy_vs_others" for the same pathway).
Overall, the plot reveals widespread and cell-type specific alterations in pathway activity in cirrhotic livers, with clear patterns of both pathway upregulation (red) and downregulation (blue). Highly significant (large dots) and strongly enriched/depleted (bright red/blue) pathways are evident across multiple cell types.
Biological Interpretation
The GSEA results highlight several key biological themes characteristic of liver cirrhosis, demonstrating significant shifts in immune responses, metabolic functions, and fibrotic processes across various liver cell populations.
1. Robust Inflammatory and Immune Activation in Myeloid and Lymphoid Cells
- Macrophages, Dendritic cells, T cells (CD4+, CD8+), ILC, NK cells: Show strong upregulation (red, large dots) of pathways central to immune activation and inflammation in cirrhosis. These include:
- Cytokine-cytokine receptor interaction PubMed search
Chemokine signaling pathway
NF-kappa B signaling pathway
- Antigen processing and presentation (especially in Macrophages and Dendritic cells)
- Phagosome and Lysosome (highly enriched in Macrophages)
- Toll-like receptor signaling pathway and NOD-like receptor signaling pathway
- IL-17 signaling pathway (prominent in Macrophages, T cells, Cholangiocytes)
- T cell receptor signaling pathway and Th17 cell differentiation (in T cells).
These findings underscore the chronic inflammatory state and persistent immune cell activation driving cirrhosis progression.
2. Metabolic Reprogramming and Impaired Liver Function
- Widespread downregulation (blue, large dots) across multiple cell types (especially Macrophages, Hepatic stellate cells, Endothelial cells, T cells, and Cholangiocytes) is observed for pathways related to:
- Oxidative phosphorylation PubMed search
Fatty acid degradation and Fatty acid elongation
Cholesterol metabolism
- Metabolism of xenobiotics by cytochrome P450: This pathway, critical for detoxification, is notably downregulated across several cell types, reflecting compromised liver detoxification capacity in cirrhosis.
Peroxisome
- Ribosome biogenesis in eukaryotes: Downregulation suggests reduced protein synthesis capacity, indicative of cellular stress or altered metabolic demands.
These patterns indicate a significant metabolic shift and dysfunction in cirrhotic liver cells, moving away from oxidative and lipid metabolism, which contributes to disease pathology.
3. Fibrosis and Extracellular Matrix Remodeling
- Hepatic stellate cells, Cholangiocytes, Endothelial cells, Smooth muscle cells: Exhibit strong upregulation (red, large dots) of pathways associated with fibrogenesis and structural changes:
ECM-receptor interaction
Focal adhesion
- PI3K-Akt signaling pathway (known to be involved in stellate cell activation)
- Rap1 signaling pathway (in Endothelial cells, related to cell adhesion and migration)
- Adipogenesis and Fatty acid elongation in Hepatic stellate cells, consistent with their activated fibrogenic phenotype.
These findings confirm the central role of these cell types in producing and remodeling the extracellular matrix, a hallmark of liver fibrosis.
4. Cell Stress, Apoptosis, and Proliferation
- Apoptosis is upregulated in Cholangiocytes and Smooth muscle cells in cirrhosis, suggesting increased cell death in these populations.
- Pathways related to p53 signaling pathway and Base excision repair show cell-type specific changes, indicating altered DNA damage response and cell cycle control.
5. Cell-type Specificity and Consistency
While some pathways (e.g., inflammatory, metabolic) show broad dysregulation across multiple cell types, others are highly cell-type specific. For instance, "Phagosome" is predominantly enriched in Macrophages, while "T cell receptor signaling pathway" is specific to T cells. The inverse correlation between "cirrhosis_vs_others" and "healthy_vs_others" columns consistently validates these observed trends.
Clinical or Translational Implications
The comprehensive GSEA results provide valuable insights into the underlying molecular mechanisms of liver cirrhosis with potential clinical and translational implications:
- Therapeutic Targets for Inflammation and Fibrosis: The consistent upregulation of inflammatory (e.g., NF-kappa B, cytokine/chemokine signaling, IL-17) and fibrotic (e.g., ECM-receptor interaction, PI3K-Akt signaling) pathways across key liver cell types identifies potential therapeutic targets to halt or reverse disease progression. Modulating the activity of Macrophages, Hepatic stellate cells, and Cholangiocytes could be crucial.
- Metabolic Reprogramming as a Disease Marker: The broad downregulation of oxidative phosphorylation and fatty acid metabolism, alongside impaired xenobiotic metabolism, highlights the systemic metabolic decompensation in cirrhosis. Targeting specific metabolic pathways could offer strategies to improve liver function and patient outcomes.
- Cell-type Specific Interventions: The observed cell-type specific pathway alterations suggest that tailored therapeutic approaches focusing on particular cell populations (e.g., macrophage-targeted anti-inflammatory drugs, stellate cell inhibitors for fibrosis) might be more effective than broad-spectrum treatments.
- Biomarker Discovery: Upregulated pathways and their associated genes could serve as potential biomarkers for diagnosing cirrhosis, monitoring disease severity, or assessing treatment response. For example, markers of macrophage activation or stellate cell fibrogenic activity could be explored.
- Infection and Immunity: The enrichment of pathways related to viral infections (e.g., Hepatitis B/C), given their common role in cirrhosis etiology, further reinforces the importance of antiviral strategies and understanding how chronic viral presence shapes the liver microenvironment. PubMed search
17. Discussion
The single-cell RNA sequencing analysis of human liver tissue provides a high-resolution view of the cellular and molecular changes underpinning cirrhosis. A central finding is the extensive cellular remodeling, marked by a substantial reduction in healthy hepatocytes and innate lymphoid cells (ILCs, NK cells), alongside a notable expansion of pro-fibrotic (activated Hepatic stellate cells, Fibroblasts, Cholangiocytes) and inflammatory immune cell populations (Macrophages, T cells) in cirrhotic livers (Section 4, 5). This cellular shift is not merely quantitative but reflects a qualitative change in cell states, as evidenced by cell-type specific marker expression and pathway dysregulation (Section 3, 11-14, 16).
Immune dysregulation is a prominent feature of cirrhosis. Macrophages, a major myeloid population, exhibit a distinct shift towards a pro-inflammatory M1 phenotype, with a significant increase in M1 cells and a decrease in potentially reparative M2A cells (Section 7, 8). This M1 dominance fuels a persistent inflammatory environment, characterized by upregulated inflammatory signaling pathways (e.g., NF-κB, chemokine signaling, IL-17) across myeloid and lymphoid cells (Section 16). T cell populations also undergo significant rebalancing (Section 6): while cytotoxic T cells are notably decreased, regulatory T cells (Tregs) and pro-inflammatory T helper subsets (Th1, Th17, Th22) are significantly increased. This composite T cell profile suggests an impaired ability to clear damaged cells or pathogens alongside an exaggerated inflammatory response, potentially contributing to immune exhaustion and disease progression. CD4+ T cells in cirrhosis show upregulation of activation and migratory markers like CD40LG and CXCR3 (Section 14), further supporting their pathogenic role.
Fibrogenesis and extracellular matrix (ECM) remodeling are inextricably linked to the activation of Hepatic stellate cells (HSCs) and Cholangiocytes, which transform into myofibroblast-like cells and undergo pathological proliferation (ductular reaction), respectively. Our data strongly supports this, showing HSCs in cirrhosis are enriched for pathways of ECM-receptor interaction, focal adhesion, and PI3K-Akt signaling (Section 15). Furthermore, HSCs in cirrhosis upregulate key surface markers like ENG (CD105), THY1 (CD90), PDGFRA, and TGFBR2, which are well-established drivers of fibrogenesis and cellular activation (Section 13). Cholangiocytes similarly show upregulation of markers related to proliferation (ERBB3, EFNA1), inflammation (HLA-DRB1), and altered adhesion (TSPANs, EMP2, PLXNB2) (Section 11), indicating their active contribution to disease. Conversely, healthy HSCs and Cholangiocytes express markers associated with quiescence and normal function (e.g., NGFR, CD9, SCTR), which are downregulated in cirrhosis.
Cell-cell interaction analysis reveals a profoundly altered communication network in cirrhotic livers (Section 9, 10). Macrophages emerge as central orchestrators, showing strong interactions with T cells, endothelial cells, and cholangiocytes. Highly prominent axes in cirrhosis include SPP1-integrin and FN1-integrin, indicating robust ECM remodeling and inflammatory signaling. APP-TREM2 interactions suggest specific macrophage activation. Chemokine (CCL3/CCL5-CCR5, CXCL12-CXCR4) and collagen-integrin α1β1 interactions are significantly upregulated, driving immune cell recruitment and sustained fibrogenesis. Angiogenesis is also suggested by VEGFA-FLT1/KDR signaling, particularly among endothelial cells. These interactions highlight the complex interplay between immune, stromal, and epithelial cells that fuels disease progression.
Metabolic reprogramming is a pervasive feature, with GSEA revealing a widespread downregulation of oxidative phosphorylation, fatty acid metabolism, and xenobiotic metabolism across multiple cell types in cirrhosis (Section 16). This indicates significant cellular stress and functional impairment, contributing to the overall decompensation of the cirrhotic liver.
In summary, this single-cell atlas provides a detailed molecular and cellular roadmap of human liver cirrhosis, revealing a dynamic interplay of inflammation, fibrosis, and metabolic dysregulation orchestrated by diverse cell types. The identified cell-type-specific pathological markers and activated intercellular communication pathways offer compelling evidence for the development of targeted therapeutic strategies.
Hypotheses:
- The sustained pro-inflammatory (M1-like) polarization of macrophages, characterized by increased expression of BSG, AXL, VCAM1, and IL13RA1, drives chronic inflammation and activates hepatic stellate cells, thereby accelerating liver fibrosis in cirrhosis.
- The combination of decreased cytotoxic T cells (T_Cyto) and increased regulatory (Treg) and pro-inflammatory (Th1, Th17, Th22) T cell subsets, alongside enhanced CD4+ T cell activation (CD40LG, CXCR3), collectively compromises anti-viral/anti-tumor immunity while perpetuating pathogenic inflammation and fibrogenesis.
- Activated Hepatic Stellate Cells (HSCs) in cirrhosis, characterized by upregulation of ENG, THY1, PDGFRA, and TGFBR2, interact with immune cells and the altered ECM via specific integrins and chemokine axes (e.g., collagen-integrin α1β1, CXCL12-CXCR4), forming a self-sustaining pro-fibrotic loop.
- Cholangiocytes in cirrhosis undergo pathological proliferation (ductular reaction) and acquire an inflammatory/migratory phenotype (upregulating ERBB3, EFNA1, HLA-DRB1), contributing to chronic inflammation and fibrosis, partly driven by altered gap junction communication (GJB1).
- Widespread downregulation of oxidative phosphorylation and fatty acid metabolism across multiple liver cell types contributes to cellular stress, impairs liver regeneration, and exacerbates inflammation and fibrogenesis in cirrhosis.
Potential therapeutic targets:
- SPP1-Integrin Axis (Macrophages, T cells, Endothelial cells, Cholangiocytes): SPP1 is a key driver of liver fibrosis, promoting cell adhesion, migration, survival, and immune modulation. Its robust activation with multiple integrins indicates a central role in perpetuating inflammation and fibrotic scar formation. Evidence: High significance and expression in CCI for cirrhosis (Section 9, 10); GeneCards and PubMed literature confirm its role in liver fibrosis. Validation: Block SPP1 production or integrin binding using antibodies or small molecule inhibitors in primary human liver cell co-cultures and preclinical models of liver fibrosis (e.g., CCl4, NASH models). Assess fibrosis markers, inflammation, and cellular activation.
- CCR5 (Macrophages, T cells, Endothelial cells): Part of the CCL3/CCL5-CCR5 chemokine axis, crucial for recruiting and activating various immune cells to inflammatory sites, driving chronic liver inflammation and fibrogenesis. Evidence: Elevated CCL3/CCL5-CCR5 interactions in cirrhosis (Section 10). Validation: Test the CCR5 inhibitor maraviroc (FDA-approved for HIV) in preclinical models of liver fibrosis to confirm reduction in immune cell infiltration, inflammation, and fibrogenic responses.
- CXCR4 (Hepatic stellate cells, Endothelial cells, Macrophages): The CXCL12-CXCR4 axis is highly active in cirrhosis, promoting HSC migration, proliferation, fibrogenic differentiation, immune cell recruitment, and neovascularization. Evidence: Strong CXCL12-CXCR4 interactions involving HSCs and other cell types in cirrhosis (Section 10). Validation: Evaluate CXCR4 antagonists (e.g., plerixafor) in liver fibrosis models to assess reduction in HSC activation, immune cell infiltration, and fibrosis burden.
- ERBB3 (Cholangiocytes): Upregulation in cirrhotic cholangiocytes points to enhanced proliferative and survival signaling, driving pathological cholangiocyte proliferation (ductular reaction) and subsequent fibrosis. Evidence: Significantly upregulated in cirrhotic cholangiocytes (Section 11); ERBB3 activation is implicated in promoting cell proliferation and survival in many cancers and fibrotic conditions. Validation: Test ERBB3 inhibitors (e.g., patritumab, small molecule kinase inhibitors) in cholangiocyte organoids or liver fibrosis models to reduce cholangiocyte proliferation and fibrosis.
- SCTR (Secretin Receptor) (Cholangiocytes): Significant downregulation in cirrhotic cholangiocytes indicates impaired normal bile duct physiology, contributing to cholestasis and liver injury. Restoring its function could improve bile flow. Evidence: Dramatically downregulated in cirrhotic cholangiocytes (Section 11); SCTR is crucial for normal cholangiocyte function (bicarbonate and fluid secretion). Validation: Administer secretin analogs or SCTR agonists in preclinical models of cholestatic liver disease or cirrhosis to assess improved bile flow, reduced liver injury, and potential support for cholangiocyte regeneration.
- AXL (Macrophages): Upregulated in cirrhotic macrophages, AXL signaling promotes pro-fibrotic activation, efferocytosis of damaged cells, and survival of HSCs, exacerbating fibrosis and inflammation. Evidence: Highly expressed in cirrhotic macrophages (Section 12); GeneCards and PubMed literature support its role in fibrosis. Validation: Test AXL inhibitors (in clinical trials for oncology) in liver fibrosis models to modulate macrophage activation, reduce HSC survival, and dampen fibrosis.
- VCAM1 (Macrophages): Upregulated on cirrhotic macrophages, VCAM1 enhances recruitment of immune cells into inflamed liver tissue, contributing to sustained inflammation and progressive fibrosis. Evidence: Substantial upregulation in cirrhotic macrophages (Section 12); VCAM1 is crucial for leukocyte trafficking. Validation: Block VCAM1-mediated interactions using anti-VCAM1 antibodies or antagonists of its ligand (VLA-4) in liver fibrosis models to assess reduction in inflammatory cell infiltration and fibrosis progression.
- ENG (Endoglin/CD105) (Hepatic stellate cells): A coreceptor for TGF-β, crucial for its pro-fibrogenic signaling. Its upregulation on activated HSCs promotes fibrogenesis and vascular remodeling. Evidence: Highly upregulated on cirrhotic HSCs (Section 13); well-established marker for fibrosis and a key component of TGF-β signaling. Validation: Use ENG-blocking antibodies or inhibitors of TGF-β signaling in liver fibrosis models to attenuate HSC activation, ECM deposition, and vascular changes.
- PDGFRA (Platelet-Derived Growth Factor Receptor Alpha) (Hepatic stellate cells): A receptor tyrosine kinase driving HSC proliferation and migration, key processes in fibrogenesis. Evidence: High PDGFRA expression on activated HSCs in cirrhosis (Section 13); PDGF is a potent mitogen and chemoattractant for HSCs. Validation: Repurpose PDGFRA inhibitors (e.g., imatinib, nintedanib) from other fibrotic diseases for liver fibrosis models to reduce HSC proliferation and fibrogenesis.
- CD40LG (CD40 Ligand / CD154) (CD4+ T cells): A critical co-stimulatory molecule on activated T cells, promoting chronic inflammation, B cell activation, and fibrogenesis via the CD40-CD40LG axis. Evidence: Consistently high expression on CD4+ T cells in cirrhotic samples (Section 14); pivotal in chronic inflammation and fibrogenesis. Validation: Investigate anti-CD40LG antibodies (explored in autoimmune conditions) in liver fibrosis models to dampen T cell-mediated immune activation, B cell responses, and fibrogenic pathways.
Follow-up validation ideas:
- Isolate primary human liver macrophages from cirrhotic and healthy samples, culture them, and treat with inhibitors targeting BSG, AXL, VCAM1, or IL13RA1. Measure M1/M2 markers, pro-fibrotic cytokine secretion (e.g., TGF-β, TNF-α), and their effect on co-cultured HSC activation/collagen production.
- Utilize liver fibrosis mouse models (e.g., CCl4-induced, NASH models). Administer antibodies blocking CD40LG or CXCR3, or adoptive transfer of specific T cell subsets. Assess liver fibrosis markers, inflammation, and T cell composition/function by flow cytometry or scRNA-seq.
- Employ in vitro and in vivo models to test inhibitors of ENG, PDGFRA, or TGFBR2, or agents disrupting collagen-integrin α1β1 interactions (e.g., integrin blocking antibodies). Measure HSC proliferation, activation markers (alpha-SMA), and collagen deposition.
- Establish primary human cirrhotic cholangiocyte cultures or use 3D organoid models. Test ERBB3 or EFNA1 inhibitors for their effect on cholangiocyte proliferation, migration, and secretion of pro-fibrotic factors. Investigate the impact of SCTR agonists on bile secretion and differentiation.
- Use animal models of cirrhosis to assess the impact of metabolic modulators (e.g., fatty acid oxidation enhancers, mitochondrial function improvers) on liver pathology, inflammation, and fibrosis progression.
Limitations:
The current study, based on single-cell RNA sequencing data, has several limitations. Firstly, single-cell dissociation can induce stress responses or alter cell proportions, potentially affecting the observed transcriptomic profiles and cell counts. Secondly, scRNA-seq inherently provides a static snapshot of the disease, and longitudinal studies would be needed to understand the dynamic progression of cellular changes in cirrhosis. While cell-cell interaction inference provides valuable hypotheses, it is computationally derived and requires experimental validation (e.g., using spatial transcriptomics or functional co-culture assays) to confirm direct physical interactions and their functional consequences. The dataset's focus on 'cirrhosis' and 'healthy' conditions provides a strong comparison, but future studies could benefit from including intermediate stages of liver fibrosis to capture a more complete disease spectrum. Finally, while human samples offer direct clinical relevance, the lack of immediate functional validation for many of the identified targets means that their therapeutic potential remains hypothetical and requires extensive preclinical and clinical development.
18. Query List
- Show and save UMAPs for condition, sample, major cell type, minor cell type, and celltype_subset in two columns.
- Show major cell type scores on UMAP and save the result.
- Show and save a marker expression dot plot for celltype_subset. SET target_cell = None and var_group_rotation = 45. Leave all other arguments at their default values.
- Show and save a population bar plot of minor cell types.
- Show and save a population bar plot of T cell subsets.
- Show and save box plots of T cell subset populations with statistically significant differences between conditions, if any. Choose ncols based on the total number of panels.
- Show and save a population bar plot of macrophage subsets.
- Show and save box plots of macrophage subset populations with statistically significant differences between conditions, if any. Choose ncols based on the total number of panels.
- Show and save cell-cell interaction patterns. Select at most 80 cell-cell interactions per group.
- Find cell-cell interactions involving major immune and stromal cells that differ significantly between conditions, show them as a dot plot, and save the result. Set max_n_items_per_group to 60. For each interaction identified under each condition, using the provided dataset context, describe the associated signaling pathways and mechanisms and, where relevant, its potential as a therapeutic target and related therapeutic agents.
- Show marker expressions for Cholangiocyte in a dot plot, and save the result. Use only surfaceome markers, with at most 50 markers per condition. For each marker identified under each condition, using the provided dataset context, describe the associated signaling pathways and biological mechanisms within the tissue and, where relevant, its potential as a therapeutic target for Cirrhosis and related therapeutic agents.
- Show marker expressions for Macrophage in a dot plot, and save the result. Use only surfaceome markers, with at most 40 markers per condition. For each marker identified under each condition, using the provided dataset context, describe the associated signaling pathways and biological mechanisms within the tissue and, where relevant, its potential as a therapeutic target for Cirrhosis and related therapeutic agents.
- Show marker expressions for Hepatic stellate cell in a dot plot, and save the result. Use only surfaceome markers, with at most 40 markers per condition. For each marker identified under each condition, using the provided dataset context, describe the associated signaling pathways and biological mechanisms within the tissue and, where relevant, its potential as a therapeutic target for Cirrhosis and related therapeutic agents.
- Show marker expressions for T cell CD4+ in a dot plot, and save the result. Use only surfaceome markers, with at most 40 markers per condition. For each marker identified under each condition, using the provided dataset context, describe the associated signaling pathways and biological mechanisms within the tissue and, where relevant, its potential as a therapeutic target for Cirrhosis and related therapeutic agents.
- Show Gene Ontology (GSA) analysis results for Hepatic stellate cell as a bar plot, and save the result.
- Show Gene Set Enrichment Analysis results as a dot plot, and save it. Set the color map to RdBu_r, n_pws_to_show to 120, and target_cells to None.