Single-Cell Landscape of Progressive Non-alcoholic Fatty Liver Disease and NASH Cirrhosis Reveals Distinct Cellular and Molecular Remodeling
This single-cell analysis reveals a profound shift in cellular composition, cell-cell communication, and pathway activity during the progression of NAFLD to NASH cirrhosis and end-stage disease. Key findings include a decrease in hepatocyte proportions, an expansion of fibrogenic and inflammatory cell populations like hepatic stellate cells and macrophages, and the activation of pro-fibrotic and pro-inflammatory signaling pathways. These changes highlight a distinct immune and metabolic dysregulation driving advanced liver pathology.
Contents
- Dataset overview
- UMAP Visualization of Liver Single-Cell RNA-seq Data
- Major Cell Type Score UMAP Visualization and Annotation Review
- Hepatocyte Condition-Specific Surface Marker Analysis
- Liver Minor Cell Type Population Analysis Across NAFLD Progression
- T 세포 및 관련 면역 세포 아형의 간 질환별 변화 분석
- Changes in Lymphocyte Subset Proportions Across Liver Disease Conditions
- Macrophage Subset Population Dynamics in Liver Disease Progression
- Macrophage (M2B) Population Dynamics in Liver Disease Progression
- Healthy Liver Cell-Cell Interaction Landscape
- Condition-Specific Cell-Cell Interaction Patterns in Liver Immune and Stromal Cells
- Macrophage Condition-Specific Surfaceome Markers in Liver Disease
- Sub-population Specific Surfaceome Markers for T cell CD4+ in NASH Cirrhosis
- Gene Set Enrichment Analysis (GSEA) of Liver Cell Types Across Disease Conditions
- Discussion
- Query List
0. Dataset overview
Dataset Summary
데이터 종류: SCODA로 처리된 단일 세포 RNA-seq 데이터 (AnnData 형식)
세포 및 유전자 수: 99,640개 세포와 29,269개 유전자
종: 인간 (human)
조직: 간 (Liver)
- 관찰(obs) 컬럼: 샘플, 조건, 조직, 질병 상태, 환자 ID, 성별, 나이, 세포 타입 등 다양한 메타데이터 포함
조건: nash_cirrhosis, nafld, healthy, end_stage_nafld
- 주요 세포 타입 (celltype_major): 간 상피세포, 내피세포, T 세포, 골수세포, 기질세포, B 세포 등
- 세부 세포 타입 (celltype_minor): 간세포, 내피세포, NK 세포, 대식세포, 간성상세포, 형질세포, CD4+ T 세포, B 세포, 수지상세포 등
- 가장 세부적인 세포 타입 (celltype_subset): 간세포, NK 세포, 다양한 대식세포 아형, 다양한 T 세포 아형, 다양한 B 세포 아형 등
주요 사전 계산된 분석 결과
- 세포-세포 상호작용 (CCI): 조건별, 샘플별 CellPhoneDB 결과 (uns['CCI'], uns['CCI_sample'])
- 차등 발현 유전자 (DEG): 각 celltype_minor에서 조건 대 나머지 또는 조건 대 'healthy' 참조 조건 비교 결과 (uns['DEG'], uns['DEG_vs_ref'])
- 유전자 세트 농축 분석 (GSEA): 각 celltype_minor에서 조건 대 나머지 또는 조건 대 'healthy' 참조 조건 비교 결과 (uns['GSEA'], uns['GSEA_vs_ref'])
- 유전자 온톨로지 (GO) / 유전자 세트 분석 (GSA): 각 celltype_minor에서 조건 대 나머지 또는 조건 대 'healthy' 참조 조건 비교 결과 (uns['GSA_up'], uns['GSA_vs_ref_up'])
1. UMAP Visualization of Liver Single-Cell RNA-seq Data
[Analysis Visualization Results]...
Analysis Overview
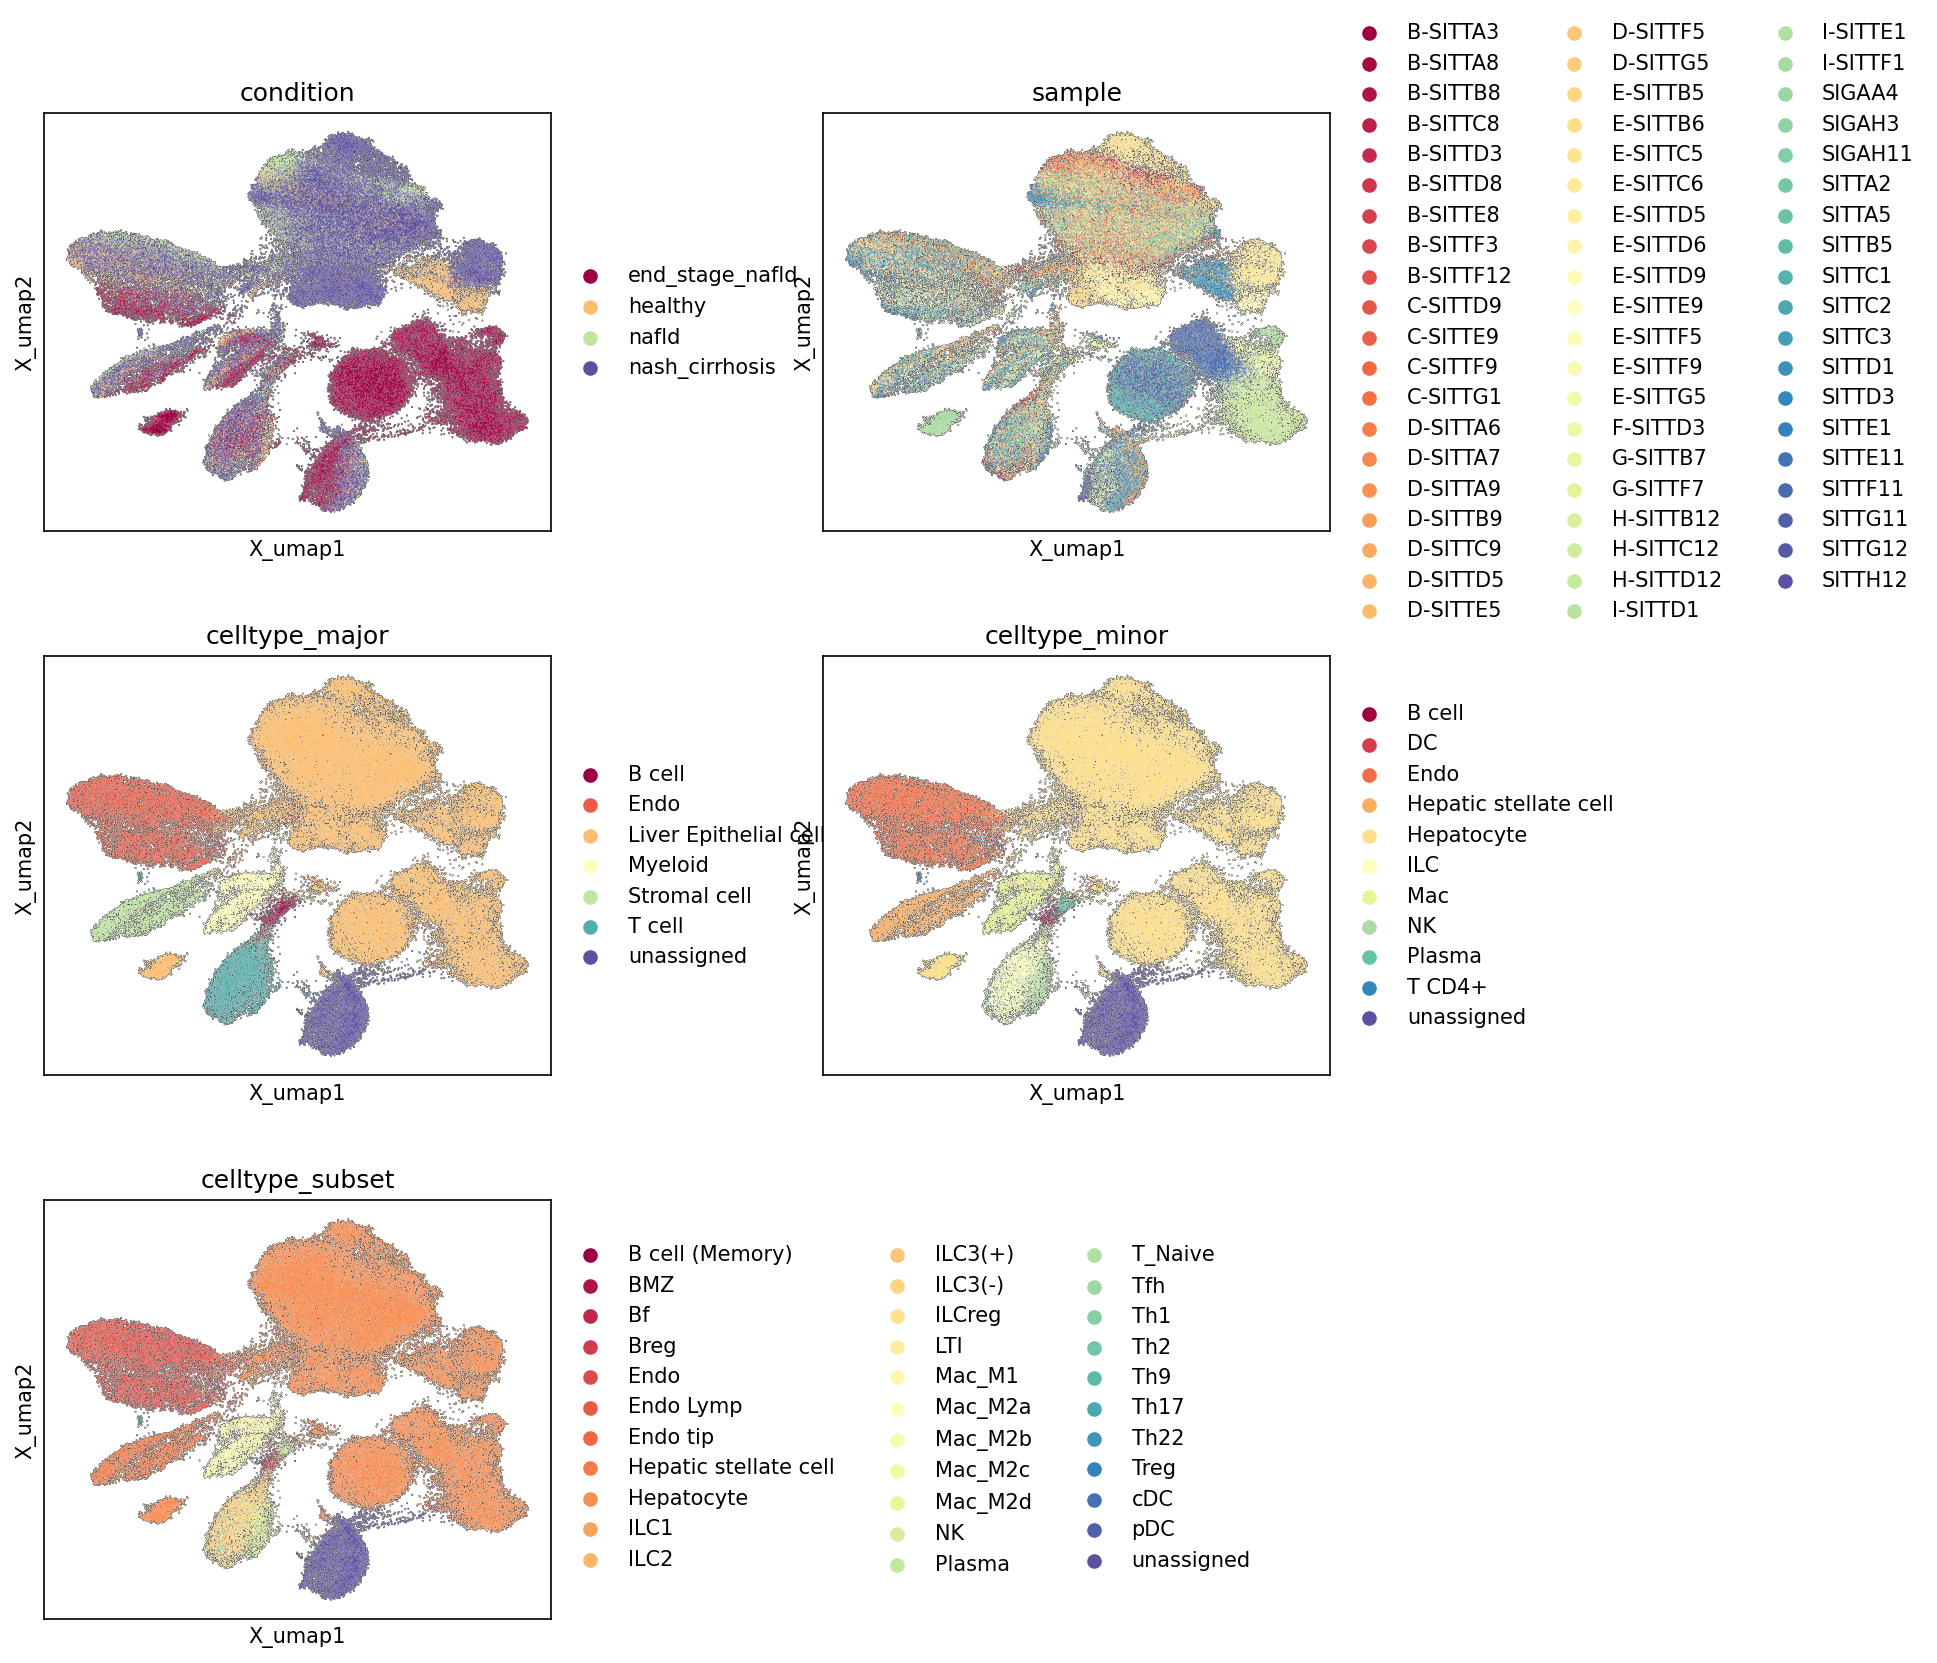
This analysis provides a UMAP (Uniform Manifold Approximation and Projection) visualization of single-cell RNA-seq data from human liver tissue, encompassing nearly 100,000 cells and over 29,000 genes. The UMAPs are colored by various metadata features: condition, sample, celltype_major, celltype_minor, and celltype_subset. This visualization is crucial for understanding the overall data structure, assessing cell type annotation quality, identifying potential batch effects, and observing how different conditions or samples distribute across the cellular landscape.
Visual Summary
The UMAP plots display the high-dimensional gene expression data in a two-dimensional space, where cells with similar expression profiles cluster together.
Condition
The condition UMAP shows clear separation between disease states. Healthy cells (light orange) primarily form distinct clusters, suggesting a unique transcriptional profile compared to diseased states. Cells from "end_stage_nafld" (dark red) and "nash_cirrhosis" (dark purple) largely overlap and form several prominent, interconnected clusters, indicating shared transcriptional signatures and potentially similar cellular compositions or states in advanced liver disease. "NAFLD" cells (light green) show more heterogeneity, partially overlapping with healthy clusters but also extending into regions associated with more severe disease, reflecting its intermediate position in disease progression.
Sample
The sample UMAP displays a large number of individual samples across the dataset. While some areas show enrichment for specific samples (indicated by distinct color patches), there is a good degree of intermixing of cells from different samples throughout many of the UMAP clusters. This suggests that the data integration process has been largely effective in mitigating major batch effects, allowing biological variability (like cell type or disease state) to drive the clustering more than sample-specific technical variations. However, some minor localized sample-specific clusters might warrant further investigation.
Celltype_major
The celltype_major UMAP reveals well-defined and distinct clusters for the broad cell types in the liver. "Liver Epithelial cell" (light orange), primarily hepatocytes, forms the largest and most prominent cluster, consistent with their high abundance in the liver. "Endothelial cell" (red-orange) and "Myeloid cell" (light green) also form substantial, relatively separated clusters. "T cell" (light blue), "B cell" (dark red), and "Stromal cell" (teal) occupy smaller but distinct regions. The "unassigned" cells (dark purple) appear to be somewhat scattered but also form a small, distinct cluster, suggesting a population whose identity couldn't be confidently assigned at this major level.
Celltype_minor
The celltype_minor UMAP provides a finer resolution of cell types, largely maintaining the structure seen in celltype_major. Hepatocytes (light orange) remain the dominant population. Within the broad "Endothelial cell" region, there is still a contiguous cluster, suggesting a general endothelial identity. "Macrophage" (light green) and "T cell CD4+" (light blue) form distinct, well-separated clusters, indicating successful sub-classification of immune cells. Other minor populations like "Hepatic stellate cell" (orange), "Plasma cell" (teal), "NK cell" (green), "DC" (red), and "ILC" (yellow) also form discernible clusters, validating the sub-clustering. The "unassigned" cells (dark purple) again form a noticeable, somewhat diffuse cluster, often situated between other defined populations.
Celltype_subset
The celltype_subset UMAP presents the highest resolution of cell types. This level further refines the populations seen in celltype_minor. For instance, "Hepatocyte" (light orange) is still dominant. Within immune cell clusters, specific T cell subsets like "T cell (Th1)", "T cell (Th17)", "T cell (Treg)", and "T cell (Naive)" (various shades of green/blue) are discernible, as are different macrophage populations (e.g., "Macrophage (M1)", "Macrophage (M2a, M2b, M2c, M2d)" - shades of yellow/light green). B cell subsets like "B cell (Memory)", "B cell (Follicular)", and "Breg" (darker reds) also show some distinction. The clear separation of these fine-grained cell types on the UMAP indicates robust and meaningful sub-clustering. The "unassigned" population (dark purple) at this level is still present, often forming small, potentially heterogeneous groups or being interspersed among other cells.
Biological Interpretation
The UMAP visualizations provide several key biological insights into the liver disease progression:
- Disease Progression Signature: The distinct clustering of healthy cells versus advanced disease states (end-stage NAFLD and NASH cirrhosis) highlights a profound shift in cellular transcriptional profiles associated with progressive liver disease. The intermediate position and heterogeneity of NAFLD cells suggest a continuum of pathological changes. This aligns with the understanding that NAFLD progresses through stages of steatosis, inflammation (NASH), fibrosis, and ultimately cirrhosis [PubMed search: NAFLD NASH progression].
- Cell Type Specificity: The robust clustering and clear separation of major, minor, and subset cell types confirm the successful identification and annotation of diverse cell populations within the human liver. The large "Hepatocyte" population, as expected, dominates the landscape, while the presence of various immune cells (T cells, B cells, Macrophages, NK cells, ILCs), endothelial cells, and stromal cells (hepatic stellate cells) reflects the complex multicellular environment of the liver and its immune surveillance functions.
- Immune Cell Heterogeneity in Disease: The detailed celltype_subset UMAP demonstrates the fine-grained diversity of immune cells, including different macrophage polarization states (M1, M2 subtypes) and T helper cell subsets (Th1, Th2, Th17, Treg). This granular resolution is critical for understanding the specific roles these immune cell subsets play in the inflammation, fibrosis, and immune dysregulation characteristic of NAFLD and NASH [GeneCards: CD68 (macrophage marker), CD3D (T-cell marker)]. Changes in the proportions or activation states of these specific immune cell subsets are often central to liver disease pathogenesis.
- Stromal Cell Dynamics: The clear identification of "Hepatic stellate cells" as a distinct population is important, as these cells are central mediators of liver fibrosis in chronic liver diseases like NASH [UniProt: P99999 (collagen type I alpha 1)].
- Potential for Further Discovery: The presence of "unassigned" cells, even at the celltype_subset level, suggests either populations that could not be clearly matched to known markers or potentially novel/rare cell states that warrant further investigation. If these unassigned cells form coherent clusters, they might represent unique transitional states or previously uncharacterized cell types relevant to liver biology or pathology.
Annotation Notes
The UMAPs demonstrate high-quality cell type annotation, as evidenced by the distinct and biologically meaningful separation of cell populations across all levels (major, minor, subset). The relatively low level of sample-specific clustering on the sample UMAP indicates effective data integration, enhancing confidence that the observed cell type and condition-specific patterns are driven by biological differences rather than technical artifacts. However, the persistent "unassigned" populations across cell type levels suggest areas where further refinement of annotation or identification of novel cell states could be explored.
2. Major Cell Type Score UMAP Visualization and Annotation Review
[Analysis Visualization Results]...
Analysis Overview
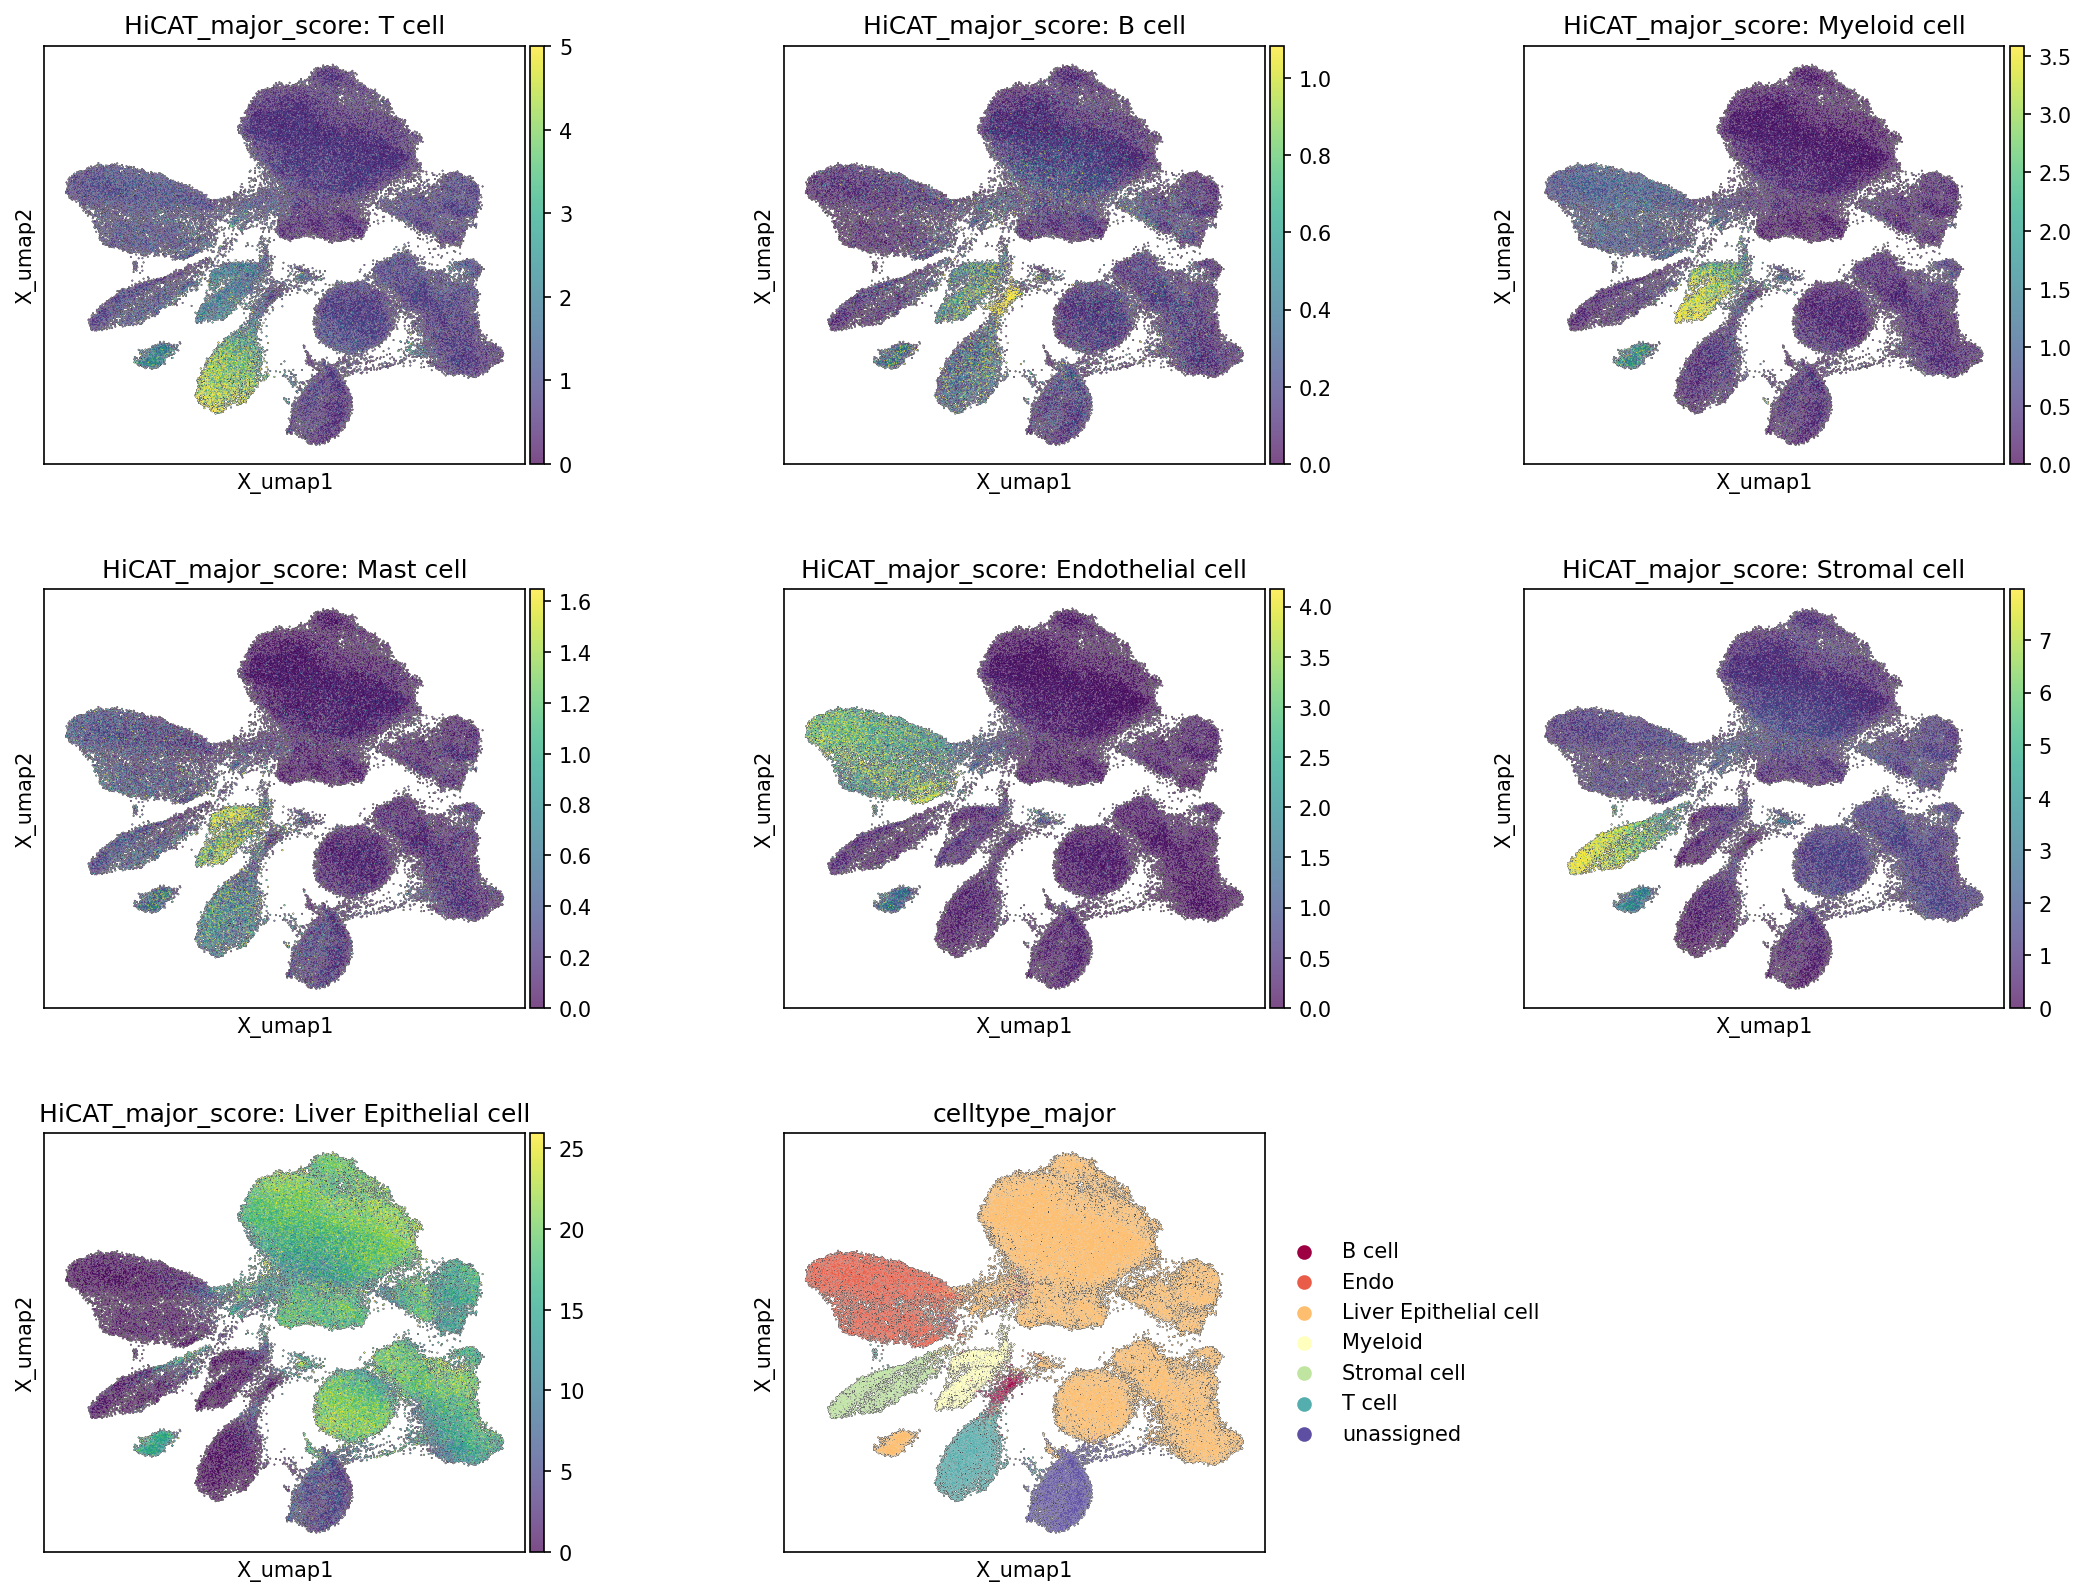
This analysis visualizes the transcriptional scores for major cell types on a UMAP embedding, alongside the final celltype_major annotations. The primary goal is to assess the spatial organization of different cell populations and validate the quality and consistency of the major cell type assignments within the single-cell RNA-seq data from human liver. This helps confirm that cells assigned to a specific major cell type indeed exhibit high transcriptional similarity to that cell type's signature.
Visual Summary
The UMAP embedding displays distinct clusters representing various cell populations present in the human liver. The individual plots showing HiCAT_major_score for each cell type highlight regions with high transcriptional similarity to that specific cell type's signature (indicated by yellow/green coloration).
- Liver Epithelial cells (likely hepatocytes) form the largest and most prominent cluster, primarily occupying the upper-right and central regions of the UMAP, with very high scores (up to 25), reflecting their abundance in liver tissue.
- Endothelial cells show a distinct and well-separated cluster in the upper-left part of the UMAP.
- Stromal cells form another well-defined cluster, located in the mid-left region, separate from epithelial and immune compartments.
- Immune cells (T cell, B cell, Myeloid cell) generally cluster together but also show clear separation into distinct sub-clusters within the broader immune space. T cells are concentrated in a cluster in the lower-left, B cells form a smaller, more compact cluster above the T cells, and Myeloid cells occupy a central-right region, distinct from the other immune populations.
- Mast cells also show a region of high score, though this population appears to be very small and somewhat diffuse, suggesting a rare cell type. Notably, "Mast cell" is not listed as a celltype_major category.
- The final celltype_major UMAP plot, which categorizes cells by their assigned major type, shows a strong visual concordance with the high-scoring regions of the individual cell type score plots. Clusters are distinctly colored according to their major annotation, with minimal intermixing of colors in high-score regions.
- A small unassigned cluster is visible in the celltype_major plot, indicating cells that did not clearly align with any of the defined major categories.
Biological Interpretation
- Robust Cell Type Annotation: The strong correlation between high major cell type scores and the distinct categorical assignments in the celltype_major UMAP indicates a high quality and robustness of the cell type annotations. Each major cell type forms transcriptionally coherent and spatially distinct clusters, providing confidence in the cell identity assignments.
- Expected Liver Cellular Composition: The dominance of "Liver Epithelial cell" (representing hepatocytes and potentially cholangiocytes) is biologically expected, as these are the most abundant parenchymal cells in the liver. The presence of significant populations of Endothelial cells (e.g., LSECs), Stromal cells (e.g., hepatic stellate cells, fibroblasts), and various immune cells (T cells, B cells, Myeloid cells like Kupffer cells and macrophages) reflects the complex cellular ecosystem of the human liver, crucial for its diverse functions and responses to disease [1].
- Immune Cell Compartmentalization: The clear separation of T cells, B cells, and Myeloid cells underscores the distinct functional roles and transcriptional profiles of different immune cell subsets within the liver microenvironment.
- Unassigned Population and Subtype Resolution: The presence of an 'unassigned' cluster, while small, suggests a population that might require further investigation. These could be doublets, cells in transitional states, or rare cell types not adequately captured by the current major cell type signatures. The 'Mast cell' score plot further highlights this. While Mast cells are present in the liver and play roles in inflammation and fibrosis [2], their absence as a distinct celltype_major category suggests they are either a very rare population absorbed into a broader category (e.g., Myeloid) or are part of the unassigned group. Further analysis at celltype_minor or celltype_subset levels would be necessary to resolve such rare or less-defined populations.
Annotation Notes
The visualization of major cell type scores on the UMAP provides strong evidence for the quality and clarity of the major cell type annotations. The distinct clustering and high confidence scores across most major cell populations suggest accurate assignment. The 'unassigned' cluster is relatively small, indicating that a large proportion of cells have been successfully classified. The presence of a Mast cell score plot without a corresponding celltype_major category indicates an area for potential future refinement, possibly by integrating such rare populations into more granular annotations.
---
References:
- Liver Cell Diversity: Review articles on liver cell biology and single-cell atlas projects.
- PubMed search: "single cell RNA-seq liver cell types"
- Mast Cells in Liver: Information on mast cells in liver pathology.
- PubMed search: "mast cells liver fibrosis inflammation"
3. Hepatocyte Condition-Specific Surface Marker Analysis
[Analysis Visualization Results]...
Analysis Overview
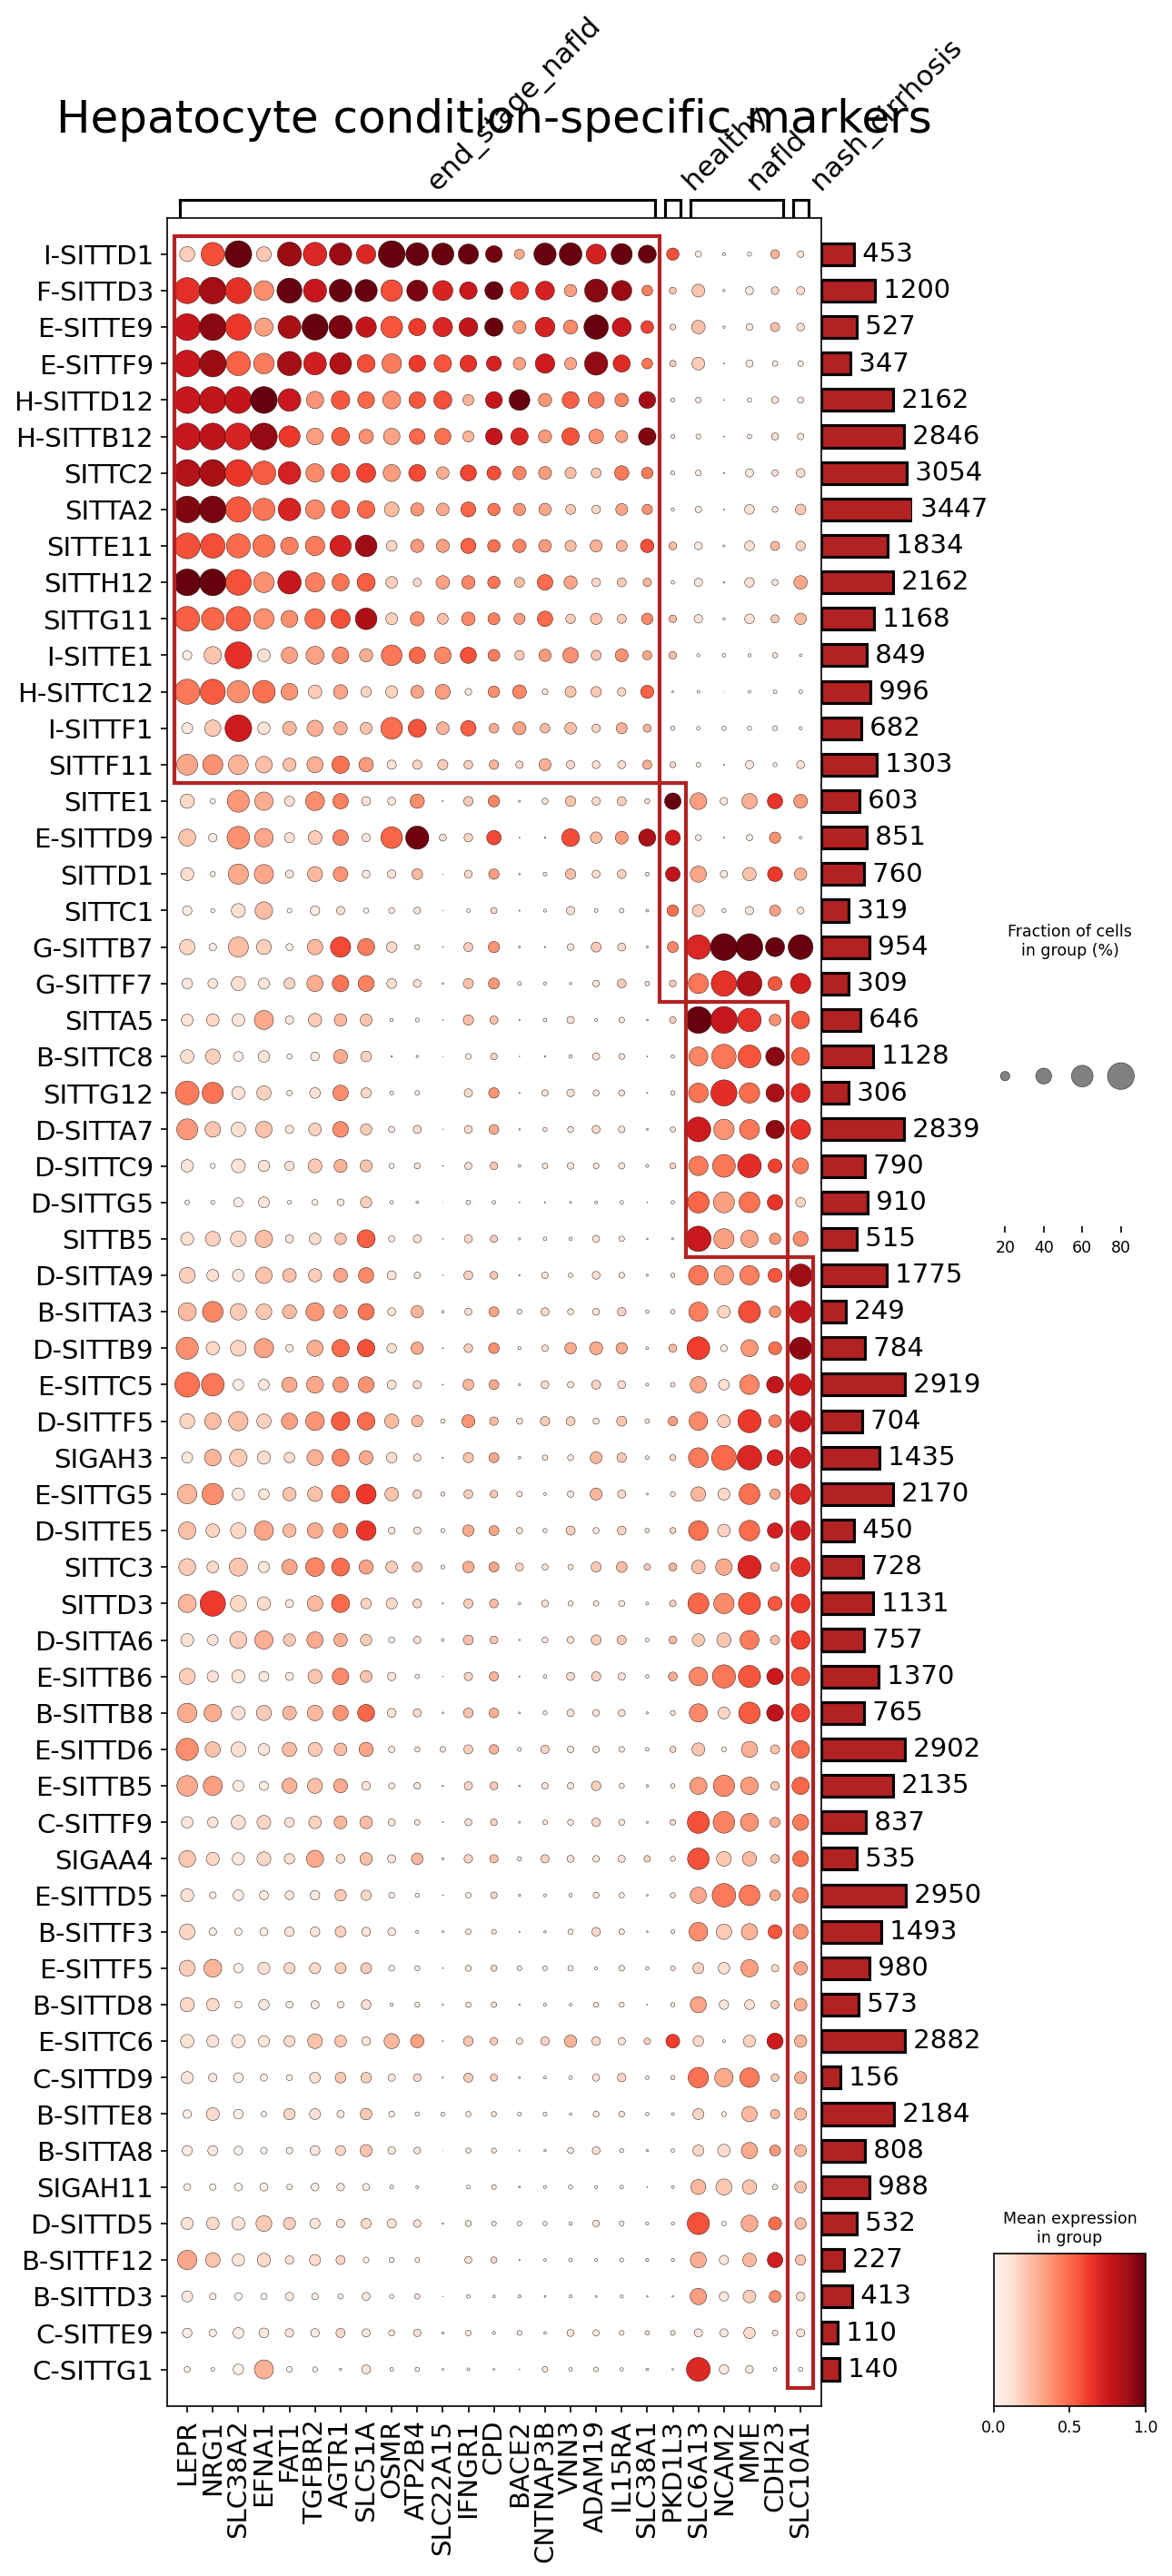
This analysis visualizes the expression of condition-specific markers within the Hepatocyte cell population. The plot_markers_and_expression_dot tool was used with target_cell='Hepatocyte', focusing on genes identified as markers for this specific cell type. The analysis was configured to find surfaceome_only markers, meaning the genes displayed encode proteins primarily located on the cell surface.
The dot plot displays:
- X-axis: Individual genes (markers) identified as important for Hepatocytes.
- Y-axis: Different sub-clusters within the Hepatocyte population (e.g., I-SITTD1, F-SITTD3, etc.), which are likely derived from the cluster annotation in the AnnData.
- Columns: The four distinct conditions: end_stage_nafld, healthy, nafld, and nash_cirrhosis.
- Dot size: Represents the fraction of cells within a given Hepatocyte sub-cluster (row) and condition (column) that express the specific gene (x-axis).
- Dot color intensity: Indicates the mean expression level of the gene in those expressing cells, ranging from low (light red) to high (dark red).
- Bar chart on the right: Shows the total number of cells contributing to each Hepatocyte sub-cluster.
- Red boxes: Highlight groups of genes or Hepatocyte sub-clusters with similar expression patterns.
Visual Summary
The dot plot reveals clear condition-specific expression patterns of surface markers within various Hepatocyte sub-clusters, primarily distinguishing advanced disease stages from earlier stages or healthy conditions.
- End-stage NAFLD-Specific Hepatocyte Markers: A prominent group of genes (enclosed in the top red box) including LEPR, NRG1, SLC38A2, EFNA1, FAT1, FGFR2, AGTR1, SLC51A, OSMR, ATP2B4, SLC22A15, IFNGR1, CPD, BACE2, CNTNAP3B, VNN3, ADAM19 shows significantly high expression and prevalence in a distinct set of Hepatocyte sub-clusters (e.g., I-SITTD1, F-SITTD3, E-SITTE9, H-SITTD12) almost exclusively within the end_stage_nafld condition. Their expression is minimal or absent in healthy, nafld, and nash_cirrhosis conditions for these specific sub-clusters.
- NASH Cirrhosis-Specific Hepatocyte Markers: Another cluster of genes (enclosed in the bottom red box) such as IL15RA, SLC38A1, PKD1L3, SLC6A13, NCAM2, MME, CDH23, SLC10A1 displays strong enrichment in a different, larger set of Hepatocyte sub-clusters (e.g., E-SITTD9, SITTD1, D-SITTA7, E-SITTG5) primarily in the nash_cirrhosis condition. Some of these markers also show moderate expression in the nafld condition in certain sub-clusters, suggesting a continuum of expression during disease progression.
- Healthy/NAFLD Markers: Within this selected set of markers, there are no clearly defined genes that are specifically upregulated in the healthy or nafld conditions compared to the advanced disease states. This suggests that the identified markers are predominantly associated with the pathological changes occurring in end-stage NAFLD and NASH cirrhosis.
- Hepatocyte Sub-cluster Heterogeneity: The y-axis shows considerable heterogeneity among Hepatocyte sub-clusters in terms of marker expression patterns. The bar chart on the right indicates varying cell numbers per sub-cluster, with some (e.g., D-SITTA7, E-SITTD9) being quite numerous.
Biological Interpretation
The analysis highlights the emergence of distinct Hepatocyte states characterized by unique surface marker expression profiles during the progression of non-alcoholic fatty liver disease (NAFLD) to advanced stages like end-stage NAFLD and NASH cirrhosis. The fact that these are surfaceome_only markers is particularly important for their functional and translational relevance.
- End-stage NAFLD-Associated Hepatocyte Phenotypes: The cluster of genes specific to end-stage NAFLD suggests a profound reprogramming of Hepatocytes.
- LEPR (Leptin Receptor) and IFNGR1 (Interferon Gamma Receptor 1) are key players in inflammation and metabolic regulation. Their upregulation indicates altered inflammatory signaling and metabolic dysregulation, potentially driving fibrosis and disease progression in severe NAFLD. GeneCards: LEPR GeneCards: IFNGR1
- SLC38A2 (Sodium-coupled neutral amino acid transporter 2) points to altered amino acid transport and metabolic adaptation within these diseased Hepatocytes. GeneCards: SLC38A2
- BACE2 (Beta-secretase 2), while known in neuroscience, has emerging roles in metabolism and inflammation, warranting further investigation in liver pathology. PubMed: BACE2 in metabolic disease
- NASH Cirrhosis-Associated Hepatocyte Phenotypes: The markers enriched in NASH cirrhosis reveal another distinct set of pathological adaptations.
- SLC10A1 (Sodium/bile acid cotransporter, NTCP) is a critical bile acid uptake transporter in Hepatocytes. Its altered expression likely signifies dysregulated bile acid homeostasis, a hallmark of cholestasis and liver injury in cirrhosis. GeneCards: SLC10A1
- IL15RA (Interleukin 15 Receptor Alpha) suggests altered immune crosstalk, potentially impacting resident immune cells and perpetuating inflammation in the cirrhotic liver. GeneCards: IL15RA
- NCAM2 (Neural Cell Adhesion Molecule 2) and CDH23 (Cadherin-related 23) are cell adhesion molecules. Their differential expression suggests significant remodeling of cell-cell interactions and tissue architecture, consistent with the extensive fibrosis and structural changes characteristic of cirrhosis. GeneCards: NCAM2 GeneCards: CDH23
Clinical or Translational Implications
The identification of condition-specific surface markers within Hepatocyte sub-clusters has significant clinical and translational potential.
- Diagnostic and Prognostic Biomarkers: The distinct expression profiles of surface markers could serve as highly specific diagnostic or prognostic indicators for stratifying NAFLD patients into different disease stages, particularly distinguishing end-stage NAFLD and NASH cirrhosis. These surface markers are more accessible for detection in circulating cells, exosomes, or biopsy samples.
- Therapeutic Targets: Since these markers are surface proteins, they represent excellent candidates for targeted therapeutic interventions.
- For instance, strategies to modulate the activity of LEPR or IFNGR1 in end-stage NAFLD Hepatocytes could offer avenues to reduce inflammation and fibrosis.
- Targeting SLC10A1 or other transporters could help in managing metabolic dysfunction and cholestasis in NASH cirrhosis.
- Interfering with adhesion molecules like NCAM2 or CDH23 could potentially attenuate fibrotic remodeling.
- Understanding Disease Pathogenesis: These markers provide deeper insights into the specific molecular mechanisms driving disease progression in Hepatocytes at different stages of NAFLD/NASH. This knowledge can guide the development of stage-specific therapies.
- Drug Development: The identified surface markers can inform rational drug design, focusing on developing antibodies, receptor antagonists/agonists, or small molecules that specifically target these proteins in diseased Hepatocytes, potentially minimizing off-target effects.
- Experimental Validation: The findings warrant further experimental validation in preclinical models and human studies to confirm the functional relevance of these markers in NAFLD progression and their utility as therapeutic targets.
4. Liver Minor Cell Type Population Analysis Across NAFLD Progression
[Analysis Visualization Results]...
Analysis Overview
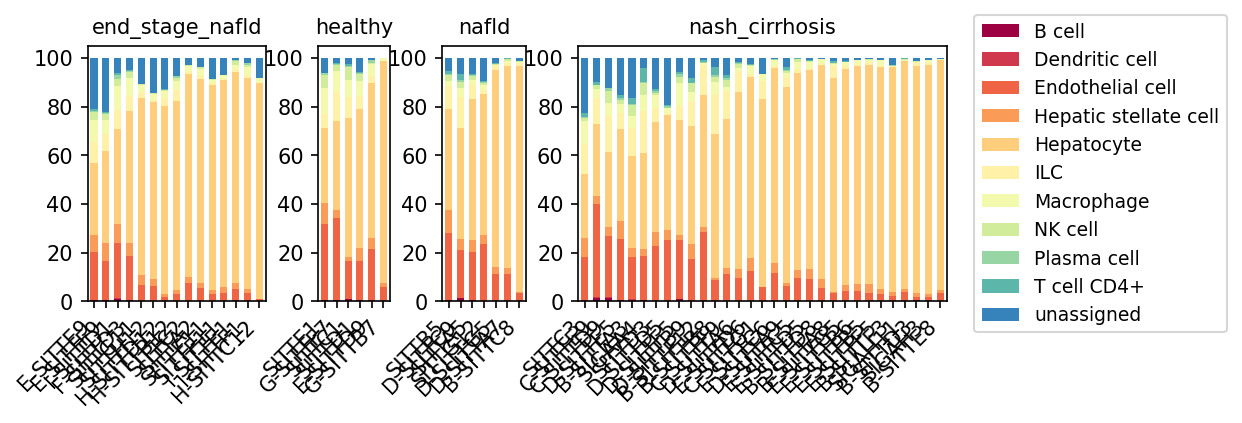
This analysis presents the relative proportions of minor cell types within individual liver samples, categorized by their disease condition: healthy, NAFLD, NASH cirrhosis, and end-stage NAFLD. The goal is to observe shifts in cellular composition across the progression of non-alcoholic fatty liver disease (NAFLD) to more severe stages like non-alcoholic steatohepatitis (NASH) and cirrhosis.
Visual Summary
The stacked bar plots illustrate the percentage distribution of 11 minor cell types across numerous samples for each of the four conditions.
- Healthy and NAFLD conditions: These conditions generally exhibit a very similar cellular landscape, predominantly characterized by a high proportion of Hepatocytes (light orange, typically >80-90% of total cells). Other cell types such as Endothelial cells (red-orange), Hepatic stellate cells (orange), and various immune cells (e.g., Macrophages - light yellow, T cell CD4+ - teal) are present in small, relatively consistent proportions. The "unassigned" population (blue) is minimal.
- NASH_cirrhosis condition: A distinct shift in cellular composition is evident. The proportion of Hepatocytes is noticeably reduced across most samples, often falling below 80% and in some instances even below 60%. Concurrently, there is a clear expansion of non-parenchymal cells. Notably, Hepatic stellate cells and Endothelial cells show increased proportions, as do various immune cell types, including Macrophages and T cell CD4+. The "unassigned" population also appears to slightly increase in some samples.
- End_stage_NAFLD condition: This condition shows the most dramatic alterations, largely mirroring and in some cases exceeding the trends observed in NASH_cirrhosis. Hepatocyte proportions are further diminished, reflecting severe parenchymal loss. There is a prominent increase in fibrogenic cells like Hepatic stellate cells, and vascular cells like Endothelial cells. Immune cell populations, particularly Macrophages and T cell CD4+, are also markedly elevated, indicative of chronic inflammation and immune activation characteristic of advanced liver disease.
Biological Interpretation
The observed shifts in minor cell type populations provide strong biological insights into the progression of NAFLD to advanced liver disease.
- Hepatocyte Loss and Impaired Regeneration: The progressive decrease in Hepatocyte proportions from healthy/NAFLD to NASH_cirrhosis and end-stage NAFLD reflects ongoing liver injury, hepatocyte death, and impaired regenerative capacity, which are hallmarks of chronic liver disease leading to fibrosis and cirrhosis [1].
- Fibrogenesis driven by Hepatic Stellate Cells: The notable increase in Hepatic stellate cell populations in NASH_cirrhosis and end-stage NAFLD conditions is highly significant. Activated Hepatic stellate cells are the primary fibrogenic cells in the liver, responsible for producing extracellular matrix components that lead to liver fibrosis and eventually cirrhosis [2]. Their expansion directly correlates with disease severity.
- Angiogenesis and Vascular Remodeling: The increased proportion of Endothelial cells in advanced disease stages (NASH_cirrhosis and end-stage NAFLD) suggests ongoing angiogenesis and vascular remodeling. This can contribute to the capillarization of liver sinusoids and increased intrahepatic vascular resistance, exacerbating portal hypertension in cirrhosis [3].
- Chronic Inflammation and Immune Cell Infiltration: The expansion of various immune cells, particularly Macrophages and T cell CD4+, in NASH_cirrhosis and end-stage NAFLD highlights the crucial role of chronic inflammation in disease progression. Macrophages (including resident Kupffer cells and monocyte-derived macrophages) play a central role in both initiating and resolving inflammation, as well as promoting fibrogenesis in NAFLD/NASH [4]. T cells, especially CD4+ T helper cells, contribute to immune responses that drive hepatocellular injury and inflammation [5].
- Transition from Steatosis to Steatohepatitis and Cirrhosis: The clear distinction in cellular composition between NAFLD (simple steatosis) and NASH_cirrhosis/end_stage_NAFLD underscores the pathological transition. Simple steatosis (NAFLD) typically involves fat accumulation without significant inflammation or fibrosis, hence the cell proportions remain relatively stable. In contrast, NASH and cirrhosis involve inflammation, hepatocyte death, and extensive fibrosis, which are reflected by the dramatic changes in non-parenchymal cell populations.
Clinical or Translational Implications
The distinct cellular signatures observed across disease stages have important clinical and translational implications:
- Biomarker Discovery: The relative proportions of specific cell types, particularly the ratio of hepatocytes to fibrogenic (Hepatic stellate cells, Endothelial cells) and inflammatory (Macrophages, T cells) cells, could serve as quantitative biomarkers for assessing disease severity and progression in NAFLD/NASH patients.
- Therapeutic Targets: The observed expansion of Hepatic stellate cells, Endothelial cells, and specific immune cell populations in advanced disease stages highlights these cells as potential therapeutic targets. Strategies aimed at inhibiting hepatic stellate cell activation, modulating immune cell responses, or normalizing endothelial cell function could be beneficial in preventing or reversing fibrosis and cirrhosis [6].
- Patient Stratification: Understanding the cellular heterogeneity within each disease condition, especially in NASH_cirrhosis, could aid in stratifying patients based on their dominant pathological features (e.g., fibrosis vs. inflammation predominance), allowing for more personalized treatment approaches.
- Monitoring Treatment Efficacy: Changes in cell type proportions, particularly a reduction in fibrogenic and inflammatory cells and a restoration of hepatocyte numbers, could be used as an indicator of therapeutic efficacy in clinical trials.
References
- Hepatocyte Loss and Regeneration: PubMed Search: "Hepatocyte death liver disease regeneration" https://pubmed.ncbi.nlm.nih.gov/?term=Hepatocyte+death+liver+disease+regeneration
- Hepatic Stellate Cells in Fibrosis: Kisseleva, T., & Brenner, D. A. (2012). Hepatic stellate cells and the pathogenesis of fibrosis. *Gastroenterology, 142*(6), 1251-1262. https://www.ncbi.nlm.nih.gov/pmc/articles/PMC3218520/
- Endothelial Cells and Liver Disease: PubMed Search: "Liver sinusoidal endothelial cells NAFLD cirrhosis" https://pubmed.ncbi.nlm.nih.gov/?term=Liver+sinusoidal+endothelial+cells+NAFLD+cirrhosis
- Macrophages in NAFLD/NASH: Tacke, F. (2017). Targeting hepatic macrophages to treat liver diseases. *Journal of Hepatology, 66*(6), 1300-1312. https://www.jhep-reports.eu/article/S2589-5559(17)30065-X/fulltext30065-X/fulltext)
- T cells in NAFLD/NASH: Long, Q., et al. (2020). Immune cell heterogeneity in non-alcoholic fatty liver disease. *Frontiers in Immunology, 11*, 593717. https://www.frontiersin.org/articles/10.3389/fimmu.2020.593717/full
- Therapeutic Strategies for Liver Fibrosis: Trautwein, C., et al. (2015). Hepatic fibrosis: from basic science to new therapies. *Journal of Hepatology, 62*(1 Suppl), S116-S129. https://www.journal-of-hepatology.eu/article/S0168-8278(15)00155-8/fulltext00155-8/fulltext)
5. T 세포 및 관련 면역 세포 아형의 간 질환별 변화 분석
[Analysis Visualization Results]...
Analysis Overview
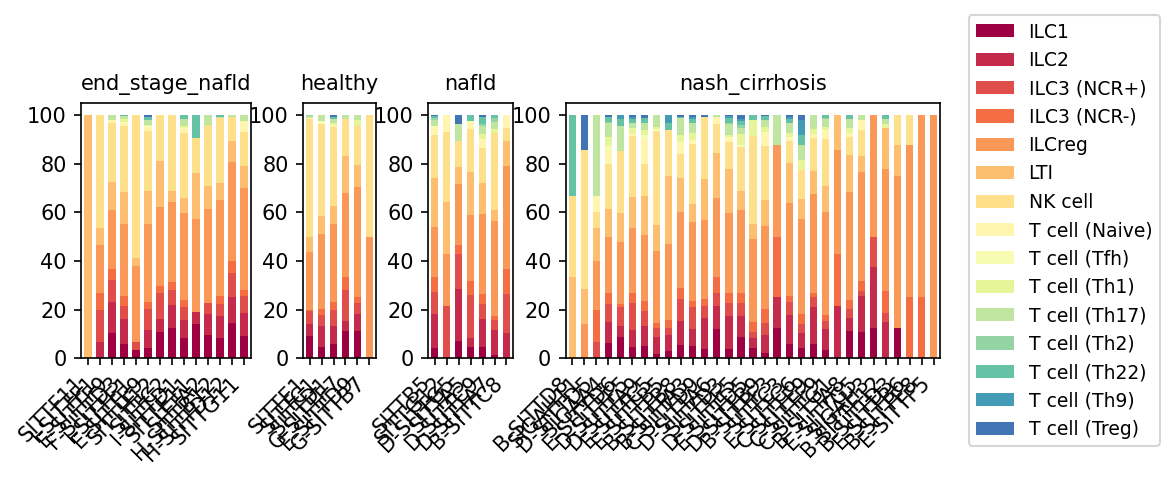
이 분석은 단일 세포 RNA 시퀀싱(scRNA-seq) 데이터를 사용하여 간 조직 내 T 세포 및 관련 Innate Lymphoid Cell(ILC) 아형의 개체군 비율을 다양한 간 질환 조건(healthy, nafld, end_stage_nafld, nash_cirrhosis)에서 비교한 결과를 시각화합니다. 특히 'T cell'로 분류된 주요 세포 집단 내의 하위 아형(subset) 구성 변화를 샘플별로 정량화하여 보여줍니다. 이 분석은 간 질환 진행에 따른 면역 환경의 재편성을 이해하는 데 중요한 통찰력을 제공합니다.
Visual Summary
제공된 막대 그래프는 각 조건(end_stage_nafld, healthy, nafld, nash_cirrhosis) 내 개별 샘플에서 T 세포 및 관련 ILC 아형의 상대적 비율을 시각화합니다.
- 건강(Healthy) 및 NAFLD/End-stage NAFLD 조건: 이들 조건에서는 ILC1 (짙은 빨간색) 및 ILCreg (주황색) 세포 아형이 전체 T 세포 주요 집단 내에서 상대적으로 높은 비율을 차지하는 경향을 보입니다. T 세포 아형(예: Th1, Th17, Th2, Th22, Th9, Treg)의 비율은 비교적 낮거나 미미하게 나타납니다. NK 세포 (밝은 노란색)도 관찰됩니다.
- NASH Cirrhosis 조건: NASH Cirrhosis 그룹은 다른 조건과 비교하여 가장 뚜렷한 세포 구성 변화를 보입니다.
- Th17 (밝은 녹색), Th2 (중간 녹색), Th22 (청록색), Th9 (청록색), 특히 Treg (짙은 파란색) 세포와 같은 T 세포 아형의 비율이 상당수의 샘플에서 명확하게 증가합니다. 이러한 T 세포 아형은 건강, NAFLD, End-stage NAFLD 조건에서는 거의 관찰되지 않거나 매우 낮은 비율을 차지했습니다.
- NASH Cirrhosis 샘플에서는 ILC1 및 ILCreg의 상대적 비율이 일부 샘플에서 건강 그룹에 비해 다소 낮게 나타날 수 있지만, 여전히 상당한 부분을 차지합니다.
- ILC2 및 ILC3 아형 또한 구성에 기여합니다.
- 종합: NASH Cirrhosis 조건에서 다양한 T helper 세포 아형(Th17, Th2, Th22, Th9) 및 조절 T 세포(Treg)의 현저한 증가는 간 질환의 진행에 따른 면역 반응의 복잡한 재편성을 시사합니다.
Biological Interpretation
간은 복잡한 면역 미세환경을 가지고 있으며, T 세포와 ILC는 면역 항상성 유지 및 염증/손상 반응에 중요한 역할을 합니다. 비알코올성 지방간 질환(NAFLD)은 단순 지방간에서 비알코올성 지방간염(NASH), 섬유증, 간경변증, 간세포암으로 진행될 수 있는 스펙트럼 질환입니다. NASH는 지방증, 염증, 간세포 풍선을 특징으로 하며, 간경변증은 진행성 간 섬유화를 나타냅니다.
NASH Cirrhosis에서의 T 세포 아형 변화:
- Th17 세포: 만성 염증 및 자가면역 질환과 관련된 강력한 전염증성 세포입니다. NASH Cirrhosis에서 Th17 세포의 증가는 심각한 간 염증 반응을 나타낼 수 있습니다 PubMed search: Th17 cells NASH cirrhosis.
- Th2 세포: 알레르기 반응 및 섬유증과 관련이 있습니다. NASH Cirrhosis에서 Th2 세포의 존재는 간 섬유화 과정에 기여하는 전섬유성 환경을 시사할 수 있습니다 PubMed search: Th2 cells liver fibrosis NASH.
- Th22 세포: 조직 복구 및 염증에 관여하는 IL-22를 생성합니다. IL-22의 역할은 간 질환에서 보호적이거나 병원성일 수 있는 복합적인 양상을 보입니다 PubMed search: Th22 cells IL-22 liver disease.
- Th9 세포: IL-9를 분비하며, 알레르기 염증 및 숙주 방어에 관여합니다. 만성 간 질환에서의 역할은 아직 덜 확립되어 있지만, 면역 조절 이상에 기여할 수 있습니다.
- Treg 세포: 면역 관용 및 염증 억제에 핵심적인 역할을 합니다. NASH Cirrhosis에서 Treg 세포의 증가는 과도한 염증을 제한하기 위한 보상 메커니즘일 수 있지만, 그 기능적 상태에 따라 면역 회피에 기여할 수도 있습니다 PubMed search: Regulatory T cells NASH cirrhosis.
- ILC의 역할: ILC는 간 면역에서 중요한 선천성 림프구입니다. ILC1은 Th1 기능, ILC2는 Th2 기능, ILC3는 Th17 기능을 종종 반영합니다. 건강 및 초기 질환 단계에서 ILC1 및 ILCreg의 높은 비율은 간 항상성 유지에 이들 세포가 중요한 역할을 함을 시사합니다.
- 결론: NASH Cirrhosis에서 ILC 및 NK 세포가 지배적인 건강한/초기 질환 상태에서 벗어나 T helper 세포(Th17, Th2, Th22, Th9) 및 조절 T 세포(Treg)의 다양하고 확장된 레퍼토리로의 전환은 진행성 간 질환에서 면역 반응의 상당하고 역동적인 재조직화를 나타냅니다. 이는 만성 염증, 면역 조절 시도, 그리고 잠재적인 섬유화 과정을 시사합니다.
Clinical or Translational Implications
- 질병 진행 바이오마커: NASH Cirrhosis에서 관찰된 특이적인 면역 세포 서명은 질병 진행 또는 중증도를 모니터링하기 위한 잠재적인 바이오마커로 활용될 수 있습니다.
- 치료 표적: Th17, Th2, Treg와 같은 특정 T 세포 아형의 확장은 NASH Cirrhosis에서 염증이나 섬유증을 줄이거나 면역 균형을 회복하기 위한 면역 조절 치료의 잠재적 표적이 될 수 있습니다.
- 면역 치료 전략: NASH Cirrhosis에서 전염증성(Th17) 및 조절성(Treg) 반응 사이의 균형을 이해하는 것은 효과적인 면역 치료 전략을 설계하는 데 중요합니다. 이 데이터를 통해 특정 세포 아형을 표적으로 하는 치료법 개발을 위한 통찰력을 얻을 수 있습니다.
6. Changes in Lymphocyte Subset Proportions Across Liver Disease Conditions
[Analysis Visualization Results]...
Analysis Overview
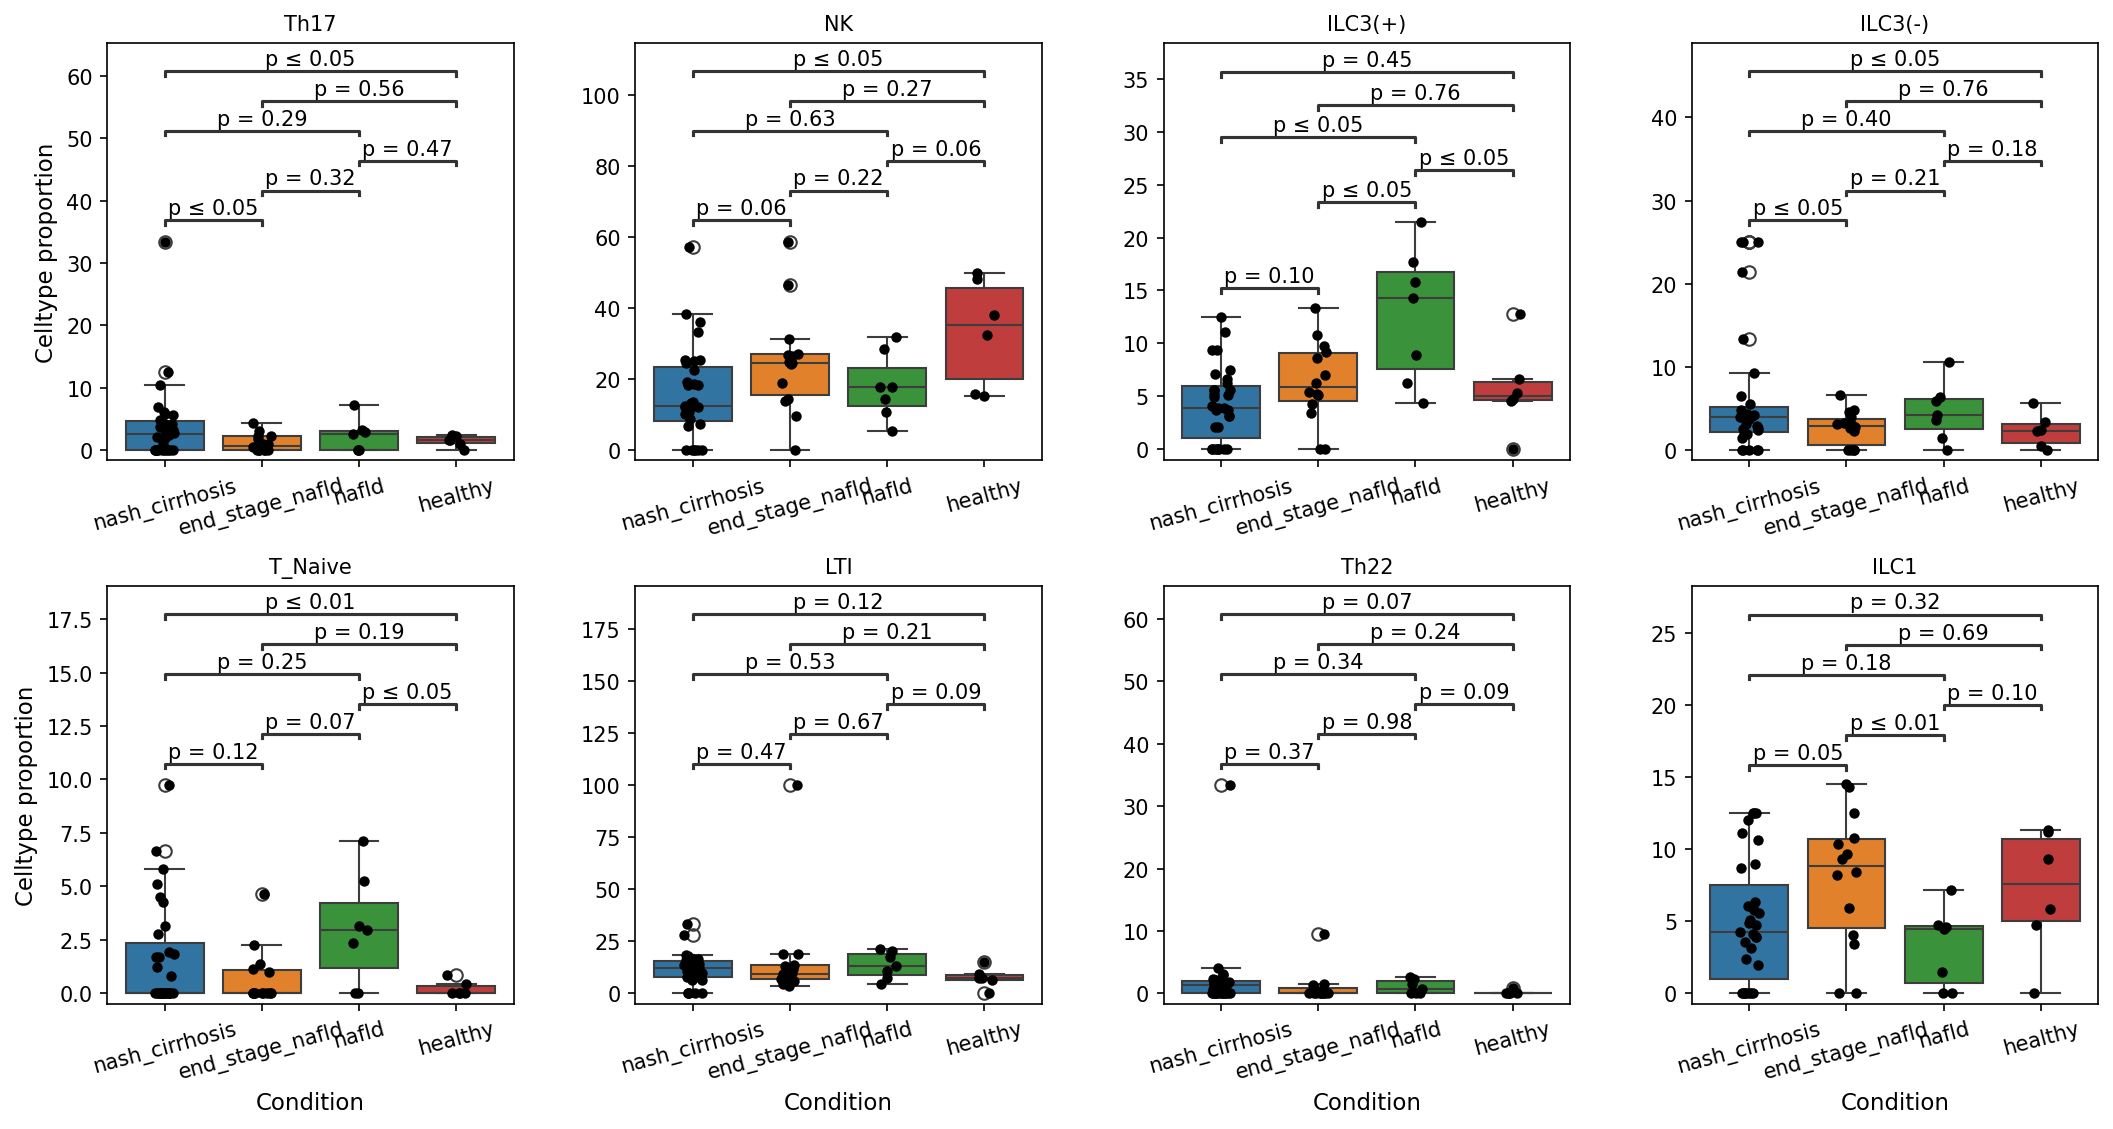
This analysis investigates the proportions of various lymphocyte subsets, including T cell subsets, NK cells, and Innate Lymphoid Cells (ILCs), within the liver across different disease conditions: NASH cirrhosis, end-stage NAFLD, NAFLD, and healthy controls. The boxplots visualize the celltype proportion for each subset, with significant differences (p-value $\le$ 0.1) highlighted between conditions. This allows for an understanding of how immune cell composition shifts with the progression of non-alcoholic fatty liver disease (NAFLD) and its more severe forms, Non-alcoholic Steatohepatitis (NASH) and cirrhosis.
Visual Summary
The boxplots reveal distinct patterns in the proportions of different lymphocyte subsets across the four liver conditions:
- Th17 cells: Significantly elevated in nash_cirrhosis compared to healthy (p $\le$ 0.05), suggesting an increase in pro-inflammatory T cells in advanced disease. Proportions also appear higher in other disease states compared to healthy, although not reaching statistical significance for end_stage_nafld or nafld vs healthy.
- NK cells: Proportions are significantly *lower* in nash_cirrhosis (p $\le$ 0.05) and nafld (p = 0.06) compared to healthy controls, indicating a potential reduction in innate immune surveillance during liver disease.
- ILC3(+): Show significantly *higher* proportions in end_stage_nafld (p $\le$ 0.05) and nafld (p $\le$ 0.05) compared to healthy. However, nash_cirrhosis has significantly *lower* ILC3(+) proportions compared to both end_stage_nafld (p $\le$ 0.05) and nafld (p $\le$ 0.05), suggesting a dynamic shift in ILC3(+) populations with disease progression.
- ILC3(-): Significantly *higher* in nash_cirrhosis compared to healthy (p $\le$ 0.05), similar to Th17 cells, potentially indicating a pro-inflammatory shift in ILC3s.
- T_Naive cells: Proportions are significantly *higher* in nash_cirrhosis (p $\le$ 0.01), end_stage_nafld (p $\le$ 0.05), and marginally higher in nafld (p = 0.07) compared to healthy, suggesting an overall expansion or altered trafficking of naive T cells in diseased livers.
- LTI cells: Show a marginally higher proportion in nafld compared to healthy (p = 0.09).
- Th22 cells: Marginally higher proportions are observed in nash_cirrhosis (p = 0.07) and end_stage_nafld (p = 0.09) compared to healthy, suggesting their involvement in later stages of liver disease.
- ILC1 cells: Significantly *higher* in nash_cirrhosis (p $\le$ 0.01) and end_stage_nafld (p $\le$ 0.05) compared to nafld. There's also a marginal decrease in nafld compared to healthy (p = 0.10). This indicates a specific increase in ILC1s in more severe disease stages.
Biological Interpretation
The observed shifts in lymphocyte subset proportions provide valuable insights into the immune landscape of progressive liver disease:
- Pro-inflammatory environment in advanced liver disease: The significant increase in Th17 cells and ILC3(-) in nash_cirrhosis points towards a heightened pro-inflammatory immune response. Th17 cells are known producers of IL-17, a cytokine implicated in chronic inflammation and fibrosis in liver diseases such as NASH and cirrhosis PubMed search: Th17 NASH fibrosis. Similarly, ILC3s can produce IL-17 and IL-22, and their altered balance, particularly an increase in ILC3(-), could contribute to inflammation. The marginal increase in Th22 cells in nash_cirrhosis and end_stage_nafld further supports a pro-inflammatory and tissue remodeling environment, as IL-22 has complex roles in liver inflammation, protection, and fibrosis PubMed search: Th22 IL-22 liver fibrosis.
- Dysregulation of innate immunity: The significant *reduction* in NK cell proportions in nash_cirrhosis and nafld is concerning. NK cells play critical roles in immune surveillance against virally infected cells and tumor cells, and their impairment is associated with disease progression and increased hepatocellular carcinoma risk in chronic liver disease GeneCards: KLRK1 (NKG2D) NK cells liver disease. This reduction suggests a potential compromise in the liver's innate defense mechanisms.
- Dynamic roles of Innate Lymphoid Cells (ILCs): The contrasting patterns of ILC3(+) and ILC1s across disease stages are notable. ILC3(+) appear elevated in earlier stages (nafld, end_stage_nafld), potentially contributing to tissue repair or maintaining mucosal homeostasis via IL-22 production. However, their decrease in nash_cirrhosis suggests that this protective role might be lost or overcome in advanced disease. Conversely, ILC1s, which are known producers of IFN-γ, are significantly increased in nash_cirrhosis and end_stage_nafld relative to nafld. IFN-γ can be pro-fibrotic and contributes to inflammation in chronic liver injury, suggesting a shift towards an ILC1-driven inflammatory and fibrotic response in more severe disease PubMed search: ILC1 liver fibrosis.
- Altered T cell compartment dynamics: The elevation of T_Naive cells across all disease conditions, especially nash_cirrhosis and end_stage_nafld, is intriguing. While naive cells are generally unprimed, an increased proportion could reflect altered lymphocyte homing, increased lymphocyte turnover, or systemic immune dysregulation impacting the liver microenvironment.
Clinical or Translational Implications
These findings highlight specific lymphocyte subsets as potential biomarkers for the progression and severity of NAFLD, NASH, and cirrhosis:
- The increase in Th17 and ILC1s, coupled with a decrease in NK cells, could serve as indicators of active inflammation and fibrosis in advanced NASH and cirrhosis.
- Monitoring the dynamic changes in ILC3(+) populations could help differentiate earlier, potentially reversible, stages of NAFLD from more advanced, fibrotic conditions.
- These cellular shifts also point to potential therapeutic targets. Strategies aimed at modulating Th17 and ILC1 responses, or restoring NK cell function, could be explored for their efficacy in attenuating liver inflammation and fibrosis in patients with progressive liver disease. For example, blocking IL-17 or IFN-γ pathways, or enhancing NK cell activity, might offer new avenues for intervention.
7. Macrophage Subset Population Dynamics in Liver Disease Progression
[Analysis Visualization Results]...
Analysis Overview
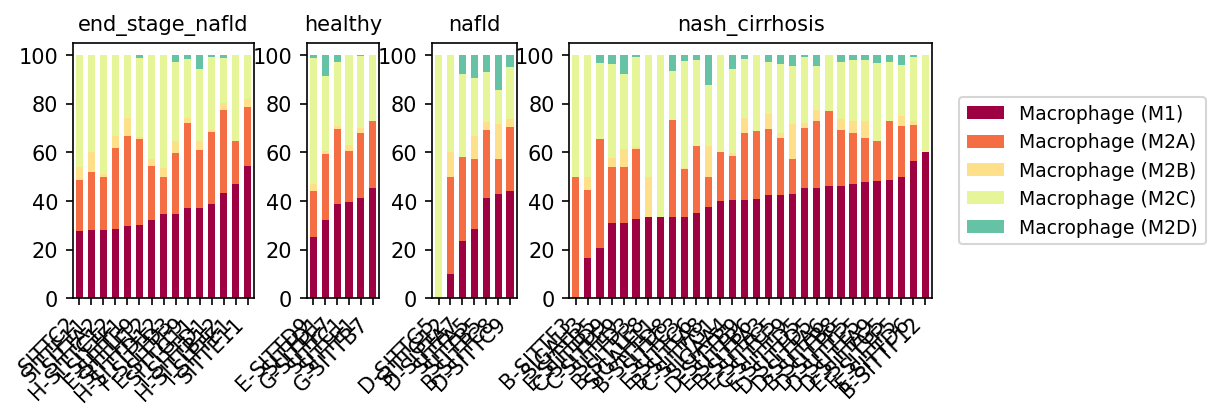
This analysis visualizes the relative proportions of different macrophage subsets (M1, M2A, M2B, M2C, M2D) within the total macrophage population across individual liver samples from healthy donors and patients with varying stages of non-alcoholic fatty liver disease (NAFLD) progression, specifically NAFLD, NASH-cirrhosis, and end-stage NAFLD. The stacked bar plots allow for a direct comparison of macrophage polarization states across conditions and among individual samples.
Visual Summary
The stacked bar plots illustrate distinct shifts in macrophage subset compositions across the disease spectrum:
- Healthy Liver: In healthy samples, Macrophage (M1) and Macrophage (M2A) subsets constitute the majority of the macrophage population, with M1 often being slightly more abundant. Macrophage (M2B), (M2C), and (M2D) subsets are present at very low proportions, almost negligible in most healthy samples.
- NAFLD: Samples from NAFLD patients show a macrophage subset distribution generally similar to healthy controls, though some samples exhibit slightly increased variability in M1 and M2A proportions. M2C and M2D remain minor components.
- NASH Cirrhosis: A clear shift is observed in NASH cirrhosis. The proportion of Macrophage (M1) cells significantly increases compared to healthy and NAFLD conditions, often becoming the dominant subset. Macrophage (M2A) also remains highly abundant, indicating a sustained or elevated presence of these cells. M2B is consistently present, while M2C and M2D show minor, but potentially more consistent, representation across samples compared to earlier stages.
- End-Stage NAFLD: This condition exhibits the most pronounced shift. Macrophage (M1) cells become highly predominant, reaching very high proportions (often exceeding 60-70%) in most samples. Macrophage (M2A) continues to be a substantial component. The M2B, M2C, and M2D subsets remain minor, although M2C and M2D might be slightly more noticeable in a few end-stage samples.
In summary, there is a progressive increase in the proportion of pro-inflammatory M1 macrophages as liver disease advances from healthy to NAFLD, NASH cirrhosis, and especially to end-stage NAFLD. Macrophage (M2A) maintains a significant presence throughout disease progression.
Biological Interpretation
Macrophages, including tissue-resident Kupffer cells and monocyte-derived macrophages, play a pivotal role in the initiation and progression of non-alcoholic fatty liver disease (NAFLD) and its more severe form, non-alcoholic steatohepatitis (NASH), which can lead to cirrhosis and liver failure. The observed shifts in macrophage subsets provide critical insights into the underlying immune responses:
- M1 Macrophages and Inflammation: M1 macrophages are typically considered pro-inflammatory, characterized by the production of pro-inflammatory cytokines (e.g., TNFα, IL-1β, IL-6) and reactive oxygen species, contributing to hepatocyte injury and driving inflammation [1]. The progressive increase in M1 macrophage proportions from healthy to end-stage NAFLD strongly suggests an escalating inflammatory environment as the disease progresses and becomes more severe. This sustained inflammation is a hallmark of NASH and a key driver of fibrosis.
- M2A Macrophages and Fibrosis/Wound Healing: M2A macrophages are generally associated with tissue repair, extracellular matrix deposition, and pro-fibrotic activities, often producing factors like TGF-β [2]. Their sustained high presence alongside increasing M1 macrophages suggests a complex and potentially maladaptive wound-healing response. In the context of chronic liver injury, this persistent activation of pro-fibrotic M2A-like macrophages can contribute significantly to the development and progression of liver fibrosis and ultimately cirrhosis.
- Other M2 Subsets: While less abundant, the minor presence of other M2 subsets (M2B, M2C, M2D) in advanced disease stages might indicate heterogeneous macrophage functions. M2C macrophages are known for immunosuppression and tissue remodeling, and M2D macrophages have been implicated in promoting tumor growth and immune evasion in chronic inflammation. Their subtle changes could reflect the complex interplay of pro-inflammatory, pro-fibrotic, and potentially immunomodulatory pathways occurring simultaneously in chronic liver disease.
This dynamic polarization of macrophages, with a distinct shift towards M1-like populations in advanced disease stages, highlights their central role in propagating liver inflammation and fibrosis in NAFLD/NASH.
Clinical or Translational Implications
The differential distribution of macrophage subsets across liver disease stages holds several potential clinical and translational implications:
- Biomarkers for Disease Progression: The increasing proportion of M1 macrophages, particularly in NASH cirrhosis and end-stage NAFLD, could serve as a valuable biomarker for assessing disease severity and predicting progression. Monitoring the M1/M2 balance might offer prognostic insights beyond traditional liver function tests or imaging.
- Therapeutic Targets: Modulating macrophage polarization represents a promising therapeutic strategy for NAFLD/NASH. Interventions aimed at dampening M1 macrophage activation or shifting the balance towards more anti-inflammatory or reparative M2 phenotypes could potentially mitigate inflammation, halt fibrosis progression, and improve liver outcomes [3]. Given the sustained presence of M2A, therapies might also need to consider specific targeting of pro-fibrotic M2 functions.
- Personalized Medicine: Understanding the specific macrophage landscape in individual patients could facilitate personalized treatment approaches, tailoring immunomodulatory therapies based on the dominant macrophage polarization observed.
References
- M1 Macrophages in Inflammation: PubMed Search for "M1 macrophage inflammation liver disease" https://pubmed.ncbi.nlm.nih.gov/?term=M1+macrophage+inflammation+liver+disease
- M2 Macrophages and Fibrosis: PubMed Search for "M2 macrophage fibrosis liver" https://pubmed.ncbi.nlm.nih.gov/?term=M2+macrophage+fibrosis+liver
- Therapeutic Targeting of Macrophages in NAFLD: PubMed Search for "macrophage targeting NAFLD NASH therapy" https://pubmed.ncbi.nlm.nih.gov/?term=macrophage+targeting+NAFLD+NASH+therapy
8. Macrophage (M2B) Population Dynamics in Liver Disease Progression
[Analysis Visualization Results]...
Analysis Overview
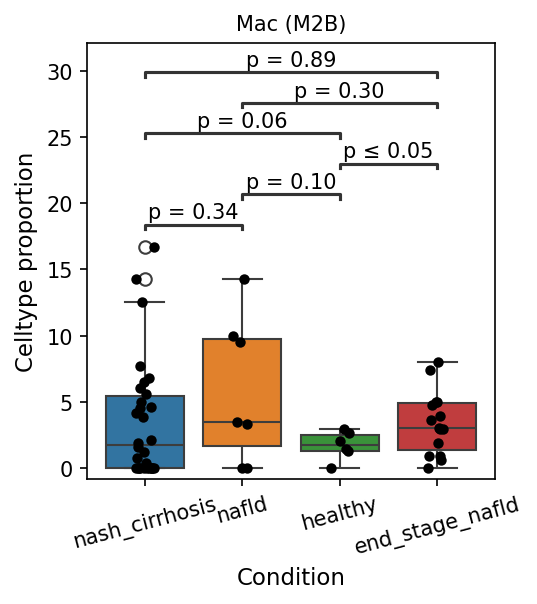
This analysis investigates the proportion of Macrophage (M2B) cells within the total cell population across various liver conditions: healthy, non-alcoholic fatty liver disease (NAFLD), non-alcoholic steatohepatitis (NASH) cirrhosis, and end-stage NAFLD. The goal is to identify how the abundance of this specific macrophage subset changes with disease progression, highlighting statistically significant differences.
Visual Summary
The boxplot illustrates the distribution of Macrophage (M2B) cell proportions for each condition.
- Healthy individuals show the lowest proportion of Mac (M2B) cells, typically below 2.5%.
- The proportion of Mac (M2B) cells appears elevated in disease conditions compared to healthy.
- NAFLD and NASH cirrhosis exhibit an increased median proportion, with NAFLD showing a median around 4% and NASH cirrhosis around 2.5-3%, although with a wider spread including some high outliers.
- End-stage NAFLD shows a notably higher median proportion of Mac (M2B) cells (around 4-5%) compared to healthy individuals.
Statistical Significance:
- A statistically significant increase in Mac (M2B) proportion is observed in end-stage NAFLD compared to healthy (p ≤ 0.05).
- There is also a near-significant increase in NASH cirrhosis compared to healthy (p = 0.06), falling within the user-defined pval_cutoff of 0.1.
- The difference between NAFLD and healthy is also borderline significant (p = 0.10), again within the pval_cutoff.
- Comparisons among the disease conditions (e.g., NASH cirrhosis vs. NAFLD, NASH cirrhosis vs. end-stage NAFLD) do not show significant differences in this specific M2B population proportion.
Biological Interpretation
Macrophages are critical immune cells in the liver, contributing to homeostasis, inflammation, and fibrosis. M2 macrophages, including the M2B subtype, are generally associated with anti-inflammatory responses, tissue repair, and the promotion of fibrosis in chronic liver diseases.
The observed increase in Macrophage (M2B) proportions in conditions like NASH cirrhosis and, most notably, end-stage NAFLD, suggests a potential role for this specific macrophage subtype in the advanced stages of non-alcoholic fatty liver disease progression.
- In the context of chronic liver injury, the liver parenchyma undergoes continuous cycles of damage and repair. M2-like macrophages are often recruited to sites of injury where they can contribute to the resolution of inflammation and clearance of cellular debris. However, sustained or dysregulated M2 activity, particularly in the M2B subtype, can also exacerbate fibrogenic processes by producing pro-fibrotic mediators and interacting with hepatic stellate cells.
- The significant elevation in end-stage NAFLD is particularly insightful, as this stage is characterized by severe fibrosis and often cirrhosis. This could indicate that M2B macrophages are either actively participating in the ongoing fibrotic process that defines end-stage disease, or they represent a compensatory, yet ultimately insufficient, attempt at tissue repair.
- The trend of increasing M2B proportions from healthy to NAFLD, and further into NASH cirrhosis and end-stage NAFLD, aligns with the known involvement of distinct macrophage populations in different stages of NAFLD/NASH pathogenesis [1]. M2B macrophages are known to be activated by specific stimuli (e.g., immune complexes, TLR ligands) and can produce both pro-inflammatory (e.g., IL-6, TNF-alpha) and anti-inflammatory/pro-resolving (e.g., IL-10) cytokines, making their role context-dependent [2].
Clinical or Translational Implications
The findings suggest that the proportion of Macrophage (M2B) cells could serve as a potential biomarker for disease severity or progression in NAFLD/NASH, particularly in distinguishing advanced stages like end-stage NAFLD from earlier stages or healthy liver.
- Monitoring M2B populations could provide insights into the inflammatory and fibrotic state of the liver in patients with NAFLD/NASH.
- Targeting the polarization or activity of specific macrophage subsets like M2B could represent a therapeutic strategy to modulate inflammation and fibrosis in advanced liver disease [3]. Further research would be needed to determine if this increase in M2B represents a detrimental pro-fibrotic activity or a beneficial, but overwhelmed, repair mechanism.
---
References:
[1] Macrophages in non-alcoholic fatty liver disease (NAFLD) and non-alcoholic steatohepatitis (NASH).
[2] Macrophage polarization: an updated view.
[3] Macrophages as therapeutic targets in liver diseases.
9. Healthy Liver Cell-Cell Interaction Landscape
[Analysis Visualization Results]...
Analysis Overview
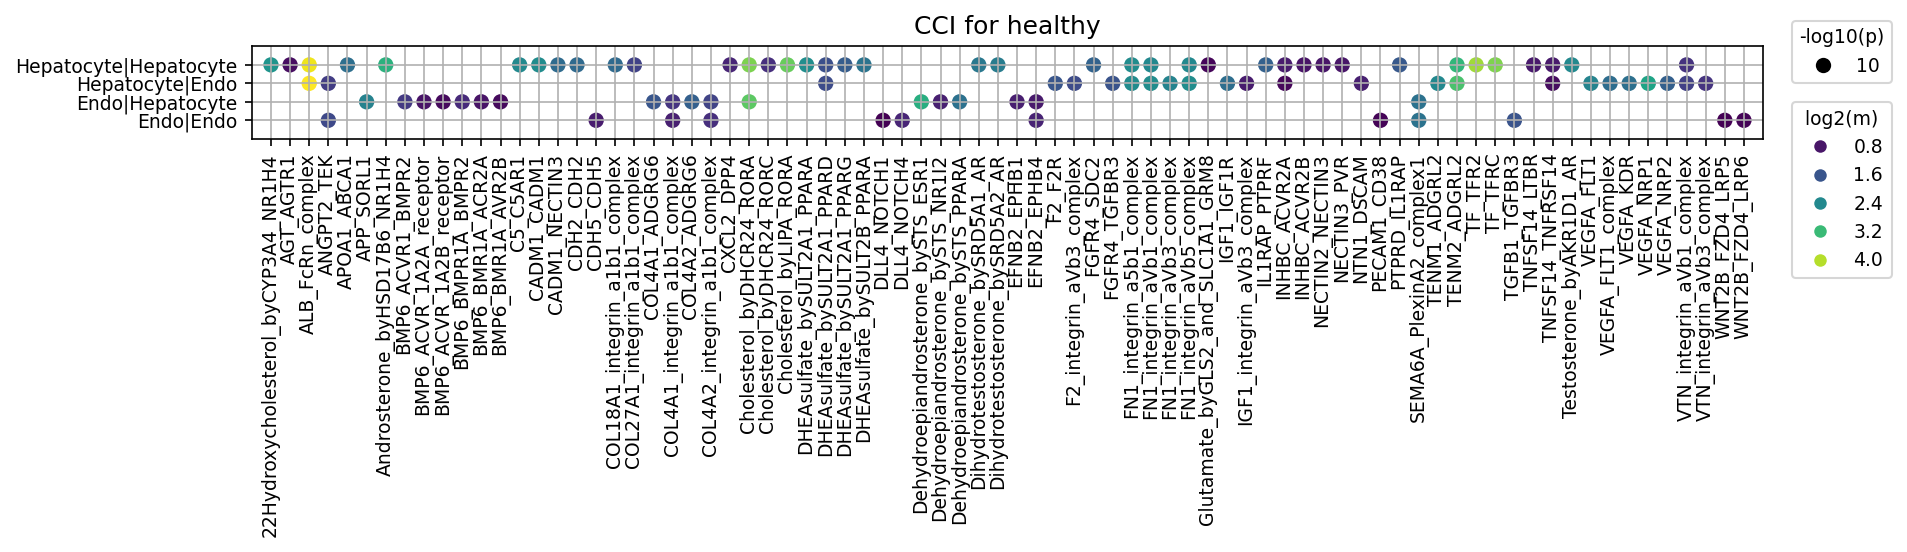
This analysis visualizes the top 80 predicted cell-cell interactions (CCI) within the healthy liver microenvironment, focusing on interactions involving Hepatocytes and Endothelial cells. The dot plot displays ligand-receptor pairs (x-axis) and the interacting cell pairs (y-axis). The size of each dot represents the statistical significance (-log10(p-value)), with larger dots indicating more significant interactions (smaller p-value). The color intensity of the dot indicates the average expression level (log2(mean)) of the interacting ligand-receptor pair across the respective cell populations, with brighter colors (yellow/green) corresponding to higher expression.
Visual Summary
The visualization highlights a complex network of cell-cell interactions crucial for maintaining healthy liver function. We observe significant interactions across all four queried cell-pair categories: Hepatocyte-Hepatocyte, Hepatocyte-Endothelial cell, Endothelial cell-Hepatocyte, and Endothelial cell-Endothelial cell.
Key observations include:
- Prevalence of Integrin-mediated Interactions: A substantial number of interactions involve various integrin complexes (e.g., COL18A1_integrin_a1b1_complex, FN1_integrin_a5b1_complex, VTN_integrin_aVb3_complex, F2_integrin_aVb3_complex, IGF1_integrin_aVb3_complex). These are broadly distributed across all cell-pair types, indicating strong cell-extracellular matrix (ECM) adhesion and cell-cell communication networks.
- Metabolic Signaling: Several ligand-receptor pairs related to steroid and cholesterol metabolism are active, such as "22Hydroxycholesterol_byCYP3A4_NR1H4", "Androsterone_byHSD17B6_NR1H4", "Cholesterol_byDHCR24_RORA", "DHEA-sulfate_bySULT2A1_PPARD", and "Dihydrotestosterone_bySRD5A1_AR". These are particularly prominent in Hepatocyte-Hepatocyte and Hepatocyte-Endothelial cell interactions.
- Growth Factor and Angiogenic Signaling: Interactions involving VEGFA (e.g., VEGFA_FLT1, VEGFA_KDR, VEGFA_NRP1, VEGFA_NRP2) are significant, especially within Endothelial cell-Endothelial cell and bidirectional Hepatocyte-Endothelial cell pairs. Other growth factor-related signals like IGF1-IGF1R and BMP6-ACVR/BMPR are also observed.
- Cell Adhesion Molecules: Cadherins (e.g., CDH2_CDH2, CDH5_CDH5) and Nectins (e.g., CADM1_CADM1, NECTIN2_NECTIN3) show strong interactions, particularly within homologous cell-cell pairs (Hepatocyte-Hepatocyte and Endothelial cell-Endothelial cell), essential for maintaining tissue structure.
- Notch Signaling: DLL4-NOTCH interactions are primarily observed within the Endothelial cell-Endothelial cell pairs, suggesting a role in vascular development and patterning.
Biological Interpretation
The observed CCI landscape in the healthy liver reflects the intricate cellular crosstalk required for its complex functions, including metabolism, detoxification, and regeneration.
- Liver Architecture and Adhesion: The high prevalence of integrin, cadherin, and nectin interactions underscores the importance of robust cell-cell and cell-ECM adhesion for maintaining the structural integrity of the liver parenchyma and sinusoidal endothelium. Integrins mediate cell attachment to the ECM (e.g., collagen, fibronectin, vitronectin), crucial for hepatocyte function and survival, and also facilitate bidirectional signaling. Cadherins and nectins are key for homotypic cell adhesion, ensuring tight junctions and structural stability within hepatocyte plates and endothelial linings.
- Metabolic Regulation and Communication: The significant number of interactions involving steroid hormones and cholesterol metabolites (e.g., DHEA-sulfate, Dihydrotestosterone, cholesterol) highlights the liver's central role in steroidogenesis, lipid metabolism, and detoxification. These interactions suggest direct communication pathways between hepatocytes and, to a lesser extent, with endothelial cells, to coordinate these metabolic processes within the hepatic lobule.
- Vascular Homeostasis and Angiogenesis: VEGFA signaling is critical for endothelial cell survival, proliferation, and maintaining the unique fenestrated structure of liver sinusoids. Its activity in both endothelial-endothelial and hepatocyte-endothelial interactions suggests a dynamic interplay in maintaining vascular integrity and potentially initiating repair or regeneration in response to normal physiological cues. Notch signaling, particularly DLL4-NOTCH, in endothelial cells plays a vital role in regulating vascular branching and arterial-venous differentiation within the liver vasculature.
- Growth and Regeneration: Interactions involving IGF1-IGF1R and BMP6 pathways are essential for cell proliferation, differentiation, and tissue repair. IGF1, largely produced by hepatocytes, acts as a potent growth factor. BMP6 is involved in iron homeostasis and liver regeneration [NCBI]. Their presence indicates a constant readiness for tissue maintenance and repair mechanisms even in a healthy state.
Clinical or Translational Implications
Understanding the baseline cell-cell interaction network in the healthy liver is critical for identifying dysregulated pathways in liver diseases such as NASH, NAFLD, and cirrhosis.
- Biomarker Identification: Interactions that are highly active in the healthy state could serve as a reference for identifying aberrant signaling in disease. For instance, specific integrin-ECM interactions might be altered during fibrosis, providing potential diagnostic or prognostic biomarkers.
- Therapeutic Target Prioritization: Ligand-receptor pairs that maintain healthy liver function could represent targets for therapeutic intervention. For example, enhancing specific steroid metabolism interactions might be beneficial in certain metabolic disorders. Modulating VEGFA or Notch signaling could be relevant for maintaining sinusoidal integrity or promoting controlled regeneration in injured livers, while avoiding uncontrolled angiogenesis.
- Experimental Validation: The identified highly significant and highly expressed interactions in healthy tissue provide a strong basis for further experimental validation. Researchers could investigate the precise roles of these interactions using in vitro co-culture models of hepatocytes and endothelial cells, or in vivo genetic manipulation models, to understand their contribution to liver homeostasis and disease progression. For instance, investigating how specific integrin complexes contribute to the mechanical properties and signaling within the healthy liver could inform strategies to prevent or reverse fibrosis.
- Drug Development: Insights into the physiological communication axes can guide the development of drugs that either mimic healthy interactions or block detrimental ones in disease. For example, developing agonists for specific metabolic receptors or antagonists for profibrotic growth factor receptors (like TGFB, though less prominent in healthy, it is critical in disease) that become upregulated.
10. Condition-Specific Cell-Cell Interaction Patterns in Liver Immune and Stromal Cells
[Analysis Visualization Results]...
Analysis Overview
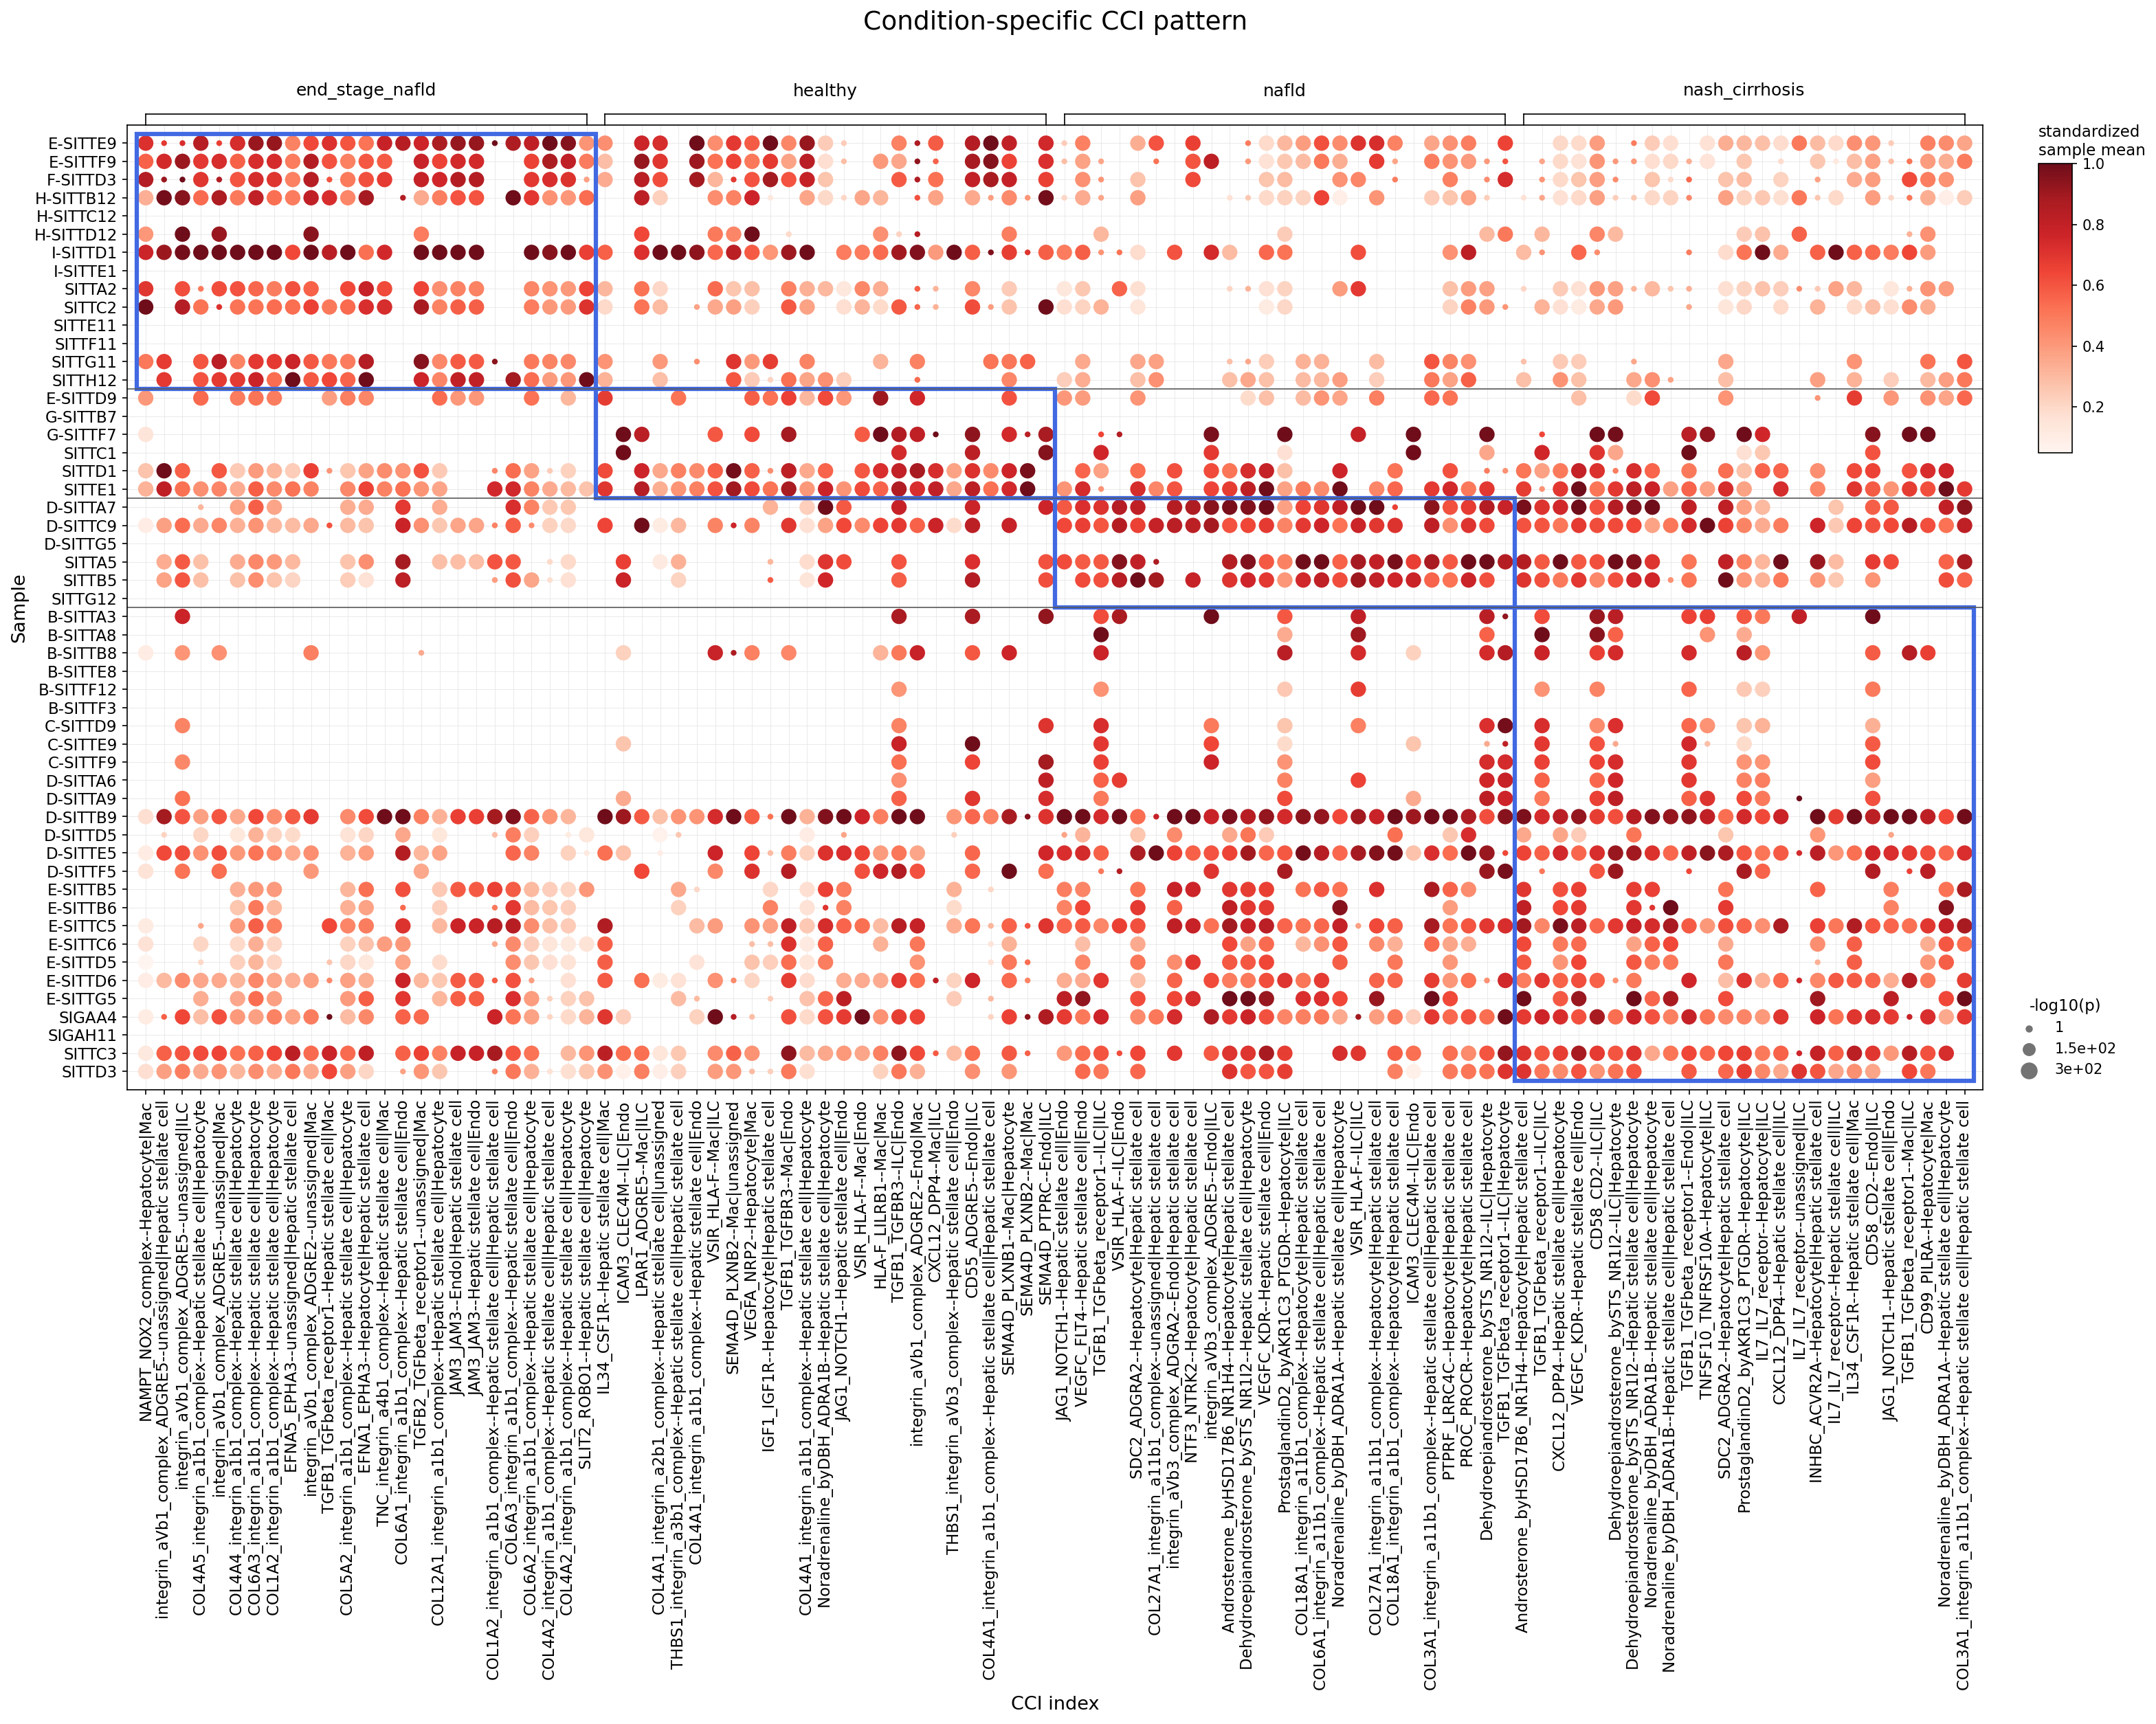
This analysis investigates statistically significant differences in cell-cell interactions (CCIs) among major immune cells (NK cell, ILC, Macrophage, Plasma cell, T cell CD4+, B cell, Dendritic cell) and hepatic stellate cells across various liver disease conditions (healthy, nafld, nash_cirrhosis, end_stage_nafld). Using CellPhoneDB, the plot_dot_for_cci_with_signif_difference tool was employed to visualize interactions that are significantly stronger in one condition compared to others, aiming to identify condition-specific communication patterns relevant to disease progression in the liver.
Visual Summary
The dot plot displays a complex landscape of cell-cell interactions, with distinct patterns emerging across the different liver conditions and individual samples.
- Differential CCI Activity: There is a clear gradient of CCI activity, with healthy and nafld conditions generally showing fewer and less intense significant interactions. In contrast, end_stage_nafld and nash_cirrhosis exhibit a much higher prevalence and strength of statistically significant CCIs, indicated by numerous dark red and large dots. This suggests a significantly perturbed and highly active cellular communication network in advanced liver disease stages.
Clusters of High Activity
- The end_stage_nafld condition (top-left blue box) displays a broad cluster of highly active CCIs across multiple samples, indicating robust intercellular communication associated with end-stage disease.
- Similarly, nash_cirrhosis (bottom-right blue box) also shows a distinct and strong cluster of interactions, particularly involving Hepatic stellate cell-mediated communication, suggesting a prominent role of these interactions in the progression to cirrhosis.
- Dominant Cell Types and Ligand-Receptor Pairs: Many of the highlighted interactions involve Hepatic stellate cells as one or both partners. Frequent gene pairs include components of the extracellular matrix (e.g., COL1A1, COL4A1) interacting with integrin complexes (e.g., integrin_a1b1_complex, integrin_aVb1_complex), and key signaling molecules like TGFB1, SPP1, CXCL12, JAG1, and their respective receptors. The dot size (p-value) and color intensity (standardized sample mean) confirm that these interactions are not only strong but also significantly different across conditions, especially heightened in end-stage disease.
Biological Interpretation
The observed patterns provide crucial insights into the evolving cellular microenvironment during liver disease progression:
- Fibrogenic Signaling Activation: The prominent and significantly stronger interactions involving Hepatic stellate cells (HSCs) and integrin-collagen complexes (e.g., COL1A1-integrin_a1b1_complex, COL4A1-integrin_a1b1_complex, COL6A1-integrin_a1b1_complex, COL12A1-integrin_a1b1_complex) in end_stage_nafld and nash_cirrhosis are highly indicative of active liver fibrosis. HSCs are the primary fibrogenic cells in the liver, and their interactions with extracellular matrix (ECM) components via integrins drive their activation and matrix deposition. PubMed: Integrin-ECM interactions in liver fibrosis
- TGF-$\beta$ Signaling: The robust TGFB1-TGFbeta_receptor1 interactions, particularly between Hepatic stellate cells and other cells, underscore the central role of TGF-$\beta$ signaling in advanced liver disease. TGF-$\beta$ is a potent pro-fibrotic cytokine that activates HSCs and promotes ECM synthesis. GeneCards: TGFB1
- Pro-inflammatory and Pro-fibrotic Milieu: Interactions such as SPP1-integrin_aVb1_complex and SPP1-ADGRE5 involving Macrophages and Hepatic stellate cells or Hepatocytes are highly active in disease. SPP1 (Osteopontin) is a known mediator of inflammation and fibrosis in NAFLD/NASH, often secreted by macrophages, which promotes HSC activation and ECM remodeling. GeneCards: SPP1
- Chemokine Signaling: CXCL12-CXCR4 interactions are elevated in diseased states. This axis is crucial for immune cell trafficking, angiogenesis, and perpetuating fibrotic responses by recruiting and activating immune cells and HSCs. GeneCards: CXCL12
- NOTCH Signaling: JAG1-NOTCH1 interactions, especially between Hepatic stellate cells and Hepatocytes, also show increased activity in diseased livers. Notch signaling is known to regulate HSC activation, differentiation, and liver regeneration, often contributing to disease progression in chronic liver injury. GeneCards: JAG1
- Immune-Stromal Crosstalk: The involvement of various immune cells (Macrophage, ILC) interacting with Hepatic stellate cells suggests complex immune-stromal crosstalk that drives the inflammatory and fibrotic processes in NAFLD/NASH progression.
The overall shift towards increased and diversified cell-cell interactions in end_stage_nafld and nash_cirrhosis compared to healthy and nafld highlights the dynamic and progressive nature of intercellular communication in liver disease pathophysiology.
Clinical or Translational Implications
The identification of significantly altered cell-cell interactions in advanced liver disease stages (end_stage_nafld, nash_cirrhosis) holds several clinical and translational implications:
- Biomarker Discovery: Specific CCI pairs, particularly those robustly activated in nash_cirrhosis and end_stage_nafld, could serve as novel diagnostic or prognostic biomarkers for disease severity and progression. For instance, heightened activity of specific integrin-collagen or TGF-$\beta$ related interactions might indicate advanced fibrosis.
- Therapeutic Targets: The highlighted ligand-receptor pairs (e.g., SPP1-integrin, TGFB1-TGFbeta_receptor1, CXCL12-CXCR4, JAG1-NOTCH1) represent promising therapeutic targets for intervening in liver fibrosis and inflammation. Strategies to block these interactions or their downstream signaling could potentially mitigate disease progression. For example, inhibitors of integrins or TGF-$\beta$ pathways are under investigation for fibrotic diseases. PubMed: Anti-fibrotic therapies liver
- Personalized Medicine: The sample-level variations within conditions suggest that personalized approaches might be beneficial. Understanding which specific CCIs are dominant in an individual patient could guide more targeted therapeutic strategies.
- Disease Monitoring: Monitoring the activity of these specific cell-cell interactions over time could provide insights into treatment response or disease recurrence.
11. Macrophage Condition-Specific Surfaceome Markers in Liver Disease
[Analysis Visualization Results]...
Analysis Overview
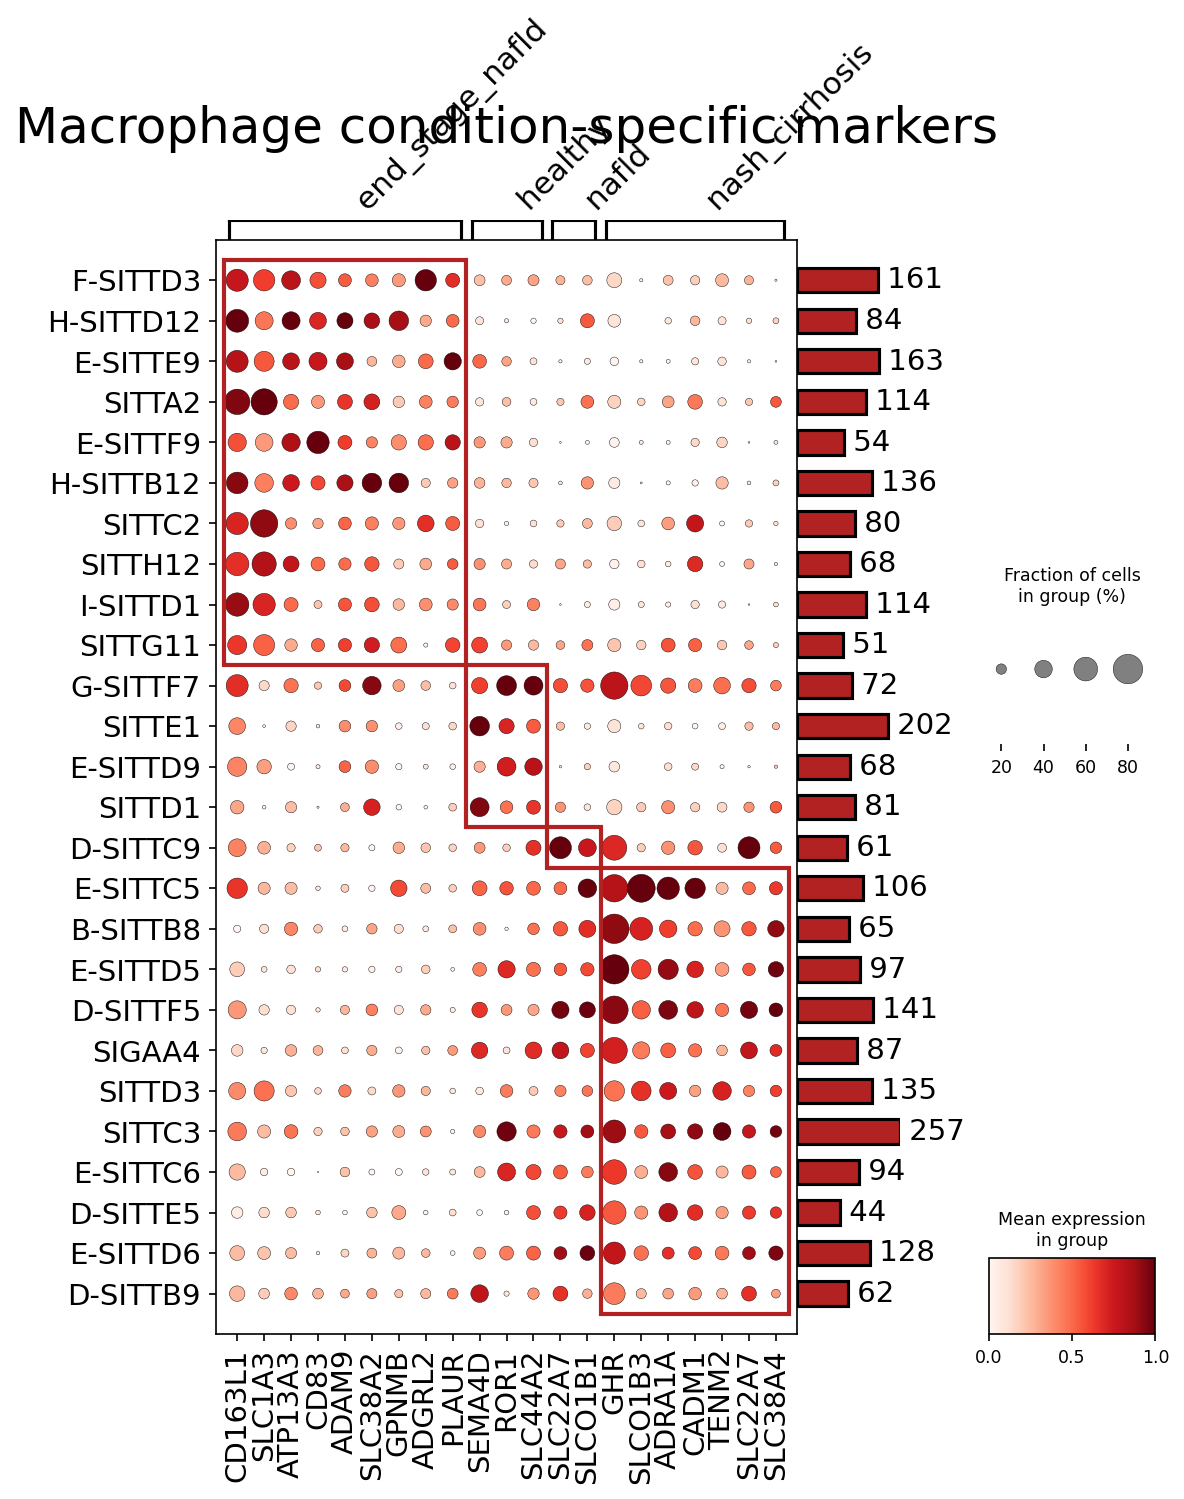
This analysis identifies and visualizes surfaceome markers that are specifically enriched in liver macrophages across different conditions: healthy, nafld (Nonalcoholic Fatty Liver Disease), nash_cirrhosis (Nonalcoholic Steatohepatitis with cirrhosis), and end_stage_nafld (End-stage NAFLD). By focusing on surfaceome markers, this analysis highlights potential cell-surface molecules that mediate cell-cell interactions, signaling, and could serve as diagnostic biomarkers or therapeutic targets. The plot_markers_and_expression_dot tool was used, configured to find up to 50 surfaceome markers per condition and to remove markers common in 3 or more groups, thereby emphasizing condition-specificity.
Visual Summary
The dot plot effectively displays the expression patterns of identified macrophage surfaceome markers across the four liver disease conditions.
- Clustering of Conditions: The conditions are clustered, indicating transcriptional similarity. Healthy and nafld conditions cluster together, suggesting shared or similar macrophage states, while end_stage_nafld and nash_cirrhosis form distinct clusters, highlighting advanced disease-specific changes.
Condition-Specific Marker Expression:
- End-stage NAFLD Specific Markers: A prominent cluster of markers (top portion of the plot, approximately corresponding to genes like CD163L1, SLC1A3, ATP13A3, CD83, ADAM9) shows high mean expression (dark red color) and high fraction of expressing cells (large dot size) almost exclusively in the end_stage_nafld condition. This suggests a unique macrophage phenotype associated with advanced liver disease progression.
- Healthy and NAFLD Specific Markers: A distinct group of markers (middle portion, approximately corresponding to genes like GPNMB, ADGRL2, PLAUR, SEMA4D, ROR1) exhibits strong expression in both healthy and nafld conditions, with very low or no expression in nash_cirrhosis or end_stage_nafld. These may represent markers of homeostatic or early-stage disease-associated macrophage states.
- NASH Cirrhosis Specific Markers: Another significant cluster of markers (bottom portion, approximately corresponding to genes like SLC44A2, SLC22A7, SLCO1B1, GHR, SLCO1B3, ADRA1A, CADM1, TENM2, SLC22A4, SLC38A4) demonstrates high expression and prevalence specifically in nash_cirrhosis. Some of these markers also show moderate expression in nafld, but are most pronounced in nash_cirrhosis.
Biological Interpretation
The observed condition-specific surfaceome marker profiles provide insights into the functional adaptation and distinct phenotypes of liver macrophages during different stages of NAFLD progression to cirrhosis.
Macrophage Activation and Damage in End-stage NAFLD:
- CD163L1: A homolog of CD163, a well-known scavenger receptor and marker of anti-inflammatory M2-like macrophages, often associated with tissue remodeling and fibrosis. Its upregulation in end_stage_nafld could indicate a heightened M2-like pro-fibrotic or tissue-reparative (but dysfunctional in chronic disease) macrophage response in the most advanced disease stage. GeneCards: CD163L1
- CD83: An activation marker for immune cells, including macrophages. Its specific high expression in end_stage_nafld suggests an intensely activated macrophage state, potentially contributing to chronic inflammation and liver damage. GeneCards: CD83
- ADAM9: A disintegrin and metalloproteinase, involved in cell adhesion, migration, and shedding of cell surface proteins. Its enrichment points to altered extracellular matrix interactions and proteolytic activities in advanced disease. GeneCards: ADAM9
- These markers collectively suggest a macrophage population engaged in complex tissue-remodeling, inflammatory, and potentially pro-fibrotic activities at the end stage of NAFLD.
Homeostatic and Early Disease Macrophage States (Healthy and NAFLD):
- GPNMB: Glycoprotein non-melanoma B (also known as Osteoactivin) is expressed by various cell types including macrophages and is associated with tissue repair, anti-inflammatory responses, and potentially M2 macrophage polarization. Its presence in healthy and nafld macrophages may reflect a reparative or homeostatic function to maintain tissue integrity or mitigate early lipid-induced stress. GeneCards: GPNMB
- PLAUR: Urokinase-type plasminogen activator receptor, involved in cell migration, adhesion, and pericellular proteolysis. Macrophages utilize PLAUR for tissue remodeling and inflammatory responses. Its presence in early disease stages could indicate early immune responses and attempts at tissue reorganization. GeneCards: PLAUR
- This cluster represents macrophage phenotypes involved in initial responses to lipid accumulation and maintaining liver homeostasis.
Advanced Inflammatory and Metabolic Remodeling in NASH Cirrhosis:
- SLCO1B1 and SLCO1B3: Solute carrier organic anion transporter family members, crucial for the uptake of various endogenous substances (e.g., bile acids, bilirubin) and drugs. Their upregulation in macrophages in nash_cirrhosis might reflect an adaptation to altered bile acid metabolism or drug detoxification processes in the cirrhotic microenvironment, where macrophages could be participating in or responding to metabolic stresses. GeneCards: SLCO1B1, GeneCards: SLCO1B3
- CADM1: Cell adhesion molecule 1, involved in cell-cell adhesion and signaling. Its increased expression suggests changes in macrophage interactions with other liver cells (e.g., hepatocytes, stellate cells) within the fibrotic niche, potentially influencing tissue architecture and inflammation. GeneCards: CADM1
- GHR: Growth Hormone Receptor. Macrophages have been shown to express GHR, and growth hormone signaling can influence immune cell function. Its presence might indicate altered hormonal regulation impacting macrophage activity in cirrhosis. GeneCards: GHR
- These markers highlight a distinct macrophage phenotype in nash_cirrhosis characterized by altered metabolic transport, cell adhesion, and receptor signaling, which likely contribute to persistent inflammation and fibrosis.
Clinical or Translational Implications
The identification of condition-specific surfaceome markers on macrophages holds significant clinical and translational potential:
- Diagnostic and Prognostic Biomarkers: These surface markers could serve as novel diagnostic tools to non-invasively differentiate between various stages of liver disease (e.g., distinguishing early NAFLD from progressive NASH or end-stage disease) by analyzing macrophage populations in biopsy or circulating cells. They may also predict disease progression or response to therapy.
- Therapeutic Targets: Given their cell surface localization, these markers are excellent candidates for targeted therapies.
- Markers highly upregulated in nash_cirrhosis or end_stage_nafld macrophages (e.g., CD163L1, CD83, SLCO1B1/B3, CADM1) could be targeted with specific antibodies or cell-targeted drug delivery systems to modulate macrophage function, reduce inflammation, or halt fibrosis progression in advanced liver disease.
- Understanding the roles of markers expressed in healthy or nafld (e.g., GPNMB, PLAUR) might also open avenues for developing strategies to enhance protective macrophage functions in early disease stages.
- Understanding Pathogenesis: Further investigation into the functional roles of these specific surface proteins will deepen our understanding of macrophage heterogeneity and their precise contributions to liver disease pathogenesis, potentially revealing new mechanisms of disease progression or resolution. Experimental validation (e.g., using flow cytometry, immunohistochemistry, or functional assays) would be crucial to confirm protein expression and biological activity in these distinct macrophage populations.
12. Sub-population Specific Surfaceome Markers for T cell CD4+ in NASH Cirrhosis
[Analysis Visualization Results]...
Analysis Overview
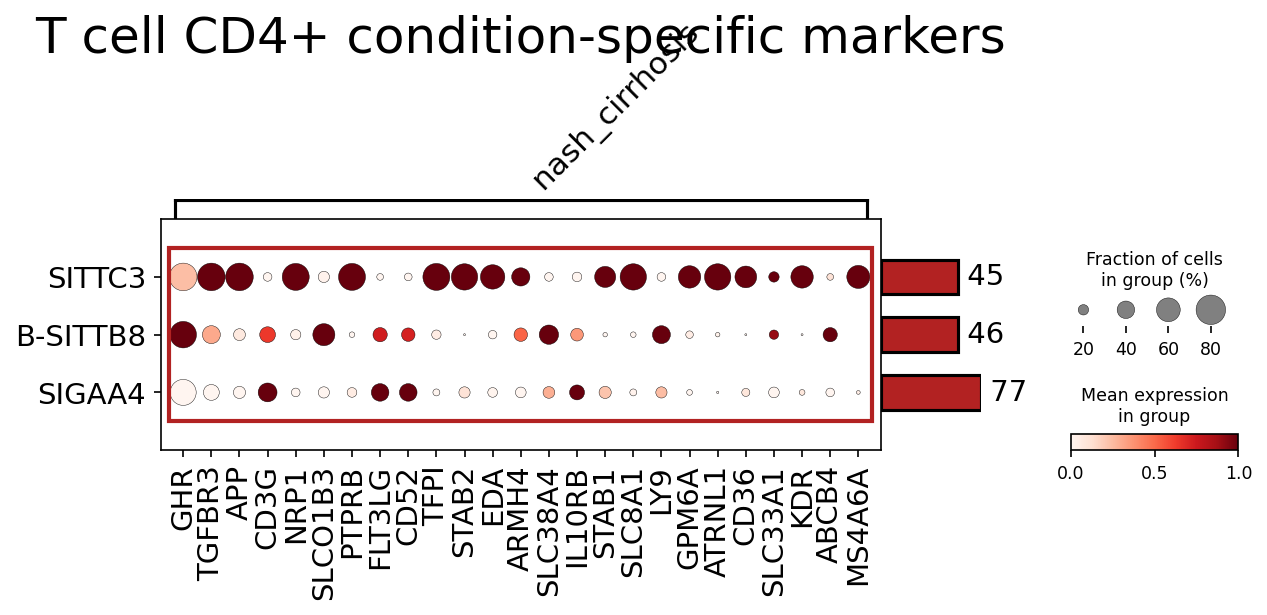
This analysis aimed to identify condition-specific surfaceome markers for T cell CD4+ cells. The provided dot plot visualizes surfaceome markers that distinguish three distinct sub-populations (labeled SITTC3, B-SITTB8, and SIGAA4) within the T cell CD4+ compartment, specifically observed under the nash_cirrhosis condition. This approach helps in understanding the functional heterogeneity of T cell CD4+ cells in the context of advanced liver disease.
Visual Summary
The dot plot displays the expression patterns of various surfaceome genes across the three identified T cell CD4+ sub-populations: SITTC3, B-SITTB8, and SIGAA4, within the nash_cirrhosis cohort.
- Axis Interpretation: The x-axis lists individual surfaceome marker genes, while the y-axis represents the three T cell CD4+ sub-populations. The "nash_cirrhosis" label indicates that these markers and sub-populations are being examined within this specific disease condition.
Dot Characteristics:
- The size of each dot corresponds to the Fraction of cells in group (%) expressing that marker within a given sub-population.
- The color intensity of each dot indicates the Mean expression in group for that marker, ranging from light red (low expression) to dark red (high expression).
- Sub-population Counts: The numbers on the right of the y-axis indicate the number of cells found in each sub-population: SITTC3 (45 cells), B-SITTB8 (46 cells), and SIGAA4 (77 cells).
Key Observations per Sub-population:
- SITTC3: Shows strong expression and high prevalence (large, dark red dots) for markers such as GHR (Growth Hormone Receptor), APP (Amyloid Beta Precursor Protein), CD3G (a pan T-cell marker), NRP1 (Neuropilin 1), CD52, STAB2 (Stabilin-2), IL10RB (IL-10 Receptor Subunit Beta), SLC8A1, LY9 (Lymphocyte Antigen 9), GPM6A, and CD36 (Scavenger Receptor Class B Type 1).
- B-SITTB8: Generally exhibits lower mean expression and prevalence compared to the other two sub-populations for most markers. Notable markers with moderate expression include GHR, CD3G, CD52, TFPI (Tissue Factor Pathway Inhibitor), IL10RB, LY9, and GPM6A.
- SIGAA4: This sub-population stands out with high expression and prevalence for a distinct set of markers, including TGFBR3 (TGF-beta Receptor Type 3), PTPRB (Receptor-Type Tyrosine-Protein Phosphatase Beta), FLT3LG (FMS-like Tyrosine Kinase 3 Ligand), EDA (Ectodysplasin A), ARMH4, SLC38A4, STAB1 (Stabilin-1), ATRNL1, CD36, SLC33A1, KDR (Kinase Insert Domain Receptor, also known as VEGFR2), ABCB4, and MS4A6A. TGFBR3, KDR, and STAB1 are particularly prominent in this group.
Biological Interpretation
The identification of these three distinct T cell CD4+ sub-populations within the nash_cirrhosis liver highlights significant functional heterogeneity in the immune response to advanced liver disease. Their unique surfaceome profiles suggest specialized roles in the disease microenvironment.
- SITTC3 (Activated/Metabolic Phenotype): The strong expression of CD3G confirms its T cell identity, while GHR and CD36 suggest a role in growth signaling and lipid metabolism, which are highly relevant in NASH pathogenesis. NRP1 is often associated with regulatory T cells (Tregs) and immune tolerance, or with T cells involved in angiogenesis. IL10RB indicates responsiveness to IL-10, an anti-inflammatory cytokine, suggesting a potential regulatory or modulated pro-inflammatory role. The collective profile suggests a T cell population actively engaged in the metabolic and inflammatory processes within the cirrhotic liver.
- B-SITTB8 (Basal/Modulated Phenotype): This sub-population generally shows lower overall marker expression, which might indicate a less activated or a more quiescent state, or perhaps a population with a unique, less transcriptionally active function. The presence of TFPI could imply interactions with the coagulation cascade or modulation of inflammation, given its role in inhibiting tissue factor activity.
- SIGAA4 (Pro-Fibrotic/Tissue Remodeling Phenotype): This sub-population exhibits a compelling surfaceome signature strongly associated with tissue remodeling, fibrosis, and angiogenesis:
- TGFBR3 (TGF-beta Receptor Type 3): High expression is highly significant given that TGF-beta signaling is a central driver of liver fibrosis and inflammation in NASH and cirrhosis PubMed Search: TGF-beta liver fibrosis. T cells expressing high levels of TGFBR3 could be highly responsive to fibrogenic signals or directly contribute to fibrosis by producing profibrotic cytokines.
- KDR (VEGFR2): While primarily an endothelial cell marker, its expression on T cells can indicate a pro-angiogenic role or an interaction with the vascular niche, which is crucial in the progression of liver fibrosis and portal hypertension in cirrhosis PubMed Search: KDR T cells angiogenesis liver disease.
- STAB1 and STAB2 (Stabilin-1/2): These scavenger receptors are typically expressed by liver sinusoidal endothelial cells and macrophages, involved in clearing extracellular matrix components and debris. Their presence on a T cell subset suggests a potential role in sensing or interacting with the altered extracellular matrix, possibly contributing to the fibrotic environment or exhibiting a specialized tissue-resident scavenger function. GeneCards: STAB1
- CD36: Also present in SITTC3, its co-expression with TGFBR3 and KDR in SIGAA4 could signify a T cell subset with altered lipid metabolism and crosstalk with fibrotic pathways.
The distinct profiles of these T cell CD4+ sub-populations suggest that the CD4+ T cell compartment in NASH cirrhosis is not monolithic but comprises functionally diverse subsets that likely contribute differentially to disease progression or resolution.
Clinical or Translational Implications
The identification of these sub-population-specific surfaceome markers offers significant clinical and translational potential, particularly for characterizing and potentially targeting T cell CD4+ subsets in NASH cirrhosis.
- Biomarker Discovery and Patient Stratification: The unique surfaceome signatures, particularly for the SIGAA4 population with its strong fibrotic and angiogenic associations (TGFBR3, KDR, STAB1), could serve as novel biomarkers to identify patients with distinct immune responses or disease progression profiles within NASH cirrhosis. These markers could aid in stratifying patients for personalized treatment strategies or monitoring disease activity.
Therapeutic Targets:
- The high expression of TGFBR3 on the SIGAA4 subset positions this population as a potential target for anti-fibrotic therapies. Modulating TGF-beta signaling specifically in these T cells could attenuate their contribution to liver fibrosis.
- Similarly, targeting KDR on these T cells could offer a strategy to modulate angiogenesis within the cirrhotic liver.
- The presence of CD36 suggests a metabolic link, potentially enabling interventions that alter fatty acid uptake or metabolism in T cells to influence disease progression.
- These surfaceome markers are particularly advantageous as therapeutic targets because they are accessible on the cell surface, making them amenable to antibody-based therapies or other cell-specific interventions.
- Experimental Validation and Functional Studies: These findings lay the groundwork for further experimental validation. Functional studies using these markers (e.g., flow cytometry-based sorting followed by *in vitro* or *in vivo* functional assays) are warranted to definitively elucidate the roles of SITTC3, B-SITTB8, and SIGAA4 sub-populations in NASH pathogenesis and progression. Understanding their precise contributions to inflammation, fibrosis, and tissue remodeling could lead to the development of highly specific immunomodulatory therapies for NASH cirrhosis.
13. Gene Set Enrichment Analysis (GSEA) of Liver Cell Types Across Disease Conditions
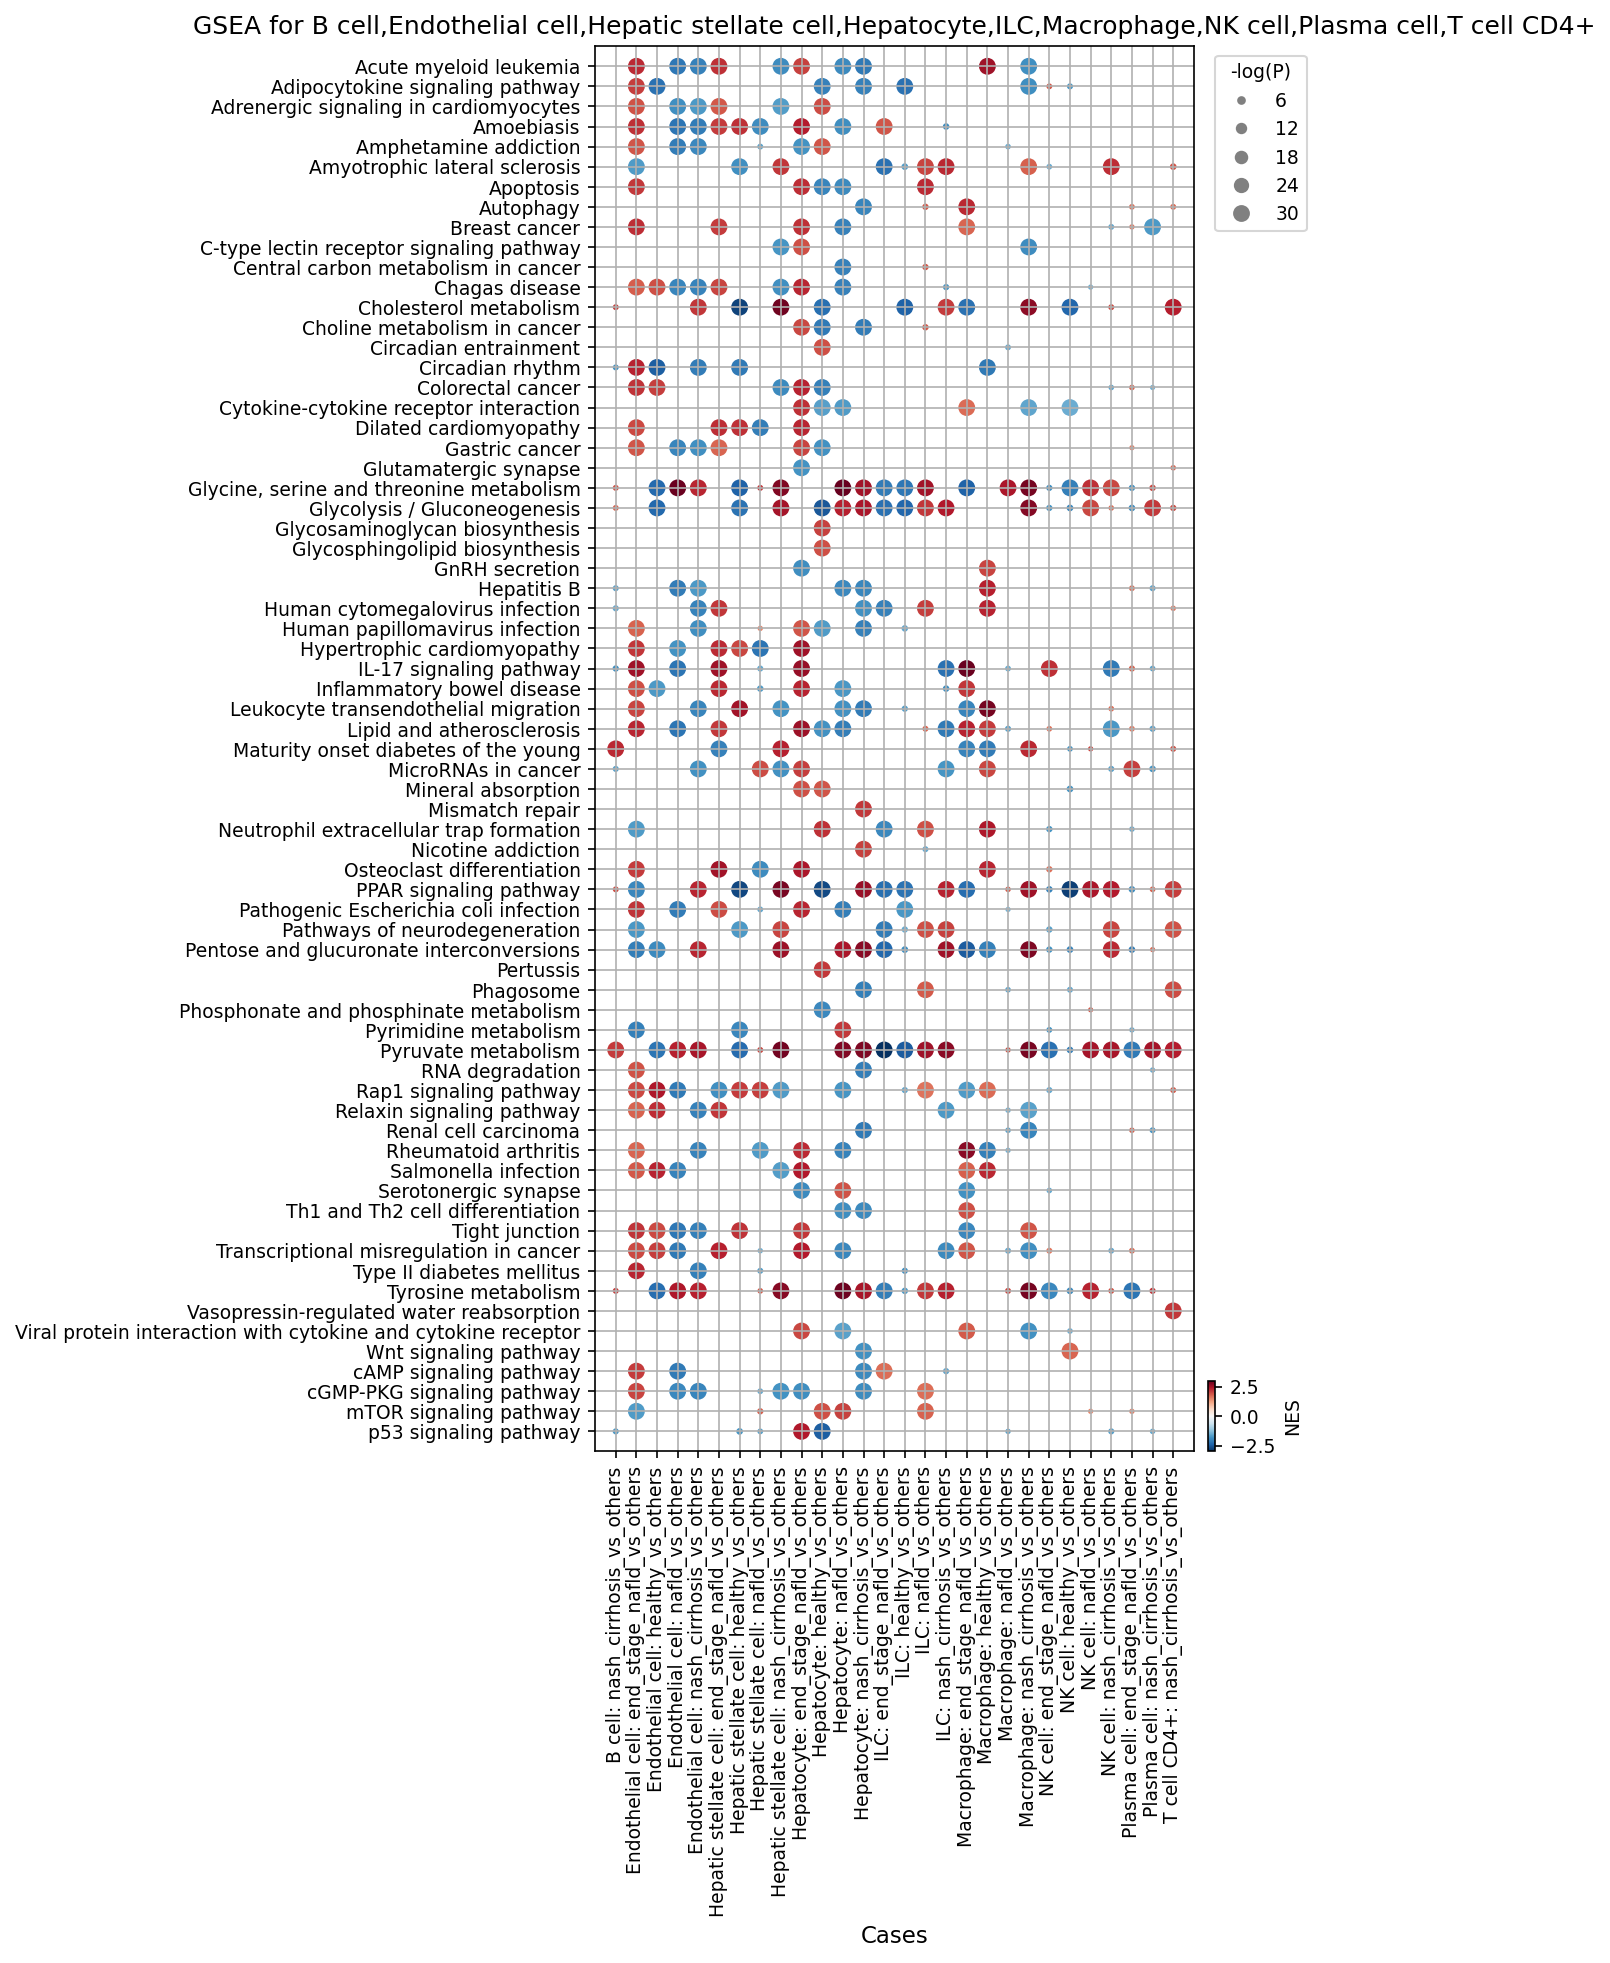
[Analysis Visualization Results]...
Analysis Overview
This analysis utilizes Gene Set Enrichment Analysis (GSEA) to identify biological pathways that are significantly enriched or depleted in various liver cell types (B cell, Endothelial cell, Hepatic stellate cell, Hepatocyte, ILC, Macrophage, NK cell, Plasma cell, T cell CD4+) when comparing specific disease conditions (NAFLD, NASH cirrhosis, end-stage NAFLD) against a reference (the average of all other conditions). The dot plot visualizes the Normalized Enrichment Score (NES) and the statistical significance (-log(p-value)) for the top 80 enriched pathways, offering insights into condition-associated biology and potential cell-state shifts within the liver microenvironment.
Visual Summary
The dot plot displays pathways on the y-axis and specific cell type-condition comparisons on the x-axis. The color of each dot indicates the Normalized Enrichment Score (NES), where red signifies positive enrichment (pathway genes generally upregulated) and blue signifies negative enrichment (pathway genes generally downregulated). The size of the dot reflects the statistical significance (-log(p-value)), with larger dots indicating greater significance.
Key observations include:
- Hepatocytes: Significant metabolic reprogramming is evident. Glycolysis / Gluconeogenesis and PPAR signaling pathway are notably downregulated in hepatocytes from NASH cirrhosis and end-stage NAFLD, but upregulated in healthy hepatocytes (when compared to all other conditions), highlighting a metabolic collapse in advanced disease. The p53 signaling pathway is upregulated in hepatocytes in NASH cirrhosis and end-stage NAFLD, suggesting cellular stress and potential DNA damage response.
- Macrophages: Phagosome, Cytokine-cytokine receptor interaction, and IL-17 signaling pathway are consistently and strongly upregulated in macrophages from NASH cirrhosis and end-stage NAFLD. Pathways related to bacterial infections (Pathogenic Escherichia coli infection, Salmonella infection) are also enriched in these conditions.
- Hepatic Stellate Cells (HSCs): Wnt signaling pathway is prominently upregulated in HSCs from NASH cirrhosis and end-stage NAFLD, which is a critical pathway in fibrosis. Apoptosis and mTOR signaling pathway also show upregulation in these conditions, suggesting activated cellular processes related to injury and proliferation.
- Endothelial Cells: Cytokine-cytokine receptor interaction is upregulated in endothelial cells in NASH cirrhosis and end-stage NAFLD, indicating endothelial activation and involvement in inflammation.
- T cells CD4+: Th1 and Th2 cell differentiation, Cytokine-cytokine receptor interaction, and IL-17 signaling pathway are upregulated in CD4+ T cells from NASH cirrhosis, pointing to active immune responses.
- General Trends: nash_cirrhosis_vs_others and end_stage_nafld_vs_others comparisons show the most widespread and pronounced pathway enrichments/depletions across multiple cell types, indicating a profound and pervasive pathological state in advanced liver disease compared to earlier NAFLD or healthy states. Pathways related to cancer (e.g., Acute myeloid leukemia, Colorectal cancer, Transcriptional misregulation in cancer) show scattered but significant enrichment, particularly in advanced disease states and certain cell types, reflecting the increased oncogenic risk associated with cirrhosis.
Biological Interpretation
The GSEA results provide a detailed molecular landscape of liver pathophysiology across NAFLD progression.
- Metabolic Dysregulation in Hepatocytes: The consistent downregulation of Glycolysis / Gluconeogenesis and PPAR signaling in advanced NAFLD/NASH cirrhosis hepatocytes points to a severe impairment of core metabolic functions. PPARs are crucial for lipid metabolism and glucose homeostasis, and their suppression exacerbates steatosis and metabolic dysfunction. Conversely, the upregulation of these pathways in healthy hepatocytes (vs. others) underscores their importance in a functional liver. The upregulation of p53 signaling indicates cellular stress, potentially from lipotoxicity, oxidative stress, or DNA damage, which can lead to cell cycle arrest or apoptosis, contributing to liver injury and inflammation in advanced disease.
- PPAR signaling pathway: https://www.genecards.org/Search/Keyword?query=PPAR+signaling+pathway
- Inflammation and Immune Activation: In macrophages, the upregulation of Phagosome, Cytokine-cytokine receptor interaction, and IL-17 signaling pathways signifies a highly inflammatory and phagocytically active state. This is consistent with the accumulation of pro-inflammatory macrophages (e.g., M1-like) in NAFLD/NASH, contributing to chronic inflammation and fibrosis. The enrichment of bacterial infection pathways suggests increased response to gut-derived bacterial products due to dysbiosis and increased gut permeability, a known contributor to liver inflammation and progression in chronic liver diseases. Similarly, upregulation of cytokine and IL-17 signaling in T cells further supports a robust inflammatory T-cell response in NASH cirrhosis.
- IL-17 signaling pathway in liver disease: https://pubmed.ncbi.nlm.nih.gov/?term=IL-17+signaling+liver+disease
- Fibrogenesis and HSC Activation: The strong upregulation of Wnt signaling pathway in Hepatic Stellate Cells (HSCs) in NASH cirrhosis and end-stage NAFLD is a critical finding, as Wnt signaling is a key driver of HSC activation, proliferation, and extracellular matrix production, leading to liver fibrosis. The upregulation of mTOR signaling in HSCs in these conditions, contrasting with its downregulation in hepatocytes, might indicate distinct roles in cell survival and proliferation specific to the fibrogenic process.
- Wnt signaling in liver fibrosis: https://pubmed.ncbi.nlm.nih.gov/?term=Wnt+signaling+hepatic+stellate+cells+fibrosis
- Endothelial Dysfunction: Endothelial cell activation, indicated by upregulated Cytokine-cytokine receptor interaction, plays a role in hepatic microcirculation changes, increased vascular permeability, and recruitment of immune cells, contributing to disease progression.
- Viral and Oncogenic Signals: Intermittent enrichment of viral infection pathways (e.g., Hepatitis B, Human cytomegalovirus) in immune cells (ILC, Macrophage, Plasma cell, NK cell) in NASH cirrhosis could suggest co-infections or a general heightened antiviral state that could exacerbate liver injury. The appearance of cancer-related pathways across various cell types in advanced disease conditions highlights the established link between chronic liver inflammation, fibrosis, and increased risk of hepatocellular carcinoma.
Clinical or Translational Implications
The distinct pathway signatures identified in specific cell types offer valuable insights for clinical applications:
- Biomarker Discovery: Pathway activities, such as downregulated Glycolysis / Gluconeogenesis in hepatocytes or activated Wnt signaling in HSCs, could serve as novel biomarkers for assessing disease severity, progression, or response to therapy in NAFLD/NASH.
Therapeutic Targets:
- Anti-fibrotic strategies: Targeting the Wnt signaling pathway in HSCs could be a promising anti-fibrotic strategy in NASH cirrhosis.
- Metabolic restoration: Developing therapies that restore hepatocyte metabolic function, potentially by modulating PPAR activity or glycolysis, could ameliorate steatosis and metabolic dysfunction.
- Immunomodulation: Interventions to dampen the pro-inflammatory macrophage and T cell responses, for example by targeting IL-17 signaling, could mitigate chronic inflammation in advanced disease.
- Disease Monitoring: Monitoring the activation of stress pathways (e.g., p53) in hepatocytes or phagocytic activity in macrophages could provide dynamic insights into disease activity and response to treatments.
- Personalized Medicine: Understanding cell-type-specific pathway dysregulation can inform personalized therapeutic approaches, tailoring interventions to the predominant pathological mechanisms in individual patients.
14. Discussion
The comprehensive single-cell analysis of human liver tissue across healthy, NAFLD, NASH cirrhosis, and end-stage NAFLD conditions reveals a dynamic and progressive cellular and molecular remodeling landscape. A primary observation is the significant reduction in hepatocyte proportions in advanced disease states (NASH cirrhosis and end-stage NAFLD), reflecting ongoing liver injury, cell death, and impaired regeneration (Section 4). Concurrently, there is a pronounced expansion of non-parenchymal cells, notably hepatic stellate cells and endothelial cells, consistent with increased fibrogenesis and angiogenesis characteristic of progressive liver disease (Section 4).
Immune cell populations undergo substantial shifts. Macrophages, a critical player in liver inflammation and fibrosis, exhibit a progressive increase in pro-inflammatory M1-like macrophages from healthy to end-stage NAFLD, while M2A macrophages remain abundant. M2B macrophages also show a significant increase in end-stage NAFLD, indicating their potential role in advanced fibrotic processes (Section 7, 8). The T cell compartment is also extensively reshaped in NASH cirrhosis, with significant increases in Th17 cells, ILC3(-), T_Naive cells, and ILC1s, alongside a concerning reduction in NK cell proportions (Section 5, 6). This collectively points to a heightened pro-inflammatory environment and potentially compromised innate immune surveillance.
Cell-cell interaction (CCI) analysis further illuminates the complexity of disease progression. While healthy liver exhibits a balanced network of integrin-mediated adhesion, metabolic signaling, and growth factor communication (Section 9), advanced disease stages (end-stage NAFLD and NASH cirrhosis) show a highly perturbed and activated CCI landscape (Section 10). Key pro-fibrotic and pro-inflammatory interactions become robustly upregulated, including hepatic stellate cell interactions with integrin-collagen complexes, TGFB1-TGFbeta_receptor1, SPP1-integrin/ADGRE5, CXCL12-CXCR4, and JAG1-NOTCH1. These interactions underscore the intense fibrogenic and inflammatory crosstalk driving advanced liver disease.
Gene Set Enrichment Analysis (GSEA) provides molecular detail, revealing significant metabolic reprogramming in hepatocytes, with downregulation of Glycolysis/Gluconeogenesis and PPAR signaling, coupled with upregulation of p53 signaling in advanced disease, indicative of metabolic collapse and cellular stress (Section 13). Macrophages show strong upregulation of phagosome, cytokine, and IL-17 signaling, along with bacterial infection pathways, reflecting their activated inflammatory and phagocytic roles. Hepatic stellate cells exhibit robust activation of Wnt signaling, a critical pathway for fibrosis, along with apoptosis and mTOR signaling. CD4+ T cells also show activated Th1/Th2 differentiation, cytokine, and IL-17 signaling pathways in NASH cirrhosis, further supporting a vigorous inflammatory immune response (Section 13).
Analysis of condition-specific surfaceome markers reveals distinct cell-type specific phenotypes. Hepatocytes in end-stage NAFLD upregulate LEPR and IFNGR1, while those in NASH cirrhosis express SLC10A1, IL15RA, NCAM2, and CDH23, suggesting metabolic and adhesion dysregulation (Section 3). Macrophages in end-stage NAFLD show high expression of CD163L1 and CD83, indicative of activated M2-like and inflammatory states, respectively. In NASH cirrhosis macrophages, SLCO1B1/B3 and CADM1 are prominent, hinting at altered metabolic transport and adhesion (Section 11). Notably, a distinct CD4+ T cell subset (SIGAA4) in NASH cirrhosis strongly expresses TGFBR3, KDR (VEGFR2), and STAB1, pointing to a direct involvement in pro-fibrotic and pro-angiogenic processes, a finding that may differ from generalized T cell responses and highlights specific functional subsets (Section 12). These granular findings collectively portray a liver microenvironment driven by chronic inflammation, progressive fibrosis, and metabolic failure, with distinct cellular players and molecular pathways orchestrating disease advancement.
Hypotheses:
- Progressive hepatocyte loss and metabolic dysfunction in advanced NAFLD/NASH are driven by sustained p53 activation and suppressed PPAR signaling.
- The sustained shift towards pro-inflammatory M1 macrophages, along with increased Th17 and ILC1 populations, creates a persistent inflammatory milieu that accelerates liver fibrosis in NASH cirrhosis.
- Activated Hepatic Stellate Cells, through heightened Wnt signaling and strong integrin-ECM interactions, are central mediators of the extensive fibrogenesis observed in end-stage NAFLD and NASH cirrhosis.
- Distinct CD4+ T cell subsets, particularly those expressing high TGFBR3 and KDR, play specific pro-fibrotic and pro-angiogenic roles, contributing to the progression of NASH cirrhosis.
- Dysregulated bile acid metabolism and altered drug transport, as evidenced by macrophage SLCO1B1/B3 upregulation, contribute to chronic inflammation and tissue remodeling in NASH cirrhosis.
Potential therapeutic targets:
- Wnt Signaling Pathway (in Hepatic Stellate Cells): The Wnt signaling pathway is strongly upregulated in Hepatic Stellate Cells (HSCs) in NASH cirrhosis and end-stage NAFLD. This pathway is a critical driver of HSC activation, proliferation, and extracellular matrix production, which are central to liver fibrosis. Evidence: GSEA analysis shows prominent upregulation of 'Wnt signaling pathway' in Hepatic stellate cells in 'nash_cirrhosis_vs_others' and 'end_stage_nafld_vs_others' (Section 13). Validation: Test specific Wnt pathway inhibitors (e.g., inhibitors of β-catenin or frizzled receptors) in *in vitro* activated HSCs and *in vivo* fibrotic liver models to assess their ability to reduce fibrosis and HSC activation.
- TGF-β Signaling (via TGFBR3 on CD4+ T cells and TGFB1-TGFbeta_receptor1 CCI): TGF-β signaling is a potent pro-fibrotic pathway. Both direct cell-cell interactions involving TGFB1-TGFbeta_receptor1 and high expression of TGFBR3 on a specific CD4+ T cell subset (SIGAA4) are highly active in advanced liver disease, suggesting multifaceted contributions to fibrosis. Evidence: CCI analysis shows robust 'TGFB1-TGFbeta_receptor1' interactions, particularly between Hepatic stellate cells and other cells, elevated in 'end_stage_nafld' and 'nash_cirrhosis' (Section 10). A distinct CD4+ T cell sub-population (SIGAA4) in 'nash_cirrhosis' shows high expression of 'TGFBR3' (Section 12). Validation: Develop antibodies or small molecule inhibitors against TGFBR3 or TGF-beta receptor 1. Evaluate their efficacy in reducing T cell-mediated pro-fibrotic responses and overall liver fibrosis in preclinical models.
- IL-17 Signaling Pathway (in Macrophages and CD4+ T cells): IL-17 signaling is consistently and strongly upregulated in both macrophages and CD4+ T cells in NASH cirrhosis and end-stage NAFLD, indicating its central role in driving chronic inflammation, which is a hallmark of NASH and critical for fibrosis progression. Evidence: GSEA analysis shows upregulation of 'IL-17 signaling pathway' in Macrophages and T cell CD4+ from 'nash_cirrhosis_vs_others' and 'end_stage_nafld_vs_others' (Section 13). Validation: Use anti-IL-17 antibodies or IL-17 receptor antagonists in NAFLD/NASH animal models to assess their impact on inflammatory markers, immune cell infiltration, and fibrosis progression.
- Macrophage CD83: CD83 is an activation marker specifically upregulated in macrophages in end-stage NAFLD, suggesting an intensely activated, potentially detrimental macrophage state in the most advanced disease stage. Targeting activated macrophages could mitigate chronic inflammation and liver damage. Evidence: 'CD83' is identified as a prominent macrophage surfaceome marker, showing high mean expression and prevalence almost exclusively in the 'end_stage_nafld' condition (Section 11). Validation: Investigate the functional role of CD83 on macrophages in NAFLD progression using *in vitro* gene knockdown or blocking antibodies, followed by *in vivo* studies in advanced fibrotic models.
- Hepatocyte LEPR and SLC10A1: LEPR indicates altered inflammatory and metabolic regulation in end-stage NAFLD hepatocytes. SLC10A1 (NTCP) reflects dysregulated bile acid homeostasis in NASH cirrhosis hepatocytes. Modulating these could address metabolic dysfunction and cholestasis in diseased hepatocytes. Evidence: 'LEPR' is a prominent surfaceome marker showing significantly high expression in end-stage NAFLD hepatocytes (Section 3). 'SLC10A1' shows strong enrichment in NASH cirrhosis hepatocytes (Section 3). Validation: Develop specific agonists or antagonists for LEPR or SLC10A1. Test their effects on hepatocyte function, lipid metabolism, bile acid transport, and inflammation in relevant *in vitro* and *in vivo* models of NAFLD/NASH.
Follow-up validation ideas:
- Quantify specific macrophage (M1, M2B, CD163L1+, CD83+), T cell (Th17, ILC1, NK, TGFBR3+, KDR+ CD4+ T cells) and HSC (activated markers) populations in liver biopsies from NAFLD/NASH patients versus healthy controls using flow cytometry or immunostaining.
- Map the localization and expression levels of key surface markers (e.g., LEPR, SLC10A1, CD163L1, TGFBR3, KDR, STAB1) and CCI ligand-receptor pairs (e.g., TGFB1-TGFbeta_receptor1, SPP1-integrin) to specific cell types and their microenvironmental niches within diseased liver tissue sections using spatial transcriptomics or proteomics.
- Use primary liver cell co-culture models (hepatocytes, HSCs, macrophages, T cells) to functionally validate identified CCIs (e.g., TGFB1-TGFbeta_receptor1, CXCL12-CXCR4) by blocking one component and observing downstream effects on inflammation, fibrosis, or metabolic function.
- Employ mouse models of NAFLD/NASH to study the causal roles of highly enriched pathways (e.g., Wnt signaling in HSCs, p53 in hepatocytes, IL-17 signaling in macrophages/T cells) or specific cell surface markers by genetic knockout/overexpression or targeted pharmacological inhibition.
- Confirm gene and protein expression levels of key markers (e.g., LEPR, SLC10A1, CD163L1, TGFBR3, KDR) in sorted cell populations from patient samples using targeted qPCR and Western blot to validate single-cell RNA-seq findings at the protein level.
Limitations:
This report provides a snapshot of gene expression and cellular composition, and while suggestive of disease mechanisms, it does not directly infer causality. The interpretation of findings relies on existing biological knowledge of gene and pathway functions, which may require further contextualization in liver disease. Some 'unassigned' cell populations remain, potentially harboring rare yet significant cell states. Furthermore, the use of a p-value cutoff of 0.1 for highlighting significance in some population analyses indicates borderline findings that warrant careful consideration and further validation. Experimental validation is crucial to confirm these findings and establish their functional relevance in disease progression.
15. Query List
- Show UMAPs including condition, sample, major cell type, minor cell type, and celltype_subset in 2 columns and save it.
- Show major cell type scores on UMAP and save it.
- Show the overall Celltype_subset marker expression dot plot and save it. Keep target_cell as None and keep the other arguments at their default values.
- Show a population bar plot for minor cell types and save it.
- Show a subset population barplot for T cells and save it.
- Show boxplots for T cell subset populations, highlighting significant differences between conditions, and save it. Set ncols appropriately based on the total number of panels.
- Show a subset population barplot for macrophages and save it.
- Show boxplots for macrophage subset populations, highlighting significant differences between conditions, and save it. Set ncols appropriately based on the total number of panels.
- Show cell-cell interactions by condition and save the result. Select at most 80 cell-cell interactions for each condition.
- Find and show dot plots of statistically significant differences in cell-cell interactions among major immune and stromal cells by condition, and save it. Set max_n_items_per_group = 25.
- Extract condition-specific surfaceome markers for Macrophage and show a dot plot, saving it. Include up to 50 surfaceome markers per condition.
- Extract condition-specific surfaceome markers for T cell CD4+ and show a dot plot, saving it. Include up to 50 surfaceome markers per condition.
- Show a dot plot of Gene Set Enrichment Analysis results for B cell, Endothelial cell, Hepatic stellate cell, Hepatocyte, ILC, Macrophage, NK cell, Plasma cell, T cell CD4+ and save it. Use the RdBu_r color map and set n_pws_to_show = 80.