Single-Cell Transcriptomic Analysis of Nonalcoholic Fatty Liver Disease Progression Reveals Cell-Type-Specific Mechanisms and Therapeutic Targets
This report presents a comprehensive single-cell analysis of human liver tissue across the spectrum of Nonalcoholic Fatty Liver Disease (NAFLD) progression. UMAP analysis distinctly separates healthy from diseased states, revealing significant cellular and transcriptional reprogramming. Progression to NASH and cirrhosis is marked by notable shifts in cell type proportions, including increased macrophages, activated hepatic stellate cells, and specific T cell subsets. Multi-omic integration of marker expression, cell-cell interactions, and pathway enrichment analyses highlights dysregulated metabolic, inflammatory, and fibrotic processes across hepatocytes, immune, and stromal cells, identifying key molecular players and potential therapeutic targets at each disease stage.
Contents
- Dataset overview
- UMAP Analysis of Single-Cell Transcriptomic Data Across Liver Conditions and Cell Types
- Cell Type Score Visualization and Annotation Validation on UMAP
- Marker Expression Dot Plot for Cell Type Subsets
- Minor Cell Type Population Analysis Across NAFLD Progression Stages
- T Cell and Innate Lymphoid Cell Subpopulation Shifts in Nonalcoholic Fatty Liver Disease Progression
- Analysis of Lymphoid Cell Subset Proportions Across NAFLD Progression Stages
- Macrophage Subset Population Shifts Across NAFLD Progression
- Macrophage Subset Population Changes Across NAFLD Progression
- Cell-Cell Interaction Patterns in NAFLD Progression
- Condition-Specific Cell-Cell Interaction Patterns in NAFLD Progression
- Hepatocyte Surfaceome Marker Expression Across NAFLD Progression
- Macrophage Surfaceome Marker Analysis Across NAFLD Progression
- Hepatic Stellate Cell Surfaceome Markers Across NAFLD Progression
- T cell CD4+ Condition-Specific Surfaceome Markers in NASH Cirrhosis
- Gene Ontology (GSA) Analysis of Hepatocytes Across NAFLD Progression
- Gene Set Enrichment Analysis (GSEA) Across Liver Cell Types and Disease Stages in NAFLD Progression
- Discussion
- Query List
0. Dataset overview
Dataset Summary
- 이 데이터셋은 69,730개의 세포와 29,269개의 유전자로 구성된 단일 세포 RNA-seq 데이터입니다.
- 종은 사람(human)이며, 조직은 간(Liver)에서 유래했습니다.
- 주요 연구 조건은 NAFLD (Nonalcoholic fatty liver disease), NASH (Nonalcoholic steatohepatitis) 및 간경변증(cirrhosis)의 진행 단계를 포함하며, 건강한(healthy) 대조군도 있습니다.
- 데이터에는 샘플 ID, 상태, 조직, 환자 ID, 성별, 연령 등의 임상 정보와 다양한 세포 유형에 대한 주석이 포함되어 있습니다.
- 세포 유형은 주요 세포 유형(celltype_major), 세부 세포 유형(celltype_minor), 그리고 더 상세한 세포 아형(celltype_subset)으로 분류됩니다.
Cell Types
- celltype_major: Liver Epithelial cell, Endothelial cell, T cell, Myeloid cell, unassigned, Stromal cell, B cell
- celltype_minor: Hepatocyte, Endothelial cell, NK cell, T cell CD4+, ILC, Macrophage, unassigned, Hepatic stellate cell, Plasma cell, B cell, T cell CD8+, Fibroblast
- celltype_subset: Hepatocyte, Endothelial cell, NK cell, T cell (Tfh), T cell (Th22), ILCreg, Macrophage (M2A), Endothelial tip cell, unassigned, Hepatic stellate cell, ILC1, Macrophage (M1), Lymphatic Endothelial cell, ILC3 (NCR-), ILC3 (NCR+), ILC2, Macrophage (M2C), Plasma cell, B cell (MZ), Macrophage (M2B), T cell (Th1), LTI, T cell (Naive), B cell (Follicular), T cell (Th9), T cell (Th17), T cell (Treg), Macrophage (M2D), T cell (Th2), B cell (Breg), B cell (Memory), T cell (Cytotoxic), Fibroblast
Precomputed Results
- 다음을 포함한 사전 계산된 분석 결과가 저장되어 있습니다:
- 세포-세포 상호작용 (CCI) 결과 (조건별, 샘플별)
- 차등 발현 유전자 (DEG) 결과 (세포 유형별, 대조군 대비)
- 유전자 세트 농축 분석 (GSEA) 결과 (세포 유형별, 대조군 대비)
- 유전자 온톨로지 (GO/GSA) 결과 (세포 유형별, 대조군 대비)
- 종양 식별 및 CNV 추정치는 이 데이터셋에 대해 계산되지 않았습니다.
1. UMAP Analysis of Single-Cell Transcriptomic Data Across Liver Conditions and Cell Types
[Analysis Visualization Results]...
Analysis Overview
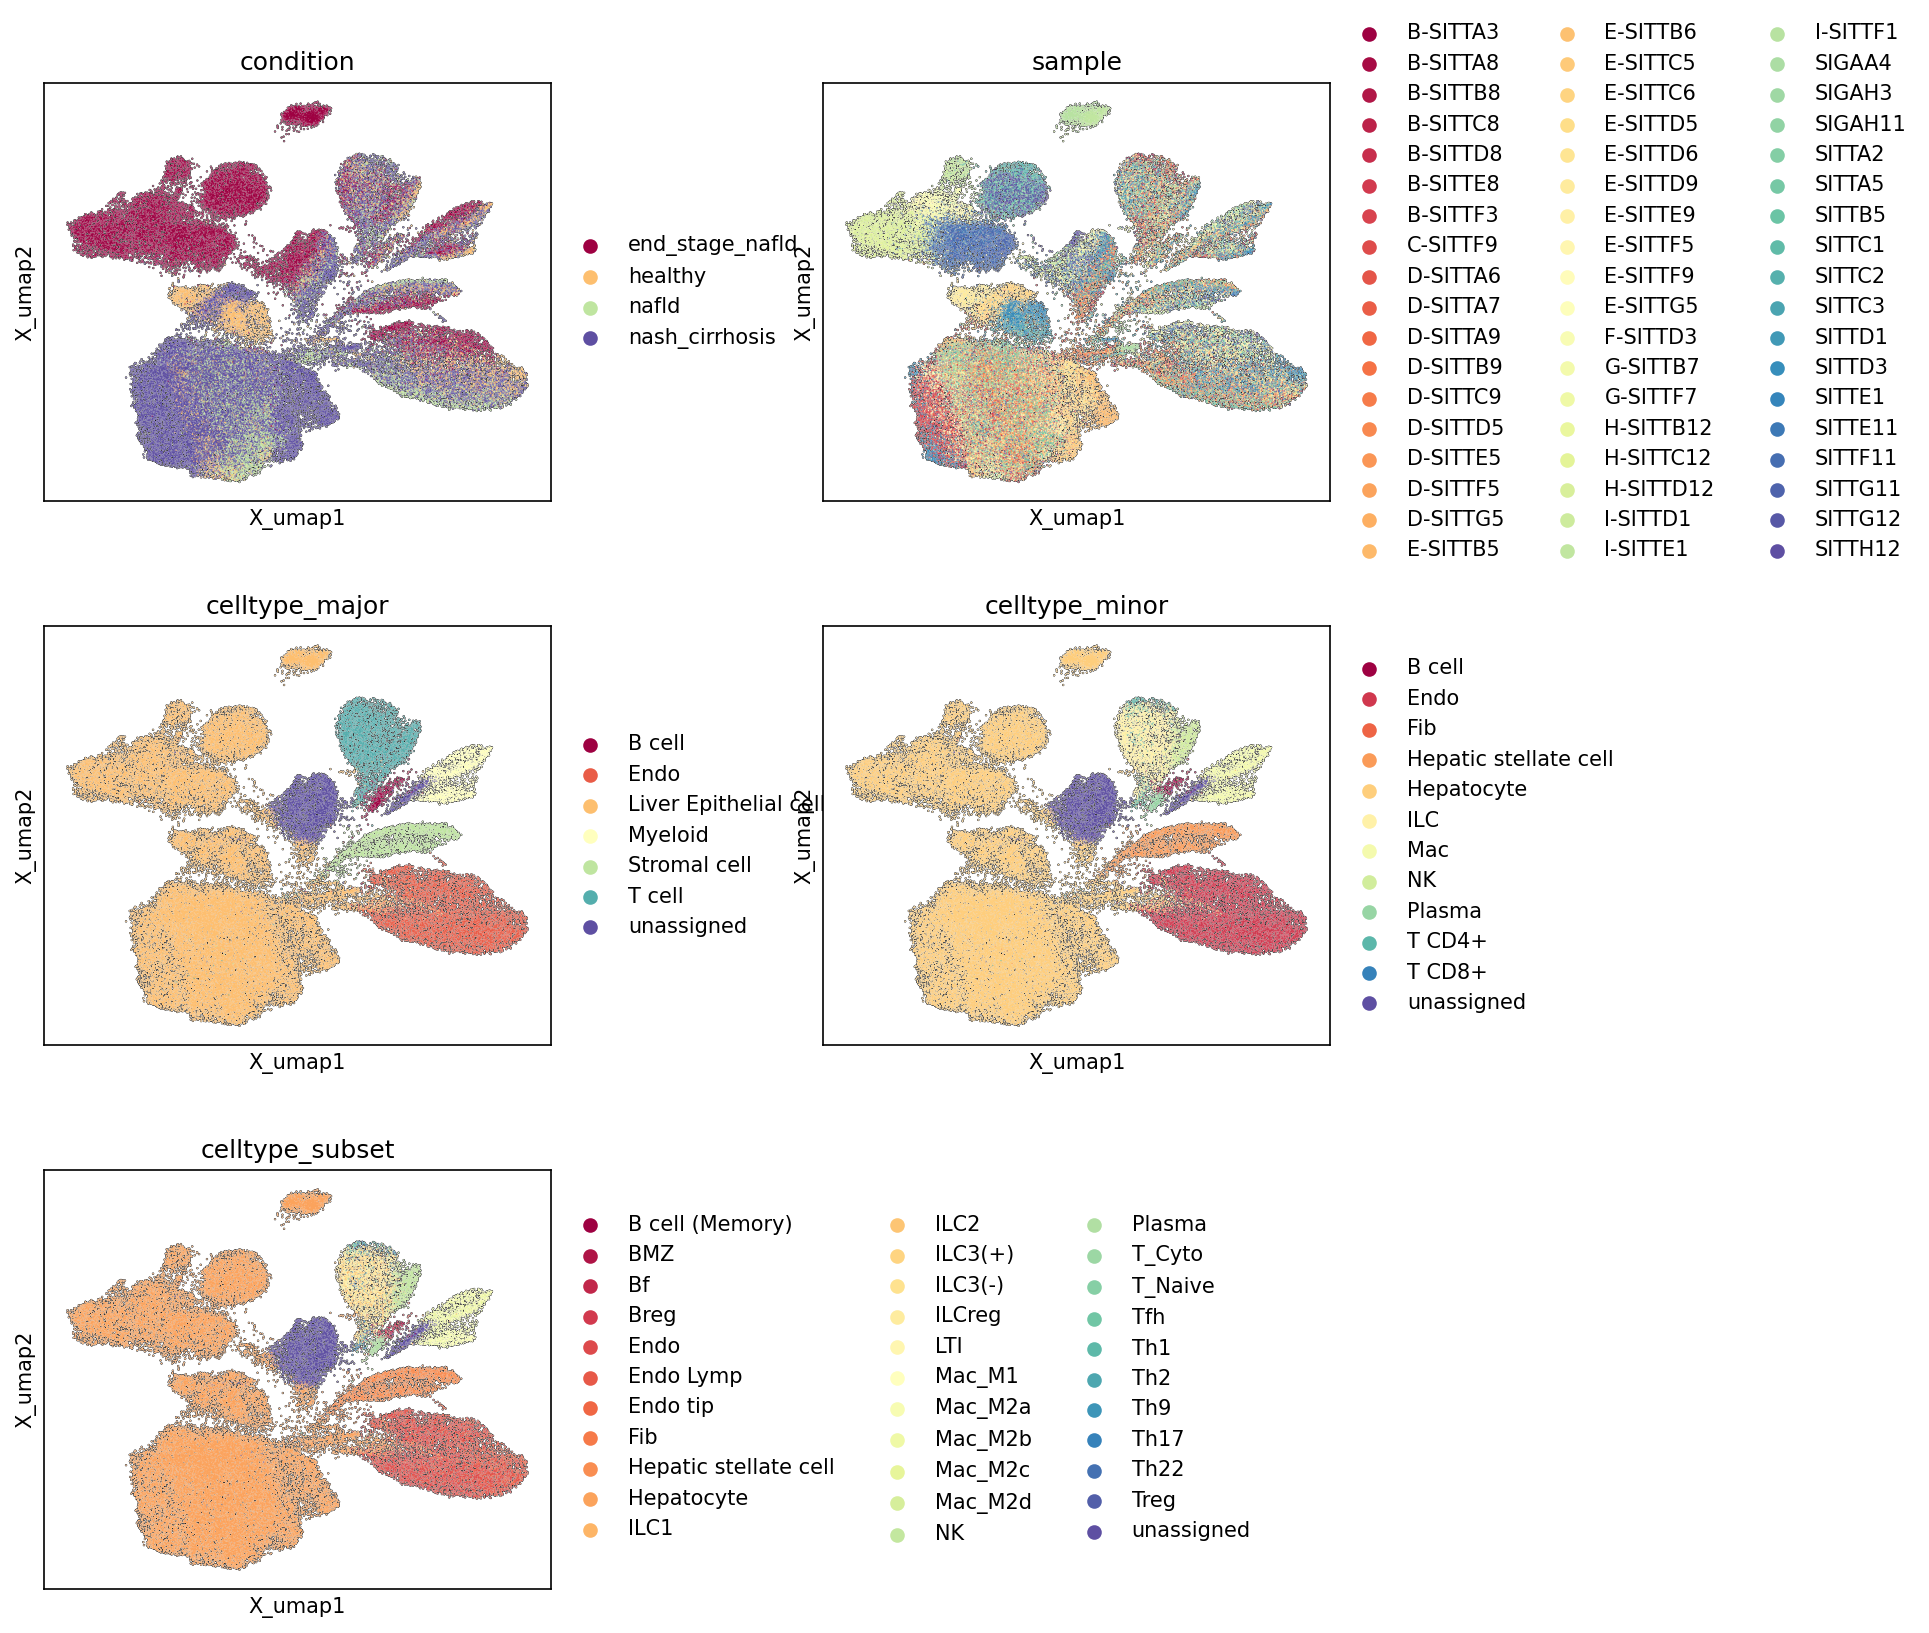
This analysis presents Uniform Manifold Approximation and Projection (UMAP) plots, visualizing the single-cell RNA-seq data from human liver tissue. The UMAPs display the relationships between cells based on their gene expression profiles, colored by various metadata features: condition, sample, celltype_major, celltype_minor, and celltype_subset. The primary objective is to assess the overall data structure, the separation of distinct biological conditions, and the quality and resolution of cell type annotations within the context of Nonalcoholic fatty liver disease (NAFLD) progression.
Visual Summary
Condition UMAP:
The UMAP colored by condition shows a clear separation between healthy and diseased states. Cells from healthy individuals (light orange) primarily cluster on the central-left side of the UMAP, forming distinct populations. In contrast, cells from advanced disease stages, end_stage_nafld (maroon) and nash_cirrhosis (dark purple), largely overlap and occupy several distinct regions, notably in the upper-left and lower-right, suggesting shared transcriptional changes in severe liver pathology. nafld cells (light green) show a more diffuse distribution, partially overlapping with healthy clusters and partially with the more advanced disease clusters, reflecting its intermediate position in disease progression.
Sample UMAP:
The UMAP colored by sample demonstrates that cells from different individual samples are generally well-integrated across the major clusters. While some local enrichment of specific samples can be observed, there are no large, distinct clusters solely composed of cells from a single sample. This suggests that while there might be some sample-specific biological variation, batch effects do not dominate the global structure of the UMAP.
Cell Type UMAPs (Major, Minor, Subset):
These UMAPs progressively reveal the cellular heterogeneity and the resolution of cell type annotations:
- celltype_major: Major cell types such as Liver Epithelial cell (orange, predominantly Hepatocytes), Myeloid cell (light yellow), Endothelial cell (red-orange), and T cell (light blue) form largely distinct and well-separated clusters. This indicates a robust initial clustering and annotation of broad cell populations. unassigned cells (dark purple) are sparse, suggesting good overall classification.
- celltype_minor: This level provides further granularity, with Hepatocyte (orange) as the dominant epithelial population, and immune cells resolving into Macrophage (light yellow), NK cell (light green), T cell CD4+ (light blue), and T cell CD8+ (dark blue). Hepatic stellate cell (fibroblast-like, orange-red) and Endothelial cell (red-orange) also form distinct populations.
- celltype_subset: The highest resolution of annotation showcases numerous specialized cell subsets. Macrophage populations differentiate into several activation states (e.g., Mac_M1, Mac_M2a, Mac_M2b, Mac_M2c, Mac_M2d). Various T cell subtypes are resolved (e.g., Tfh, Th1, Th2, Th9, Th17, Th22, Treg, T_Naive, T_Cyto), as are different B cell subsets (e.g., B cell (Memory), BMZ, Bf, Breg). Endothelial cell populations are further divided (e.g., Endo, Endo Lymp, Endo tip), and ILCs into ILC1, ILC2, ILC3(+), ILC3(-). This level of detail confirms a comprehensive and fine-grained cellular atlas.
Biological Interpretation
The UMAP visualizations provide fundamental insights into the cellular landscape of the human liver during NAFLD progression.
- Disease Progression Signature: The clear separation of healthy cells from end_stage_nafld and nash_cirrhosis cells on the condition UMAP suggests significant transcriptional reprogramming associated with advanced liver disease. The intermediate positioning and dispersion of nafld cells are consistent with the progressive nature of the disease, where nafld can advance to nash_cirrhosis and end_stage_nafld. This indicates that the dataset effectively captures the molecular changes underlying disease severity.
- Robust Cell Type Annotation: The hierarchical cell type annotations, from celltype_major to celltype_subset, demonstrate a high degree of confidence in cell identity assignment. Each level of annotation reveals progressively finer substructures within the UMAP, where biologically distinct cell types and states form coherent clusters. This robust annotation is crucial for downstream differential expression and pathway analyses.
- Immune Cell Heterogeneity in Liver Disease: The detailed resolution of Myeloid and T cell populations into numerous subsets (e.g., specific macrophage activation states and diverse T helper and cytotoxic T cell subsets) is particularly relevant to the study of NAFLD and NASH. These immune cell subtypes play critical roles in inflammation, fibrosis, and immune regulation within the liver, and their specific changes across disease conditions will be key areas for further investigation.
- Key Non-Immune Cells: The clear delineation of Hepatocytes (the primary functional cells of the liver), Endothelial cells (forming the liver vasculature), and Hepatic stellate cells (critical for fibrosis progression) provides the foundation for studying their specific contributions and responses to disease development.
Annotation Notes
The UMAPs collectively provide strong evidence for high-quality cell type annotation and a coherent representation of disease states within the dataset. The clear separation of conditions and cell types in the embedding space suggests that the single-cell data adequately captures biological variability and cellular identities. The unassigned cell populations are minimal, indicating comprehensive cell type coverage. This robust foundation is essential for reliable downstream analyses focusing on disease mechanisms or therapeutic targets.
2. Cell Type Score Visualization and Annotation Validation on UMAP
[Analysis Visualization Results]...
Analysis Overview
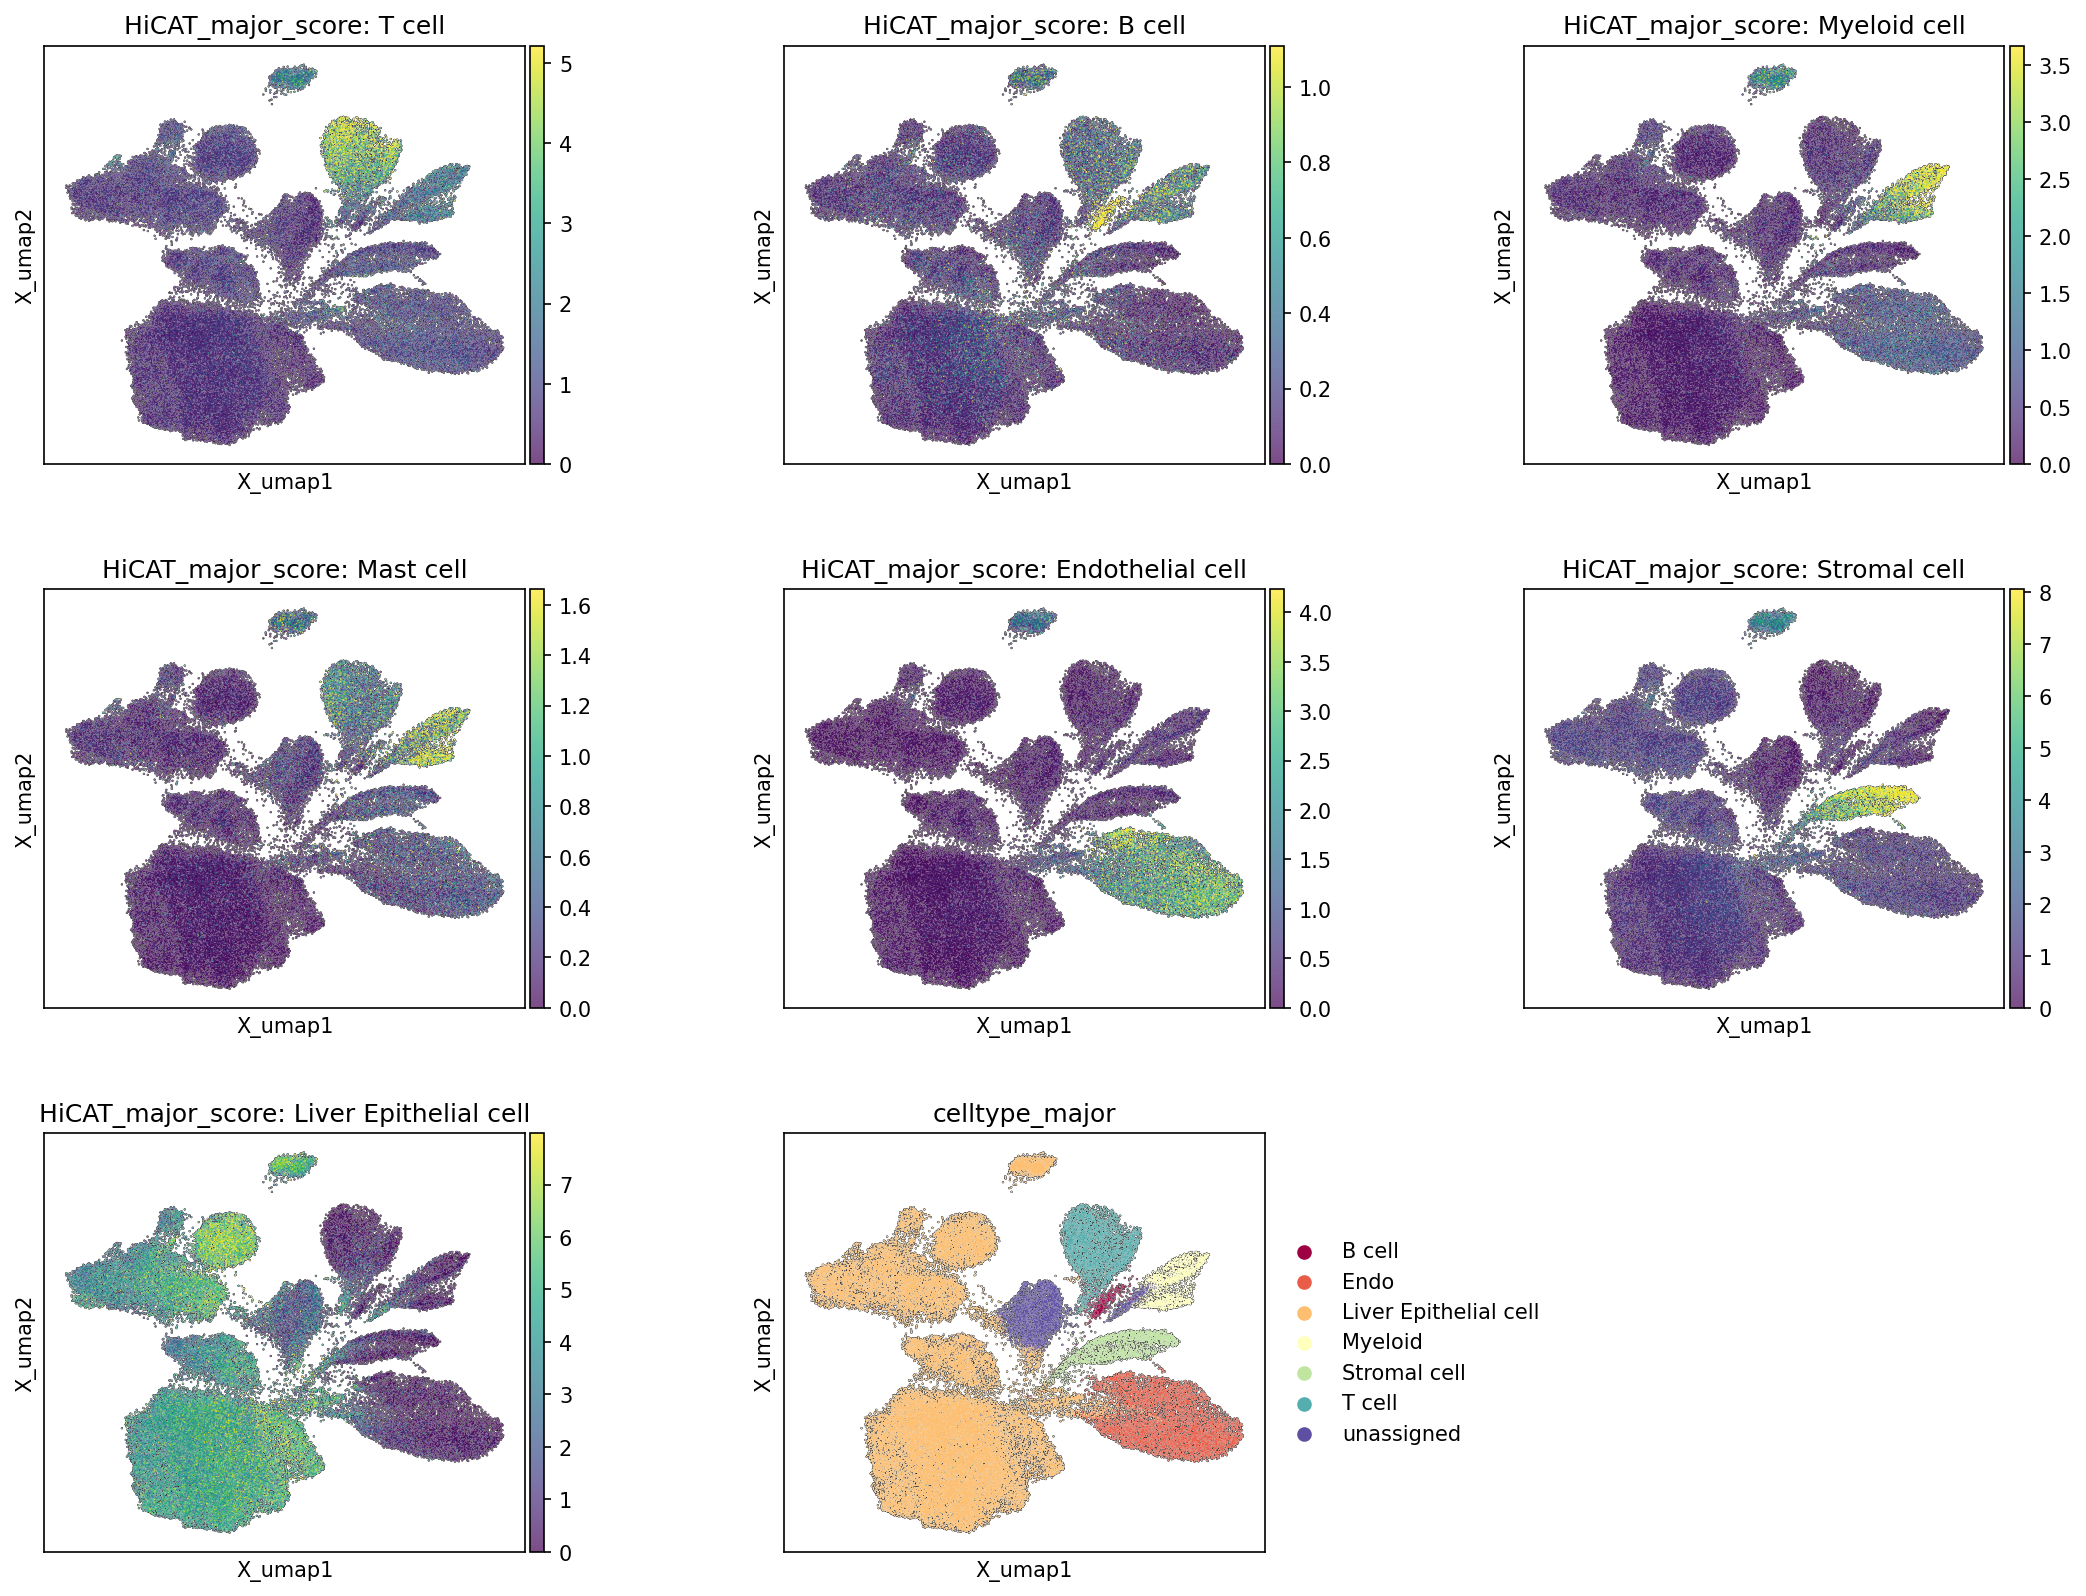
This analysis visualizes the HiCAT_major_score for various major cell types across a Uniform Manifold Approximation and Projection (UMAP) embedding of single-cell RNA-seq data. The HiCAT_major_score represents a continuous signature score indicating the likelihood of a cell belonging to a specific major cell type, based on its gene expression profile. These plots are compared with a final UMAP colored by the discrete celltype_major annotations, which are the final assigned labels for each cell. This comparison serves to validate the quality and consistency of the cell type annotations with the underlying molecular signatures.
Visual Summary
The UMAP embedding displays the overall cellular landscape, characterized by several distinct clusters and branches. The plots show:
- Individual HiCAT_major_score UMAPs (7 plots): Each plot displays the UMAP with cells colored according to their HiCAT_major_score for a specific cell type. High scores (yellow/green) indicate strong enrichment for that cell type's gene expression signature, while low scores (purple/dark blue) suggest a low likelihood of belonging to that type.
- T cell score: High scores are concentrated in a specific cluster located in the upper-central region of the UMAP.
- B cell score: High scores delineate a distinct, smaller cluster in the upper-right region.
- Myeloid cell score: A prominent region of high scores is observed in a cluster located towards the mid-right.
- Mast cell score: A very small, yet distinct, cluster with high Mast cell scores is visible at the very top-center of the UMAP, separate from other major clusters.
- Endothelial cell score: High scores are observed in a cluster located in the lower-central part of the UMAP.
- Stromal cell score: A well-defined cluster with high scores is found in the middle-right region.
- Liver Epithelial cell score: The largest and most prominent region of high scores occupies a large, diffuse cluster in the lower-left and central parts of the UMAP.
- celltype_major UMAP (1 plot): This final UMAP shows cells colored by their discrete celltype_major labels (e.g., "Liver Epithelial cell," "Endothelial cell," "T cell," "Myeloid cell," "Stromal cell," "B cell," and "unassigned").
- The various clusters identified by high HiCAT_major_score in the individual plots correspond clearly to the discretely labeled clusters in the celltype_major plot. For example, the region with high T cell score is colored "T cell" in the final plot.
- There is a distinct "unassigned" cluster (dark blue/purple) which shows generally low scores across most HiCAT_major_score plots, suggesting these cells do not strongly align with the defined major cell type signatures. The small cluster with high Mast cell scores appears to fall largely within or adjacent to this "unassigned" population in the celltype_major plot, indicating that Mast cells might be a specific subtype not given a distinct top-level celltype_major annotation.
Biological Interpretation
The consistent mapping between the continuous HiCAT_major_score distributions and the discrete celltype_major assignments provides strong biological validation for the cell type identification in this liver single-cell dataset.
- Robust Cell Type Identification: The distinct spatial separation of high-score regions for each major cell type on the UMAP confirms that these populations possess unique and well-defined gene expression signatures. This indicates a high quality of cell type annotation, where the assigned labels accurately reflect the underlying molecular characteristics of the cells.
- Expected Liver Cell Composition: The identification of key liver cell populations, including Liver Epithelial cells (likely hepatocytes, given the celltype_minor context), Endothelial cells, Stromal cells (including Hepatic stellate cells and Fibroblasts from celltype_minor), and various Immune cells (T cells, B cells, Myeloid cells, NK cells from celltype_minor), aligns well with the known cellular complexity of the human liver, especially in the context of NAFLD progression where immune and stromal components are highly active.
- Granularity of Annotation: The presence of a HiCAT_major_score for "Mast cell" that defines a small, distinct cluster, which is not explicitly labeled as a celltype_major but might be part of Myeloid cell or unassigned, highlights the challenges and decisions involved in hierarchical cell type annotation. This suggests that while a Mast cell signature exists, it might be considered a subpopulation within a broader Myeloid cell category or left unassigned at the major level due to its size or ambiguity.
Annotation Notes
- The HiCAT_major_score plots provide excellent visual evidence for the quality and distinctness of the celltype_major annotations. Each major cell type forms a coherent and spatially separated cluster on the UMAP, with high signature scores correlating precisely with their assigned discrete labels.
- The "unassigned" cluster generally shows low scores across all specific HiCAT_major_score plots, indicating that these cells do not strongly match the defined major cell type signatures, thus justifying their 'unassigned' status.
- A notable observation is the presence of a distinct HiCAT_major_score for "Mast cell" which forms a small, localized cluster. While a clear Mast cell signature is detected, "Mast cell" is not explicitly listed as one of the celltype_major categories. This particular cluster visually appears to be part of the unassigned population or potentially a small, distinct sub-cluster within the Myeloid cell population as depicted in the final celltype_major plot. This suggests the annotation scheme prioritizes broader categories for celltype_major, potentially grouping less abundant or more specific immune cell types within a broader category or as "unassigned" at this level.
3. Marker Expression Dot Plot for Cell Type Subsets
[Analysis Visualization Results]...
Analysis Overview
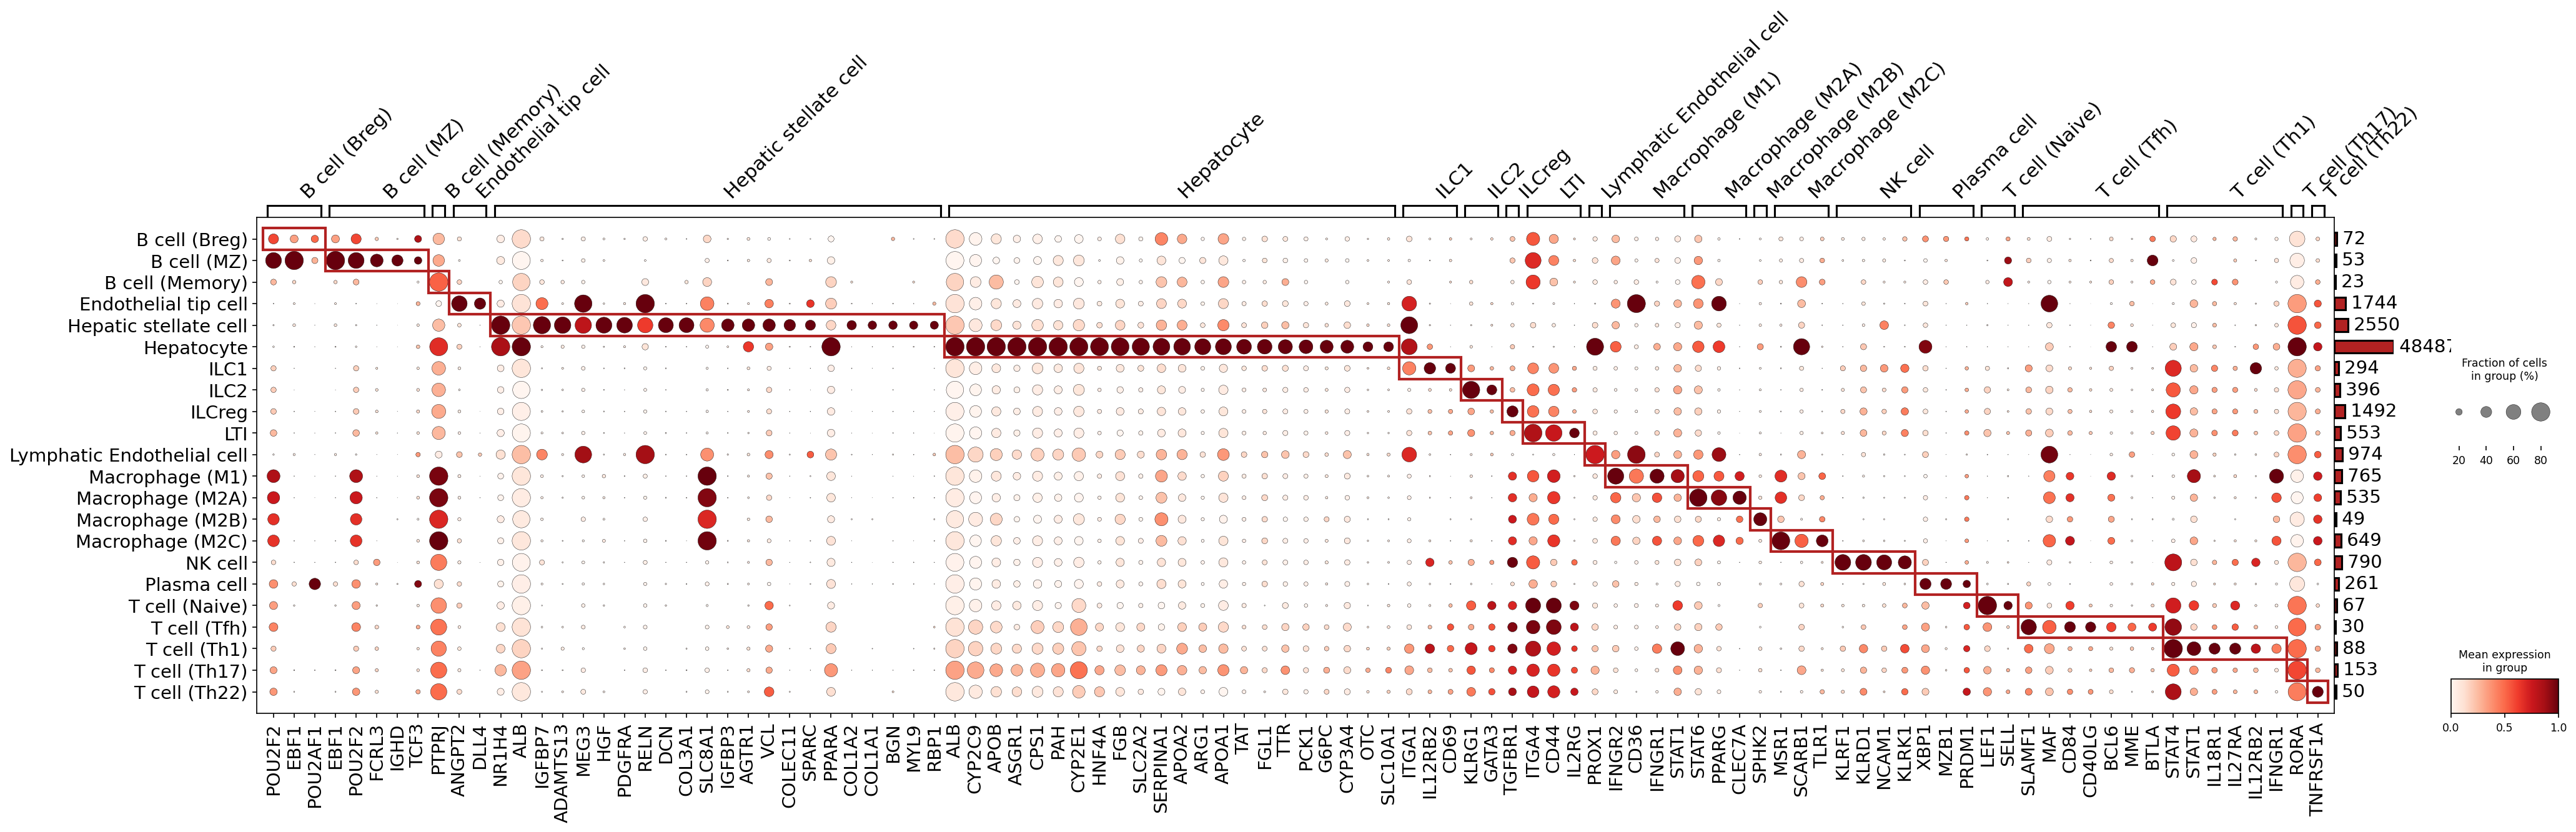
This analysis presents a marker expression dot plot for the celltype_subset annotations derived from the single-cell RNA-seq data. The plot visualizes the expression of a curated set of marker genes across various identified cell subtypes in the Liver tissue. Each row represents a distinct cell subtype (celltype_subset), and each column represents a marker gene. The size of the dot corresponds to the fraction of cells within that subtype expressing the gene, while the color intensity indicates the mean expression level of the gene in that subtype. The primary goal of this analysis is to validate and confirm the assigned cell type identities based on their specific marker gene expression patterns, serving as an annotation quality control step.
Visual Summary
The dot plot exhibits a striking diagonal pattern, where distinct blocks of marker genes are highly expressed and enriched within their corresponding celltype_subset groups. This clear segregation of gene expression patterns across cell types suggests robust and well-defined cell annotations.
- Distinct Cell Clusters: Major cell lineages, such as B cells, Endothelial cells, Hepatic stellate cells, Hepatocytes, Innate Lymphoid Cells (ILCs), Macrophages, NK cells, Plasma cells, and T cells, form visually separated clusters characterized by unique marker gene signatures.
- Specific Marker Enrichment: Within these clusters, specific marker genes show high mean expression (darker red dots) and high detection rates (larger dot sizes) in their assigned cell types, with minimal expression in other, unrelated cell types.
- Subtype Resolution: Even closely related cell subtypes, such as B cell (Breg), B cell (MZ), and B cell (Memory), or the various Macrophage (M1, M2A, M2B, M2C) and T cell (Naive, Tfh, Th1, Th17, Th2) subsets, display unique marker profiles or differential expression of shared markers, indicating successful resolution of these nuanced identities.
- Cellular Abundance: The bar chart on the right indicates the number of cells per group, showing that Hepatocytes are the most abundant (4848 cells), followed by Hepatic stellate cells (2550) and Endothelial tip cells (1744). All plotted cell types exceed the minimum cell count threshold (20 cells), ensuring reliable marker detection.
Biological Interpretation
The observed marker expression patterns strongly support the assigned celltype_subset annotations and provide high confidence in the identified cell populations within the liver microenvironment.
- Hepatocytes: Show robust and exclusive expression of a comprehensive panel of classical hepatocyte markers, including *ALB* (albumin), *CYP* family genes (*CYP2C9*, *CYP2E1*, *CYP3A4*) involved in drug metabolism, *HNF4A* (a master regulator of hepatocyte differentiation) [GeneCards: HNF4A], *ASGR1* (asialoglycoprotein receptor 1) [GeneCards: ASGR1], and enzymes critical for liver-specific metabolic functions like gluconeogenesis, urea cycle, and lipid synthesis (*G6PC*, *CPS1*, *APOB*, *APOA1*, *APOA2*). This strongly validates the Hepatocyte annotation.
- Hepatic Stellate Cells: Are characterized by the expression of genes associated with extracellular matrix (ECM) remodeling and fibrogenesis, such as various collagen subunits (*COL1A1*, *COL1A2*, *COL3A1*), proteoglycans (*DCN*, *BGN*), and growth factor receptors (*PDGFRA*), consistent with their known roles in liver fibrosis [PubMed Search: Hepatic stellate cell markers fibrosis].
- Endothelial Cells: Endothelial tip cells are distinguished by markers like *DLL4* and *ANGPT2*, which are crucial for angiogenesis [GeneCards: DLL4, ANGPT2]. Lymphatic Endothelial cells are specifically marked by *PROX1*, a definitive lymphatic endothelial cell determinant [GeneCards: PROX1].
- B Cells: B cell subtypes (Breg, MZ, Memory) express common B cell lineage markers such as *POU2F2* (OCT2) and *EBF1* (key B cell transcription factors) [PubMed Search: POU2F2 EBF1 B cell markers]. Distinct expression patterns differentiate these subtypes.
- T Cells: Various T cell subsets are well-defined by their expected master regulators or effector molecules:
- T cell (Naive): Characterized by *SELL* (CD62L) [GeneCards: SELL].
- T cell (Tfh): Marked by *BCL6*, a master transcription factor for follicular helper T cells [GeneCards: BCL6].
- T cell (Th1): Shows expression of *STAT1*, a key transcription factor in IFN-γ signaling and Th1 differentiation [GeneCards: STAT1].
- T cell (Th17): Identified by *RORC*, the master regulator of Th17 cell development [GeneCards: RORC].
- T cell (Th2): Expresses *STAT6* and *GATA3*, transcription factors essential for Th2 differentiation [GeneCards: GATA3, STAT6].
Innate Lymphoid Cells (ILCs):
- ILC1: Identified by *STAT4* and *IL12RB2*, involved in IL-12 signaling and IFN-γ production [PubMed Search: ILC1 markers STAT4 IL12RB2].
- ILC2: Marked by *GATA3* and *STAT6*, key for IL-5/IL-13 production [PubMed Search: ILC2 markers GATA3 STAT6].
- LTI: Expresses *RORC*, shared with ILC3s, consistent with their developmental origins.
- Macrophages: The macrophage subsets (M1, M2A, M2B, M2C) display overlapping yet distinct expression patterns of scavenger receptors (*MSR1*, *SCARB1*), TLRs (*TLR1*), and various immune-related genes, confirming their myeloid lineage. While specific single markers for classical M1/M2 polarization are complex and often defined by expression signatures rather than single genes, the overall clustering and differential expression shown are consistent with distinct macrophage states.
- NK Cells: Clearly identified by canonical NK cell receptors, including members of the killer cell lectin-like receptor family (*KLRG1*, *KLRC1*, *KLRD1*, *KLRK1*) and *NCAM1* (CD56) [PubMed Search: NK cell markers].
- Plasma Cells: Show strong expression of *XBP1* and *PRDM1* (BLIMP1), master regulators for plasma cell differentiation and immunoglobulin secretion [GeneCards: XBP1, PRDM1].
Annotation Notes
The comprehensive and specific marker gene expression patterns observed in the dot plot provide strong evidence that the celltype_subset annotations are accurate and robust. The high degree of specificity for most cell-type marker genes, coupled with minimal off-target expression, confirms the quality of the cell clustering and annotation process. This robust annotation forms a solid foundation for subsequent differential expression, pathway, and cell-cell interaction analyses within the context of liver disease.
4. Minor Cell Type Population Analysis Across NAFLD Progression Stages
[Analysis Visualization Results]...
Analysis Overview
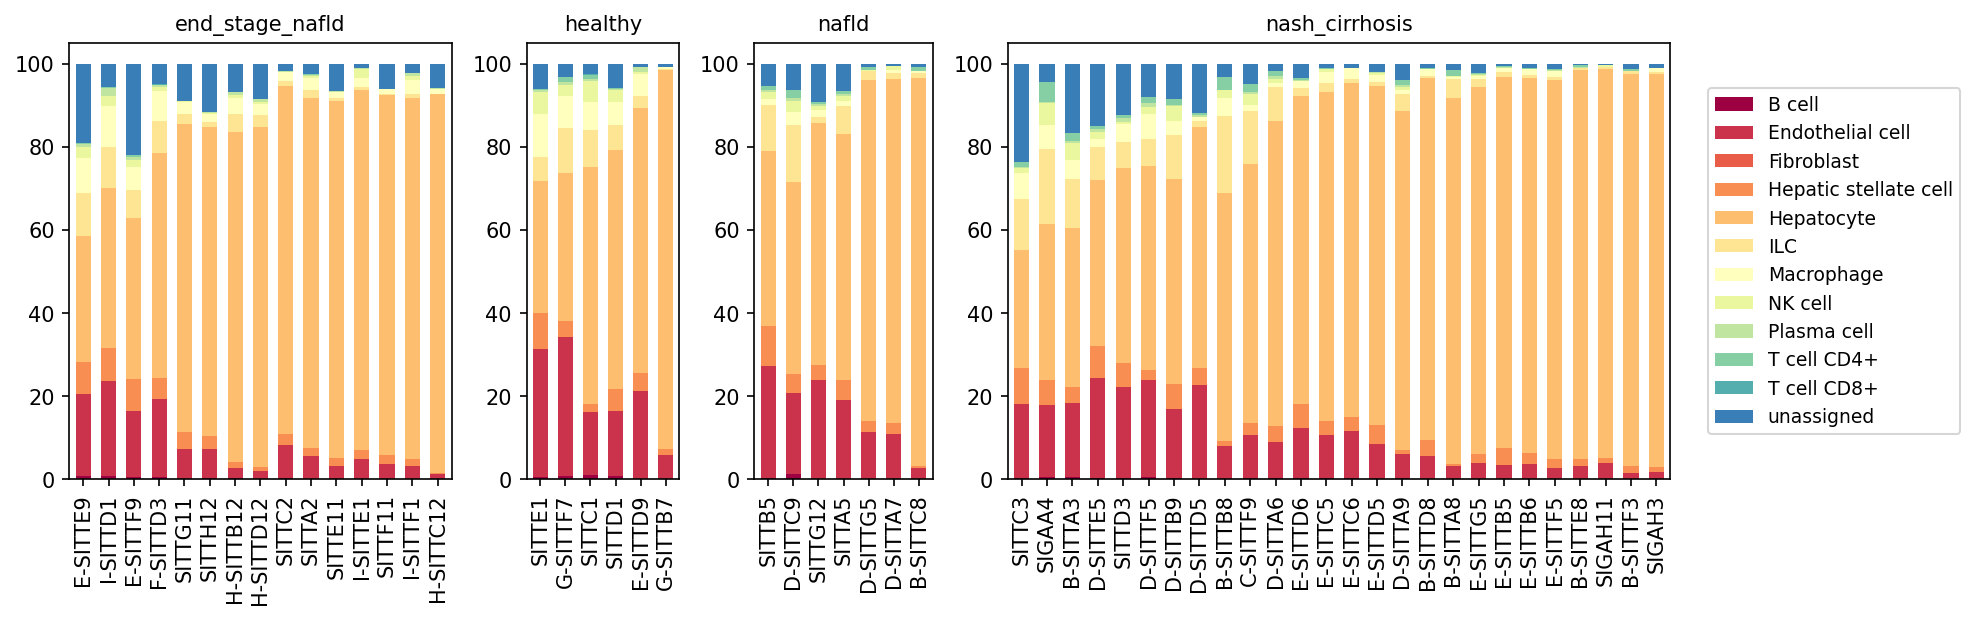
This analysis presents a population bar plot displaying the relative proportions of minor cell types across individual samples for different disease conditions: healthy, NAFLD, NASH with cirrhosis, and end-stage NAFLD. The visualization provides an overview of cellular composition shifts in the liver as nonalcoholic fatty liver disease (NAFLD) progresses to more severe stages.
Visual Summary
The stacked bar plots illustrate the cellular composition for each sample, grouped by condition. Hepatocytes (light orange) consistently form the largest proportion of cells across all conditions and samples, which is expected for liver tissue.
Key observations include:
- Hepatocyte Proportions: While still dominant, the relative proportion of Hepatocytes appears to decrease slightly but noticeably in samples from nash_cirrhosis and end_stage_nafld conditions compared to healthy and nafld samples. This suggests a proportional increase in other cell types or a loss of hepatocytes in advanced disease.
Increased Immune Cell Infiltration
- Macrophages (light yellow): A clear increase in the relative abundance of Macrophages is observed in nash_cirrhosis and end_stage_nafld samples, indicating heightened immune activity.
- T cells (CD4+ in light green and CD8+ in teal): Similarly, both CD4+ and CD8+ T cell populations show an increased presence in nash_cirrhosis and end_stage_nafld conditions.
- Other immune cells like B cells (maroon), NK cells (pale green), ILCs (yellow), and Plasma cells (light blue-green) also exhibit subtle proportional increases in these advanced disease stages.
Stromal Cell Dynamics
- Hepatic stellate cells (light orange/peach): There is a discernible, albeit modest, increase in the proportion of Hepatic stellate cells, particularly in samples from nash_cirrhosis and end_stage_nafld.
- Fibroblasts (coral): While a minor component, Fibroblasts also show a trend towards increased representation in advanced disease.
- Endothelial cells (dark red): The proportion of Endothelial cells appears relatively stable across conditions, though some sample-specific variations exist.
- Sample Heterogeneity: Significant sample-to-sample variability in cell type proportions is observed, especially within the nash_cirrhosis and end_stage_nafld groups, reflecting the heterogeneous nature of these advanced liver diseases.
- "unassigned" cells (steel blue): This category is present in most samples but does not show a strong, consistent trend with disease progression, generally remaining a minor component.
Biological Interpretation
The observed shifts in cell type proportions are highly consistent with the known pathophysiology of NAFLD progression to NASH and cirrhosis.
- Hepatocyte Loss/Dilution: The relative decrease in Hepatocytes in advanced stages (NASH cirrhosis, end-stage NAFLD) suggests either a reduction in hepatocyte viability/number (e.g., due to lipoapoptosis, necroptosis) or a proportional increase in other cell types as the liver undergoes remodeling and inflammatory infiltration.
- Inflammation and Immune Activation: The substantial increase in Macrophages and T cells (CD4+, CD8+) in nash_cirrhosis and end_stage_nafld underscores the central role of chronic inflammation in NAFLD progression. Macrophages (Kupffer cells and recruited monocytes) are key drivers of inflammation and fibrosis in NASH. T cells contribute to perpetuating inflammation and liver injury PubMed Search: T cells NAFLD NASH.
- Fibrosis Development: The increased proportions of Hepatic stellate cells and Fibroblasts in nash_cirrhosis and end_stage_nafld are critical indicators of fibrogenesis. Activated hepatic stellate cells are the primary collagen-producing cells in the injured liver, leading to fibrosis and ultimately cirrhosis GeneCards: HSC. This cellular expansion reflects the ongoing extracellular matrix deposition that characterizes liver fibrosis.
- Progression to Cirrhosis: The collective changes – increased inflammation, significant fibrogenesis, and potentially compromised hepatocyte populations – are hallmarks of liver damage progressing to cirrhosis and end-stage liver disease. The cellular environment becomes increasingly pro-inflammatory and pro-fibrotic.
Clinical or Translational Implications
The changes in cell type composition observed here have several clinical implications for NAFLD progression:
- Biomarker Discovery: The relative proportions of specific immune and stromal cell types, particularly Macrophages, T cells, Hepatic stellate cells, and Fibroblasts, could serve as non-invasive biomarkers for assessing disease stage or progression, potentially aiding in identifying patients at higher risk of developing advanced liver disease.
- Therapeutic Targets: The significant expansion of pro-inflammatory cells (e.g., Macrophages, T cells) and pro-fibrotic cells (e.g., Hepatic stellate cells, Fibroblasts) highlights these populations as potential therapeutic targets to mitigate inflammation and reverse or halt fibrosis in NASH and cirrhosis. Strategies aimed at modulating macrophage phenotypes or inhibiting hepatic stellate cell activation are currently under investigation PubMed Search: NASH therapeutics.
- Understanding Disease Heterogeneity: The observed sample-to-sample variability in advanced disease stages emphasizes the need for personalized approaches in diagnosis and treatment, recognizing that patients with similar clinical diagnoses may have different underlying cellular pathologies.
5. T Cell and Innate Lymphoid Cell Subpopulation Shifts in Nonalcoholic Fatty Liver Disease Progression
[Analysis Visualization Results]...
Analysis Overview
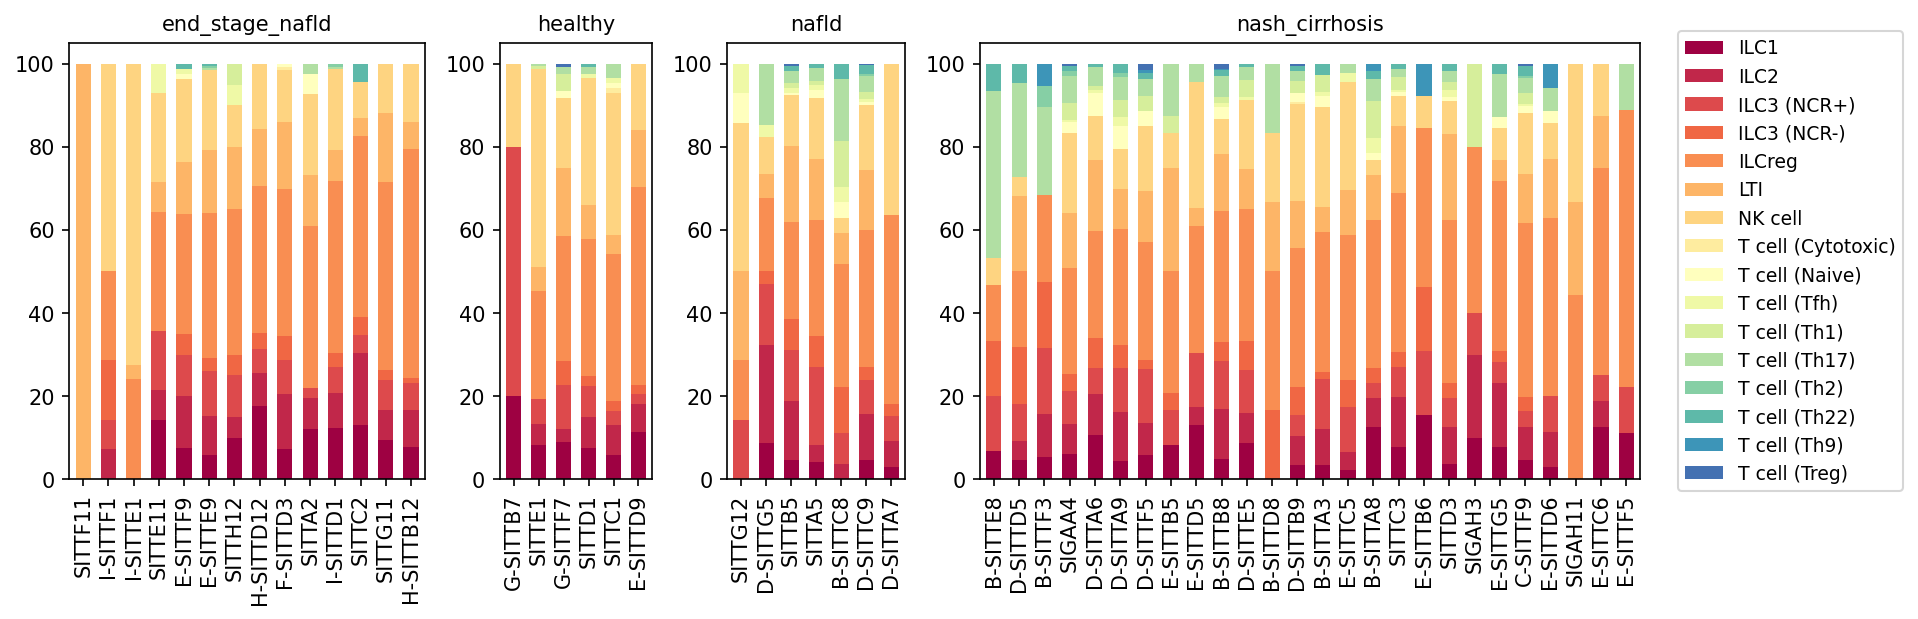
This analysis presents a stacked bar plot visualizing the relative proportions of various T cell subsets and other innate lymphoid cells (ILCs, NK cells) across individual liver samples from different conditions: healthy, nonalcoholic fatty liver disease (NAFLD), nonalcoholic steatohepatitis (NASH) with cirrhosis, and end-stage NAFLD. Each bar represents a single sample, and the colored segments indicate the percentage contribution of each cell type to the total T cell/ILC population within that sample. This allows for an assessment of shifts in the lymphoid immune microenvironment during the progression of NAFLD to more severe liver diseases.
Visual Summary
The stacked bar plots reveal distinct patterns in the composition of T cell and ILC populations across the analyzed conditions:
- Healthy Condition: Samples from healthy individuals show a relatively consistent distribution, predominantly composed of LTI cells, NK cells, T cell (Cytotoxic), T cell (Naive), and a baseline presence of ILCs (ILC1, ILC2, ILC3 (NCR+), ILC3 (NCR-), ILCreg). Specialized T helper subsets like T cell (Th1), T cell (Th17), T cell (Th2), T cell (Th22), T cell (Th9), and T cell (Treg) are either very low or absent in most healthy samples.
- NAFLD Condition: The cell composition in NAFLD samples appears largely similar to healthy controls, suggesting that early-stage NAFLD may not induce dramatic shifts in the overall proportions of these lymphoid subsets, though subtle changes might exist.
- NASH_cirrhosis Condition: This condition exhibits significant and heterogeneous shifts compared to healthy and NAFLD.
- There is a noticeable increase in the proportion of ILC1 (dark red) across many NASH_cirrhosis samples, indicating a potential activation of type 1 immune responses.
- Specialized T helper cell subsets, particularly T cell (Th1) (light green), T cell (Th17) (medium green), and to a lesser extent T cell (Th2) (dark green), become more prominent and consistently detected in NASH_cirrhosis samples. Other T cell subsets like T cell (Th22), T cell (Th9), and T cell (Treg) also show increased presence in some samples.
- The overall diversity of T cell subsets appears to increase, with a broader range of helper T cell phenotypes contributing to the total lymphoid population.
- End_stage_NAFLD Condition: Samples from end-stage NAFLD generally show patterns similar to NASH_cirrhosis, with sustained or even enhanced presence of ILC1s and various T helper subsets, consistent with chronic inflammation and advanced disease. There is substantial inter-sample variability within this group, reflecting the complex and heterogeneous nature of advanced liver disease.
Biological Interpretation
The observed shifts in T cell and ILC populations are highly relevant to the pathogenesis of NAFLD progression:
- Activation of Type 1 and Type 17 Immunity in NASH/Cirrhosis: The increased proportions of ILC1s and T cell (Th1) subsets in NASH_cirrhosis and end-stage NAFLD suggest a robust type 1 immune response. ILC1s and Th1 cells are key producers of IFN-$\gamma$, a cytokine associated with inflammation, immune cell recruitment, and potentially hepatocyte damage in chronic liver diseases PubMed search: ILC1 NAFLD NASH.
- Role of Th17 Cells in Liver Inflammation and Fibrosis: The clear emergence and increase of T cell (Th17) cells in NASH_cirrhosis is particularly notable. Th17 cells produce pro-inflammatory cytokines such as IL-17, which are implicated in driving inflammation, promoting fibrosis through activation of hepatic stellate cells, and contributing to disease progression in various chronic liver conditions, including NASH GeneCards: IL17A.
- Dynamic Balance of Helper T Cells: While Th1 and Th17 cells generally promote inflammation, the presence of T cell (Th2) and T cell (Treg) subsets indicates a complex immune environment. Th2 cells are often associated with anti-inflammatory responses and fibrosis resolution, but can also contribute to fibrosis in certain contexts via IL-4 and IL-13 production. Tregs play a crucial role in maintaining immune tolerance and suppressing excessive inflammation, but their efficacy or specific subsets may be compromised or altered during chronic liver injury, potentially even promoting fibrosis in some settings PubMed search: Treg liver fibrosis. The variability in Treg proportions might reflect different stages of immune regulation or exhaustion.
- Changes in Innate Lymphoid Cells: Beyond ILC1s, other ILC subsets like ILC2 and ILC3 also show altered distributions in diseased states. ILCs are critical early responders in tissue immunity, acting as a bridge between innate and adaptive immunity in the liver PubMed search: ILC liver immunity. Their shifting proportions suggest active involvement in the evolving immune landscape of NAFLD progression.
- Reduced "Quiescent" Populations: While not explicitly a decrease, the relative proportions of T cell (Naive), LTI, and some NK cell populations might appear proportionally smaller in NASH_cirrhosis due to the expansion of activated T helper and ILC subsets. This suggests a shift from an immunologically quiescent state to an active, inflammatory one.
Clinical or Translational Implications
These findings highlight the dynamic changes in the lymphoid immune compartment during NAFLD progression, offering potential avenues for biomarker discovery and therapeutic intervention:
- Biomarker Potential: The distinct increases in ILC1s, Th1 cells, and especially Th17 cells in NASH_cirrhosis could serve as cellular biomarkers for disease severity or progression, distinguishing advanced NASH from early NAFLD or healthy states.
- Therapeutic Targets: Targeting specific pro-inflammatory T helper subsets (e.g., Th17 cells and their cytokines like IL-17) or modulating the activity of ILC1s could be a promising therapeutic strategy to mitigate inflammation and fibrosis in NASH. Similarly, understanding how to bolster beneficial Treg responses could be important.
- Understanding Immune Pathogenesis: A deeper understanding of these immune cell shifts is crucial for unraveling the precise mechanisms by which the immune system contributes to liver damage and fibrosis in NAFLD. This could guide the development of immunomodulatory therapies tailored to specific stages of the disease.
6. Analysis of Lymphoid Cell Subset Proportions Across NAFLD Progression Stages
[Analysis Visualization Results]...
Analysis Overview
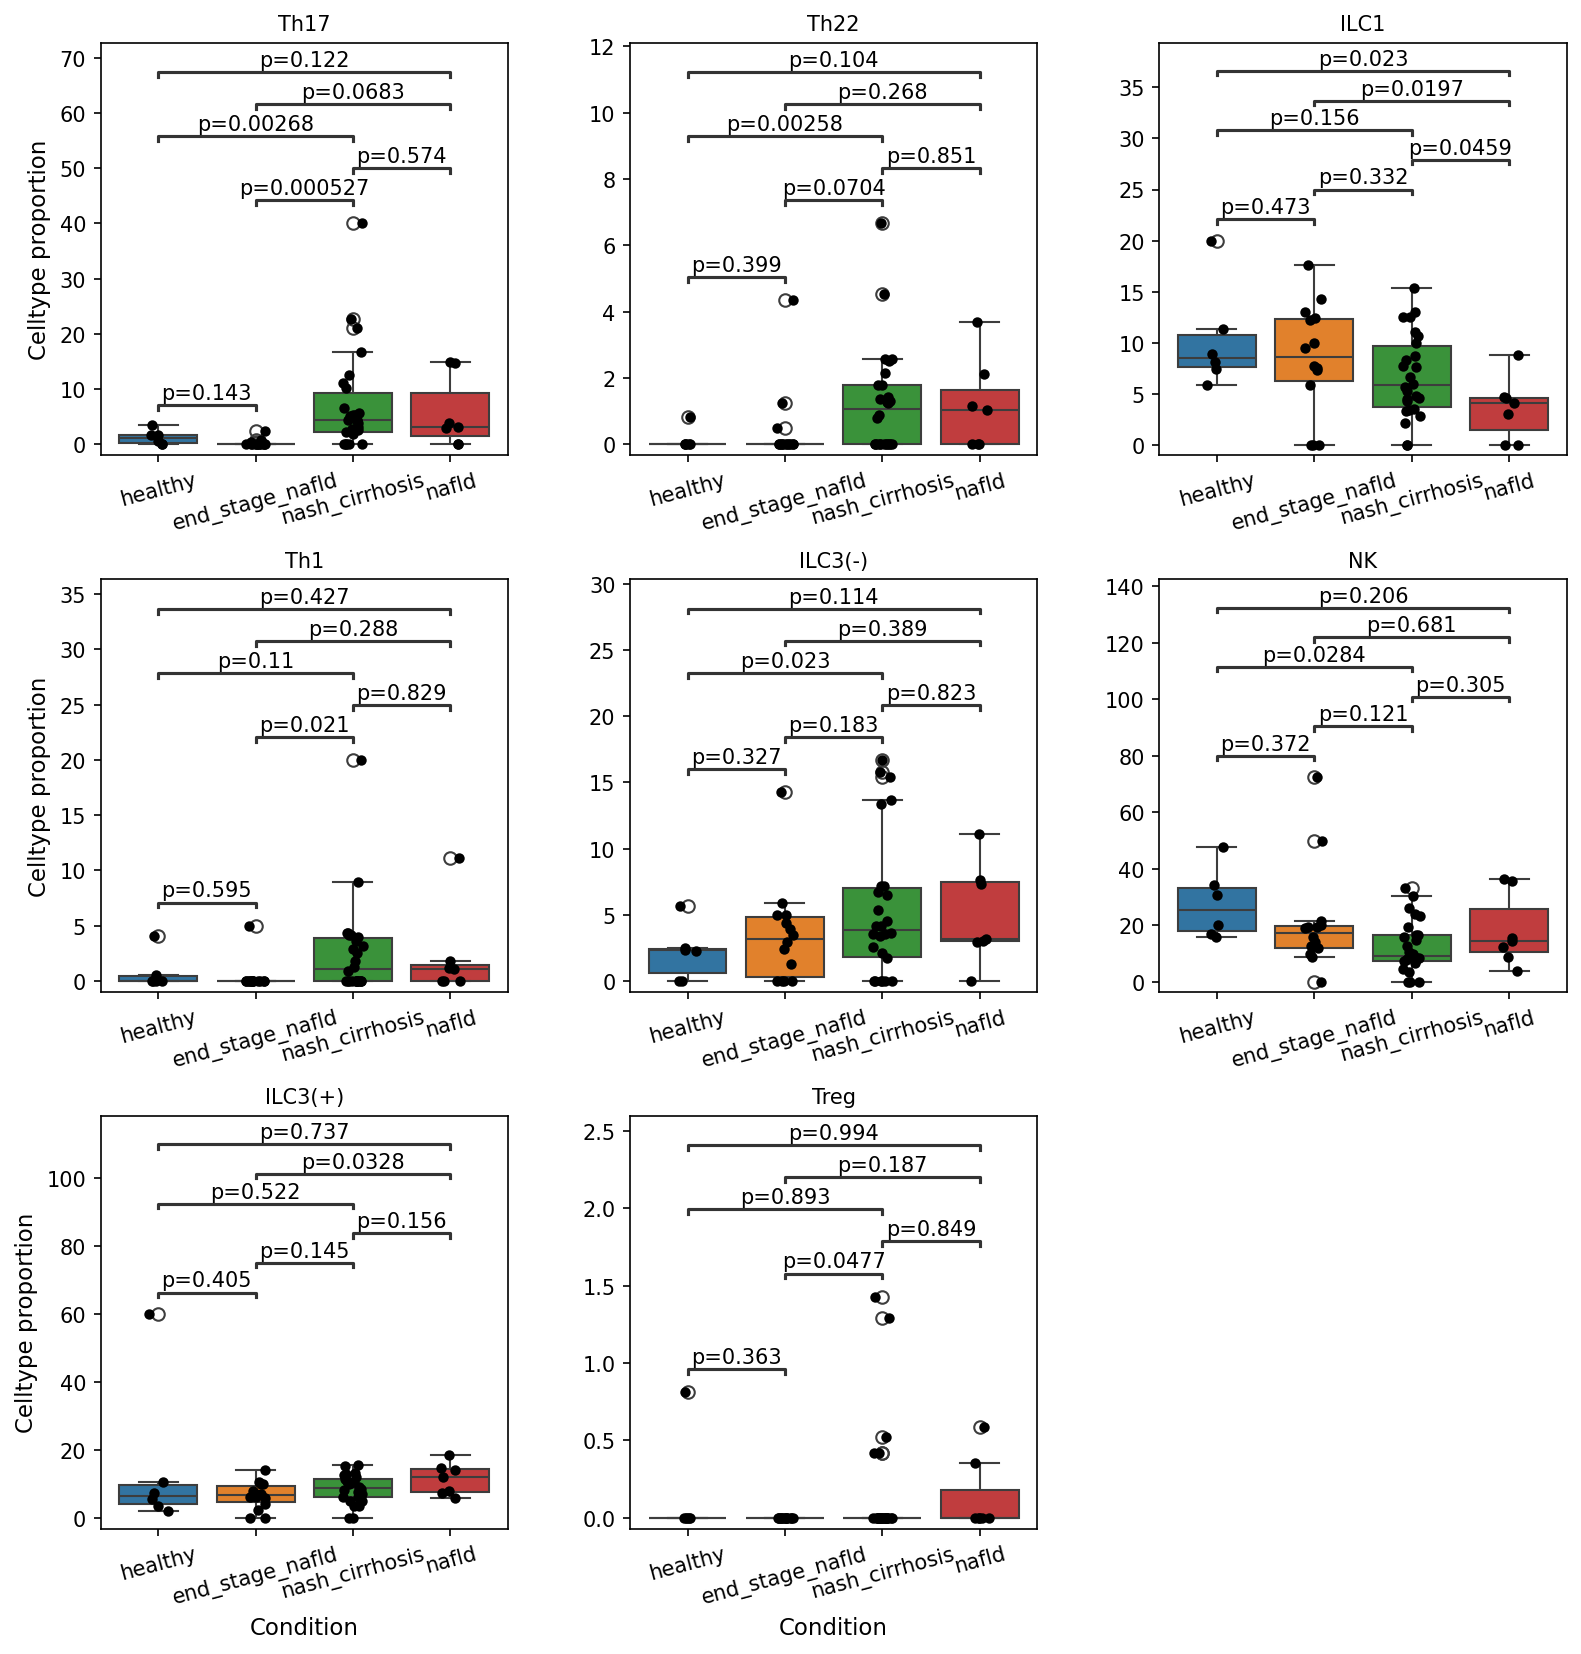
This analysis investigates the proportional representation of various T cell and innate lymphoid cell (ILC) subsets, including Natural Killer (NK) cells, across different conditions related to Nonalcoholic fatty liver disease (NAFLD) progression. The conditions studied are healthy, nafld, nash_cirrhosis, and end_stage_nafld. Box plots are used to visualize celltype proportions, and statistical significance tests (p-value < 0.1) highlight differences between conditions. The goal is to identify lymphoid cell populations that are significantly altered during NAFLD progression to Nonalcoholic steatohepatitis (NASH) and cirrhosis.
Visual Summary
The box plots display the celltype proportions for nine distinct lymphoid subsets: Th17, Th22, ILC1, Th1, ILC3(-), NK, ILC3(+), and Treg, across four liver conditions. Each plot includes individual data points (stripplot), box plots showing median, quartiles, and whiskers, and p-values for pairwise comparisons between conditions.
Key observations with statistically significant differences (p < 0.1) include:
- Th17 cells: Significantly increased in nash_cirrhosis (p=0.00268) and end_stage_nafld (p=0.000527) compared to healthy. They are also higher in nash_cirrhosis compared to nafld (p=0.0683).
- Th22 cells: Show a significant increase in nash_cirrhosis (p=0.00258) and end_stage_nafld (p=0.0704) compared to healthy.
- ILC1 cells: Significantly decreased in nash_cirrhosis (p=0.0197) and end_stage_nafld (p=0.0459) compared to healthy.
- Th1 cells: Significantly increased in nash_cirrhosis (p=0.021) compared to healthy.
- ILC3(-) cells (ILC3 (NCR-)): Significantly increased in end_stage_nafld (p=0.023) compared to healthy.
- NK cells: Significantly decreased in nash_cirrhosis (p=0.0284) compared to healthy.
- ILC3(+) cells (ILC3 (NCR+)): Significantly decreased in nash_cirrhosis (p=0.0328) compared to healthy.
- Treg cells: Significantly increased in end_stage_nafld (p=0.0477) compared to healthy.
No significant differences were observed for nafld when compared to healthy for any of the plotted cell types, suggesting that early-stage NAFLD might not significantly alter the proportions of these specific lymphoid subsets, or that these changes become apparent in more advanced stages.
Biological Interpretation
The observed shifts in lymphoid cell proportions reflect dynamic immune responses in the liver during the progression of NAFLD to NASH and cirrhosis.
- Pro-inflammatory T cells (Th1, Th17, Th22): The significant increases in Th1, Th17, and Th22 cell proportions in advanced disease stages (nash_cirrhosis and end_stage_nafld) are consistent with the chronic inflammatory nature of NASH and liver fibrosis. Th17 cells are known to mediate tissue inflammation and are implicated in various chronic liver diseases. Th1 cells drive interferon-gamma (IFN-γ) mediated inflammation, while Th22 cells are involved in epithelial immunity, tissue repair, and inflammation, which can contribute to pathological tissue remodeling in the liver [1, 2].
- Regulatory T cells (Treg): The significant increase in Treg cells in end_stage_nafld could represent a compensatory mechanism to control escalating inflammation in advanced liver disease. However, in chronic inflammatory settings, Tregs can sometimes become dysfunctional or contribute to immune tolerance that prevents effective clearance of damaged cells or pathogens, potentially contributing to disease progression [3].
- Innate Lymphoid Cells (ILCs) and NK cells: The significant decrease in ILC1, NK, and ILC3(+) cells in nash_cirrhosis, alongside an increase in ILC3(-) cells in end_stage_nafld, indicates complex and heterogeneous roles for innate lymphoid cells in NAFLD progression. ILC1s and NK cells are crucial for antiviral and antitumor immunity, and their reduction might imply impaired immune surveillance or a shift towards an immunosuppressive microenvironment in cirrhotic livers [4, 5]. The distinct responses of ILC3(-) and ILC3(+) suggest functional divergence; ILC3s are generally involved in barrier immunity and tissue homeostasis, but their specific roles in different NAFLD stages require further investigation.
Overall, the data suggests a pro-inflammatory skewing of adaptive T cell immunity (increased Th1, Th17, Th22) and significant alterations in innate lymphoid cell populations (decreased ILC1, NK, ILC3(+); increased ILC3(-)) as NAFLD progresses to NASH and cirrhosis.
Clinical or Translational Implications
These findings highlight potential biomarkers and therapeutic targets for NAFLD and NASH.
- Biomarkers: The proportional changes in Th17, Th22, Th1, ILC1, NK, ILC3(-), ILC3(+), and Treg cells, particularly in nash_cirrhosis and end_stage_nafld, could serve as valuable non-invasive biomarkers for disease staging and severity, helping to differentiate advanced forms of NAFLD from early stages or healthy liver.
- Therapeutic Targets: Modulating the activity or proportion of these specific lymphoid subsets could offer novel therapeutic strategies. For instance, interventions aimed at reducing pro-inflammatory Th17/Th1/Th22 responses or restoring homeostatic ILC and NK cell functions might ameliorate inflammation and fibrosis in patients with NASH and cirrhosis. Further research is needed to understand the precise mechanisms and causality of these cellular shifts in NAFLD progression.
---
References:
- Th17 cells in liver disease: For an overview of Th17 cells in various liver pathologies, see a PubMed search: https://pubmed.ncbi.nlm.nih.gov/?term=Th17+liver+disease
- Th22 cells in liver disease: For information on Th22 cells in liver inflammation and disease, see a PubMed search: https://pubmed.ncbi.nlm.nih.gov/?term=Th22+liver+disease
- Tregs in NAFLD: For the role of regulatory T cells in NAFLD pathogenesis, see a PubMed search: https://pubmed.ncbi.nlm.nih.gov/?term=Treg+NAFLD
- Innate Lymphoid Cells in liver disease: For a broader context on ILCs in liver immunity and disease, see a PubMed search: https://pubmed.ncbi.nlm.nih.gov/?term=Innate+Lymphoid+Cells+liver+disease
- NK cells in NASH: For information on Natural Killer cells in NASH, see a PubMed search: https://pubmed.ncbi.nlm.nih.gov/?term=NK+cells+NASH
7. Macrophage Subset Population Shifts Across NAFLD Progression
[Analysis Visualization Results]...
Analysis Overview
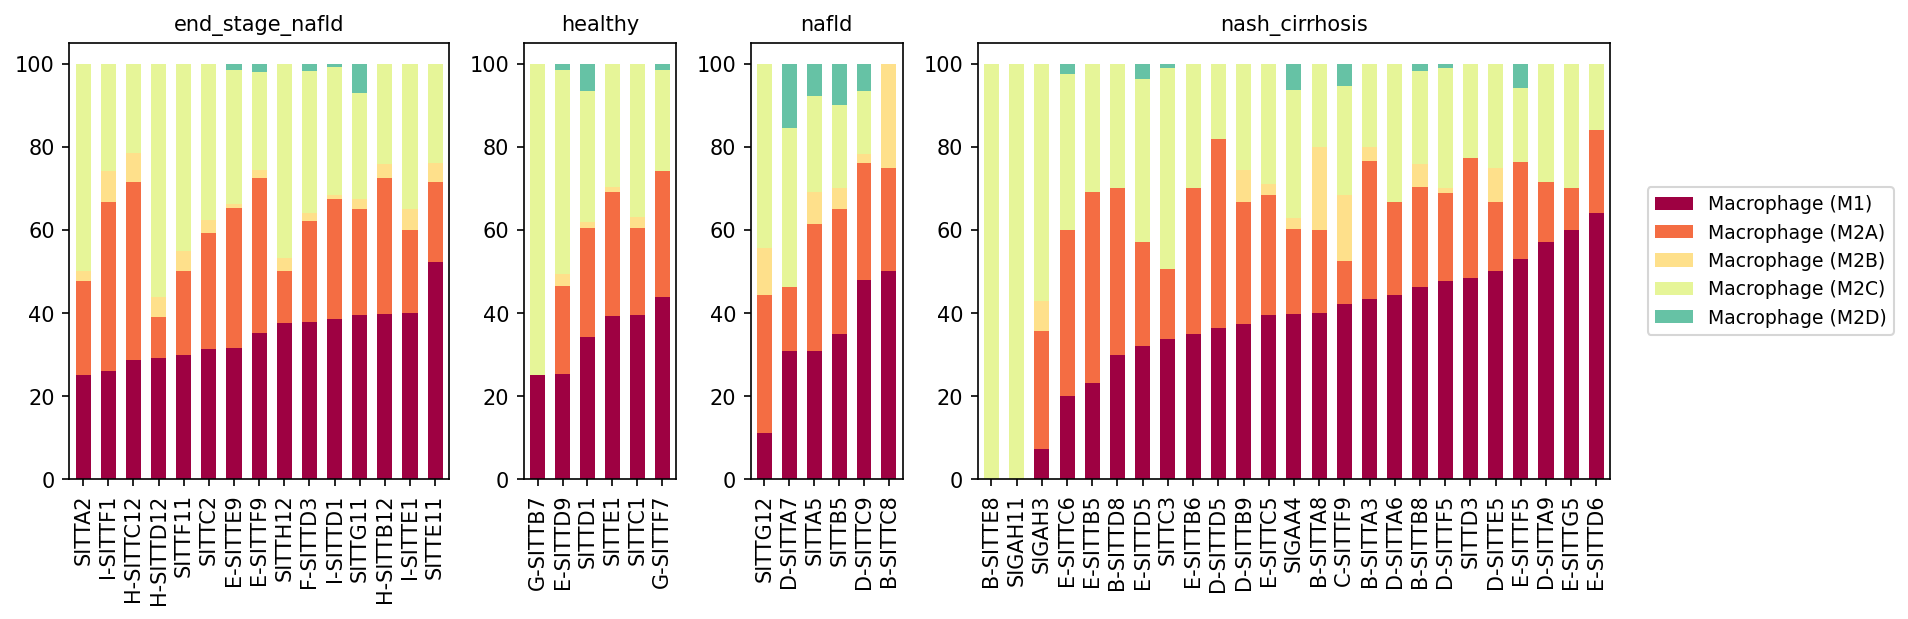
This analysis presents a population bar plot illustrating the relative proportions of different macrophage subsets (Macrophage (M1), Macrophage (M2A), Macrophage (M2B), Macrophage (M2C), and Macrophage (M2D)) within the liver across various stages of Nonalcoholic Fatty Liver Disease (NAFLD) progression: healthy, nafld, nash_cirrhosis, and end_stage_nafld. Each bar represents a single sample, and the stacked segments show the percentage contribution of each macrophage subset. This visualization allows for an assessment of shifts in macrophage polarization states during disease progression.
Visual Summary
The bar plot reveals distinct shifts in macrophage subset compositions across the different conditions:
- Healthy Liver: In healthy samples, Macrophage (M2C) constitutes a substantial proportion of the total macrophage population, often being the most dominant subset. Macrophage (M2A) and Macrophage (M1) are also present, but generally in lower proportions than M2C. Macrophage (M2B) and Macrophage (M2D) are largely minor or undetectable.
- NAFLD (Nonalcoholic Fatty Liver Disease): As the disease progresses to NAFLD, there is a noticeable decrease in the proportion of Macrophage (M2C) in many samples. Concurrently, Macrophage (M1) and Macrophage (M2A) show an increasing trend, becoming more prominent compared to healthy controls. Macrophage (M2D) appears in some samples, though still at low levels.
- NASH_cirrhosis (Nonalcoholic Steatohepatitis with Cirrhosis): In this more advanced disease stage, Macrophage (M1) becomes notably and consistently elevated, often comprising a significant fraction, sometimes even the largest proportion, of the macrophage population across most samples. Macrophage (M2A) also remains a substantial component. Macrophage (M2C) proportions continue to be low, indicating a sustained shift away from this state. Macrophage (M2B) and Macrophage (M2D) remain minor but are sporadically observed.
- End_stage_nafld (End-Stage NAFLD): This condition shows a macrophage profile similar to or further intensified from NASH_cirrhosis. Macrophage (M1) remains a dominant subset, indicating persistent pro-inflammatory activity. Macrophage (M2A) is also highly prevalent. Macrophage (M2C) continues to be suppressed. Interestingly, Macrophage (M2D) shows a slightly more consistent, albeit still small, presence in some end-stage samples compared to earlier stages.
Biological Interpretation
The observed shifts in macrophage populations provide significant insights into the immunological landscape during NAFLD progression:
- Shift from M2C to M1/M2A in Disease: The healthy liver environment appears to be characterized by a high proportion of Macrophage (M2C), a subset often associated with immune regulation, tissue resolution, and clearance of apoptotic cells. As NAFLD progresses through NASH to end-stage disease, there's a clear reduction in M2C and a reciprocal increase in Macrophage (M1) and Macrophage (M2A).
- M1 Macrophages and Inflammation: The consistent and increasing dominance of Macrophage (M1) in NAFLD, NASH_cirrhosis, and end_stage_nafld strongly indicates a pronounced and persistent pro-inflammatory state. M1 macrophages are known to secrete pro-inflammatory cytokines (e.g., TNF-α, IL-1β, IL-6), contributing to hepatocyte injury and the perpetuation of inflammation, which are key drivers of NASH progression and fibrosis in the liver. PubMed search: M1 macrophages in NAFLD fibrosis
- M2A Macrophages and Tissue Remodeling/Fibrosis: Macrophage (M2A) populations are also elevated in the disease states. M2A macrophages are generally associated with Th2-type immune responses and play a complex role in tissue repair, wound healing, and can contribute to fibrosis by secreting pro-fibrotic mediators (e.g., TGF-β, PDGF) and promoting extracellular matrix deposition. Their co-elevation with M1 suggests a dynamic interplay between inflammatory and pro-fibrotic processes in the diseased liver. PubMed search: M2a macrophages liver fibrosis
- Reduced M2C and Impaired Resolution: The significant decrease in Macrophage (M2C) suggests a loss of regulatory or anti-inflammatory capacity in the diseased liver, potentially impairing the resolution of inflammation and contributing to chronic liver injury. M2C macrophages are also involved in clearance of cellular debris, and their reduction might lead to sustained immune activation due to uncleared damage-associated molecular patterns.
- Minor M2B/M2D Presence: Macrophage (M2B) and Macrophage (M2D) remain relatively minor populations throughout the disease spectrum, although M2D might show a slight increase in end-stage disease, hinting at potential context-specific roles in advanced fibrosis or angiogenesis.
Clinical or Translational Implications
- Biomarkers of Disease Progression: The distinct shifts in macrophage subset proportions, particularly the M1/M2C ratio, could serve as potential biomarkers for the severity and progression of NAFLD to NASH and cirrhosis. Monitoring these ratios in liver biopsies or through non-invasive techniques could provide valuable prognostic information.
- Therapeutic Targets: Targeting specific macrophage polarization pathways presents a promising therapeutic strategy for NAFLD and NASH. Interventions aimed at:
- Reducing M1 macrophage activation and their pro-inflammatory output.
- Promoting M2C repolarization to enhance resolution of inflammation and tissue repair.
- Modulating M2A activity to mitigate their pro-fibrotic effects while preserving beneficial tissue remodeling functions.
Such approaches could help halt or even reverse disease progression.
- Understanding Pathogenesis: This analysis highlights the critical role of macrophage plasticity and the dynamic interplay between different macrophage subsets in driving the pathology of NAFLD, underscoring the importance of immune cell profiling in understanding complex liver diseases.
8. Macrophage Subset Population Changes Across NAFLD Progression
[Analysis Visualization Results]...
Analysis Overview
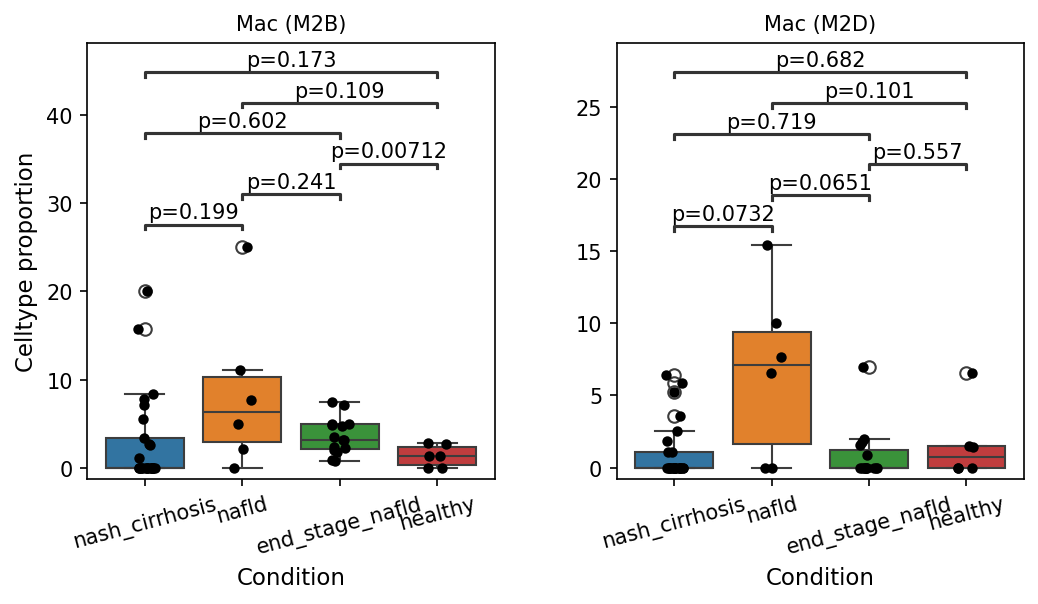
This analysis investigates the cell type proportions of specific macrophage subsets, Mac (M2B) and Mac (M2D), across different stages of Nonalcoholic Fatty Liver Disease (NAFLD) progression and in healthy controls. The conditions examined are healthy, nafld, nash_cirrhosis, and end_stage_nafld. The objective is to identify macrophage subsets that exhibit statistically significant shifts in their proportions within the liver during the development and advancement of NAFLD. A p-value cutoff of 0.1 was used to determine statistical significance for pairwise comparisons.
Visual Summary
Mac (M2B) Subset Proportions
- Significant Elevation in NAFLD: The Mac (M2B) population displays its highest median proportion in the nafld condition. This increase is statistically significant when compared to healthy individuals (p=0.00712).
- Comparison to Healthy Controls: No other disease conditions, specifically nash_cirrhosis and end_stage_nafld, show a statistically significant difference in Mac (M2B) proportions compared to healthy individuals (p=0.199 and p=0.241, respectively).
- Trend Across Disease Stages: The proportion of Mac (M2B) appears to peak during the nafld stage and subsequently decreases in end_stage_nafld and nash_cirrhosis, returning to levels closer to those observed in healthy subjects. However, these specific declines did not reach statistical significance in the displayed pairwise comparisons.
Mac (M2D) Subset Proportions
- Elevated Proportions in NAFLD and NASH/Cirrhosis: Similar to Mac (M2B), the Mac (M2D) population shows its highest median proportion in the nafld condition, which is significantly elevated compared to healthy (p=0.0651).
- Borderline Significance in NASH/Cirrhosis: There is a borderline statistically significant increase in Mac (M2D) proportions in nash_cirrhosis when compared to healthy (p=0.0732), suggesting a potential involvement of this subset even in more advanced stages of liver disease.
- Comparison to End-Stage NAFLD: No statistically significant differences were observed when comparing end_stage_nafld to healthy or to other disease conditions for Mac (M2D).
- Overall Trend: The Mac (M2D) population, much like Mac (M2B), appears to be most abundant in the nafld stage, with some evidence of elevated presence also in nash_cirrhosis.
Biological Interpretation
The observed changes in the proportions of Mac (M2B) and Mac (M2D) macrophage subsets provide important insights into the evolving immune landscape during NAFLD progression. Macrophages are pivotal cells in maintaining liver homeostasis and are deeply implicated in the pathogenesis of various liver diseases, including NAFLD and its more severe form, Nonalcoholic Steatohepatitis (NASH). M2-like macrophages are broadly recognized for their roles in anti-inflammatory responses, tissue repair, and the development of fibrosis.
- Early Involvement in NAFLD Pathogenesis: The significant expansion of both Mac (M2B) and Mac (M2D) populations specifically during the nafld stage, relative to healthy controls, strongly suggests their prominent role in the initial development of fatty liver disease. Macrophages, particularly those with M2 characteristics, are known to influence lipid metabolism, inflammation resolution, and the early phases of extracellular matrix remodeling in NAFLD [1].
- Mac (M2B): These macrophages are often associated with immune complex-mediated responses and can participate in both pro-inflammatory and anti-inflammatory processes, depending on the specific microenvironment. Their increase in NAFLD might reflect an attempt at immune modulation in response to metabolic stress or cellular damage.
- Mac (M2D): Sometimes referred to as 'regulatory macrophages', M2D macrophages are linked to IL-6/STAT3 signaling and can promote angiogenesis and suppress immune responses. Their upregulation in NAFLD could contribute to the chronic inflammatory state, but also to efforts in tissue repair which, if dysregulated, can lead to fibrosis [2].
- Dynamic Shifts in Disease Progression: The observed trend where the proportions of these specific M2 subsets appear to decrease or normalize in end_stage_nafld and nash_cirrhosis compared to nafld could indicate a shift in the overall macrophage polarization or composition as the disease progresses to more advanced, fibrotic, or cirrhotic stages. This may imply that these particular M2 subsets are more critical in the earlier inflammatory and metabolic dysregulation phases of NAFLD, while different macrophage populations or functional states might become more dominant in later-stage fibrotic disease.
Clinical or Translational Implications
The distinct alterations in Mac (M2B) and Mac (M2D) proportions, particularly their elevation during the nafld stage, offer potential avenues for clinical application:
- Biomarkers for Disease Detection and Progression: The increased proportions of these macrophage subsets could serve as valuable early indicators or diagnostic markers for NAFLD development. Monitoring these populations might aid in identifying individuals at higher risk of progressing to more severe forms of liver disease, allowing for earlier intervention.
- Therapeutic Targets: A deeper understanding of the specific functions of Mac (M2B) and Mac (M2D) in NAFLD pathogenesis could facilitate the development of targeted therapeutic interventions. Strategies aimed at modulating macrophage polarization or function, such as inhibiting specific pro-fibrotic M2 activities or promoting beneficial M2 phenotypes, could potentially mitigate disease progression.
- Personalized Treatment Approaches: The differential involvement of these macrophage subsets across various disease stages suggests that stratifying patients based on their macrophage profiles could lead to more personalized and effective treatment strategies.
Further research focusing on the precise functional characteristics and unique surface markers of these Mac (M2B) and Mac (M2D) populations within the human NAFLD spectrum is essential to fully elucidate their complex roles in liver pathophysiology.
---
References:
[1] Macrophage polarization in nonalcoholic fatty liver disease (NAFLD). PubMed search: https://pubmed.ncbi.nlm.nih.gov/?term=macrophage+polarization+NAFLD
[2] Role of M2 macrophages in liver fibrosis. PubMed search: https://pubmed.ncbi.nlm.nih.gov/?term=M2+macrophages+liver+fibrosis
9. Cell-Cell Interaction Patterns in NAFLD Progression
[Analysis Visualization Results]...
Analysis Overview
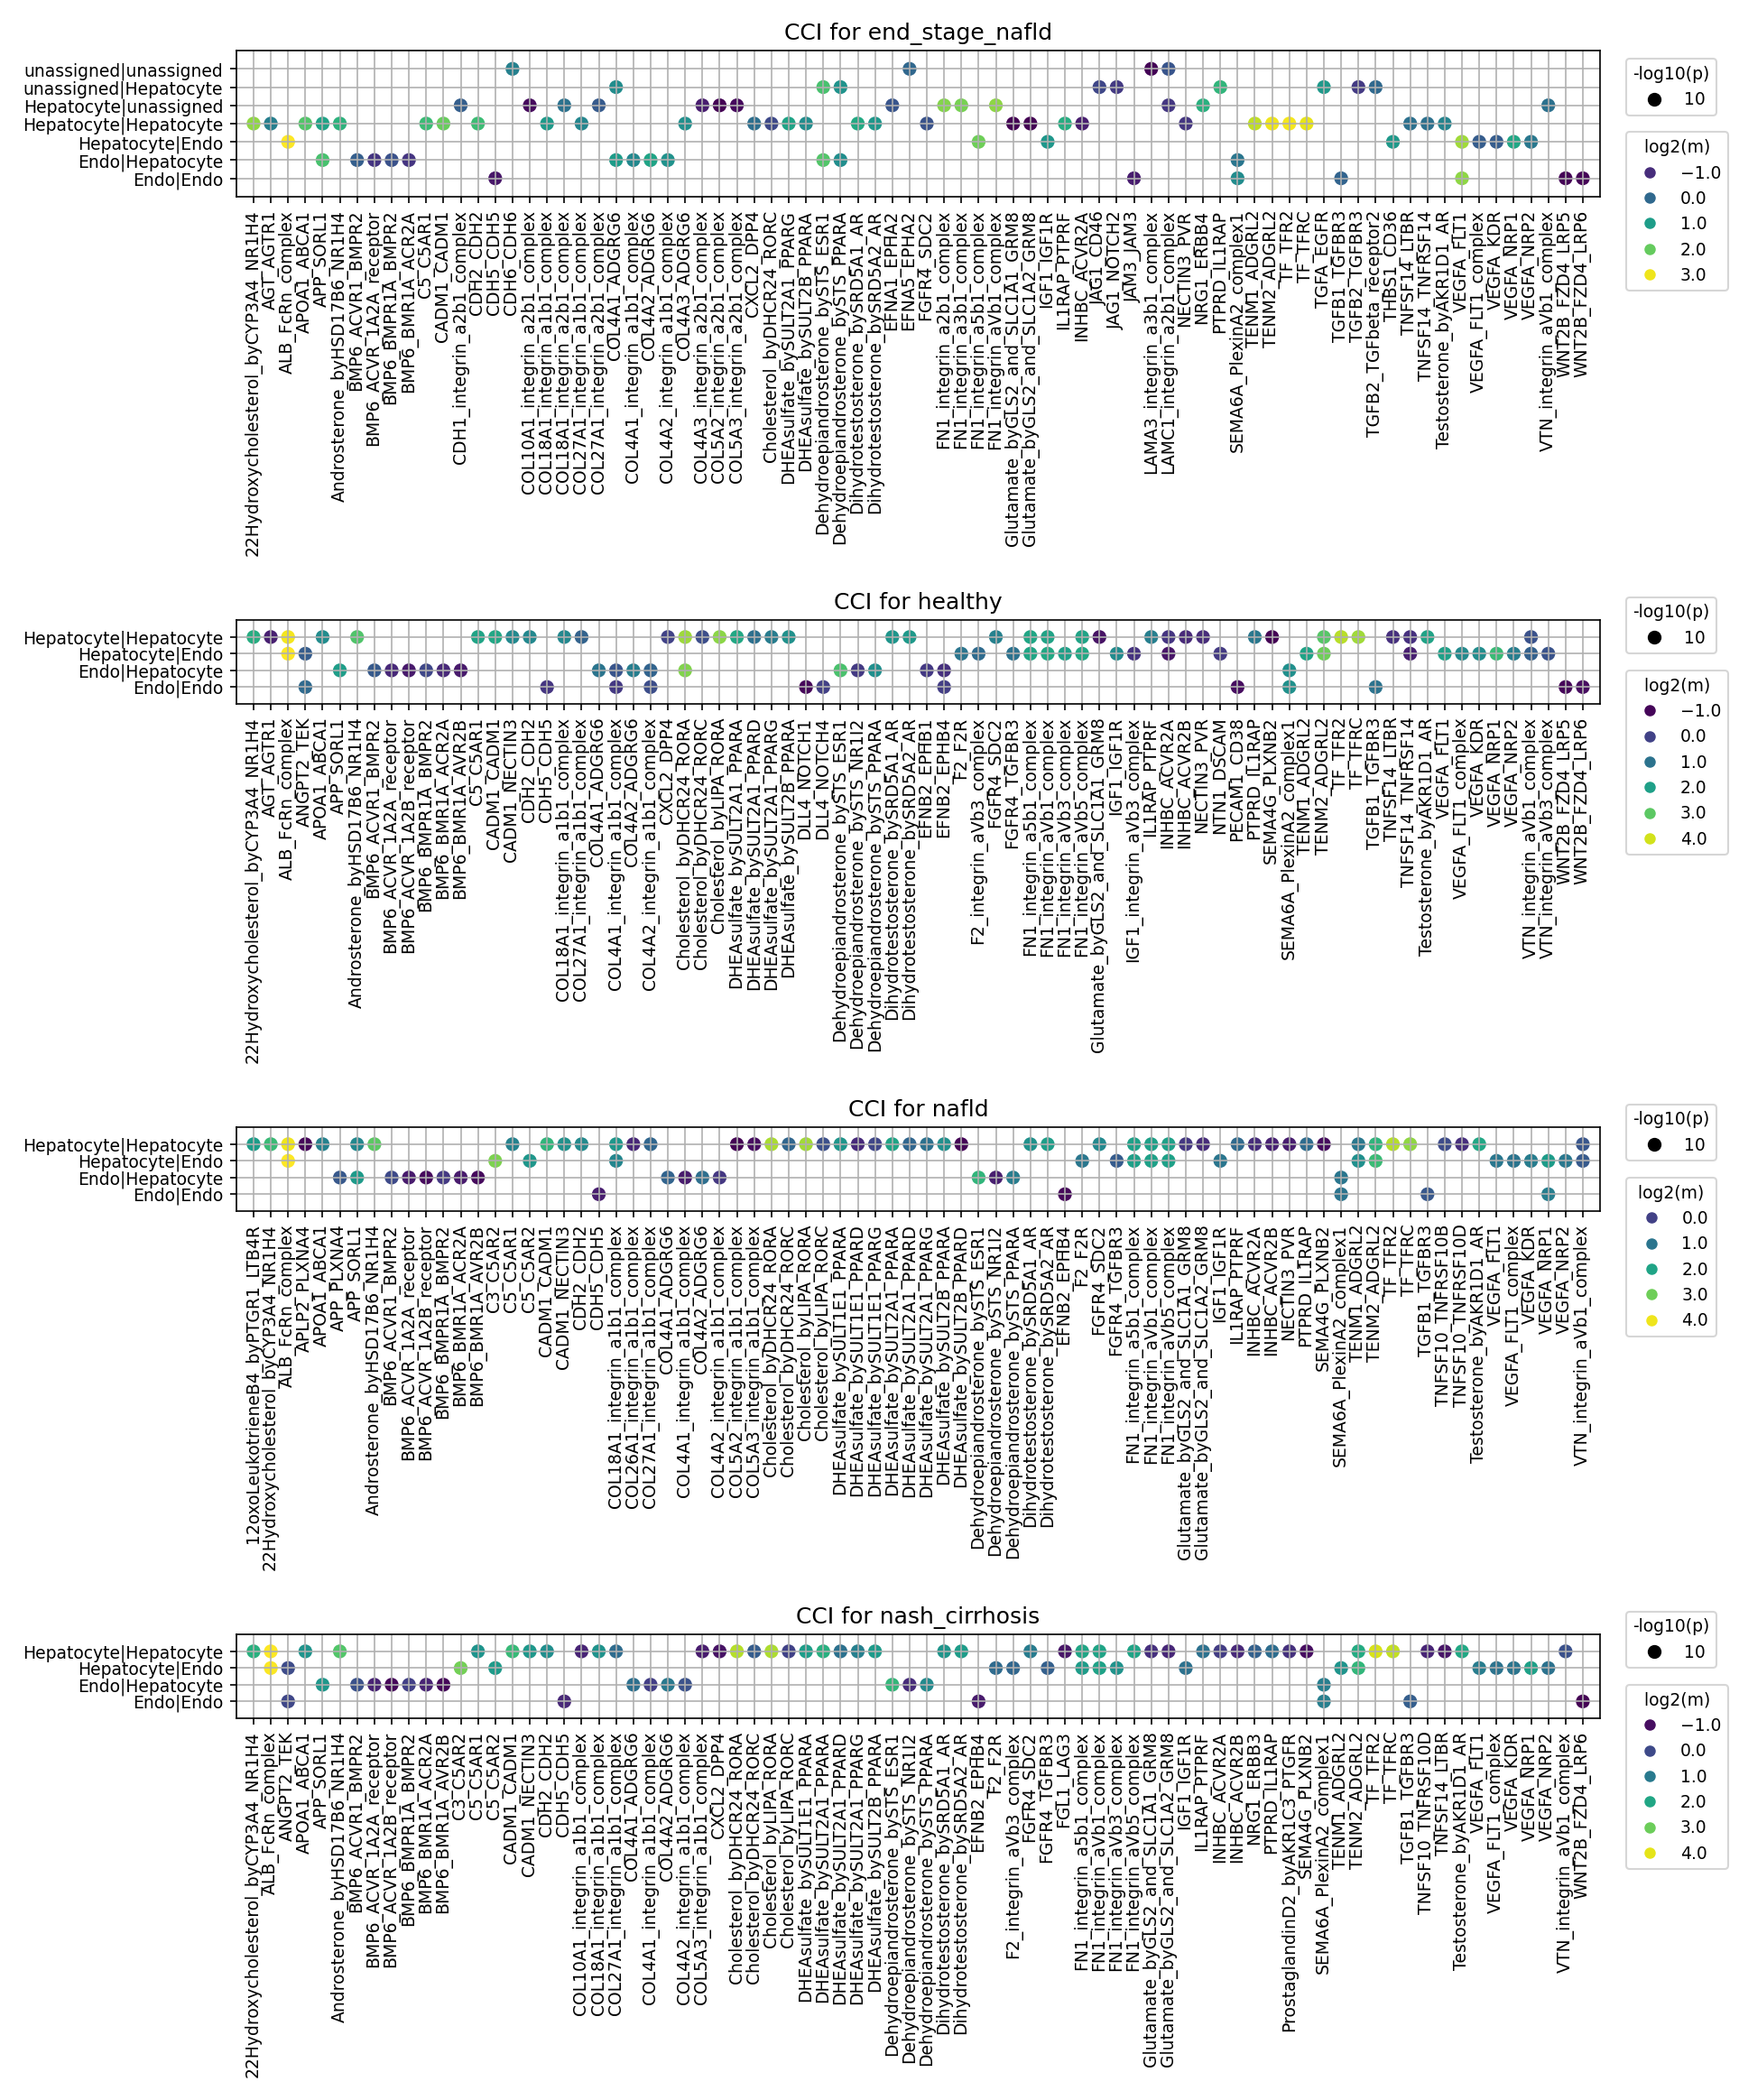
This analysis utilizes CellPhoneDB to investigate cell-cell interaction (CCI) patterns across different stages of Nonalcoholic Fatty Liver Disease (NAFLD) progression and in healthy controls. Specifically, we examine interactions within and between Hepatocytes and Endothelial cells in healthy, nafld, nash_cirrhosis, and end_stage_nafld conditions. The goal is to identify ligand-receptor pairs that exhibit differential activity, shedding light on the molecular mechanisms underlying disease progression and potential therapeutic targets. The results are visualized as dot plots, where dot size represents the statistical significance (-log10(p-value)) and dot color indicates the interaction strength (log2(mean expression)).
Visual Summary
The provided dot plots illustrate the strength and significance of a selection of cell-cell interactions for four conditions: end_stage_nafld, healthy, nafld, and nash_cirrhosis. The y-axis displays the interacting cell pairs, predominantly "Hepatocyte|Hepatocyte", "Hepatocyte|Endo", "Endo|Hepatocyte", and "Endo|Endo". The x-axis lists various ligand-receptor pairs or complex interactions.
Key observations:
- Prevalence of Interactions: A substantial number of ligand-receptor interactions are detected across all conditions, indicating extensive communication networks within the liver microenvironment.
- Integrin and ECM-related Interactions: Interactions involving various integrin complexes (e.g., COL18A1-integrin_a2b1_complex, FN1-integrin_a5b1_complex, VTN-integrin_aVB3_complex) and their ligands (Collagen, Fibronectin, Vitronectin) are consistently observed. These interactions often show high significance (large dots) and moderate to strong expression (green-yellow colors) across all conditions but appear particularly robust in diseased states, especially nash_cirrhosis and end_stage_nafld.
Growth Factor Signaling:
- TGF-beta signaling (TGFB2-TGFBR1/2/3): These interactions are present across most cell pairs and conditions. While generally significant, their strength may vary subtly.
- VEGF signaling (VEGFA-FLT1, VEGFA-KDR, VEGFA-NRP1/2): Interactions mediated by VEGFA are particularly prominent within and between endothelial cells (Endo|Endo, Hepatocyte|Endo, Endo|Hepatocyte), often showing high significance and strength, especially in disease conditions.
- Metabolic Signaling: Interactions related to Cholesterol (e.g., Cholesterol_by_DHCR24_ROROA/PPARA) and Dihydrotestosterone (e.g., Dihydrotestosterone_by_SRD5A1A2_PPARG) are detected, indicating metabolic crosstalk, though their strength and significance might fluctuate.
- WNT Signaling (WNT2B-FZD4-LRP5): This interaction appears notable, especially within Endo|Endo and Hepatocyte|Hepatocyte pairs in disease conditions like nash_cirrhosis and end_stage_nafld.
Cell Type-Specific Differences:
- Hepatocyte|Hepatocyte: Shows significant interactions involving integrins, BMP6, metabolic ligands, and WNT signaling, suggesting important autocrine regulatory loops.
- Endothelial Cell Interactions (Endo|Endo, Hepatocyte|Endo, Endo|Hepatocyte): These pairs frequently exhibit strong interactions for integrins, VEGFA, and CADM1, reflecting their roles in angiogenesis, cell adhesion, and communication essential for liver vascularity and tissue organization.
- Disease-Specific Patterns: In nash_cirrhosis and end_stage_nafld, several integrin-mediated interactions and VEGFA-receptor pairs appear more consistently significant and/or stronger compared to healthy or nafld states. The end_stage_nafld plot also includes "unassigned" cell types, which show interactions, but their specific contribution cannot be fully interpreted without cell type identity.
Biological Interpretation
The observed cell-cell interaction patterns provide insights into the dynamic interplay between hepatocytes and endothelial cells during NAFLD progression.
- Extracellular Matrix (ECM) Remodeling and Fibrosis: The consistent and often strong presence of various integrin-collagen/fibronectin/vitronectin interactions (e.g., COL18A1-integrin_a2b1_complex, FN1-integrin_a5b1_complex, VTN-integrin_aVB3_complex) points to active ECM remodeling. Integrins are crucial for cell-matrix adhesion, signal transduction, and mediating cellular responses to the microenvironment. In the context of NAFLD, dysregulated ECM is a hallmark of fibrosis, which progresses from simple steatosis to NASH and cirrhosis. The potentially enhanced strength and significance of these interactions in nash_cirrhosis and end_stage_nafld suggest an upregulation of pro-fibrotic signaling and increased cell-matrix communication, contributing to scar tissue formation and liver stiffening. GeneCards: ITGAV, UniProt: Integrins
- Angiogenesis and Vascular Remodeling: The prominent VEGFA-FLT1/KDR/NRP1/NRP2 interactions, particularly within and between endothelial cells and hepatocytes, signify active angiogenesis. In chronic liver diseases like NASH and cirrhosis, there is often a pathological angiogenesis, leading to distorted vascular architecture that impairs liver function and contributes to portal hypertension. The strong presence of these interactions in disease stages indicates attempts at vascular repair or uncontrolled vessel growth. GeneCards: VEGFA, PubMed search: VEGF angiogenesis liver fibrosis
- Metabolic Dysfunction and Lipid Handling: The detection of interactions involving Cholesterol and Dihydrotestosterone with PPARs (e.g., Cholesterol_by_DHCR24_ROROA/PPARA, Dihydrotestosterone_by_SRD5A1A2_PPARG) highlights the central role of lipid and steroid metabolism in NAFLD. PPARs are nuclear receptors that regulate genes involved in fatty acid oxidation, glucose metabolism, and inflammation. Dysregulation of these pathways in hepatocytes is a key driver of steatosis and lipotoxicity. GeneCards: PPARA, GeneCards: PPARG
- TGF-beta and WNT Signaling in Disease Progression: The presence of TGFB2-TGFBR and WNT2B-FZD4-LRP5 interactions is highly relevant to liver pathology. TGF-beta signaling is a well-established master regulator of fibrosis in the liver. WNT signaling also plays complex roles in liver regeneration, fibrosis, and inflammation. Their consistent presence and potential alterations in strength across disease stages suggest their ongoing contribution to tissue repair, scarring, and inflammation. PubMed search: TGF-beta liver fibrosis, PubMed search: WNT signaling liver disease
- Adhesion Molecules: Interactions like CDH5-CDH5 (VE-cadherin) and CADM1-CADM1 are crucial for maintaining cell-cell junctions and vascular integrity, particularly for endothelial cells. Changes in these interactions can affect endothelial barrier function and contribute to inflammation and vascular permeability in diseased livers.
Clinical or Translational Implications
The identified cell-cell interaction patterns offer several potential clinical and translational implications for NAFLD and its progression:
- Therapeutic Targets:
- Anti-fibrotic Strategies: The prominent integrin-mediated interactions present in nash_cirrhosis and end_stage_nafld suggest that targeting specific integrin receptors or their ECM ligands could be a viable anti-fibrotic strategy. Inhibiting these interactions might reduce myofibroblast activation and collagen deposition.
- Anti-angiogenic Therapy: The strong VEGFA signaling in diseased states indicates that modulating VEGF pathways could counteract pathological angiogenesis and potentially normalize liver vasculature, improving perfusion and reducing portal hypertension.
- Metabolic Modulators: The involvement of Cholesterol/Dihydrotestosterone-PPAR interactions suggests that targeting these metabolic axes could help alleviate steatosis and metabolic dysfunction in NAFLD. PPAR agonists are already being explored for NASH treatment.
- WNT/TGF-beta Pathway Inhibition: Given their roles in fibrosis and inflammation, selectively inhibiting overactive WNT or TGF-beta signaling in advanced disease stages could slow or reverse fibrosis.
- Biomarker Discovery: Specific shifts in the strength or significance of certain ligand-receptor interactions, particularly those involving integrins, VEGFA, or WNTs, could serve as novel non-invasive biomarkers for monitoring NAFLD progression from simple steatosis to NASH and cirrhosis. Further validation is needed to assess their diagnostic or prognostic value.
- Experimental Validation: The identified significant interactions provide a strong basis for further experimental validation.
- _In vitro_ studies: Co-culture systems of hepatocytes and liver endothelial cells could be used to investigate the functional consequences of perturbing these specific ligand-receptor interactions (e.g., using neutralizing antibodies or small molecule inhibitors) on fibrosis, angiogenesis, and metabolic parameters.
- _In vivo_ models: Animal models of NAFLD/NASH could be employed to test the therapeutic efficacy of targeting these pathways and assess their impact on liver histology and disease progression.
- Spatial Omics: Technologies like spatial transcriptomics could further elucidate the precise cellular neighborhoods where these critical interactions occur and how they are altered in the diseased liver microenvironment.
10. Condition-Specific Cell-Cell Interaction Patterns in NAFLD Progression
[Analysis Visualization Results]...
Analysis Overview
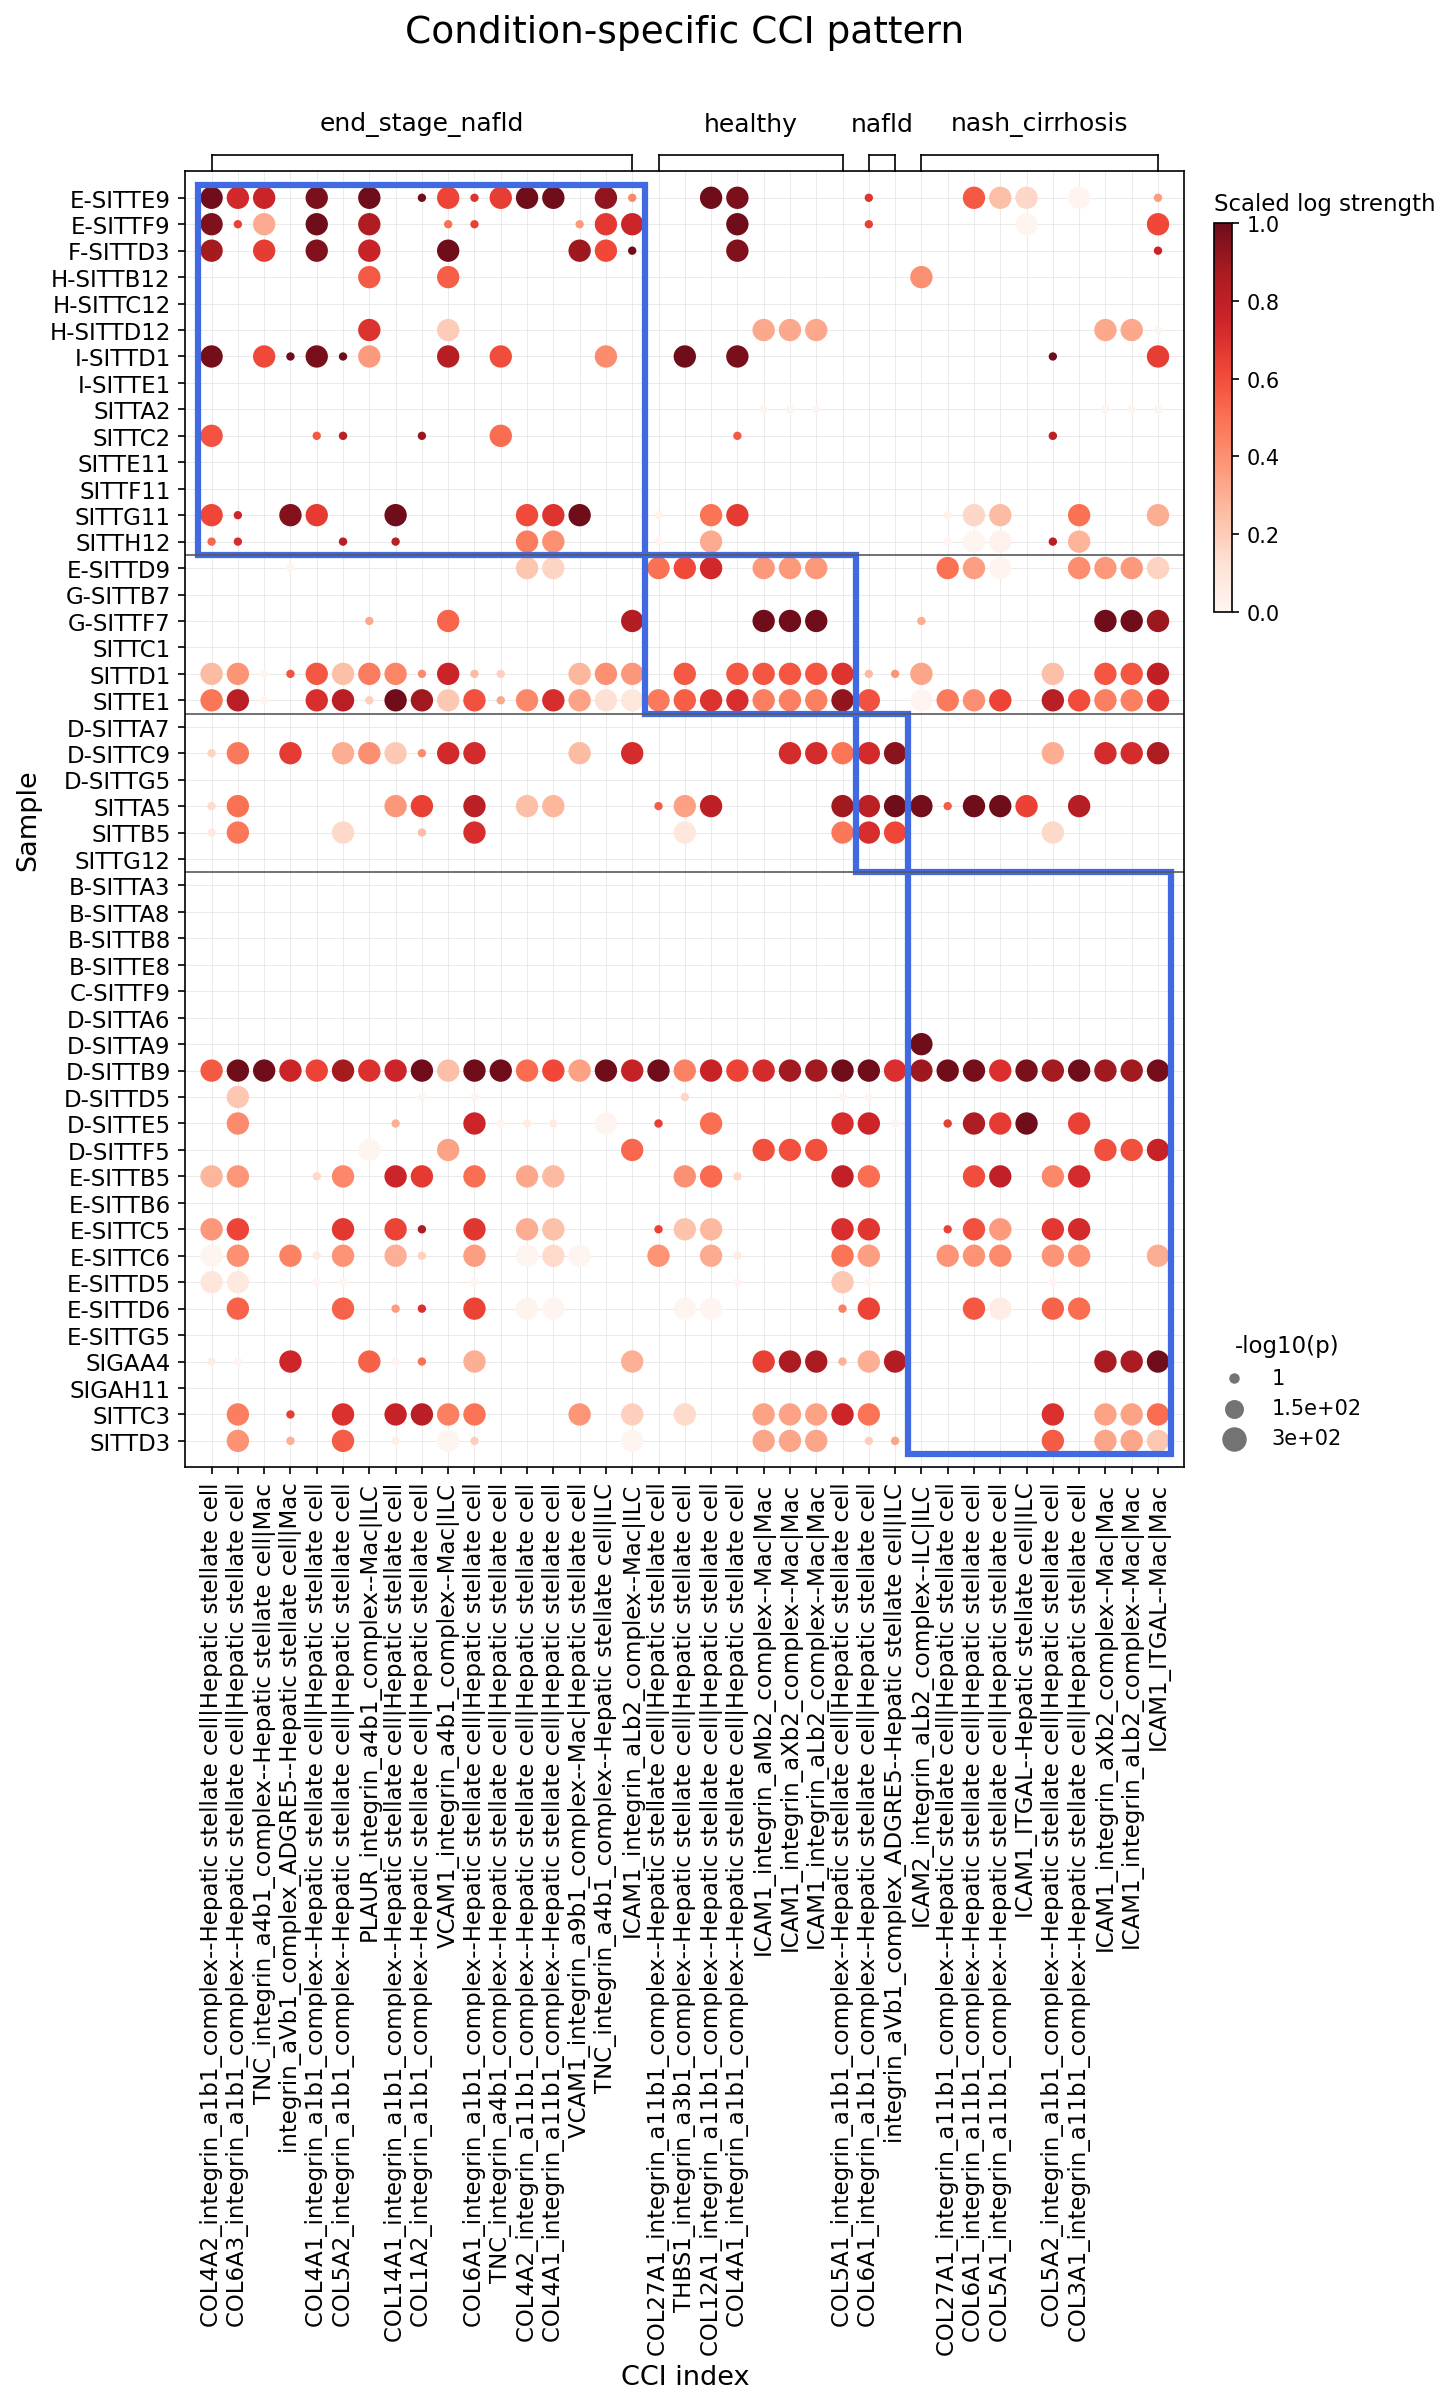
This analysis investigates condition-specific cell-cell interaction (CCI) patterns using a dot plot visualization. The plot displays the strength and significance of interactions between various immune and stromal cell types, with a focus on integrin-mediated interactions, across different samples grouped by liver disease conditions (end_stage_nafld, healthy, nafld, nash_cirrhosis). The x-axis represents specific ligand-receptor or gene-pair interactions and their respective interacting cell types (e.g., COL4A2-integrin_a1b1_complex -- Hepatic stellate cell|Hepatic stellate cell), while the y-axis lists individual samples, clustered by disease condition. The color intensity of each dot indicates the scaled log strength of the interaction, and the dot size reflects the statistical significance (larger dots represent smaller p-values, specifically -log10(p)). This approach allows for the identification of CCIs that are differentially active during the progression of Nonalcoholic fatty liver disease (NAFLD) to Nonalcoholic steatohepatitis (NASH) and cirrhosis.
Visual Summary
The dot plot clearly segregates cell-cell interaction patterns by disease condition.
- Disease-specific enrichment: A striking observation is the overall higher intensity (darker red) and significance (larger dots) of numerous interactions in samples from end_stage_nafld and nash_cirrhosis compared to healthy and nafld conditions. This suggests a significant increase in specific intercellular communication pathways during advanced liver disease stages.
- Dominant cell types and interactions: Many of the highly active interactions involve Hepatic stellate cell (HSC) as a key player, often interacting with itself or with immune cells like Macrophage and ILC. The integrin family genes (e.g., integrin_a1b1_complex, integrin_a4b1_complex, integrin_aM_b2_complex) are frequently observed as one half of the interacting gene pair, highlighting their central role.
Specific clusters of activity:
- The top left quadrant, corresponding to end_stage_nafld samples, shows a high prevalence of strong and significant interactions involving various collagen (e.g., COL4A1, COL6A1, COL5A2) and Tenascin-C (TNC) interactions with integrin_a1b1_complex on Hepatic stellate cells. Several interactions like PLAUR-integrin_a1b1_complex and THBS1-integrin_a5b1_complex also show increased activity in this group.
- Nash_cirrhosis samples also exhibit strong interaction patterns, particularly those involving VCAM1-integrin_a4b1_complex -- Hepatic stellate cell|Macrophage and ICAM1-integrin_aM_b2_complex -- Macrophage|Macrophage and ICAM1-integrin_aX_b2_complex -- Macrophage|Macrophage. Interactions between Hepatic stellate cell and ILC via integrin_aL_b2_complex are also prominent in this condition.
- Reduced activity in healthy/NAFLD: Healthy samples generally show sparse and weaker interaction signals for these specific pairs, with a few exceptions (e.g., some COL4A1-integrin_a1b1_complex interactions). NAFLD samples display an intermediate pattern, with some interactions showing moderate strength and significance, but generally less pronounced than in end_stage_nafld or nash_cirrhosis.
- Sample variability: Within each condition group, there is some heterogeneity among samples, indicating patient-specific differences in CCI profiles.
Biological Interpretation
The observed CCI patterns strongly correlate with the known pathophysiology of NAFLD progression to NASH and cirrhosis. The prominent involvement of Hepatic stellate cells and immune cells (Macrophages, ILCs) through integrin-mediated interactions points to key mechanisms driving fibrogenesis and inflammation in the diseased liver.
- Hepatic Stellate Cell (HSC) Activation and Fibrosis:
- Collagen-Integrin Interactions (e.g., COL4A1/3/5/6-integrin_a1b1_complex -- Hepatic stellate cell|Hepatic stellate cell): The increased strength and significance of these interactions in end_stage_nafld and nash_cirrhosis suggest enhanced binding of various collagen types (components of the extracellular matrix, ECM) to integrin α1β1 on HSCs. Integrins are critical mechanosensors that transduce signals from the ECM, contributing to HSC activation, proliferation, and differentiation into myofibroblast-like cells, which are the primary producers of fibrotic ECM in the liver. This activation is central to liver fibrosis [NCBI].
- Tenascin-C (TNC)-Integrin Interactions (e.g., TNC-integrin_a1b1_complex -- Hepatic stellate cell|Hepatic stellate cell): Tenascin-C is an ECM glycoprotein that is significantly upregulated during inflammation, wound healing, and fibrosis. Its interaction with integrins, particularly α1β1, can promote HSC migration, proliferation, and survival, and influence the fibrotic microenvironment. TNC contributes to matrix stiffening and perpetuates fibrotic signaling [PubMed Search].
- Thrombospondin-1 (THBS1)-Integrin Interactions (e.g., THBS1-integrin_a5b1_complex -- Hepatic stellate cell|Hepatic stellate cell): THBS1 is a matricellular protein known to activate latent TGF-β, a master regulator of fibrosis. Its interaction with integrin α5β1 on HSCs can drive the production of ECM proteins and amplify pro-fibrotic signaling. THBS1 also modulates immune cell function and angiogenesis.
- PLAUR (uPAR)-Integrin Interactions (e.g., PLAUR-integrin_a1b1_complex -- Hepatic stellate cell|Hepatic stellate cell): Urokinase plasminogen activator receptor (uPAR, encoded by PLAUR) is involved in extracellular proteolysis, cell adhesion, and migration. Its interaction with integrins on HSCs can influence ECM remodeling and cell motility, crucial aspects of fibrosis progression.
- Immune Cell Infiltration and Inflammation:
- VCAM1-Integrin Interactions (e.g., VCAM1-integrin_a4b1_complex -- Hepatic stellate cell|Macrophage, VCAM1-integrin_a4b1_complex -- Hepatic stellate cell|ILC): Vascular cell adhesion molecule 1 (VCAM1) is expressed on activated endothelial cells and some stromal cells (like HSCs) and binds to integrin α4β1 (VLA-4) on leukocytes, including macrophages and ILCs. Elevated VCAM1-integrin α4β1 interactions are crucial for immune cell recruitment to inflammatory sites in the liver, perpetuating chronic inflammation characteristic of NASH and cirrhosis.
- ICAM1/2-Integrin Interactions (e.g., ICAM1-integrin_aM_b2_complex -- Macrophage|Macrophage, ICAM1-integrin_aX_b2_complex -- Macrophage|Macrophage, ICAM2-integrin_aM_b2_complex -- Hepatic stellate cell|Macrophage): Intercellular adhesion molecules 1 and 2 (ICAM1, ICAM2) interact with integrins αMβ2 (Mac-1) and αXβ2 (p150,95) on myeloid cells like macrophages. These interactions are fundamental for immune cell adhesion, transmigration, antigen presentation, and activation within the liver microenvironment. Enhanced Macrophage-Macrophage interactions, particularly prominent in nash_cirrhosis, suggest a robust inflammatory milieu and potential for macrophage aggregation or activation that drives pathology.
- ADGRE5 (CD97)-Integrin Interactions (e.g., ADGRE5-integrin_aVb1_complex -- Hepatic stellate cell|Macrophage): ADGRE5 (CD97) is an adhesion G protein-coupled receptor involved in cell-cell adhesion and immune regulation. Its interaction with integrin αVβ1 could mediate complex signaling between HSCs and macrophages, contributing to liver inflammation and fibrosis.
Clinical or Translational Implications
The identified cell-cell interactions represent promising targets for therapeutic intervention in NAFLD, NASH, and liver fibrosis.
- Targeting Integrins:
- Mechanism: Integrins, as key mediators of cell-ECM and cell-cell communication, play a central role in HSC activation and immune cell trafficking. Inhibiting specific integrins can disrupt multiple pathogenic pathways simultaneously.
Potential Targets:
- Integrin α1β1: Inhibition could reduce HSC activation and collagen binding.
- Integrin α4β1 (VLA-4): Blocking this interaction could prevent the recruitment of inflammatory macrophages and ILCs to the liver, reducing inflammation.
- Integrin αMβ2 (Mac-1) and αXβ2: Targeting these on macrophages could reduce their adhesion, activation, and inflammatory functions.
- Integrin αVβ1: Inhibition could prevent the activation of latent TGF-β, a major pro-fibrotic cytokine, and modulate HSC-macrophage interactions.
- Therapeutic Agents: Small molecule inhibitors or monoclonal antibodies against specific integrins are in various stages of development for fibrotic and inflammatory diseases. For instance, drugs like natalizumab (anti-α4 integrin) and vedolizumab (anti-α4β7 integrin) are approved for other conditions, demonstrating the feasibility of integrin-targeting therapies. For liver fibrosis, specific αV integrin inhibitors have shown promise in preclinical models by reducing collagen deposition and inflammation [NCBI].
- Targeting Adhesion Molecules (Ligands):
- Mechanism: Disrupting the interaction of VCAM1, ICAM1, or ICAM2 with their integrin partners can limit immune cell infiltration and adhesion within the liver.
Potential Targets:
- VCAM1: Blocking VCAM1 could reduce the influx of macrophages and ILCs.
- ICAM1/ICAM2: Inhibiting these could reduce inflammatory macrophage interactions and activation.
- Therapeutic Agents: Anti-VCAM1 or anti-ICAM1 antibodies could be explored to reduce liver inflammation. However, systemic inhibition of adhesion molecules might lead to broader immune suppression, necessitating targeted delivery or highly specific inhibitors.
- Targeting ECM Components:
- Mechanism: Inhibiting the effects of profibrotic ECM proteins like Tenascin-C (TNC) or Thrombospondin-1 (THBS1) could mitigate HSC activation and ECM remodeling.
Potential Targets:
- Tenascin-C: Direct inhibition of TNC or its interaction with integrins could reduce its pro-fibrotic and pro-inflammatory effects.
- Thrombospondin-1: Targeting THBS1 could indirectly reduce TGF-β activation and overall fibrogenesis.
- Therapeutic Agents: While direct TNC or THBS1 inhibitors are less common in clinical use for fibrosis, strategies to modulate their expression or block their binding domains are under investigation.
In summary, the detailed analysis of condition-specific CCI patterns identifies a network of integrin-mediated interactions involving HSCs, macrophages, and ILCs that are highly active in advanced NAFLD. These interactions offer actionable targets for developing novel anti-fibrotic and anti-inflammatory therapies for NASH and cirrhosis.
11. Hepatocyte Surfaceome Marker Expression Across NAFLD Progression
[Analysis Visualization Results]...
Analysis Overview
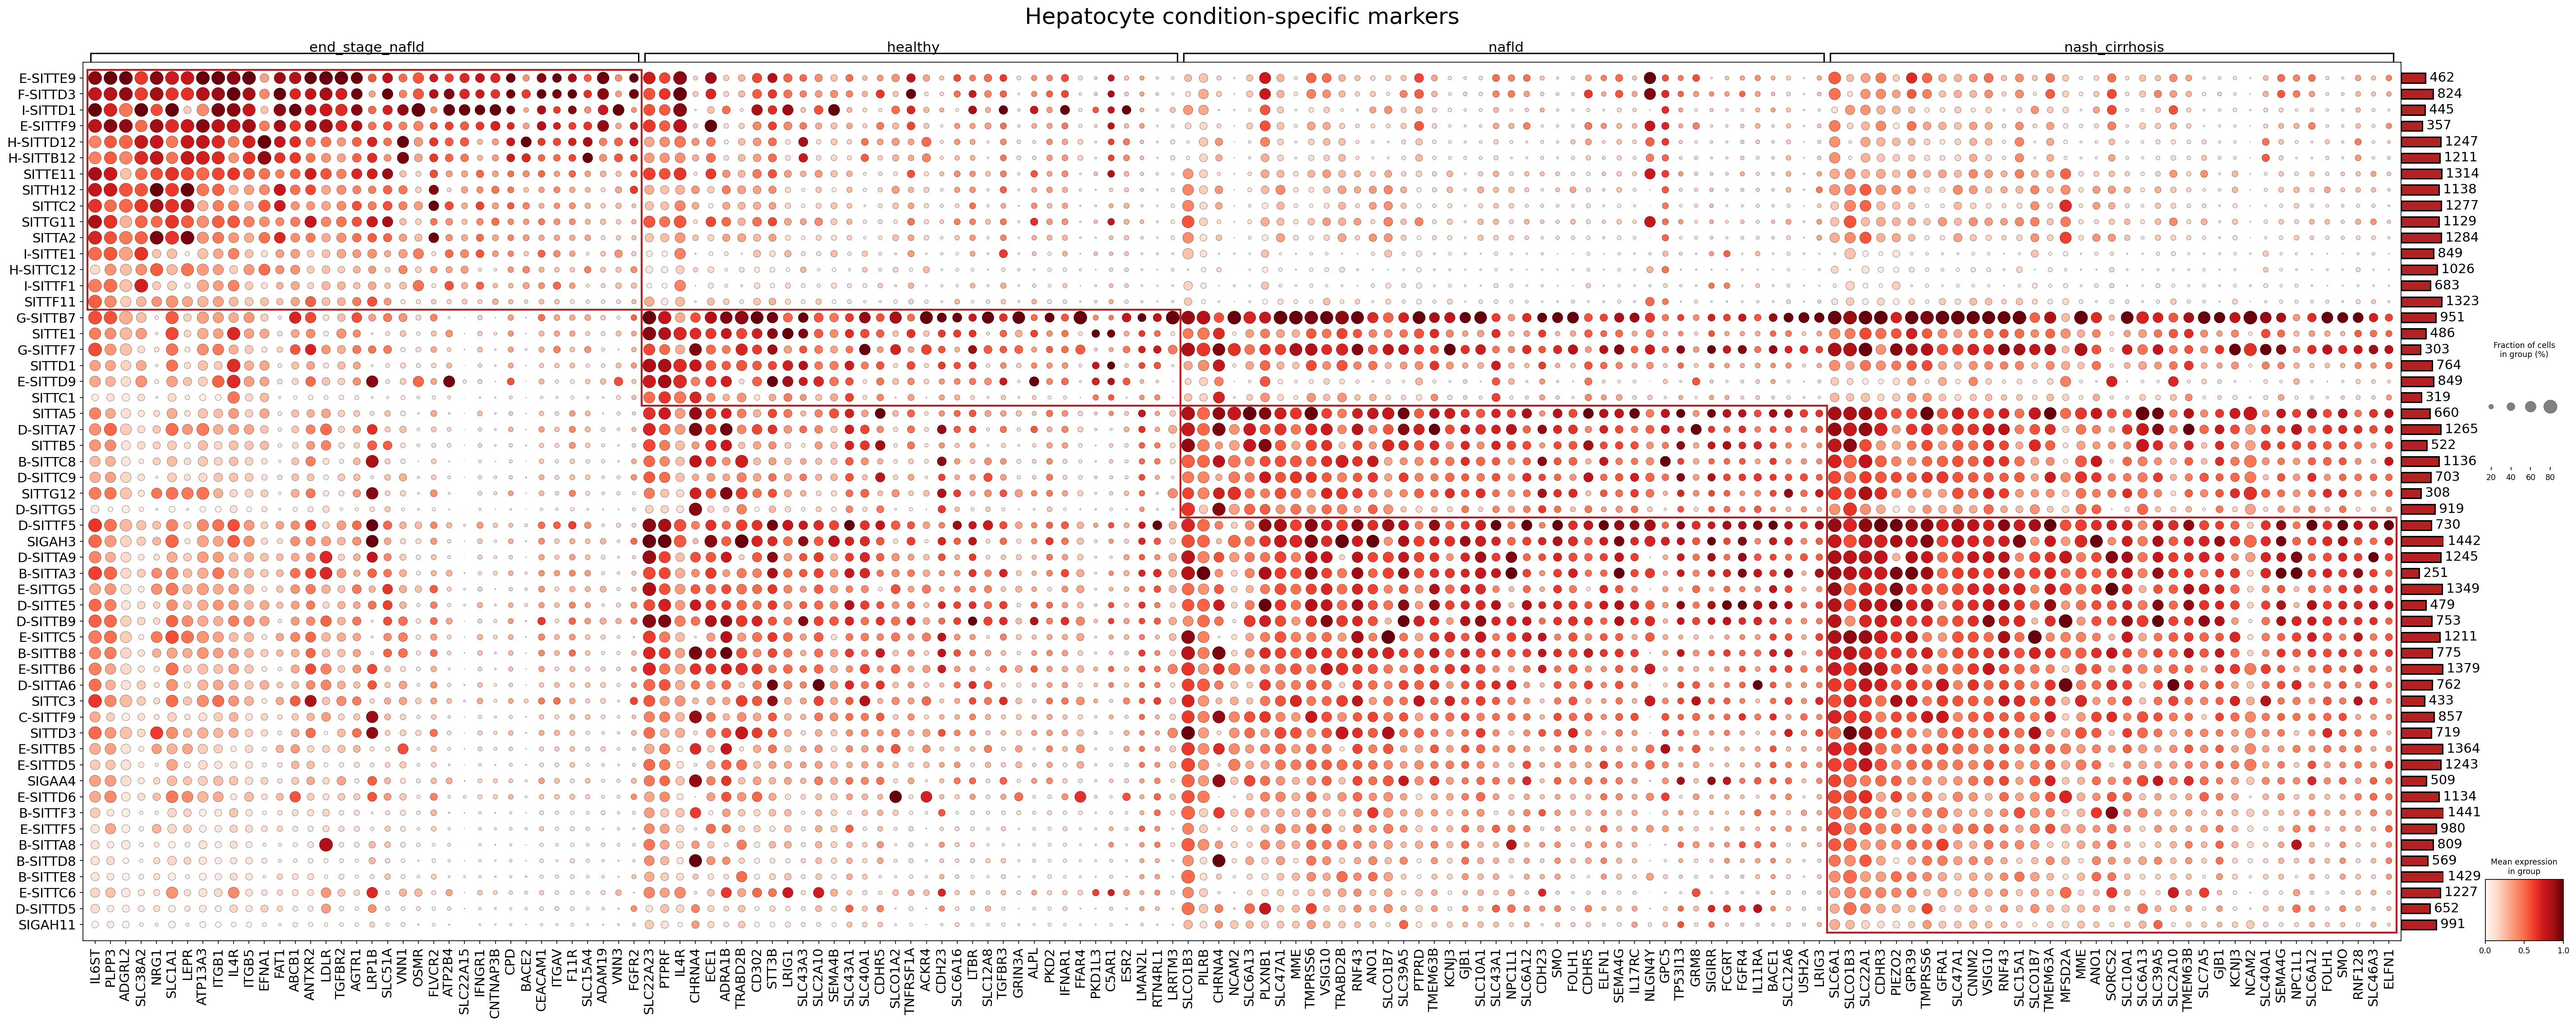
This analysis presents a dot plot illustrating the expression patterns of surfaceome markers in Hepatocytes across different stages of Nonalcoholic Fatty Liver Disease (NAFLD) progression: healthy, nafld, nash_cirrhosis, and end_stage_nafld. The plot identifies markers that are differentially expressed and prevalent in Hepatocytes within these conditions, with a specific focus on surface proteins. The dot size represents the fraction of cells expressing a given gene, and the color intensity indicates the mean expression level of the gene in those cells. The objective is to identify condition-specific surface markers that could serve as diagnostic biomarkers or therapeutic targets.
Visual Summary
The dot plot clearly reveals distinct patterns of hepatocyte surfaceome marker expression across the four conditions.
- Healthy Condition: Hepatocytes from healthy individuals exhibit a baseline expression of several markers, but generally, fewer genes show high expression and prevalence compared to the diseased states, especially in the upper section of the plot. There are some genes, like those in the middle band (e.g., SITTF1, G-SITTF7), that show higher expression in healthy compared to end-stage NAFLD, but often also moderate expression in NAFLD.
- NAFLD Condition: This stage shows an intermediate pattern for many genes, often with increased expression and prevalence compared to healthy, but generally less pronounced than in nash_cirrhosis or end_stage_nafld. Several genes show moderate upregulation here.
- NASH_cirrhosis and End_stage_nafld Conditions: These two advanced disease stages demonstrate significantly overlapping and highly upregulated marker expression profiles. A substantial number of surface markers show high mean expression (darker red dots) and high prevalence (larger dots) in these conditions. This suggests a profound alteration in the hepatocyte surface proteome as the disease progresses to more severe forms, likely reflecting increased inflammation, fibrosis, and cellular stress.
- Many genes, particularly in the lower half of the plot (e.g., MME, TMPRSS6, VSIG10, RNF43, ANO1, SLCO1B7, SLC39A5, PTPRD), are strongly upregulated and widely expressed in both nash_cirrhosis and end_stage_nafld, while showing minimal or no expression in healthy hepatocytes. This indicates these markers are highly associated with advanced liver disease.
- Other markers, like AGTR1, LRP1B, LDLR, and VNN1, also show increased expression and prevalence in diseased states compared to healthy, suggesting their involvement throughout disease progression.
Overall, the visualization highlights a clear shift in hepatocyte surface protein profiles from healthy to advanced NAFLD, with numerous potential markers distinguishing the severe stages (NASH/cirrhosis, end-stage NAFLD) from earlier stages and healthy tissue.
Biological Interpretation
The differential expression of surfaceome markers in hepatocytes across NAFLD progression offers critical insights into the underlying cellular mechanisms and potential therapeutic vulnerabilities.
Key Upregulated Markers in Advanced NAFLD (NASH/Cirrhosis, End-Stage NAFLD)
- MME (Neprilysin / CD10)
- Signaling Pathways & Mechanisms: MME is a zinc metallopeptidase involved in the degradation of various biologically active peptides, including natriuretic peptides, bradykinin, and enkephalins. In the liver, MME expression on hepatocytes in advanced NAFLD/NASH could be indicative of cellular stress and altered metabolic function, or even a response to accumulating profibrotic peptides. Elevated MME activity can contribute to the proteolytic environment, potentially influencing the bioavailability of signaling molecules involved in fibrosis and inflammation.
- Therapeutic Potential: As MME is a surface enzyme, its inhibition could modulate local peptide signaling. For instance, by preventing the degradation of antifibrotic peptides, it could theoretically attenuate fibrosis. Dual inhibitors targeting neprilysin and the angiotensin-converting enzyme are already used in cardiovascular disease (e.g., sacubitril/valsartan) and could be investigated for liver applications. GeneCards MME
- AGTR1 (Angiotensin II Receptor Type 1)
- Signaling Pathways & Mechanisms: AGTR1 mediates the major effects of angiotensin II, a key component of the Renin-Angiotensin System (RAS). Activation of AGTR1 by angiotensin II promotes vasoconstriction, inflammation, oxidative stress, and fibrosis. In the liver, activation of AGTR1 on hepatocytes and other cell types (like hepatic stellate cells) contributes significantly to NAFLD progression, NASH, and fibrosis. It stimulates pathways involving MAPK, PKC, and NF-κB, leading to increased lipid accumulation, inflammation, and extracellular matrix deposition.
- Therapeutic Potential: Angiotensin Receptor Blockers (ARBs), which specifically inhibit AGTR1, are well-established therapeutics for hypertension and heart failure. Given the strong evidence for RAS involvement in liver fibrosis, ARBs represent a promising therapeutic strategy to mitigate NAFLD/NASH progression and fibrosis. Clinical trials investigating ARBs in NAFLD/NASH have shown beneficial effects on inflammation and fibrosis markers. PubMed search for AGTR1 liver fibrosis therapeutics
- OSMR (Oncostatin M Receptor)
- Signaling Pathways & Mechanisms: OSMR is a subunit of the receptor for Oncostatin M (OSM), a cytokine belonging to the IL-6 family. OSM/OSMR signaling activates the JAK/STAT pathway (primarily STAT3), as well as MAPK and PI3K pathways. In the context of chronic liver disease, OSM is a potent profibrotic and pro-inflammatory cytokine. Its increased expression on hepatocytes in NASH/cirrhosis suggests that hepatocytes become more responsive to OSM, contributing to inflammation, hepatocyte dysfunction, and the perpetuation of fibrotic responses, potentially through cross-talk with other liver cells.
- Therapeutic Potential: Targeting OSM or its receptor, OSMR, could be a strategy to attenuate liver inflammation and fibrosis. Neutralizing antibodies against OSM or inhibitors of the JAK/STAT pathway are being explored in various fibrotic diseases and could have relevance for advanced NAFLD/NASH. UniProt OSMR
- VNN1 (Vanin-1)
- Signaling Pathways & Mechanisms: VNN1 is a GPI-anchored ectoenzyme with pantetheinase activity, converting pantetheine into pantothenic acid (vitamin B5) and cysteamine. This enzymatic activity influences cellular redox status, oxidative stress, and inflammation. Upregulation of VNN1 in hepatocytes in advanced NAFLD can exacerbate oxidative stress through cysteamine production, which depletes glutathione and promotes reactive oxygen species (ROS) generation. VNN1 has also been implicated in immune cell trafficking and modulation of inflammatory responses.
- Therapeutic Potential: Modulating VNN1 activity or expression could influence oxidative stress and inflammation in the liver. Specific VNN1 inhibitors are being investigated as potential anti-inflammatory or antioxidant agents. GeneCards VNN1
- SLC40A1 (Ferroportin-1)
- Signaling Pathways & Mechanisms: SLC40A1 is the sole known mammalian iron exporter. Its expression is regulated by hepcidin. Upregulation of SLC40A1 in hepatocytes in advanced NAFLD might reflect altered iron homeostasis in the diseased liver, potentially as an adaptive response to prevent intracellular iron accumulation, or it could be dysregulated. Iron overload is a known contributor to oxidative stress and liver injury in NAFLD/NASH. Changes in ferroportin expression can influence the severity of iron-related damage.
- Therapeutic Potential: Targeting iron metabolism is an active area of research in liver disease. While direct modulation of SLC40A1 is complex due to its critical role in systemic iron homeostasis, therapies aimed at reducing hepatic iron overload (e.g., iron chelators) or modulating hepcidin-ferroportin axis could be beneficial in NAFLD/NASH patients with iron dysregulation. PubMed search for SLC40A1 NAFLD iron metabolism
- TMPRSS6 (Transmembrane Serine Protease 6 / Matriptase-2)
- Signaling Pathways & Mechanisms: TMPRSS6 is a serine protease expressed primarily in the liver. It plays a crucial role in iron homeostasis by cleaving and inactivating hemojuvelin (HJV), a co-receptor for bone morphogenetic proteins (BMPs). By inactivating HJV, TMPRSS6 reduces hepcidin synthesis, thereby increasing iron absorption and export. Its upregulation in advanced NAFLD could contribute to systemic or local iron dysregulation, which is a known cofactor in NAFLD/NASH pathogenesis, exacerbating oxidative stress and liver damage.
- Therapeutic Potential: Inhibiting TMPRSS6 could increase hepcidin levels, thereby reducing iron absorption and release from stores. This approach could be beneficial in NAFLD/NASH patients with elevated iron. Conversely, if TMPRSS6 is upregulated as a compensatory mechanism, its inhibition might have unintended consequences. Modulators of TMPRSS6 are being investigated for iron-related disorders. GeneCards TMPRSS6
- LRP1B (Low Density Lipoprotein Receptor Related Protein 1B)
- Signaling Pathways & Mechanisms: LRP1B is a large endocytic receptor involved in the clearance of diverse ligands, including apolipoproteins, proteases, and matrix metalloproteinases. Its upregulation in NAFLD progression suggests alterations in lipid metabolism, extracellular matrix remodeling, or signaling pathways involving its ligands. LRP1B's role in clearing pro-atherogenic lipids and its inverse association with metabolic syndrome in some contexts make its increased expression in NAFLD a complex finding that might reflect compensatory mechanisms or dysregulation of lipid and lipoprotein processing by hepatocytes.
- Therapeutic Potential: Understanding the specific ligands and pathways LRP1B engages in the context of NAFLD could reveal novel therapeutic avenues. Modulating its activity might influence lipid handling or the clearance of inflammatory/fibrotic mediators. GeneCards LRP1B
- PTPRD (Receptor-type tyrosine-protein phosphatase delta)
- Signaling Pathways & Mechanisms: PTPRD is a transmembrane protein tyrosine phosphatase that dephosphorylates specific tyrosine residues on target proteins, thereby regulating various signaling pathways. It plays roles in cell adhesion, neuronal development, and tumor suppression. In the context of NAFLD, altered PTPRD expression could impact signaling pathways critical for hepatocyte survival, proliferation, and interaction with the extracellular matrix, potentially influencing the progression of liver damage and fibrogenesis. Its specific targets in hepatocytes during NAFLD progression warrant further investigation.
- Therapeutic Potential: As a phosphatase, PTPRD offers druggable potential. Modulating its activity could fine-tune tyrosine phosphorylation-dependent signaling, potentially correcting dysregulated pathways in advanced liver disease. Specific inhibitors or activators could be developed based on its precise role in disease. UniProt PTPRD
Clinical or Translational Implications
The identification of condition-specific surfaceome markers in hepatocytes during NAFLD progression provides several important clinical and translational implications:
- Biomarker Development: Genes like MME, AGTR1, OSMR, VNN1, SLC40A1, and TMPRSS6, which show significant upregulation in NASH/cirrhosis and end-stage NAFLD, represent strong candidates for novel diagnostic or prognostic biomarkers. Their presence on the cell surface makes them amenable to detection via liquid biopsies (e.g., circulating extracellular vesicles or cell-free DNA/RNA from hepatocytes) or non-invasive imaging techniques. Such biomarkers could help stratify patients, monitor disease progression, and assess treatment response more effectively than current methods.
- Therapeutic Target Identification: The identified surface markers are directly accessible targets for drug development.
- AGTR1: Given the established efficacy of ARBs, repositioning these drugs for NAFLD/NASH treatment is a highly promising and actionable strategy.
- MME, OSMR, VNN1, SLC40A1, TMPRSS6, PTPRD: These offer novel targets for which specific small molecules or biologic agents (e.g., antibodies blocking receptor function or enzyme activity) could be developed. For instance, inhibitors of proteases (MME, TMPRSS6), receptor antagonists (OSMR), or modulators of transporters (SLC40A1) could interrupt disease-driving pathways in hepatocytes.
- Understanding Disease Mechanisms: These markers highlight specific pathways (e.g., RAS, iron metabolism, inflammatory cytokine signaling, oxidative stress) that are profoundly altered in hepatocytes during NAFLD progression. Further research into the precise roles of these surface proteins can deepen our understanding of NAFLD pathogenesis, facilitating the development of targeted therapies.
- Patient Stratification and Precision Medicine: Understanding the specific surfaceome alterations in patient subgroups might enable more precise therapeutic interventions. For example, patients with high AGTR1 or OSMR expression might respond better to respective pathway inhibitors.
- Ex-vivo Models and Drug Screening: The identified markers can be used to characterize and validate in vitro and ex vivo models of NAFLD, providing better tools for drug discovery and mechanistic studies.
12. Macrophage Surfaceome Marker Analysis Across NAFLD Progression
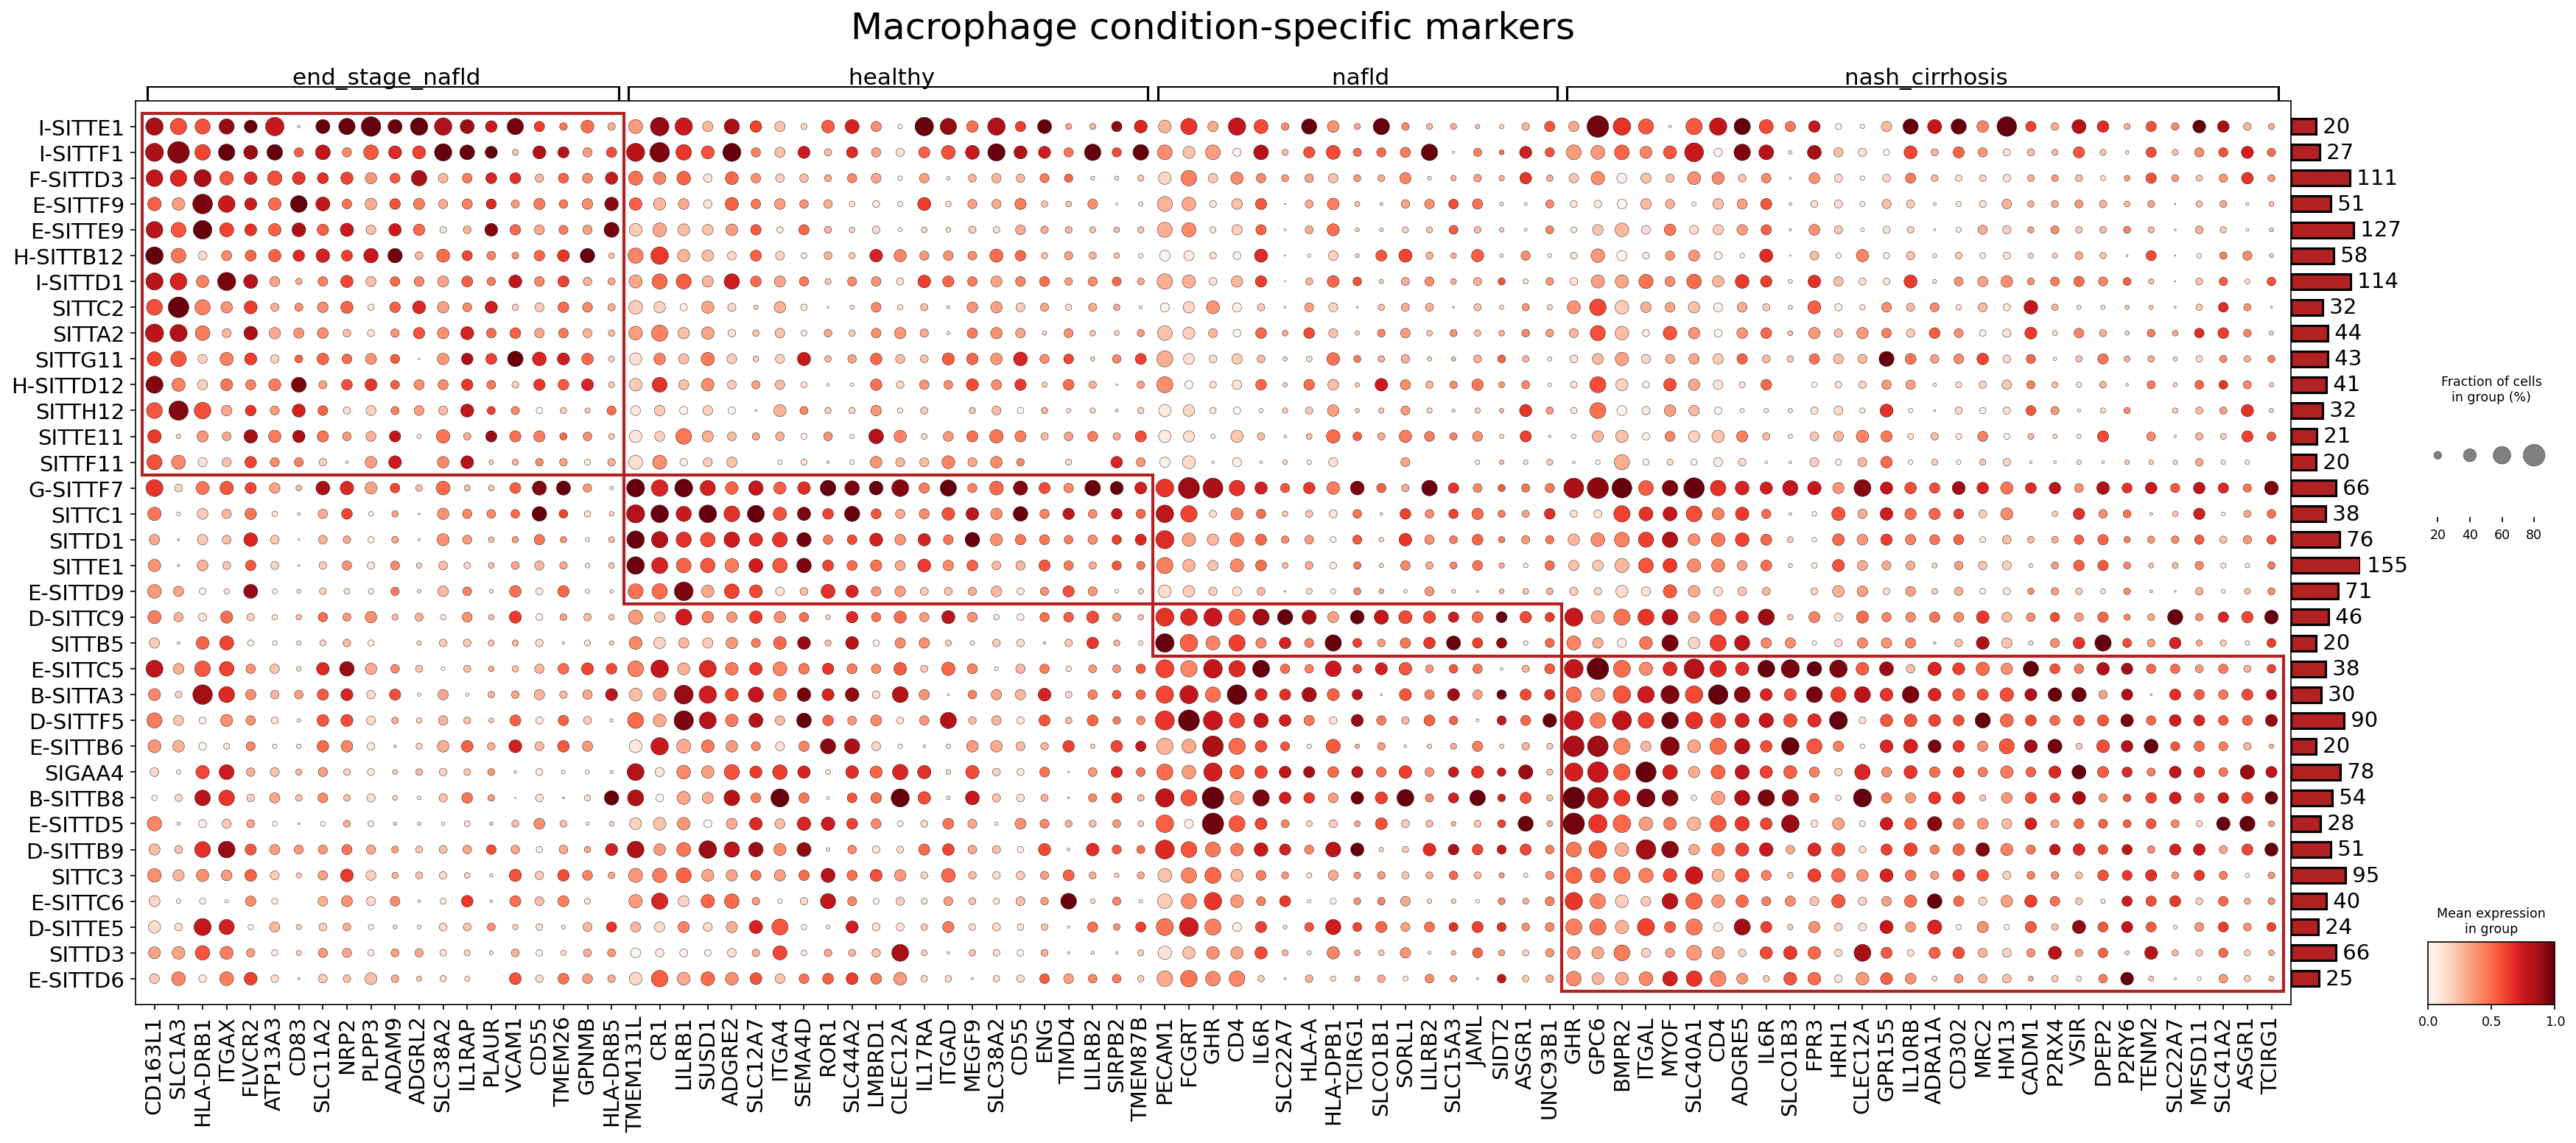
[Analysis Visualization Results]...
Analysis Overview
This analysis presents a dot plot visualizing the expression of surfaceome markers in Macrophage cell populations across different conditions of Nonalcoholic Fatty Liver Disease (NAFLD) progression: healthy, nafld, nash_cirrhosis, and end_stage_nafld. The y-axis represents various macrophage sub-clusters or states (labeled as SITT groups), while the x-axis displays individual gene symbols corresponding to surface proteins. Each dot's color intensity indicates the mean expression level of a marker within the group, and its size represents the fraction of cells expressing that marker. The right-hand bar plot provides the total number of cells contributing to each macrophage sub-cluster. The goal is to identify condition-specific surface markers that highlight biological mechanisms and potential therapeutic targets.
Visual Summary
The dot plot reveals distinct patterns of surfaceome marker expression across the analyzed conditions and macrophage sub-clusters.
- Condition-Specific Expression Signatures: Several genes exhibit clear enrichment in specific disease states.
- end_stage_nafld macrophages (especially in upper SITT groups like I-SITTE1, I-SITTF1, F-SITTD3, E-SITTF9) show high expression of markers such as CD163L1, ADGRA2, P2RY6, SUSD1, FLVCR2, and HLA-DRB1.
- healthy macrophages (particularly in lower SITT groups like SITTC1, SITTD1, SITTF1, E-SITTD9) are characterized by prominent expression of SLC1A3, ATP13A3, SLC11A2, NRP2, PLPP3, and ADAM9, which appear largely diminished in disease conditions.
- nafld macrophages (in middle SITT groups) demonstrate elevated expression of markers like GPNMB, VCAM1, SEMA4D, ITGA4, PLAUR, and TMEM26.
- nash_cirrhosis macrophages (in lower SITT groups) display strong expression of CD40, ADGRE5, MRC2, IL10RB, CADM1, and CLEC12A.
- Heterogeneity within Macrophages: The various 'SITT' labels on the y-axis indicate considerable heterogeneity within the broader macrophage population, with different sub-clusters showing distinct marker profiles even within the same condition. This suggests diverse functional states of macrophages during NAFLD progression.
- General Macrophage Activation Markers: Some markers like CD68 and HLA-DRB1 show broad expression across multiple conditions, reflecting general macrophage presence and antigen-presenting capabilities, but with varying intensities and specific sub-cluster prevalence across the disease spectrum.
- Fraction of Cells: The bar charts on the right illustrate the number of cells per SITT group, providing context on the abundance of each macrophage sub-population.
Biological Interpretation
The distinct surfaceome marker profiles in macrophages across different NAFLD progression stages highlight their dynamic roles in inflammation, lipid metabolism, immune modulation, and fibrosis within the liver.
Markers Enriched in end_stage_nafld Macrophages:
Macrophages in end-stage NAFLD (cirrhosis) exhibit markers indicative of chronic inflammation, dysfunctional lipid handling, and immune activation, contributing to tissue damage and fibrosis.
- CD163L1 (MSR1): This scavenger receptor is involved in phagocytosis of modified lipids and cellular debris. Its high expression suggests an accumulation of cellular waste and dysfunctional lipid metabolism, often associated with M2-like macrophages that can contribute to fibrosis or impaired resolution in chronic disease. GeneCards: MSR1
- P2RY6: A P2Y purinoceptor, this G protein-coupled receptor is activated by UDP and mediates inflammatory responses, including chemokine production and phagocytosis. Its upregulation indicates heightened pro-inflammatory signaling in advanced liver disease, contributing to sustained inflammation. PubMed: P2RY6 macrophages inflammation liver
- ADGRA2 (LPHN2): An adhesion G protein-coupled receptor involved in cell adhesion and signal transduction. Its specific upregulation in end-stage disease may reflect altered cell-cell or cell-matrix interactions critical for macrophage infiltration, retention, or activation in a severely damaged liver environment. GeneCards: ADGRA2
- FLVCR2: Feline Leukemia Virus Subgroup C Receptor 2 is a heme exporter. Dysregulation of heme metabolism in macrophages can lead to increased oxidative stress and inflammation, contributing to liver injury in advanced NAFLD. GeneCards: FLVCR2
- SUSD1: Sushi Domain Containing 1 protein. While its precise function in macrophages and liver disease is less characterized, sushi domains are typically involved in protein-protein interactions and can play roles in complement regulation and cell adhesion, suggesting its involvement in immune-mediated processes. GeneCards: SUSD1
- CD83: A glycoprotein expressed on activated immune cells. Its high expression in end-stage disease indicates increased macrophage activation and their potential role in antigen presentation and T-cell activation, further fueling chronic inflammation. GeneCards: CD83
Markers Enriched in healthy Macrophages:
Healthy liver macrophages display markers suggesting roles in tissue homeostasis, metabolic regulation, and basal immune surveillance. Their downregulation in disease states points to a loss of these homeostatic functions.
- SLC1A3 (EAAT1): A glutamate transporter. Its high expression suggests that healthy macrophages are involved in maintaining local glutamate homeostasis, potentially influencing metabolic pathways or immune cell signaling in the quiescent liver. GeneCards: SLC1A3
- ATP13A3: A lysosomal polyamine transporter. Polyamines are crucial for cell growth and proliferation, and their transport can modulate immune cell function. High expression implies a role in maintaining cellular metabolic balance within healthy liver macrophages. GeneCards: ATP13A3
- SLC11A2 (DMT1): A divalent metal ion transporter, primarily involved in iron uptake. Macrophages are central to iron recycling. Its robust expression in healthy macrophages highlights their role in maintaining iron homeostasis, a process often dysregulated in liver disease. GeneCards: SLC11A2
- NRP2 (Neuropilin 2): A co-receptor for semaphorins and VEGF, involved in angiogenesis, lymphangiogenesis, and immune cell guidance. Its presence suggests a role in maintaining vascular integrity, lymphatic drainage, or basal immune cell positioning in the healthy liver. GeneCards: NRP2
- PLPP3: Phospholipid Phosphatase 3, involved in lipid metabolism and signaling by dephosphorylating lysophosphatidic acid. Its high expression indicates a role in maintaining lipid homeostasis and modulating lipid-mediated signaling in healthy macrophages, a function likely compromised in NAFLD. GeneCards: PLPP3
- ADAM9: A disintegrin and metalloproteinase, involved in shedding of cell surface proteins, cell adhesion, and various cellular processes. Its high expression in healthy macrophages might contribute to tissue remodeling or immune regulation under normal conditions. GeneCards: ADAM9
Markers Enriched in nafld Macrophages:
Macrophages in NAFLD (fatty liver) show markers suggesting early inflammatory responses, altered lipid handling, and increased cell adhesion and migration, preceding overt fibrosis.
- GPNMB: Glycoprotein non-melanoma protein B is often found on lipid-laden macrophages (foam cells) and is associated with anti-inflammatory or pro-resolving phenotypes (M2-like). However, its role in NAFLD is complex, sometimes linked to fibrosis progression. Its high expression points to active lipid processing and a potentially mixed inflammatory/reparative phenotype. PubMed: GPNMB NAFLD macrophage
- VCAM1: Vascular Cell Adhesion Molecule 1 mediates the adhesion of leukocytes to endothelial cells. Its upregulation suggests increased inflammatory cell recruitment and interaction with the liver endothelium, a hallmark of early inflammation in NAFLD. GeneCards: VCAM1
- SEMA4D: Semaphorin 4D is a transmembrane protein that can activate immune cells and promote migration. Its presence indicates enhanced pro-inflammatory signaling and immune cell trafficking, contributing to the inflammatory cascade in NAFLD. PubMed: SEMA4D macrophage NAFLD
- ITGA4 (CD49d): Integrin Subunit Alpha 4, forming integrins like VLA-4, is critical for leukocyte adhesion to extracellular matrix and counter-receptors on other cells. Its expression facilitates macrophage extravasation and retention in the inflamed NAFLD liver. GeneCards: ITGA4
- PLAUR (uPAR): Urokinase Plasminogen Activator Receptor is involved in pericellular proteolysis, cell adhesion, migration, and immune regulation. High expression suggests enhanced tissue remodeling processes and potentially pro-fibrotic signaling in early NAFLD. PubMed: PLAUR macrophage liver fibrosis
- TMEM26: Transmembrane Protein 26. As a transmembrane protein, it likely plays a role in cell signaling or transport. Its specific upregulation in NAFLD warrants further investigation into its precise function in macrophage activation and disease progression. GeneCards: TMEM26
Markers Enriched in nash_cirrhosis Macrophages:
Macrophages in NASH with cirrhosis exhibit markers related to advanced immune activation, fibrogenesis, and attempts at immune regulation in a highly damaged microenvironment.
- CD40 (CD40A1): A costimulatory receptor on antigen-presenting cells (including macrophages) that interacts with CD40L on T cells. CD40-CD40L signaling is a major pathway for immune activation, driving inflammation and promoting fibrosis in chronic liver disease. PubMed: CD40 macrophage liver fibrosis
- ADGRE5 (CD97): An adhesion G protein-coupled receptor involved in cell adhesion and signal transduction. Its expression points to active macrophage interactions with the fibrotic extracellular matrix and other cells, contributing to disease progression or immune responses. GeneCards: ADGRE5
- MRC2 (CD280, Endo180): Macrophage Receptor C2 is a C-type lectin receptor involved in collagen uptake and extracellular matrix remodeling. Its high expression suggests macrophages are actively involved in the turnover of collagen, crucial for both progression and potential resolution of liver fibrosis. PubMed: MRC2 macrophage liver fibrosis
- IL10RB (IL-10Rβ): Interleukin 10 Receptor Subunit Beta is a component of the receptor for the potent anti-inflammatory cytokine IL-10. Its presence in NASH_cirrhosis macrophages suggests either an active, but possibly overwhelmed, attempt by macrophages to dampen inflammation or a response to the high inflammatory load in the cirrhotic liver. GeneCards: IL10RB
- CADM1 (TSLC1): Cell Adhesion Molecule 1 is involved in homophilic and heterophilic cell-cell adhesion. Its role in advanced liver disease could be linked to altered cellular interactions, immune cell aggregation, or stromal cell engagement within the fibrotic tissue. GeneCards: CADM1
- CLEC12A (MICL): C-Type Lectin Domain Family 12 Member A is an inhibitory receptor expressed on myeloid cells. Its upregulation could signify a negative feedback mechanism to prevent excessive immune activation or contribute to a modulated immune response in the context of chronic inflammation and tissue damage. GeneCards: CLEC12A
Clinical or Translational Implications
The identification of condition-specific surfaceome markers in macrophages provides valuable insights for understanding NAFLD progression and potential therapeutic strategies.
- Diagnostic and Prognostic Biomarkers: Markers like CD163L1, P2RY6, GPNMB, VCAM1, CD40, and MRC2, which show strong differential expression, could serve as non-invasive biomarkers for disease staging (e.g., distinguishing NAFLD from NASH/cirrhosis or identifying end-stage disease) or predicting disease progression in circulating monocytes or liver biopsies.
Therapeutic Targets for NAFLD/NASH:
- Anti-inflammatory strategies: Targeting pro-inflammatory receptors like P2RY6 (in end-stage) or SEMA4D (in NAFLD) could reduce macrophage-driven inflammation.
- Anti-fibrotic strategies: Modulating the activity of MRC2 (collagen uptake) or inhibiting the CD40-CD40L axis could directly impact fibrosis progression in NASH and cirrhosis. Agents that block CD40-CD40L interaction are already explored in autoimmune diseases and could be repurposed. PubMed: CD40 inhibitors
- Modulating Immune Cell Trafficking: Inhibiting adhesion molecules like VCAM1 or ITGA4 could reduce the influx of inflammatory macrophages into the liver, potentially attenuating disease. Antibodies targeting integrins or adhesion molecules are clinically used in other inflammatory conditions. PubMed: Integrin inhibitors inflammatory disease
- Restoring Homeostasis: Understanding the roles of markers highly expressed in healthy macrophages (e.g., SLC1A3, PLPP3, SLC11A2) and their loss in disease could guide strategies to restore macrophage homeostatic functions, promoting disease resolution.
- Targeted Drug Delivery: As surface markers, these proteins could be utilized for targeted delivery of therapeutic agents specifically to disease-associated macrophage populations, minimizing off-target effects. For example, antibodies against CD163L1 or GPNMB could deliver anti-fibrotic or anti-inflammatory payloads.
- Macrophage Reprogramming: The distinct profiles suggest different macrophage polarization states. Future therapies could aim to reprogram disease-associated macrophages towards a more pro-resolving or anti-inflammatory phenotype by targeting these surface receptors.
13. Hepatic Stellate Cell Surfaceome Markers Across NAFLD Progression
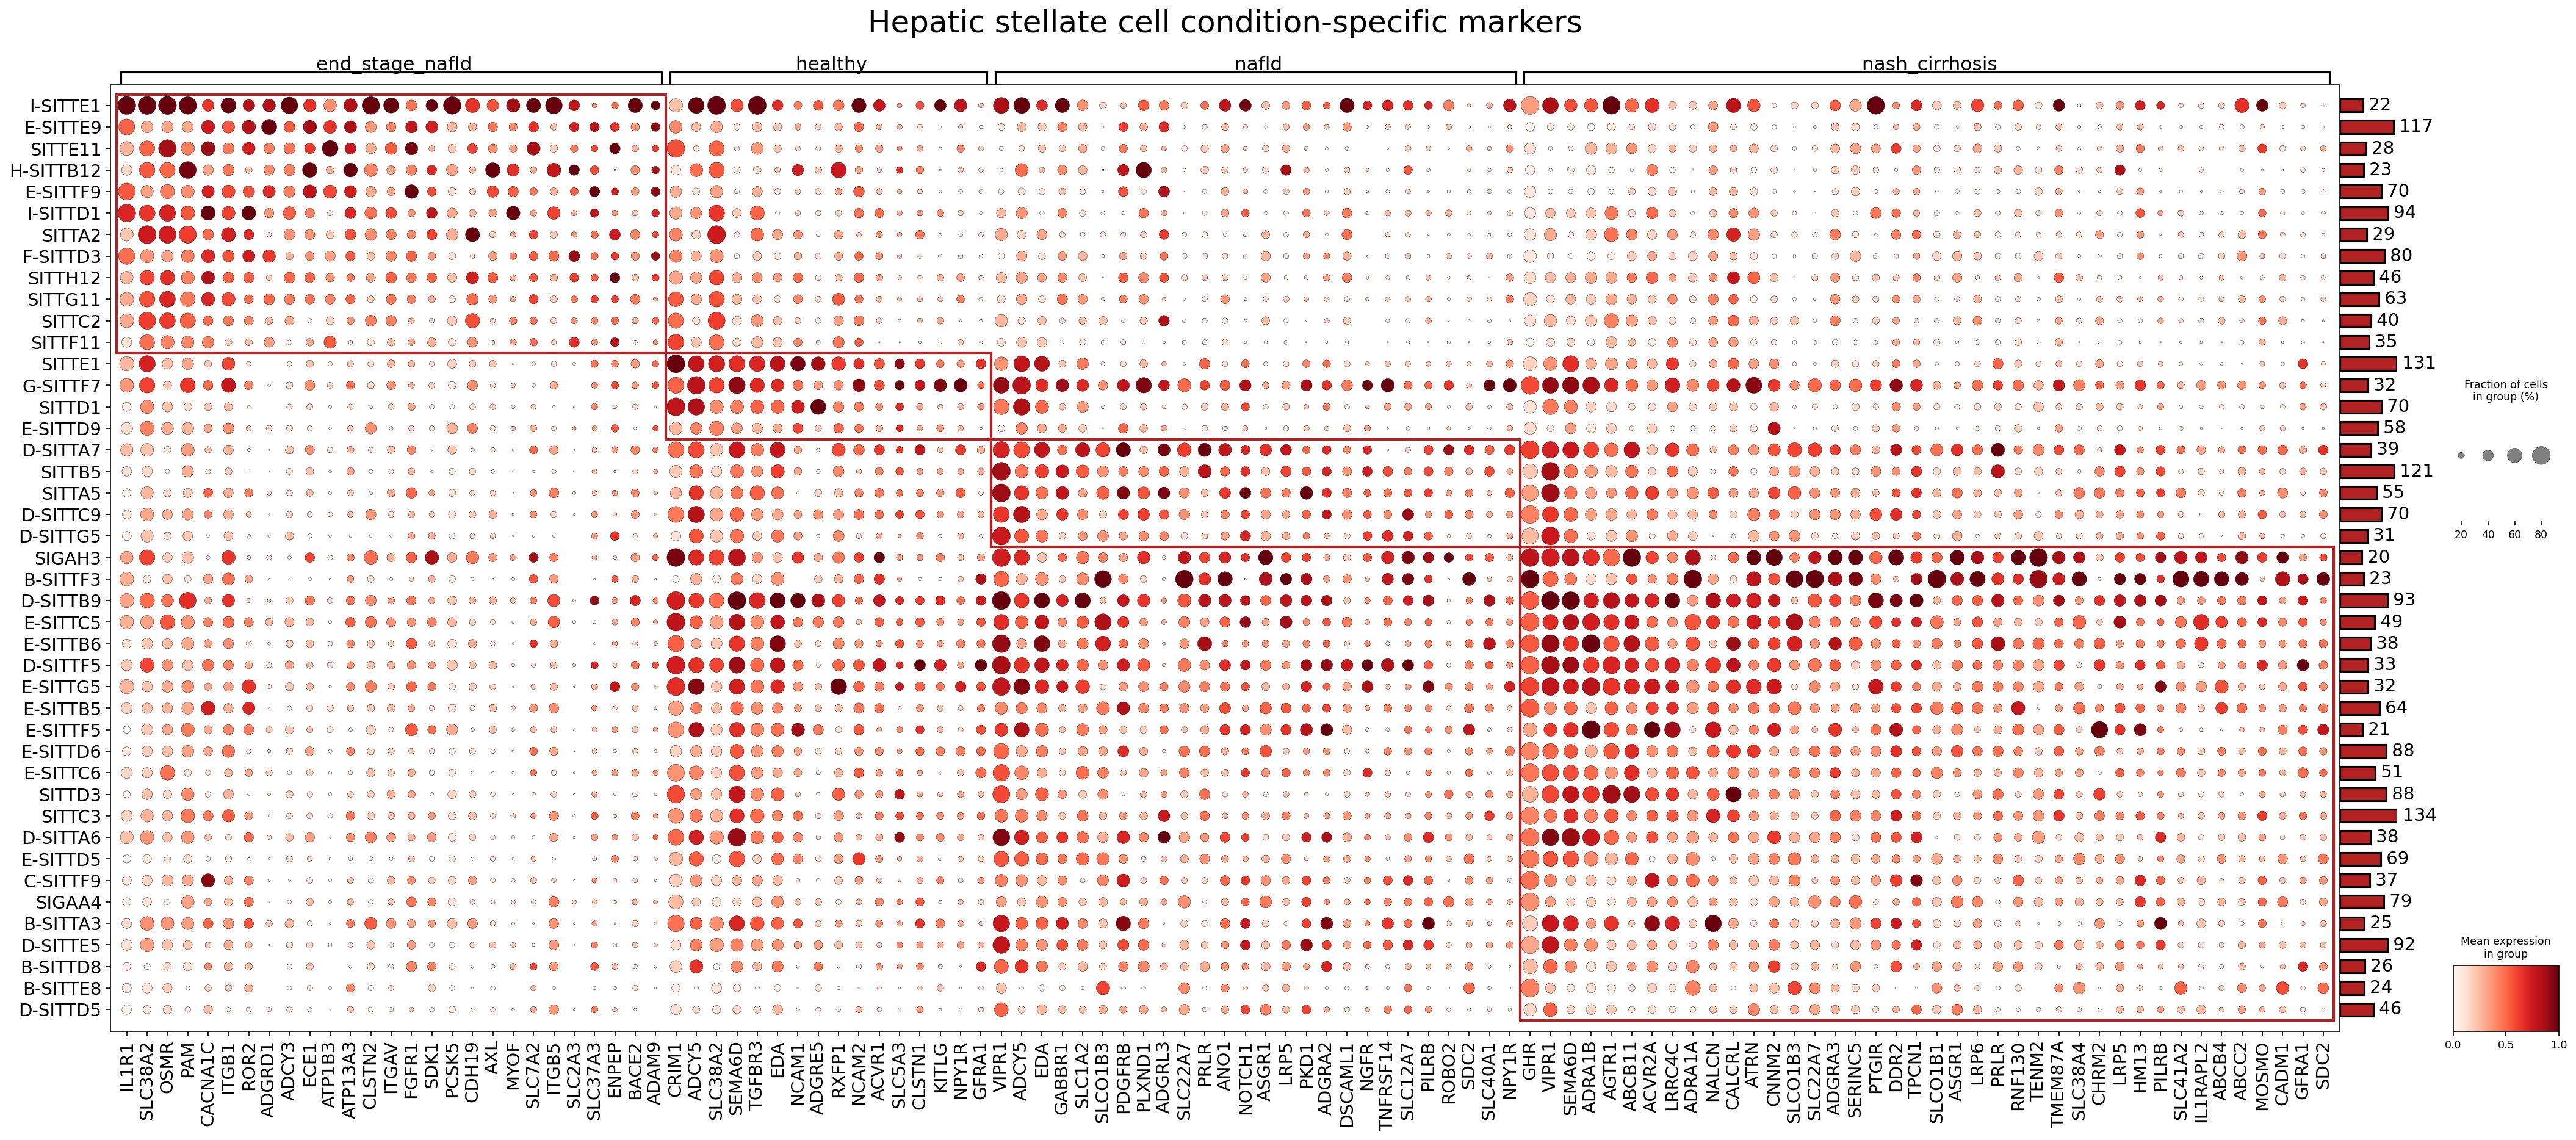
[Analysis Visualization Results]...
Analysis Overview
This analysis identifies and visualizes surfaceome markers in Hepatic stellate cells (HSCs) across different conditions of Nonalcoholic Fatty Liver Disease (NAFLD) progression: healthy, nafld, nash_cirrhosis, and end_stage_nafld. The dot plot displays the mean expression level (color intensity, redder indicates higher expression) and the fraction of cells expressing the marker (dot size, larger indicates higher fraction) for various surface-expressed genes. Markers were selected based on their differential expression patterns across these conditions, with a focus on identifying condition-specific markers. The Y-axis represents individual samples or cell subgroups within Hepatic stellate cells, grouped by their corresponding disease conditions. The X-axis lists the identified surfaceome marker genes.
Visual Summary
The dot plot reveals distinct patterns of surfaceome marker expression in Hepatic stellate cells that correlate with the progression of NAFLD.
- Markers of Advanced Disease (nash_cirrhosis and end_stage_nafld): A prominent cluster of genes shows high expression and prevalence in nash_cirrhosis and end_stage_nafld conditions, with generally lower expression in healthy and nafld states. This group likely represents markers of activated and fibrogenic Hepatic stellate cells, characteristic of advanced liver disease. Many genes in the leftmost and rightmost sections of the gene list fall into this category, showing intense red coloration and large dot sizes in the nash_cirrhosis and end_stage_nafld columns.
- Markers with Intermediate Expression (nafld): Some markers show an increase from healthy to nafld, further escalating in nash_cirrhosis and end_stage_nafld, suggesting a progressive role in disease development. Other markers might show moderate expression in nafld but peak in later stages.
- Markers Predominant in Healthy Liver: A smaller subset of markers appears to be more highly expressed in the healthy condition, often decreasing as the disease progresses. These might represent markers of quiescent HSCs or protective mechanisms lost during disease progression. *SLC40A1* and *SDC2* show this trend for some samples.
Overall, the visualization highlights a significant remodeling of the Hepatic stellate cell surfaceome as NAFLD progresses to more severe stages, indicating activation of various signaling pathways and cellular functions involved in inflammation and fibrogenesis.
Biological Interpretation
The identified surfaceome markers in Hepatic stellate cells provide insights into their functional states during NAFLD progression. HSCs are pivotal in liver fibrosis, transitioning from a quiescent, vitamin A-storing state to an activated, myofibroblast-like phenotype under chronic liver injury.
Markers Upregulated in Advanced NAFLD (NASH and Cirrhosis):
A substantial number of surfaceome markers are highly expressed in nash_cirrhosis and end_stage_nafld, consistent with the well-established role of HSC activation in advanced liver fibrosis. These markers indicate increased cell-extracellular matrix (ECM) interactions, altered growth factor signaling, and pro-fibrogenic activities.
- PDGFRB (Platelet-Derived Growth Factor Receptor Beta): This receptor is a classical marker of activated HSCs. Activation by PDGF ligands stimulates HSC proliferation, migration, and production of ECM components, driving fibrosis. Elevated PDGFRB signaling is a central pathway in liver fibrogenesis. GeneCards PDGFRB
- AGTR1 (Angiotensin II Receptor Type 1): Angiotensin II, acting via AGTR1 on HSCs, promotes their activation, proliferation, contractility, and secretion of fibrogenic mediators, contributing to both fibrosis and portal hypertension. GeneCards AGTR1
- ITGAV (Integrin Alpha V) and ITGB1 (Integrin Beta 1): These integrin subunits form heterodimers (e.g., αvβ1, αvβ3, αvβ5) that mediate cell adhesion to various ECM proteins like fibronectin, vitronectin, and collagen. In activated HSCs, integrins are crucial for sensing ECM stiffness, promoting mechanotransduction, migration, and transducing profibrotic signals like TGF-β activation. GeneCards ITGAV, GeneCards ITGB1
- AXL (AXL Receptor Tyrosine Kinase): AXL is a receptor tyrosine kinase that promotes cell survival, proliferation, and anti-inflammatory responses in various cell types. However, in the context of fibrosis, AXL signaling can contribute to fibrogenesis by promoting cell survival and growth of myofibroblasts, including activated HSCs. GeneCards AXL
- DDR2 (Discoidin Domain Receptor Tyrosine Kinase 2): DDR2 is a collagen receptor that senses collagen density and organization in the ECM. Its activation upon binding to collagen promotes HSC activation, proliferation, and matrix remodeling, thereby contributing to fibrogenesis. GeneCards DDR2
- LRP5/LRP6 (Low-Density Lipoprotein Receptor-Related Protein 5/6): These are co-receptors for Wnt ligands, activating the canonical Wnt/β-catenin signaling pathway. Wnt signaling is a critical pathway in liver development, regeneration, and fibrosis, promoting HSC activation and proliferation. GeneCards LRP5
- NGFR (Nerve Growth Factor Receptor, p75NTR): This receptor for neurotrophins has been implicated in HSC activation, survival, and differentiation into myofibroblasts. Its expression increases during liver injury and fibrosis, contributing to the pro-fibrogenic phenotype. GeneCards NGFR
Markers Relatively Higher in Healthy Liver:
- SLC40A1 (Ferroportin): This gene encodes ferroportin, the only known iron exporter in mammals. Its expression is crucial for maintaining iron homeostasis. In the liver, altered iron metabolism and iron overload can exacerbate oxidative stress and liver injury, promoting NAFLD progression and fibrosis. Higher SLC40A1 expression in healthy HSCs suggests a role in normal iron regulation, while its potential downregulation in advanced disease might contribute to iron dysregulation. GeneCards SLC40A1
- SDC2 (Syndecan-2): Syndecans are transmembrane heparan sulfate proteoglycans involved in cell-matrix interactions, growth factor presentation, and signaling. While often associated with mesenchymal cells, its specific role in HSC quiescence or early activation states might contribute to normal liver architecture, with changes reflecting disease progression. GeneCards SDC2
Clinical or Translational Implications
The identification of these surfaceome markers provides a valuable resource for understanding the pathogenesis of NAFLD, NASH, and cirrhosis, and for developing novel diagnostic and therapeutic strategies.
- Therapeutic Targets for Fibrosis: Many of the highly expressed markers in activated HSCs (e.g., PDGFRB, AGTR1, ITGAV/ITGB1, AXL, DDR2, LRP5/6, NGFR) represent actionable targets for anti-fibrotic therapies.
- Angiotensin Receptor Blockers (ARBs): Drugs targeting AGTR1 (e.g., Losartan) are already clinically approved for hypertension and have shown promise in preclinical and some clinical studies for liver fibrosis, although efficacy in advanced human fibrosis remains challenging.
- PDGFR Inhibitors: Tyrosine kinase inhibitors targeting PDGFRB (e.g., Nintedanib) are approved for idiopathic pulmonary fibrosis and are being explored for other fibrotic diseases.
- Integrin Inhibitors: Specific antibodies or small molecules targeting integrins like αvβ1, αvβ3, or αvβ6 could interfere with HSC-ECM interactions and TGF-β activation, thereby inhibiting fibrosis.
- AXL Inhibitors: AXL inhibitors are under development for cancer and may have potential in inhibiting fibrogenesis by reducing HSC survival and proliferation.
- Wnt Pathway Modulators: Targeting LRP5/6 and other components of the Wnt/β-catenin pathway could offer a strategy to inhibit HSC activation.
- Biomarkers for Disease Progression: The differential expression of these surface markers could serve as potential biomarkers for monitoring disease progression, therapeutic response, or identifying specific populations of HSCs. Non-invasive detection of these markers (e.g., via advanced imaging or liquid biopsies) could aid in clinical management.
- Targeting Iron Homeostasis: The observed changes in SLC40A1 expression suggest that managing iron overload could be a complementary therapeutic strategy in NAFLD/NASH, potentially through iron chelation or dietary intervention, to reduce oxidative stress and inflammation.
- Further Research: These findings warrant further investigation into the precise roles of these surface markers in HSC biology and their potential as targets for preclinical and clinical validation. This includes exploring specific ligand-receptor interactions, downstream signaling cascades, and the development of targeted delivery systems to activated HSCs.
14. T cell CD4+ Condition-Specific Surfaceome Markers in NASH Cirrhosis
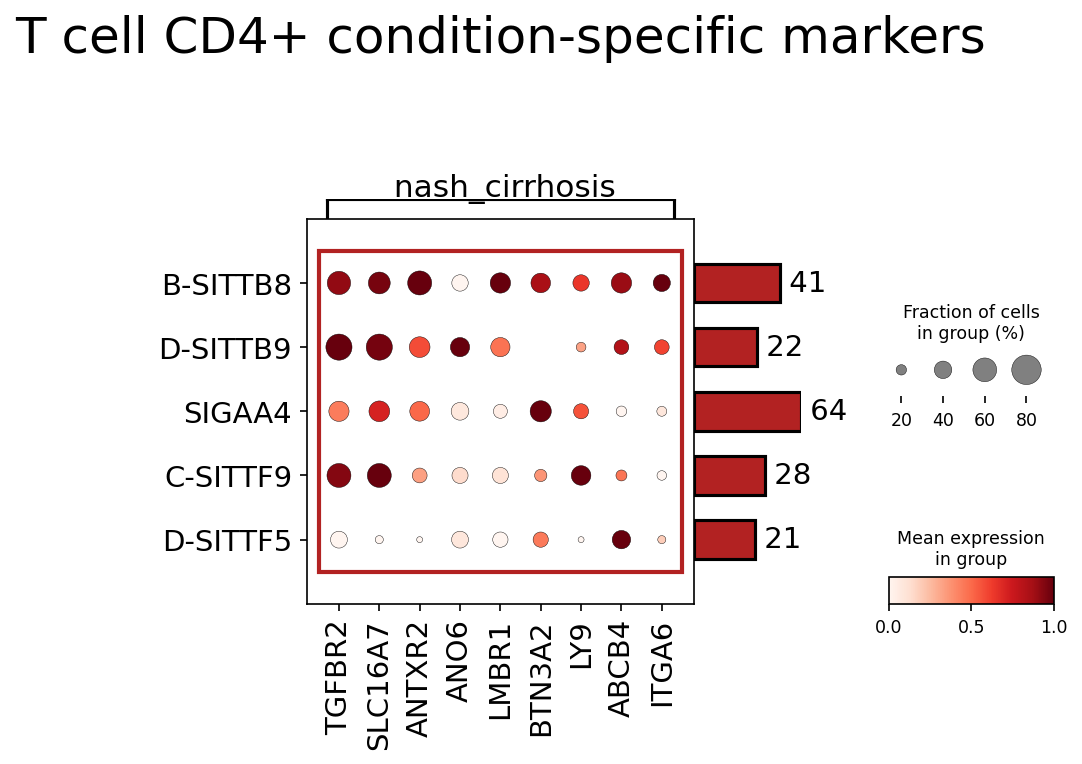
[Analysis Visualization Results]...
Analysis Overview
This analysis identifies and visualizes the expression of surfaceome markers in T cell CD4+ populations specifically within the nash_cirrhosis condition. The objective is to highlight markers that are potentially unique or significantly altered in this disease stage, providing insights into the biological mechanisms and potential therapeutic targets. The dot plot displays mean expression levels and the fraction of cells expressing each marker across different samples diagnosed with nash_cirrhosis.
Visual Summary
The dot plot presents the expression patterns of nine surfaceome markers (TGFBR2, SLC16A7, ANTRX2, ANO6, LMBR1, BTN3A2, LY9, ABCB4, ITGA6) in T cell CD4+ cells across five individual samples (B-SITTIB8, D-SITTIB9, SIGAA4, C-SITTF9, D-SITTF5) within the nash_cirrhosis condition.
- Expression and Prevalence: The size of each dot indicates the fraction of cells within a sample expressing a particular marker, while the color intensity (from white to dark red) represents the mean expression level in that group.
- Prominent Markers: TGFBR2 and SLC16A7 exhibit consistently high mean expression and a large fraction of expressing cells across most displayed samples, particularly B-SITTIB8 and D-SITTIB9. BTN3A2 and LY9 also show significant expression and prevalence.
- Variable Expression: ANTRX2 and ANO6 display moderate expression and prevalence, varying slightly across samples. LMBR1 generally shows lower mean expression but is present in a substantial fraction of cells in some samples.
- Lower Expression/Prevalence: ITGA6 shows moderate expression in sample B-SITTIB8 but generally lower overall expression and prevalence compared to markers like TGFBR2. ABCB4 shows variable and generally lower expression across samples.
- Sample-Specific Cell Counts: The numbers on the right of the plot (41, 22, 64, 28, 21) indicate the total number of T cell CD4+ cells for each respective sample, with SIGAA4 having the highest count among these samples.
Biological Interpretation
The identified surfaceome markers on T cell CD4+ cells in the context of nash_cirrhosis point to several key biological processes, including immune regulation, metabolism, cell adhesion, and responses to the fibrotic microenvironment.
- TGFBR2 (Transforming Growth Factor Beta Receptor Type 2): As a receptor for TGF-β, its high expression on CD4+ T cells suggests that these cells are highly responsive to TGF-β signaling. TGF-β is a potent immunosuppressive cytokine and a major driver of liver fibrosis in NASH and cirrhosis by activating hepatic stellate cells and promoting extracellular matrix deposition. In T cells, TGF-β can induce regulatory T cell (Treg) differentiation, suppressing effector T cell responses, or contribute to T cell exhaustion in the chronic inflammatory and fibrotic liver environment PubMed search: TGF-beta liver fibrosis.
- SLC16A7 (Solute Carrier Family 16 Member 7, MCT2): This monocarboxylate transporter is crucial for cellular metabolism. Its notable expression in CD4+ T cells in nash_cirrhosis may reflect altered metabolic programming, potentially involving increased lactate uptake to fuel anabolic processes required for sustained T cell activation, differentiation, or survival in the metabolically perturbed cirrhotic liver. This could support either pro-inflammatory or regulatory T cell functions GeneCards: SLC16A7.
- ANTXR2 (Anthrax Toxin Receptor 2, CMG2): While primarily known for binding anthrax toxin and its role in vascular development and cell adhesion, its presence on CD4+ T cells suggests potential involvement in cell-extracellular matrix (ECM) interactions. In the fibrotic liver, ANTXR2 could mediate T cell adhesion to specific ECM components like laminin, influencing T cell localization, retention, or migration within the highly remodeled tissue. It is also involved in angiogenesis, a process altered in liver cirrhosis GeneCards: ANTXR2.
- ANO6 (Anoctamin 6, TMEM16F): This calcium-activated chloride channel and phospholipid scramblase is involved in membrane dynamics, cell volume regulation, and phosphatidylserine externalization. In CD4+ T cells, ANO6 could play a role in modulating intracellular calcium signaling, affecting T cell activation and differentiation, or mediating phosphatidylserine exposure, which is critical for apoptotic cell clearance and immune tolerance in the inflammatory milieu of NASH and cirrhosis GeneCards: ANO6.
- LMBR1 (Limb Region 1 Homolog, CD320): Also known as CD320, this protein functions as a receptor for transcobalamin II-vitamin B12 complexes, facilitating cellular uptake of vitamin B12. Vitamin B12 is essential for metabolic pathways critical for DNA synthesis and mitochondrial function, processes that are highly active in proliferating and functionally active T cells. Its expression suggests that CD4+ T cells in nash_cirrhosis have an active requirement for B12, supporting their metabolic demands and potential expansion or sustained function in the inflamed liver GeneCards: LMBR1.
- BTN3A2 (Butyrophilin Subfamily 3 Member A2): As part of the butyrophilin family, BTN3A2 belongs to a group of immune regulatory molecules. While primarily known for its role in activating γδ T cells, its presence on CD4+ T cells suggests a potential role in modulating CD4+ T cell activation thresholds or inhibitory signaling. Such interactions could fine-tune the overall immune response and contribute to immune tolerance or inflammation in the cirrhotic liver GeneCards: BTN3A2.
- LY9 (Lymphocyte Antigen 9, CD229): A cell surface glycoprotein involved in lymphocyte activation and adhesion, LY9 can act as both an activating and inhibitory co-receptor, influencing T cell receptor (TCR) signaling, proliferation, and cytokine production. Its expression on CD4+ T cells in nash_cirrhosis implies a role in modulating T cell activity in chronic liver inflammation, potentially contributing to either pathogenic immune responses or mechanisms of immune regulation GeneCards: LY9.
- ABCB4 (ATP Binding Cassette Subfamily B Member 4, MDR3): This ABC transporter is primarily recognized for its function in hepatocytes, where it transports phospholipids into bile. Its detection on CD4+ T cells, though less common, might indicate a specialized metabolic role in lipid efflux or handling within these immune cells, which could be particularly relevant given the extensive lipid dysregulation characteristic of NAFLD and NASH. This could represent a unique adaptation of T cells in the diseased liver microenvironment GeneCards: ABCB4.
- ITGA6 (Integrin Alpha 6, CD49f): An integrin alpha subunit that typically forms heterodimers to bind extracellular matrix components, notably laminin. Its expression on CD4+ T cells suggests their capacity for robust adhesion to and migration within the laminin-rich fibrotic liver parenchyma. This adhesion is crucial for T cell localization, retention, and interaction with other liver-resident cells, potentially influencing the progression of inflammation and fibrosis in nash_cirrhosis GeneCards: ITGA6.
Clinical or Translational Implications
The identified surfaceome markers on CD4+ T cells in nash_cirrhosis offer several avenues for therapeutic exploration and deeper understanding of disease pathogenesis:
- Targeting Fibrosis and Immune Modulation (TGFBR2): The prominent expression of TGFBR2 underscores the critical role of TGF-β signaling in nash_cirrhosis. Targeting TGF-β pathways, possibly with small molecule inhibitors of its receptor kinase, could not only directly attenuate liver fibrosis by inhibiting hepatic stellate cell activation but also modulate CD4+ T cell responses, potentially reducing inflammation and promoting a more favorable immune environment.
- Modulating T cell Trafficking and Retention (ITGA6, ANTXR2): Integrins like ITGA6 and adhesion molecules like ANTXR2 mediate T cell interaction with the fibrotic liver's extracellular matrix. Therapies designed to modulate these adhesion molecules could alter T cell trafficking, preventing their accumulation in inflammatory foci or promoting their egress, thereby reducing chronic inflammation and liver damage.
- Exploiting Metabolic Vulnerabilities (SLC16A7, LMBR1, ABCB4): The expression of metabolic transporters (SLC16A7, LMBR1) and an ABC transporter (ABCB4) highlights unique metabolic adaptations in CD4+ T cells during nash_cirrhosis. Further research into these metabolic pathways could reveal vulnerabilities. For example, specific inhibition of a transporter critical for pathogenic T cell survival or function could be a novel therapeutic strategy.
- Fine-tuning T Cell Activity (LY9, BTN3A2, ANO6): Markers like LY9 and BTN3A2 are involved in modulating T cell activation and immune signaling. Understanding how these receptors regulate CD4+ T cell function in nash_cirrhosis could enable the development of immune-modulating agents (e.g., agonistic or antagonistic antibodies) to either dampen excessive pro-inflammatory responses or enhance beneficial regulatory mechanisms, thereby contributing to disease resolution.
These markers represent potential candidates for further investigation as biomarkers for disease severity or progression, and as targets for precision immunotherapies in patients with nash_cirrhosis.
15. Gene Ontology (GSA) Analysis of Hepatocytes Across NAFLD Progression
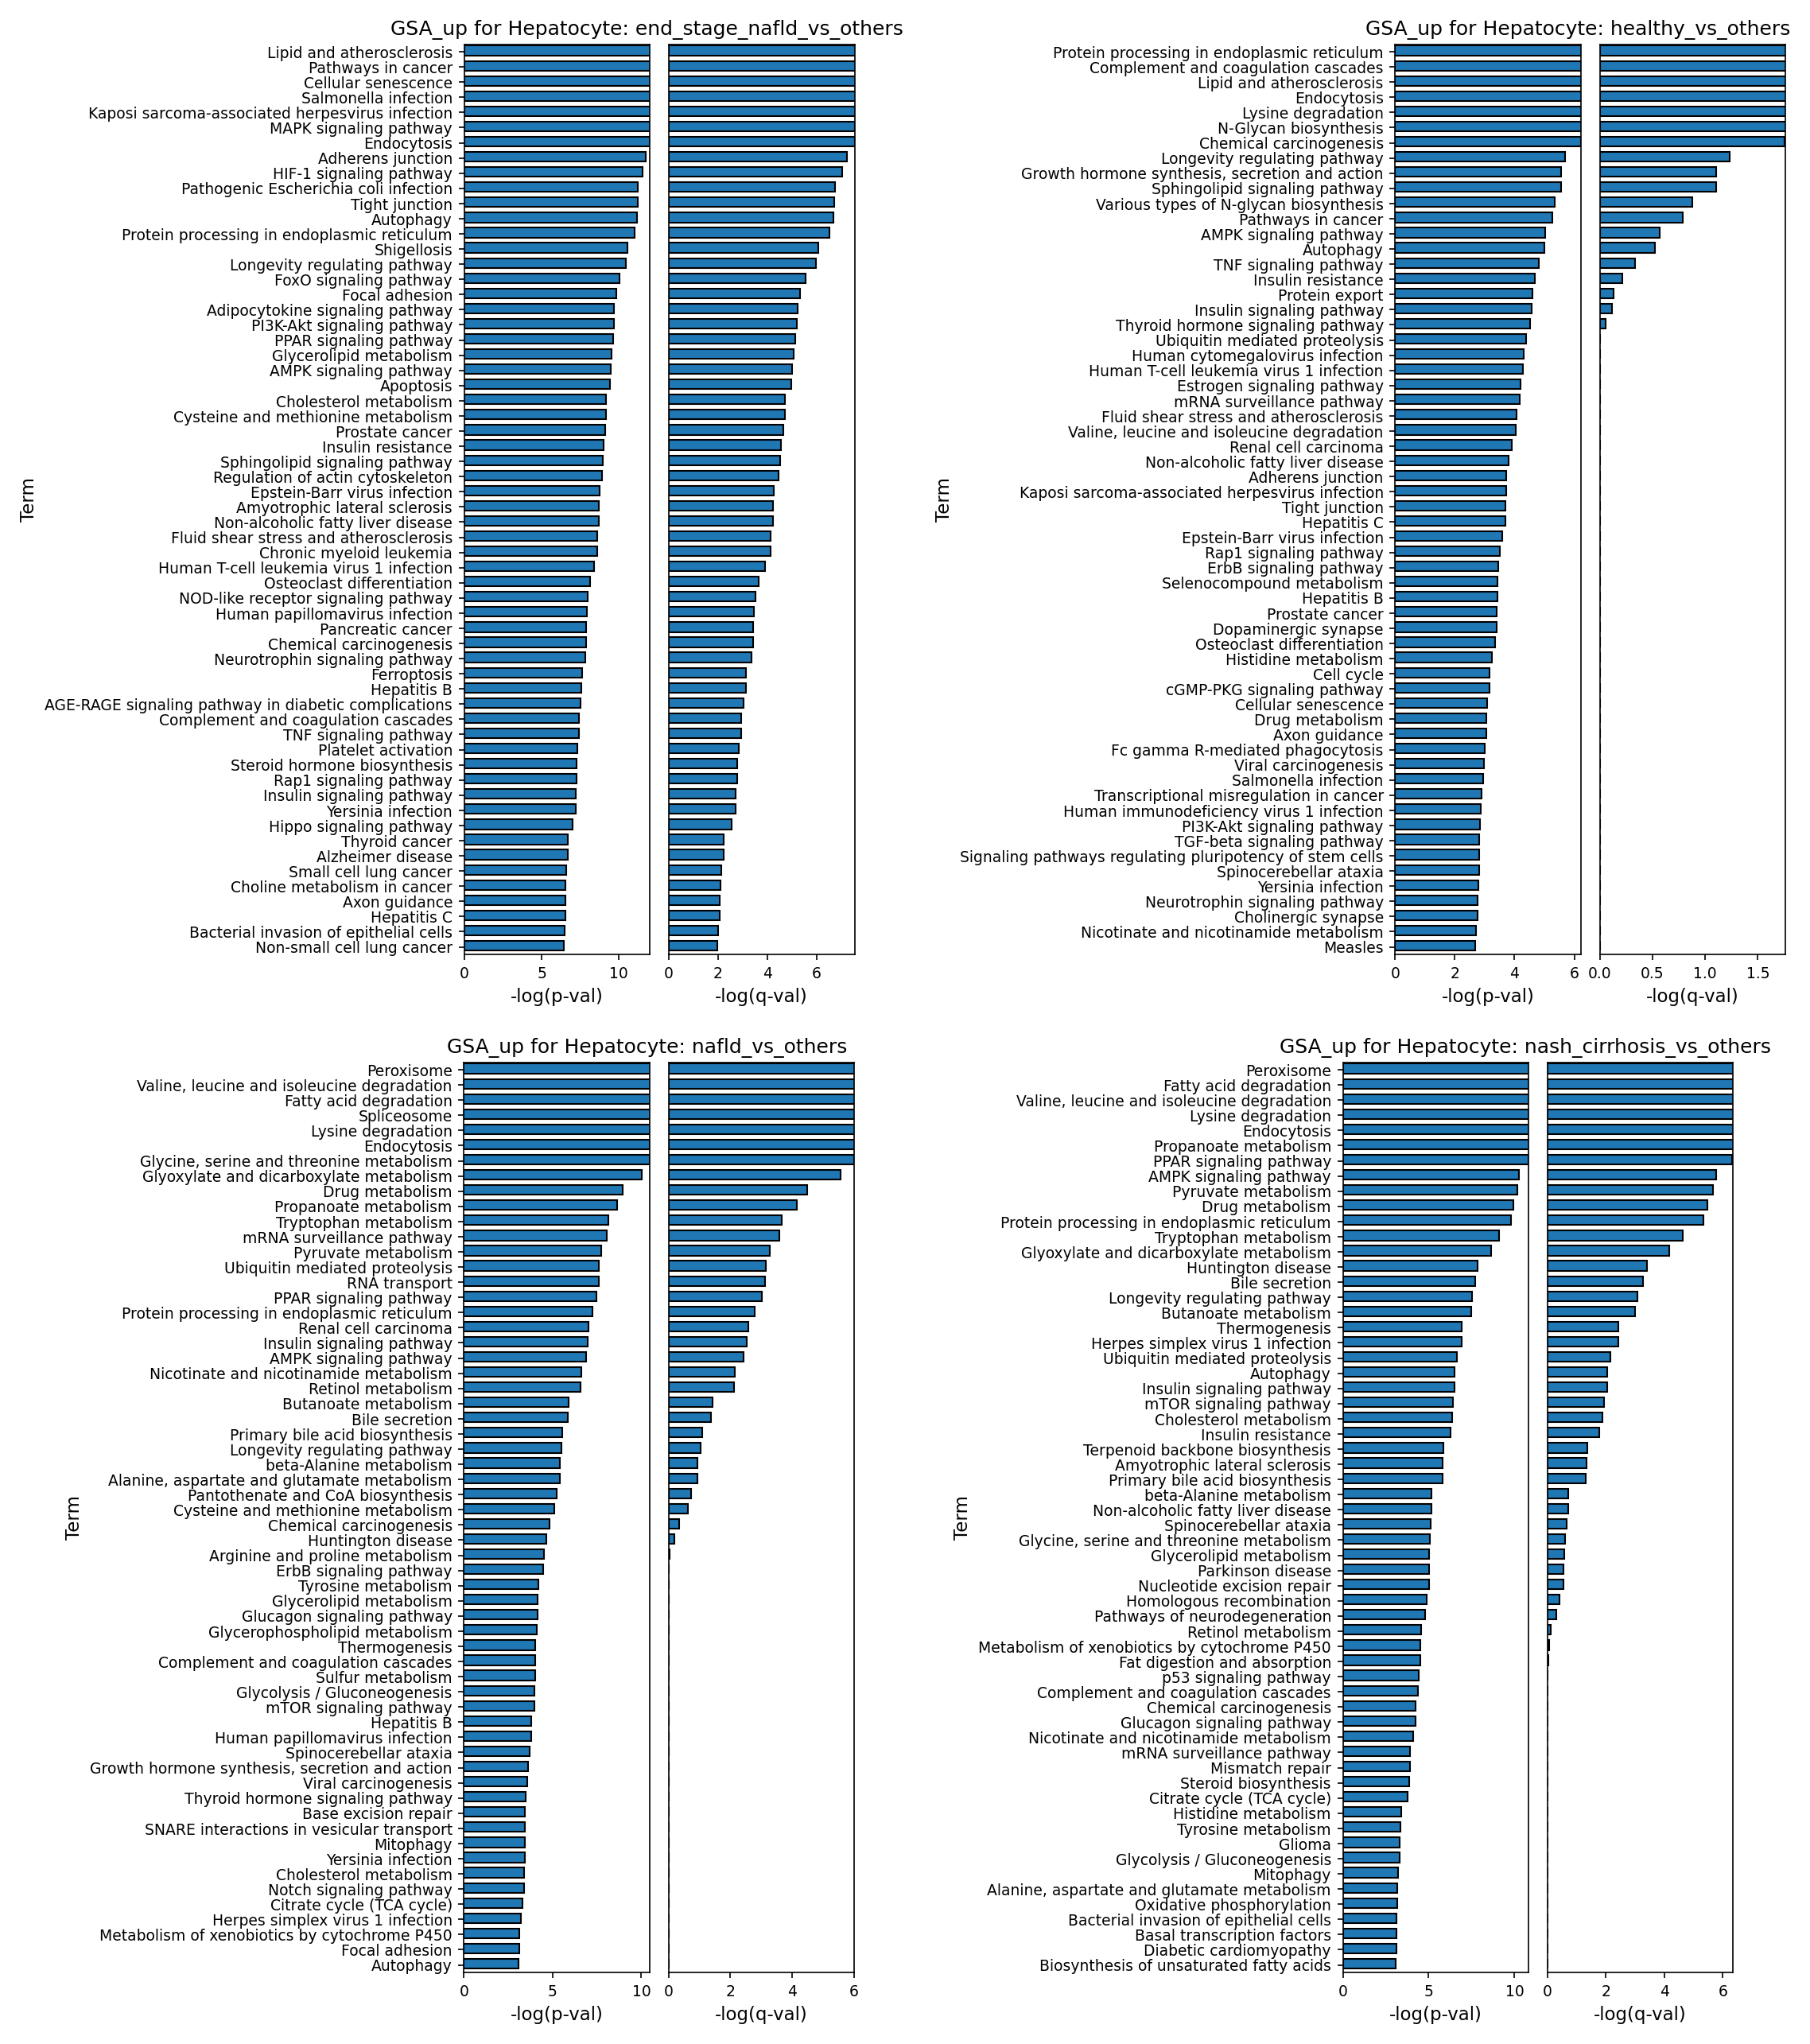
[Analysis Visualization Results]...
Analysis Overview
This analysis presents Gene Ontology (GSA) enrichment results for Hepatocytes, comparing each disease condition (NAFLD, NASH/Cirrhosis, End-Stage NAFLD) and healthy controls against all other conditions combined. The results, visualized as bar plots, highlight pathways significantly enriched with genes that are more highly expressed in the specified condition. The analysis aims to uncover condition-specific biological processes in hepatocytes during the progression of Nonalcoholic fatty liver disease (NAFLD).
Visual Summary
The bar plots display the top enriched Gene Ontology terms (pathways) for Hepatocytes under four different conditions: end_stage_nafld_vs_others, healthy_vs_others, nafld_vs_others, and nash_cirrhosis_vs_others. The length of each bar corresponds to the statistical significance of enrichment, indicated by -log(p-val) and -log(q-val). A longer bar signifies a more significantly enriched pathway. Each plot reveals a distinct set of active biological processes characteristic of the specific condition compared to the aggregate of all other conditions.
Key Observations:
- NAFLD and NASH/Cirrhosis: Both nafld_vs_others and nash_cirrhosis_vs_others conditions show robust enrichment of pathways related to lipid and amino acid metabolism, cellular stress responses (e.g., protein processing in endoplasmic reticulum, autophagy), and energy regulation (e.g., PPAR signaling, AMPK signaling).
- Progression to End-Stage NAFLD: In end_stage_nafld_vs_others, there is a heightened enrichment of pathways associated with cellular senescence, ferroptosis (a form of regulated cell death), inflammation (e.g., TNF signaling), and cancer-related processes, alongside continued metabolic dysregulation.
- Healthy Liver: The healthy_vs_others plot shows enrichment of fundamental cellular processes like protein processing in the endoplasmic reticulum, endocytosis, and N-Glycan biosynthesis, reflecting basal hepatocyte functions. Some terms like "Lipid and atherosclerosis" and "Insulin resistance" appear in healthy, suggesting a distinct homeostatic regulation or baseline activity compared to the combined diseased states.
Biological Interpretation
The Gene Ontology analysis of Hepatocytes provides valuable insights into the metabolic and cellular adaptations or dysregulations occurring during NAFLD progression.
Features of Diseased Hepatocytes (NAFLD, NASH/Cirrhosis, End-Stage NAFLD):
- Metabolic Reprogramming and Dysregulation: A prominent theme across NAFLD and NASH/cirrhosis is the significant enrichment of pathways involved in lipid metabolism (e.g., "Peroxisome," "Fatty acid degradation," "Glycerolipid metabolism," "Cholesterol metabolism") and amino acid metabolism (e.g., "Valine, leucine and isoleucine degradation," "Lysine degradation," "Tryptophan metabolism"). These findings directly reflect the hallmark steatosis (fat accumulation) and altered metabolic flux characteristic of NAFLD and NASH. Pathways like "Insulin signaling pathway," "AMPK signaling pathway," and "PPAR signaling pathway" highlight the profound dysregulation in nutrient sensing and energy homeostasis that drives disease progression PubMed Search: NAFLD insulin resistance lipid metabolism.
- Cellular Stress and Damage Response: Conditions like NAFLD and NASH/cirrhosis show strong enrichment in pathways such as "Protein processing in endoplasmic reticulum" (indicating ER stress), "Autophagy," and "Ubiquitin mediated proteolysis." These are cellular mechanisms activated to cope with the accumulation of misfolded proteins, damaged organelles, and metabolic overload, all critical events in hepatocyte injury UniProt: P04637 (TP53).
Progression to Advanced Disease (NASH/Cirrhosis and End-Stage NAFLD)
- In nash_cirrhosis_vs_others, we observe an intensification of stress responses, including "p53 signaling pathway" (associated with cell cycle arrest and apoptosis in response to DNA damage) and "Oxidative phosphorylation" (reflecting mitochondrial dysfunction). The explicit appearance of "Non-alcoholic fatty liver disease" as an enriched pathway underscores the significant gene expression changes characteristic of this advanced stage.
- end_stage_nafld_vs_others further highlights pathways like "Cellular senescence," which contributes to chronic inflammation and fibrosis in advanced liver disease PubMed Search: cellular senescence liver fibrosis. The enrichment of "Ferroptosis," an iron-dependent form of regulated cell death, points to a specific mechanism of hepatocyte demise in severe disease PubMed Search: ferroptosis NAFLD NASH. Additionally, "Pathways in cancer" and "Chemical carcinogenesis" become notably prominent, reflecting the increased risk of hepatocellular carcinoma (HCC) in cirrhotic livers.
- Healthy Hepatocyte Homeostasis: The healthy_vs_others analysis enriches for fundamental cellular processes. The presence of terms like "Lipid and atherosclerosis" and "Insulin resistance" in healthy hepatocytes likely reflects the complex baseline regulation and constitutive activity of these pathways in normal liver function, distinguishing them from the dysregulated states in disease. A healthy liver actively processes lipids and maintains insulin sensitivity, and the specific gene expression patterns defining these homeostatic processes are distinct from their pathological counterparts.
Clinical or Translational Implications
The identified pathways offer critical insights for understanding NAFLD pathogenesis and developing potential therapeutic strategies:
- Therapeutic Targets: Pathways consistently dysregulated in NAFLD/NASH, such as those related to lipid metabolism, ER stress, autophagy, and inflammation, represent promising targets for pharmacological intervention. For instance, modulating specific metabolic enzymes, enhancing autophagy, or mitigating ER stress could alleviate hepatocyte injury and improve liver function.
- Biomarkers of Progression: The distinct enrichment profiles observed across NAFLD stages (NAFLD vs. NASH/Cirrhosis vs. End-Stage NAFLD) suggest that genes within these pathways could serve as biomarkers for disease progression and severity, aiding in patient stratification and monitoring therapeutic response.
- Addressing Comorbidities: The strong link to "Insulin resistance" and "AGE-RAGE signaling pathway in diabetic complications" (in end-stage) reinforces the need for integrated management of NAFLD with metabolic comorbidities like type 2 diabetes.
- Risk of HCC: The enrichment of "Pathways in cancer" and "Chemical carcinogenesis" in advanced disease (NASH/cirrhosis and end-stage NAFLD) highlights the importance of surveillance for hepatocellular carcinoma in patients with advanced liver fibrosis.
- Novel Therapeutic Avenues: The specific enrichment of "Ferroptosis" in end-stage NAFLD opens avenues for exploring ferroptosis inhibitors as a novel therapeutic approach to prevent hepatocyte death in advanced liver disease.
16. Gene Set Enrichment Analysis (GSEA) Across Liver Cell Types and Disease Stages in NAFLD Progression
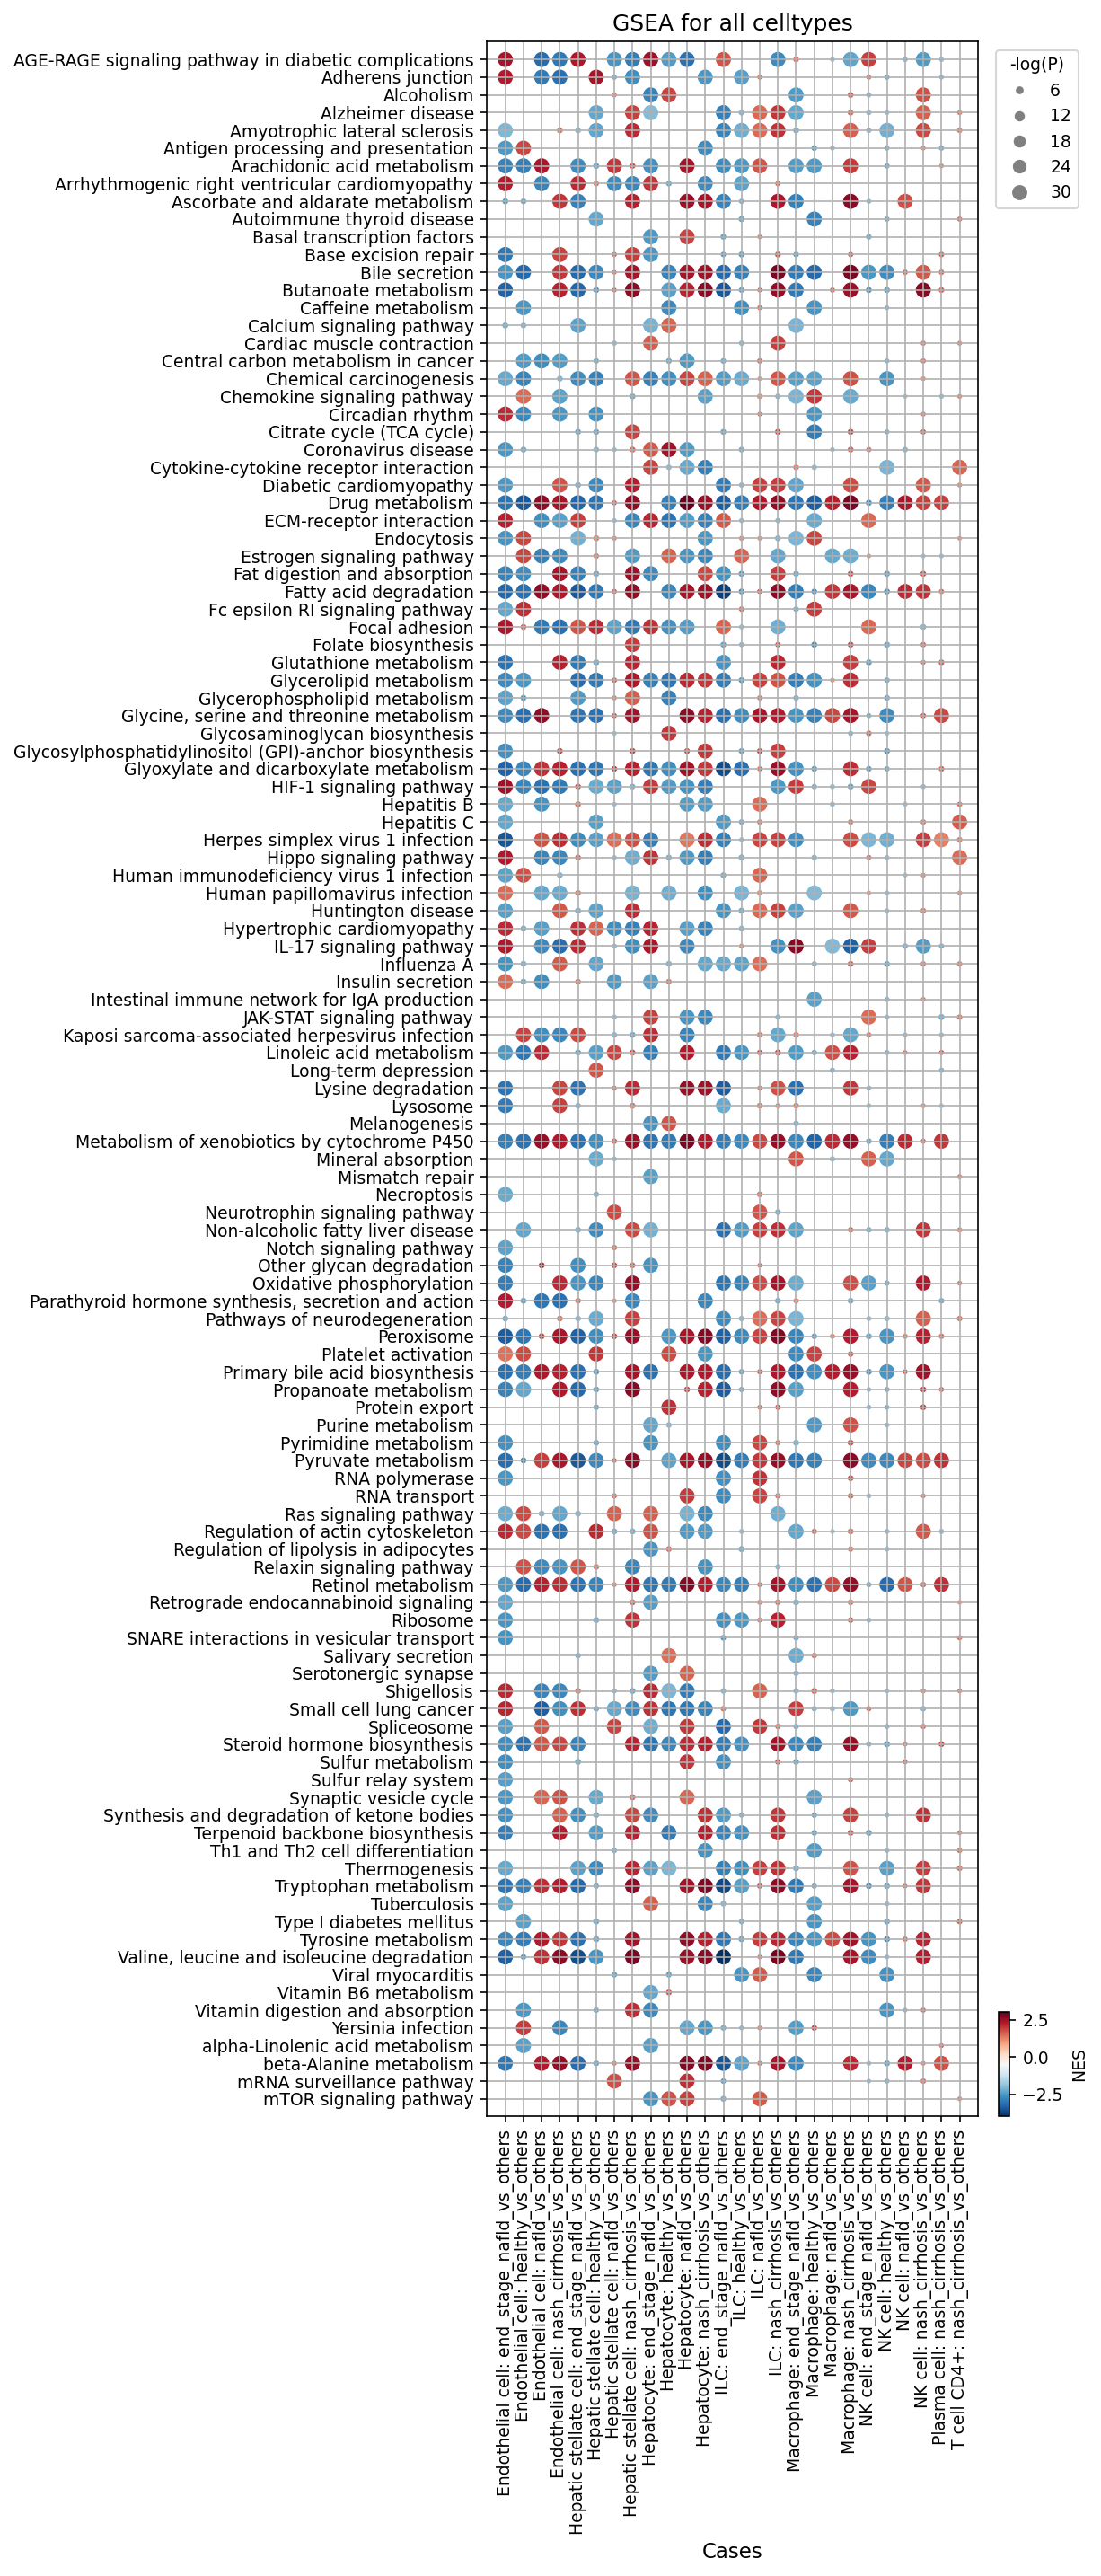
[Analysis Visualization Results]...
Analysis Overview
This analysis presents the results of Gene Set Enrichment Analysis (GSEA) as a dot plot, illustrating pathway activity across various cell types and disease conditions within the liver. The visualization uses the Normalized Enrichment Score (NES) to indicate the direction and magnitude of pathway enrichment (red for positive/upregulated, blue for negative/downregulated), and the dot size reflects the statistical significance (-log(p-value), with larger dots indicating higher significance). The comparison is performed for each condition against all other conditions (_vs_others) within each cell type. The analysis includes major liver cell types such as Endothelial cells, Hepatic stellate cells, Hepatocytes, ILCs, Macrophages, NK cells, Plasma cells, and T cells CD4+, across healthy, nafld, nash_cirrhosis, and end_stage_nafld conditions. This approach helps to delineate the cellular and molecular changes occurring during the progression of Nonalcoholic Fatty Liver Disease (NAFLD) to Nonalcoholic Steatohepatitis (NASH) and cirrhosis.
Visual Summary
The dot plot reveals distinct and comprehensive patterns of pathway dysregulation that are both cell-type-specific and condition-dependent.
- Disease Progression Signature: A clear trend emerges with increasing disease severity. In nafld_vs_others, nash_cirrhosis_vs_others, and end_stage_nafld_vs_others conditions, there is a prominent and widespread upregulation (red dots) of pathways associated with inflammation, immune response, cell adhesion, and extracellular matrix (ECM) remodeling across multiple cell types. Conversely, many fundamental metabolic pathways appear significantly downregulated (blue dots), particularly in hepatocytes and hepatic stellate cells.
- Cell Type-Specific Responses: The plot highlights the unique contributions of different cell populations to liver pathology:
- Hepatocytes and Hepatic Stellate Cells (HSCs): Show pronounced changes in both metabolic and structural pathways. Diseased hepatocytes exhibit widespread metabolic decline, while activated HSCs strongly upregulate fibrogenic and inflammatory pathways.
- Immune Cells (Macrophages, ILCs, NK cells, T cells CD4+, Plasma cells): Consistently show upregulation of various immune and inflammatory signaling pathways, emphasizing their active role in the chronic inflammatory environment.
- Endothelial Cells: Display activation of pathways related to cell adhesion, ECM interaction, and hypoxia, indicative of vascular dysfunction.
- Contrast with Healthy State: The healthy_vs_others columns frequently show an inverse pattern: many metabolic pathways are positively enriched (red dots), and inflammatory/fibrotic pathways are negatively enriched (blue dots). This stark contrast underscores the shift from a metabolically robust and homeostatic liver in health to a pathologically active state in disease.
- Highly Impacted Pathways: Pathways like AGE-RAGE signaling pathway, ECM-receptor interaction, HIF-1 signaling pathway, IL-17 signaling pathway, Chemokine signaling pathway, Cytokine-cytokine receptor interaction, NF-kappa B signaling pathway, and various metabolic pathways are consistently and significantly dysregulated across several cell types in disease.
Biological Interpretation
The GSEA results provide strong biological evidence for the mechanisms driving NAFLD progression:
Hepatocyte Metabolic Collapse and Injury:
- In early NAFLD, hepatocytes show signs of adaptation to lipid overload with Fatty acid degradation enrichment.
- However, with progression to NASH cirrhosis and end-stage NAFLD, hepatocytes experience a profound and broad downregulation of key metabolic processes, including Oxidative phosphorylation, mTOR signaling pathway, Ribosome, Pyruvate metabolism, Glutathione metabolism, and various amino acid and vitamin metabolisms. This signifies severe mitochondrial dysfunction, impaired energy production, reduced anabolic activities, and compromised detoxification, consistent with progressive hepatocyte injury and functional decline.
- Simultaneously, diseased hepatocytes activate stress-response and inflammatory pathways such as AGE-RAGE signaling pathway in diabetic complications (relevant given the metabolic co-morbidities of NAFLD), Adherens junction, ECM-receptor interaction, Focal adhesion, HIF-1 signaling pathway, and IL-17 signaling pathway. These changes reflect increased cellular stress, altered cell-cell/matrix interactions, and participation in the inflammatory milieu.
Hepatic Stellate Cell (HSC) Activation and Fibrogenesis:
- HSCs, central mediators of liver fibrosis, exhibit a pronounced activation signature. From NAFLD onwards, pathways related to cell adhesion (Adherens junction, Focal adhesion), ECM interaction (ECM-receptor interaction), hypoxia (HIF-1 signaling pathway), and inflammatory/pro-fibrotic signaling (IL-17 signaling pathway, Ras signaling pathway, JAK-STAT signaling pathway, NF-kappa B signaling pathway, PI3K-Akt signaling pathway) are significantly upregulated.
- In NASH cirrhosis and end-stage NAFLD, the activation of these pathways in HSCs is strikingly enhanced, indicating their sustained transformation into myofibroblast-like cells that actively deposit ECM, driving the progression of fibrosis and ultimately cirrhosis. The dysregulation of Retinol metabolism in activated HSCs also aligns with their shift from a quiescent, retinoid-storing state.
Endothelial Cell Dysfunction and Angiogenesis:
- Endothelial cells in diseased livers consistently show activation of pathways like Adherens junction, ECM-receptor interaction, Focal adhesion, and HIF-1 signaling pathway. These findings suggest endothelial dysfunction, increased vascular permeability, and potentially pathological angiogenesis, all of which contribute to the altered liver microenvironment and exacerbation of fibrosis.
Robust Immune Cell Activation and Chronic Inflammation:
- Macrophages: Are highly active from NAFLD, showing strong upregulation of pro-inflammatory Chemokine signaling pathway, Cytokine-cytokine receptor interaction, NF-kappa B signaling pathway, and TNF signaling pathway. In NASH cirrhosis, this inflammatory state intensifies, with additional activation of AGE-RAGE signaling, Fc epsilon RI signaling, HIF-1 signaling, IL-17 signaling, JAK-STAT signaling, and PI3K-Akt signaling, consistent with a critical role in chronic inflammation and disease progression.
- Innate Lymphoid Cells (ILCs) and Natural Killer (NK) cells: Also show enrichment of inflammatory pathways (e.g., IL-17 signaling, Chemokine signaling, Cytokine-cytokine receptor interaction) in advanced disease states, indicating their participation in the immune response.
- Adaptive Immune Cells (Plasma cells, T cells CD4+): In NASH cirrhosis, these cells exhibit strong activation of pathways central to adaptive immunity, including B cell receptor signaling, T cell receptor signaling, Th1 and Th2 cell differentiation, and shared inflammatory pathways like HIF-1, IL-17, JAK-STAT, NF-kappa B, PI3K-Akt, Ras signaling, and TNF signaling. This underscores the involvement of both humoral and cellular adaptive immunity in the pathogenesis of advanced cirrhotic liver disease.
Clinical or Translational Implications
The insights gained from this cell-type-specific GSEA are highly relevant for understanding disease mechanisms and guiding clinical strategies in NAFLD/NASH:
- Therapeutic Target Identification: The consistently activated inflammatory, fibrotic, and stress-response pathways, particularly AGE-RAGE signaling, ECM-receptor interaction, HIF-1 signaling, IL-17 signaling, NF-kappa B signaling, and JAK-STAT signaling, represent promising therapeutic targets for specific cell types to halt or reverse disease progression. Targeting these pathways could mitigate inflammation and fibrosis.
- Restoring Metabolic Function: The profound metabolic dysregulation in hepatocytes highlights the need for interventions that can restore mitochondrial function, improve energy metabolism, and enhance detoxification capacity in diseased hepatocytes to preserve liver function.
- Addressing Hypoxia: The widespread enrichment of HIF-1 signaling pathway suggests that chronic hypoxia is a significant driver of pathology in NAFLD/NASH. Therapeutic strategies aimed at improving liver oxygenation or modulating hypoxia-inducible factors could be beneficial.
- Biomarker Development: The identified dysregulated pathways, especially those that show progression-dependent changes and cell-type specificity, could be leveraged to develop novel non-invasive biomarkers for diagnosing NAFLD/NASH, assessing disease severity, predicting progression risk, or monitoring treatment efficacy.
- Precision Medicine Approaches: The cell-type-specific nature of the pathway enrichments suggests that therapeutic interventions could be tailored to target specific cell populations or their unique activated pathways, moving towards more precise and effective treatments for NAFLD and its complications. For example, anti-fibrotic therapies could focus on modulating activated HSCs, while anti-inflammatory treatments could target specific macrophage or T cell subsets.
17. Discussion
The single-cell transcriptomic analysis vividly captures the dynamic cellular and molecular landscape of Nonalcoholic Fatty Liver Disease (NAFLD) progression, from initial steatosis to Nonalcoholic Steatohepatitis (NASH) and end-stage cirrhosis. UMAP visualizations clearly delineate healthy from advanced diseased states, with early NAFLD exhibiting an intermediate and more dispersed profile, underscoring the dataset's ability to model disease severity.
Key cellular population shifts underscore the inflammatory and fibrotic nature of advanced NAFLD. We observe a consistent decrease in hepatocyte proportions, accompanied by a significant expansion of macrophages, hepatic stellate cells (HSCs), and specific T cell subsets (Th1, Th17, Th22) in NASH and cirrhosis. Macrophage polarization shifts dramatically from M2C dominance in healthy liver to M1/M2A predominance in diseased states, signaling a pronounced pro-inflammatory and pro-fibrotic environment. This reprogramming is further evidenced by disease-specific macrophage surfaceome markers, such as P2RY6 and ADGRA2 in end-stage NAFLD, and CD40 and MRC2 in NASH cirrhosis, offering granular insights into their functional states.
Hepatocytes, the liver's functional units, undergo profound metabolic dysfunction. Gene Ontology (GSA) and Gene Set Enrichment Analysis (GSEA) reveal a broad downregulation of key metabolic pathways (e.g., oxidative phosphorylation, amino acid metabolism) coupled with a significant upregulation of cellular stress responses (ER stress, autophagy, p53 signaling) as disease progresses. Notably, end-stage NAFLD hepatocytes show enrichment for cellular senescence and ferroptosis, indicating distinct mechanisms of cellular demise that may perpetuate chronic injury. Upregulated hepatocyte surfaceome markers like AGTR1, OSMR, and MME further point to altered signaling and stress responses.
Fibrogenesis is centrally driven by Hepatic Stellate Cells (HSCs), which exhibit a marked activation signature. Both GSEA and surfaceome marker analysis highlight the upregulation of pathways and proteins crucial for cell-extracellular matrix (ECM) interactions, hypoxia, and pro-fibrotic signaling (e.g., PDGFRB, AGTR1, ITGAV/ITGB1, AXL, DDR2). Cell-cell interaction (CCI) analyses reinforce this, demonstrating a heightened network of integrin-mediated interactions (e.g., collagen-integrin, TNC-integrin, THBS1-integrin) and strong VCAM1/ICAM1 interactions involving HSCs and immune cells in advanced disease. These interactions form a positive feedback loop, driving HSC activation and immune cell infiltration.
The immune microenvironment is dynamically reshaped, with T cells and innate lymphoid cells (ILCs) playing critical roles. Increased proportions of Th1, Th17, and Th22 cells in advanced disease stages point towards robust pro-inflammatory adaptive immune responses, while an increase in Treg cells in end-stage NAFLD may reflect an overwhelmed or maladaptive regulatory attempt. GSEA confirms the activation of diverse immune pathways (Th1/Th2 differentiation, HIF-1, IL-17, JAK-STAT, NF-κB, PI3K-Akt, Ras, TNF signaling) across T cells, ILCs, and macrophages. CD4+ T cell surfaceome markers like TGFBR2, SLC16A7, and ITGA6 suggest altered metabolism, adhesion, and TGF-β responsiveness in the cirrhotic liver, potentially mediating T cell dysfunction or pro-fibrotic functions.
In summary, this report delineates a comprehensive, cell-type-specific molecular atlas of NAFLD progression. It underscores a coordinated dysregulation across hepatocytes, immune cells, and stromal cells, driven by metabolic collapse, chronic inflammation, and robust fibrogenesis. The extensive interplay of signaling pathways and surface molecules provides a fertile ground for the identification of novel biomarkers and the development of targeted therapeutic strategies.
Hypotheses:
- Persistent metabolic stress in hepatocytes drives a switch towards ferroptosis and cellular senescence in end-stage NAFLD, rather than apoptosis, thereby exacerbating chronic liver injury and inflammation.
- The early increase in Macrophage M2B/M2D subsets in NAFLD represents a maladaptive response to lipid overload and metabolic stress, inadvertently priming the liver microenvironment for fibrogenesis upon disease progression.
- Upregulation of specific integrins (e.g., αV, α1β1, α4β1) on hepatic stellate cells and immune cells establishes a self-reinforcing loop with extracellular matrix components and adhesion molecules, locking the liver into a persistent fibrotic and inflammatory state in NASH and cirrhosis.
- CD4+ T cells in NASH cirrhosis adopt a distinct metabolic programming, indicated by elevated SLC16A7 and LMBR1 expression, to fuel their sustained inflammatory or regulatory functions within the metabolically challenged and fibrotic liver environment.
- The widespread activation of the HIF-1 signaling pathway across multiple liver cell types (hepatocytes, HSCs, endothelial cells, macrophages) signifies that chronic hypoxia is a central driver of pathology, directly contributing to metabolic dysfunction, inflammation, and fibrosis in NAFLD/NASH.
Potential therapeutic targets:
- Angiotensin II Receptor Type 1 (AGTR1): AGTR1 is highly upregulated on hepatocytes and hepatic stellate cells (HSCs) in advanced NAFLD/NASH. Activation by Angiotensin II promotes vasoconstriction, inflammation, oxidative stress, and fibrogenesis by stimulating pathways like MAPK, PKC, and NF-κB, leading to lipid accumulation and ECM deposition. Evidence: Consistent upregulation in advanced disease correlates with increased pro-fibrotic signaling. Angiotensin Receptor Blockers (ARBs), which specifically inhibit AGTR1, are well-established therapeutics for hypertension and have shown beneficial effects on inflammation and fibrosis markers in preclinical and clinical NAFLD/NASH studies. Validation: Clinical trials with existing ARBs in NAFLD/NASH patients; preclinical studies in animal models to assess impact on fibrosis, inflammation, and hepatocyte function. Monitor hepatocyte stress markers and HSC activation.
- PDGFRB (Platelet-Derived Growth Factor Receptor Beta): PDGFRB is a classical marker highly expressed on activated Hepatic Stellate Cells (HSCs) in NASH cirrhosis and end-stage NAFLD. Its activation by PDGF ligands is a central pathway driving HSC proliferation, migration, and ECM production, thus directly promoting liver fibrosis. Evidence: Consistent upregulation in activated HSCs in advanced disease stages; known as a master regulator of fibrogenesis across various organs. PDGFR inhibitors are approved for other fibrotic diseases. Validation: Preclinical studies using PDGFRB inhibitors in animal models of NAFLD/NASH to assess reduction in HSC activation, collagen deposition, and overall fibrosis. Evaluate changes in liver stiffness and histopathological scores.
- Integrins (e.g., αV, α1β1, α4β1): Various integrin complexes (e.g., ITGAV, ITGB1) are highly expressed and involved in strong cell-ECM and cell-cell interactions on activated HSCs and immune cells in advanced NAFLD. Integrins mediate crucial processes like HSC mechanotransduction, TGF-β activation, and immune cell recruitment via adhesion molecules like VCAM1/ICAM1, all central to fibrosis and inflammation. Evidence: Increased strength and significance of integrin-mediated cell-cell interactions in NASH cirrhosis and end-stage NAFLD. Integrin inhibitors have shown promise in preclinical models of liver fibrosis. Validation: Preclinical testing of specific integrin inhibitors (e.g., αV, α1, α4) in NAFLD/NASH animal models to block HSC activation, reduce immune cell infiltration, and halt fibrosis progression. Evaluate changes in inflammatory cytokine profiles and ECM deposition.
- CD40 (on Macrophages): CD40 is highly expressed on macrophages in NASH cirrhosis. CD40-CD40L signaling is a major pathway for immune activation, driving inflammation and promoting fibrosis in chronic liver disease by enhancing pro-inflammatory cytokine production and T-cell activation. Evidence: Upregulation on macrophages in NASH cirrhosis points to enhanced inflammatory activation. Blockade of CD40-CD40L interaction is explored in autoimmune diseases. Validation: Preclinical studies using anti-CD40 antibodies or small molecule inhibitors to block macrophage activation, reduce pro-inflammatory cytokine production, and ameliorate liver inflammation and fibrosis in NAFLD/NASH models. Assess macrophage phenotype shifts and T-cell activation in the liver.
- HIF-1 signaling pathway: The HIF-1 signaling pathway is consistently and significantly upregulated in hepatocytes, hepatic stellate cells, endothelial cells, and macrophages in diseased conditions. This indicates widespread chronic hypoxia as a significant driver of pathology, contributing to metabolic dysfunction, inflammation, and fibrosis. Evidence: Widespread pathway enrichment across multiple cell types in NAFLD progression. HIF-1 activity is known to promote inflammation, angiogenesis, and metabolic reprogramming in chronic liver diseases. Validation: Preclinical studies with HIF-1 inhibitors or activators in animal models of NAFLD/NASH to assess effects on liver oxygenation, inflammation, and fibrosis. Measure markers of hypoxia and associated downstream inflammatory/fibrotic gene expression.
Follow-up validation ideas:
- Utilize multi-color flow cytometry or immunohistochemistry to quantify and localize specific T cell subsets (Th1, Th17, Th22, Treg) and macrophage M1/M2 subsets in human liver biopsies at different NAFLD stages, using their identified surface markers (e.g., P2RY6, CD40).
- Employ spatial transcriptomics or proteomics to map the precise cellular neighborhoods and ligand-receptor interactions (e.g., integrin-ECM, VCAM1-integrin, ICAM1-integrin) between hepatic stellate cells, macrophages, and ILCs in human NAFLD/NASH liver tissue.
- Conduct in vitro co-culture experiments using primary human hepatocytes, hepatic stellate cells, and macrophages to assess the functional consequences of inhibiting key surface markers (e.g., AGTR1, OSMR on hepatocytes; PDGFRB, AXL on HSCs; CD40, P2RY6 on macrophages) on lipid accumulation, inflammation, and fibrosis markers.
- Perform targeted qPCR or Western blot validation for differentially expressed hepatocyte surface markers (e.g., MME, VNN1, TMPRSS6) and HSC markers (e.g., DDR2, LRP5/6, NGFR) in larger patient cohorts or isolated liver cell populations.
- Test the therapeutic efficacy of pharmacological inhibitors targeting specific integrins (e.g., αV, α1, α4), VCAM1, ICAM1, or pathways (e.g., TGF-β, WNT, AXL, PDGFRB, RAS) in established animal models of NAFLD/NASH, assessing their impact on liver histology, inflammation, and fibrosis progression.
- Perform targeted metabolomic profiling on isolated CD4+ T cells from cirrhotic livers to confirm altered metabolic programming, especially related to monocarboxylate and vitamin B12 uptake, based on the identified SLC16A7 and LMBR1 expression.
Limitations:
This analysis primarily identifies associations and correlations with disease progression, which do not definitively establish causality for observed cellular shifts or pathway activities. While the dataset uses human samples, further validation in larger, independent patient cohorts and functional in vivo studies are required to confirm the clinical relevance and therapeutic potential of these findings. The inherent heterogeneity of complex diseases like NAFLD, NASH, and cirrhosis means that while the data is representative, individual patient variations may not be fully captured. Furthermore, single-cell RNA-seq provides a snapshot of gene expression, not direct protein levels, post-translational modifications, or long-term cell fate, and the specific analysis queries may not have captured all potential insights from less abundant cell populations.
18. Query List
- Show and save UMAPs for condition, sample, major cell type, minor cell type, and celltype_subset in two columns.
- Show major cell type scores on UMAP and save the result.
- Show and save a marker expression dot plot for celltype_subset. SET target_cell = None and var_group_rotation = 45. Leave all other arguments at their default values.
- Show and save a population bar plot of minor cell types.
- Show and save a population bar plot of T cell subsets.
- Show and save box plots of T cell subset populations with statistically significant differences between conditions, if any. Choose ncols based on the total number of panels.
- Show and save a population bar plot of macrophage subsets.
- Show and save box plots of macrophage subset populations with statistically significant differences between conditions, if any. Choose ncols based on the total number of panels.
- Show and save cell-cell interaction patterns. Select at most 80 cell-cell interactions per group.
- Find cell-cell interactions involving major immune and stromal cells that differ significantly between conditions, show them as a dot plot, and save the result. Set max_n_items_per_group to 60. For each interaction identified under each condition, using the provided dataset context, describe the associated signaling pathways and mechanisms and, where relevant, its potential as a therapeutic target and related therapeutic agents.
- Show marker expressions for Hepatocyte in a dot plot, and save the result. Use only surfaceome markers, with at most 50 markers per condition. For each marker identified under each condition, using the provided dataset context, describe the associated signaling pathways and biological mechanisms within the tissue and, where relevant, its potential as a therapeutic target for the disease and related therapeutic agents.
- Show marker expressions for Macrophage in a dot plot, and save the result. Use only surfaceome markers, with at most 40 markers per condition. For each marker identified under each condition, using the provided dataset context, describe the associated signaling pathways and biological mechanisms within the tissue and, where relevant, its potential as a therapeutic target for the disease and related therapeutic agents.
- Show marker expressions for Hepatic stellate cell in a dot plot, and save the result. Use only surfaceome markers, with at most 40 markers per condition. For each marker identified under each condition, using the provided dataset context, describe the associated signaling pathways and biological mechanisms within the tissue and, where relevant, its potential as a therapeutic target for the disease and related therapeutic agents.
- Show marker expressions for T cell CD4+ in a dot plot, and save the result. Use only surfaceome markers, with at most 40 markers per condition. For each marker identified under each condition, using the provided dataset context, describe the associated signaling pathways and biological mechanisms within the tissue and, where relevant, its potential as a therapeutic target for the disease and related therapeutic agents.
- Show Gene Ontology (GSA) analysis results for Hepatocyte as a bar plot, and save the result.
- Show Gene Set Enrichment Analysis results as a dot plot, and save it. Set the color map to RdBu_r, n_pws_to_show to 120, and target_cells to None.