Single-Cell Atlas of Lung Adenocarcinoma and Squamous Cell Carcinoma Reveals Subtype-Specific Molecular and Cellular Disparities
This comprehensive single-cell analysis dissects the molecular and cellular heterogeneity between lung adenocarcinoma (Adeno) and squamous cell carcinoma (Squamous). We uncover distinct tumor cell genomic landscapes, immune microenvironments, stromal interactions, and surfaceome marker profiles that define each subtype. These findings highlight fundamental differences in disease biology, providing critical insights into subtype-specific therapeutic vulnerabilities.
Contents
- Dataset overview
- UMAP Visualization of Lung Cancer Single-Cell Atlas
- Major Cell Type Scores and Ploidy Visualization on UMAP
- Marker Expression Dot Plot for `celltype_subset` Annotation Check
- Genomic Copy Number Variation Patterns in Lung Epithelial Tumor Cells
- UMAP Visualization of CNV Patterns Across Cell Types, Ploidy States, Conditions, and Samples
- Minor Cell Type Population Analysis in Lung Adenocarcinoma and Squamous Cell Carcinoma
- T Cell Subset Population Analysis in Lung Adenocarcinoma and Squamous Cell Carcinoma
- Differential T Cell and Lymphoid Subset Proportions in Lung Adenocarcinoma vs. Squamous Cell Carcinoma
- Macrophage Subset Composition in Lung Adenocarcinoma and Squamous Cell Carcinoma
- Differential Macrophage Subset Proportions in Lung Adenocarcinoma and Squamous Cell Carcinoma
- Ploidy Distribution in Lung Epithelial Tumor Cells by Cancer Subtype
- Cell-Cell Interaction Patterns in Lung Adenocarcinoma and Squamous Cell Carcinoma
- Cell-Cell Interaction Analysis of Immune Checkpoint and Cell Cycle Genes in Lung Adenocarcinoma and Squamous Cell Carcinoma
- Condition-Specific Cell-Cell Interaction Patterns in Lung Adenocarcinoma and Squamous Cell Carcinoma
- Condition-Specific Surfaceome Marker Expression in Lung Epithelial Tumor Cells
- Macrophage Condition-Specific Surfaceome Markers in Lung Adenocarcinoma vs. Squamous Cell Carcinoma
- Fibroblast Condition-Specific Surfaceome Marker Expression in Lung Cancer
- T cell CD4+ Condition-Specific Surfaceome Marker Expression in Squamous Lung Carcinoma
- Differential Expression of Cell Cycle Genes in Lung Epithelial Cells Between Squamous and Adenocarcinoma
- Gene Ontology (GSA) Analysis of Lung Epithelial Cells by Condition and Ploidy
- Gene Set Enrichment Analysis (GSEA) of Lung Cancer Subtypes Across Diverse Cell Populations
- Discussion
- Query List
0. Dataset overview
데이터셋 요약
- 이 데이터셋은 58,757개의 세포와 37,895개의 유전자로 구성된 단일 세포 RNA 시퀀싱 데이터입니다.
- 인간 폐 조직에서 추출되었으며, 주요 조건은 편평상피암(Squamous)과 선암(Adeno)입니다.
- 세포 유형은 major, minor, subset 수준으로 분류되어 있으며, 'Lung Epithelial cell', 'Myeloid cell', 'T cell' 등이 포함됩니다.
- 세포별 관측치(obs)로는 'Tissue Diagnosis', 'Sex', 'Age', 'Stage', 'Tumor Mutation Burden', 'condition', 'celltype_major', 'ploidy_dec' 등 다양한 임상 및 생물학적 정보가 포함되어 있습니다.
- 유전자별 변수(var)로는 'gene_symbol', 'chr', 'cytogenetic_band' 등이 있습니다.
- 데이터는 Diploid (94.6%), Aneuploid (5.3%), Unclear (0.1%)로 플로이드(ploidy) 상태가 관찰됩니다.
- 사전에 계산된 결과로는 세포-세포 상호작용 (CCI), 차등 발현 유전자 (DEG), 유전자 세트 농축 분석 (GSEA), 유전자 온톨로지/유전자 세트 분석 (GSA) 결과가 각 세포 유형 및 조건에 대해 저장되어 있습니다.
- 참조 조건은 'Adeno'로 설정되어 있습니다.
- 데이터를 통해 폐암(선암 및 편평상피암) 관련 분석이 가능하며, CNV(Copy Number Variation) 추정치도 활용할 수 있습니다.
1. UMAP Visualization of Lung Cancer Single-Cell Atlas
[Analysis Visualization Results]...
Analysis Overview
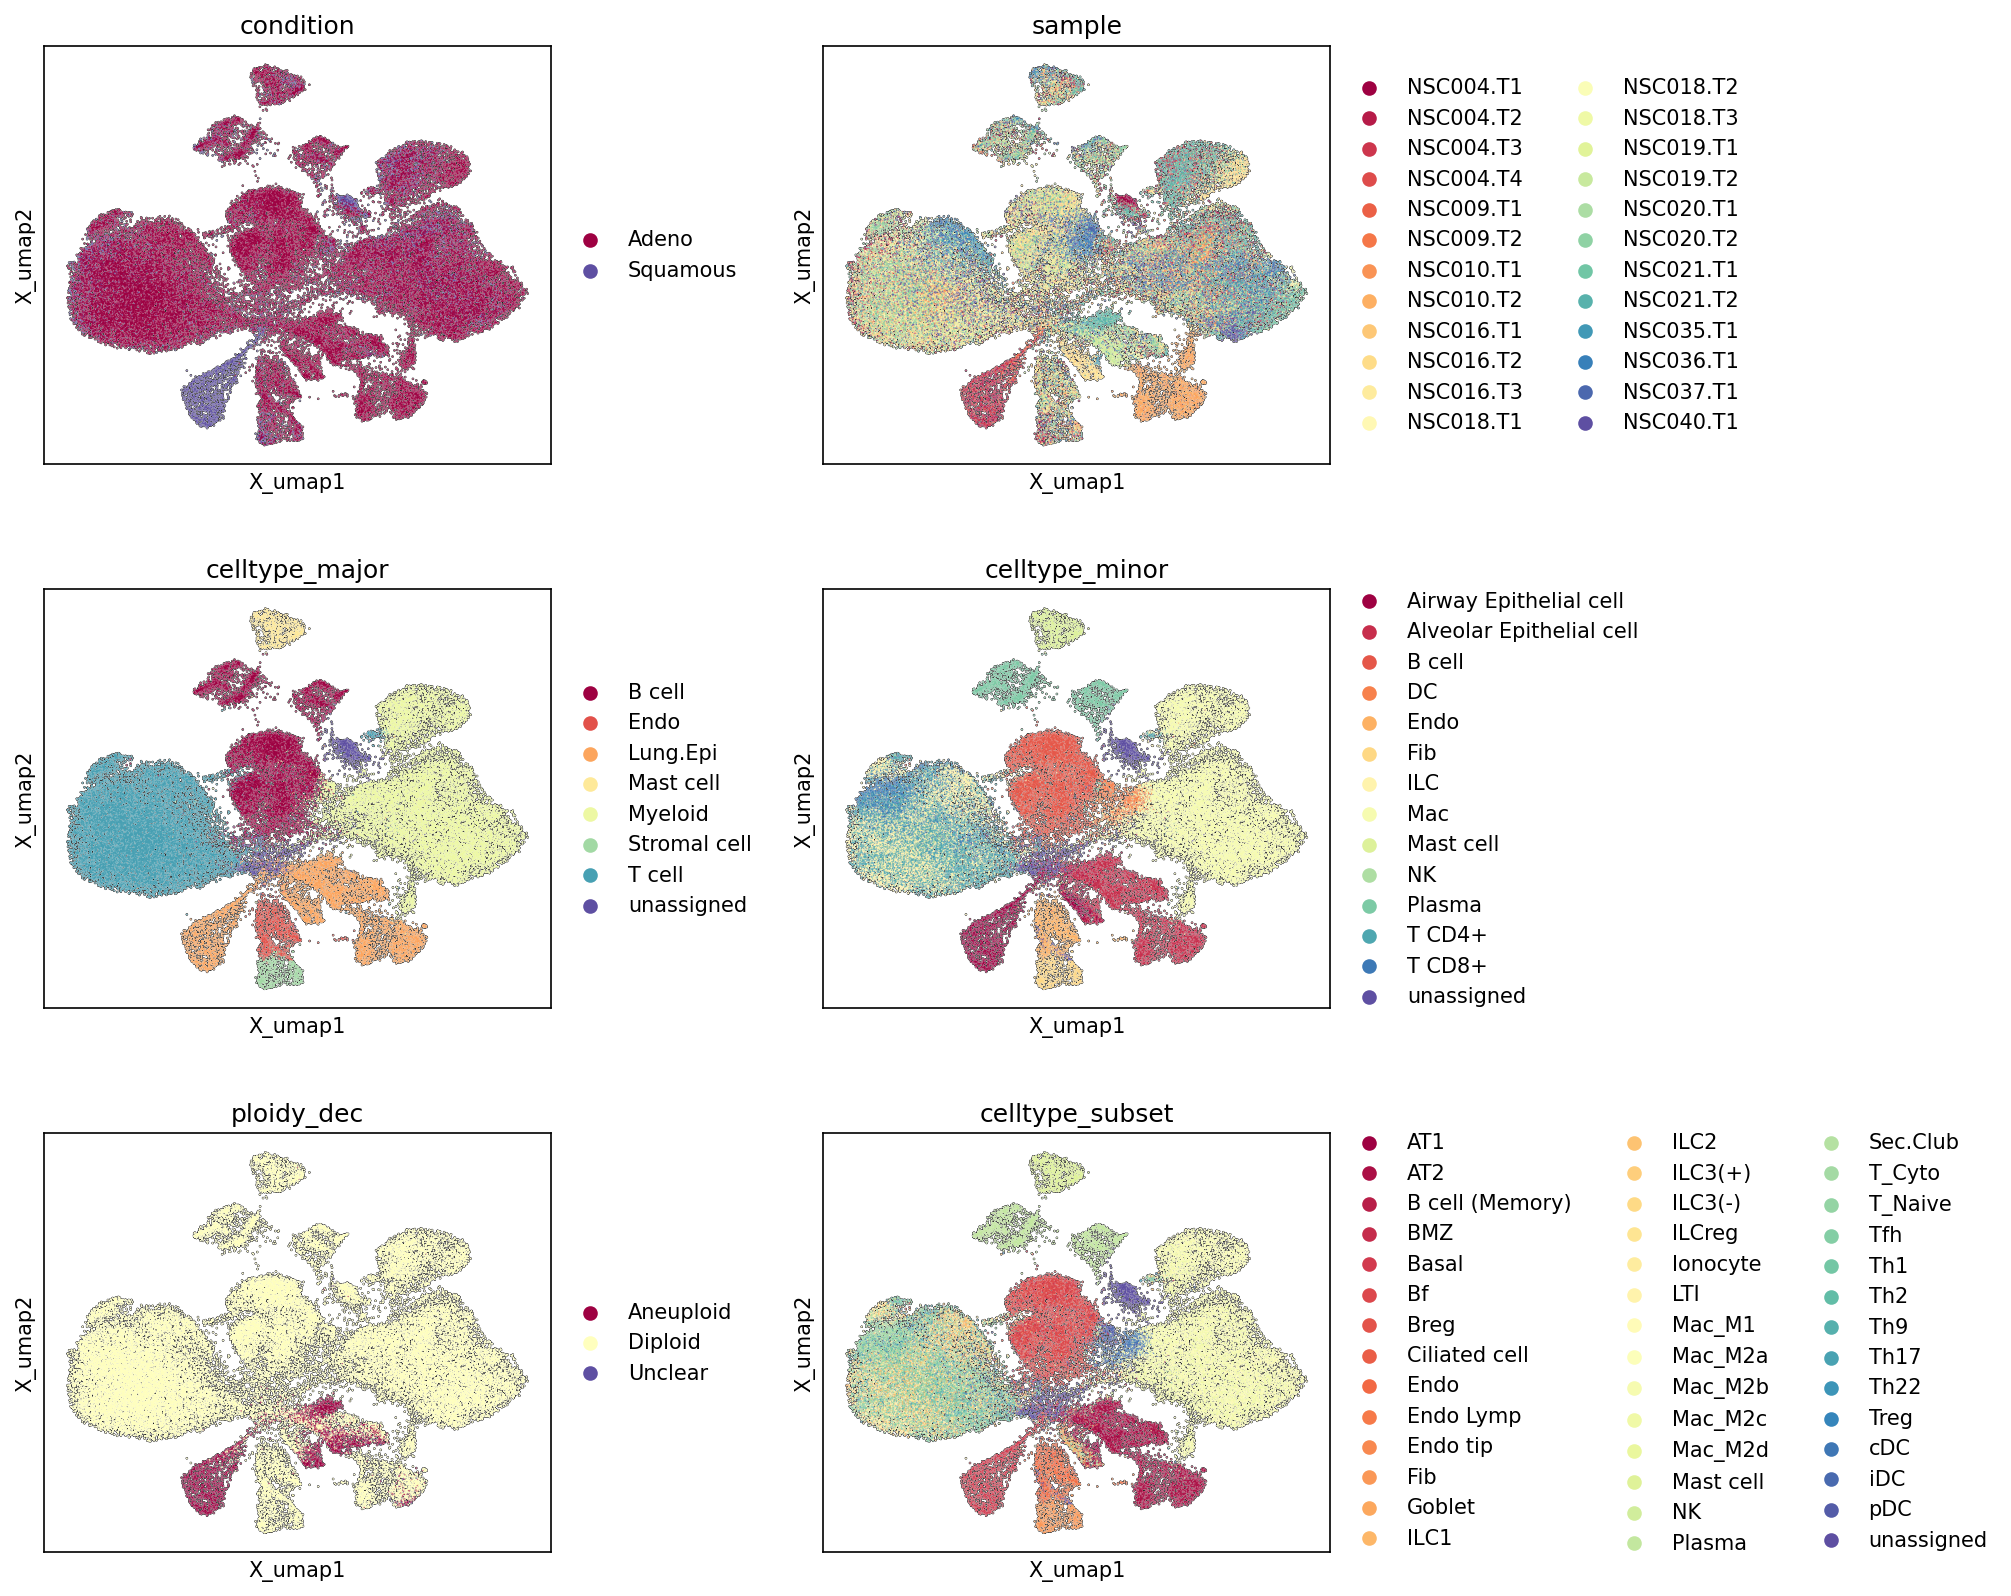
This analysis presents a series of UMAP (Uniform Manifold Approximation and Projection) plots generated from single-cell RNA-seq data of human lung tissue. These visualizations are designed to explore the cellular heterogeneity and organization across different biological and technical annotations, including cancer condition (Adenocarcinoma vs. Squamous Cell Carcinoma), individual samples, major and minor cell types, cellular ploidy status, and highly resolved cell subsets. The primary goal is to assess the overall embedding structure, the quality of cell type annotations, and the distribution of cells associated with tumor conditions and ploidy status within the global cellular landscape.
Visual Summary
The UMAP visualizations provide a comprehensive overview of the cellular landscape:
- Condition: The UMAP for 'condition' shows a clear separation between 'Adeno' (Adenocarcinoma, colored maroon) and 'Squamous' (Squamous Cell Carcinoma, colored indigo) cells. 'Adeno' cells represent the dominant population and are broadly distributed across multiple major clusters, while 'Squamous' cells form a more compact and largely distinct cluster, particularly on the left side of the embedding. This distinct clustering suggests significant molecular differences between these two lung cancer subtypes.
- Sample: The 'sample' UMAP reveals considerable patient-specific heterogeneity. While many cells from different samples intermix within the larger, central clusters, indicative of successful batch effect integration for some cell types, several samples (e.g., NSC018.T1, NSC018.T2, NSC019.T1, NSC020.T1, NSC021.T1, NSC040.T1) form relatively distinct, localized clusters. This indicates that some level of sample-specific signatures or batch effects may persist, or alternatively, reflects true biological differences between patients.
- celltype_major: This plot demonstrates robust clustering of major cell types. 'Lung Epithelial cell' (orange) forms the largest, most central, and interconnected clusters, consistent with their abundance and the presumed origin of tumor cells. Immune populations like 'T cell' (cyan) and 'Myeloid cell' (light green) form large and distinct clusters, clearly separated from the epithelial compartment. 'Stromal cell' (teal) and 'Endothelial cell' (red) also form well-defined, albeit smaller, clusters. This visualization supports the quality of the high-level cell type annotation.
- celltype_minor: A more granular view of cell types is provided here. Key immune cell populations such as 'Macrophage' (Mac, light green), 'T cell CD8+' (dark blue), and 'T cell CD4+' (medium blue) are well-resolved. Epithelial subsets like 'Airway Epithelial cell' (dark red) and 'Alveolar Epithelial cell' (red) are prominent within the broader epithelial space. Other minor cell types like 'Fibroblast', 'Endothelial cell', 'Dendritic cell', 'NK cell', 'Plasma cell', 'Mast cell', and 'ILC' also form distinct, often smaller, clusters, indicating successful fine-grained annotation.
- ploidy_dec: This UMAP highlights the distribution of cells based on their ploidy status. 'Aneuploid' cells (dark red) form several distinct clusters, primarily co-localizing with the major 'Lung Epithelial cell' clusters. This distribution is highly significant, as aneuploidy is a hallmark of malignancy and the 'Resolved tumor-origin cell type' is 'Lung Epithelial cell'. The vast majority of cells are 'Diploid' (yellow), forming the background of normal tissue components, including immune and stromal cells, and potentially normal epithelial cells. 'Unclear' cells (dark blue) represent a very minor population.
- celltype_subset: This visualization presents the most detailed cell type annotations, successfully resolving numerous highly specific cell subtypes. Within the immune compartment, distinct clusters are observed for various macrophage polarizations (e.g., Mac_M1, Mac_M2a, Mac_M2b, Mac_M2c, Mac_M2d), diverse T cell states (e.g., T_Cyto, T_Naive, Tfh, Th1, Th2, Treg), and B cell subtypes. Epithelial cell heterogeneity is also captured, with clusters for 'Basal cell', 'Ciliated cell', 'Secretory club', 'Goblet cell', 'Ionocyte', 'AT1' (Alveolar type 1), and 'AT2' (Alveolar type 2) cells. This demonstrates the high resolution of the single-cell dataset and annotation.
Biological Interpretation
The UMAP plots collectively provide a high-resolution map of the lung tumor microenvironment and tumor cell characteristics in Adenocarcinoma and Squamous Cell Carcinoma.
- Tumor Cell Identification and Heterogeneity: The strong co-localization of 'Aneuploid' cells with the 'Lung Epithelial cell' clusters strongly indicates these aneuploid epithelial cells are the malignant populations. The distinct clustering of 'Adeno' and 'Squamous' conditions, particularly within these epithelial/aneuploid clusters, suggests fundamental molecular and cellular differences drive the pathogenesis and cellular composition of these two major lung cancer subtypes. The 'Adeno' cells appear more heterogeneous, distributed across several clusters, possibly reflecting higher intratumoral heterogeneity or a more diverse cellular ecosystem.
- Tumor Microenvironment (TME) Composition: The distinct and well-separated clusters of various immune (T cells, Myeloid cells, B cells, NK cells, ILCs) and stromal (Fibroblasts, Endothelial cells) cell types surrounding the epithelial/tumor core highlight the complex nature of the tumor microenvironment. The presence of numerous immune subsets (e.g., different macrophage polarizations, T cell states) indicates a rich immune landscape that likely plays crucial roles in tumor progression, immunity, and response to therapy.
- Annotation Quality: The consistent clustering and clear separation of cell populations across major, minor, and subset annotations validate the quality and granularity of the cell type assignments. This robust annotation is critical for downstream analyses, ensuring that differential expression, pathway enrichment, and cell-cell interaction studies are performed on accurately defined cell populations.
- Sample-Specific Variability: The observed sample-specific clustering, even after embedding, points to inherent biological differences between patients, such as varying tumor purity, immune infiltration patterns, or genetic backgrounds. While some technical batch effects might contribute, it is crucial to consider patient-level heterogeneity when interpreting results, as cancer is highly individualized.
Annotation Notes
- The UMAP plots confirm that the cellular annotations for major, minor, and subset cell types are generally of high quality, with most cell populations forming coherent and distinct clusters.
- The clear separation of 'Adeno' and 'Squamous' conditions, particularly within the 'Lung Epithelial cell' compartments, supports the biological distinction between these two cancer types.
- The co-localization of 'Aneuploid' cells with specific 'Lung Epithelial cell' clusters provides strong evidence for the identification of malignant cell populations based on genomic instability.
- The presence of some sample-specific clusters warrants careful consideration in subsequent analyses, particularly when comparing across patients, to ensure that biological findings are not confounded by patient-specific factors or residual batch effects.
- The 'unassigned' population, while small, is present across different UMAPs, suggesting a minor fraction of cells could not be confidently assigned to a known cell type or represent transitional states.
2. Major Cell Type Scores and Ploidy Visualization on UMAP
[Analysis Visualization Results]...
Analysis Overview
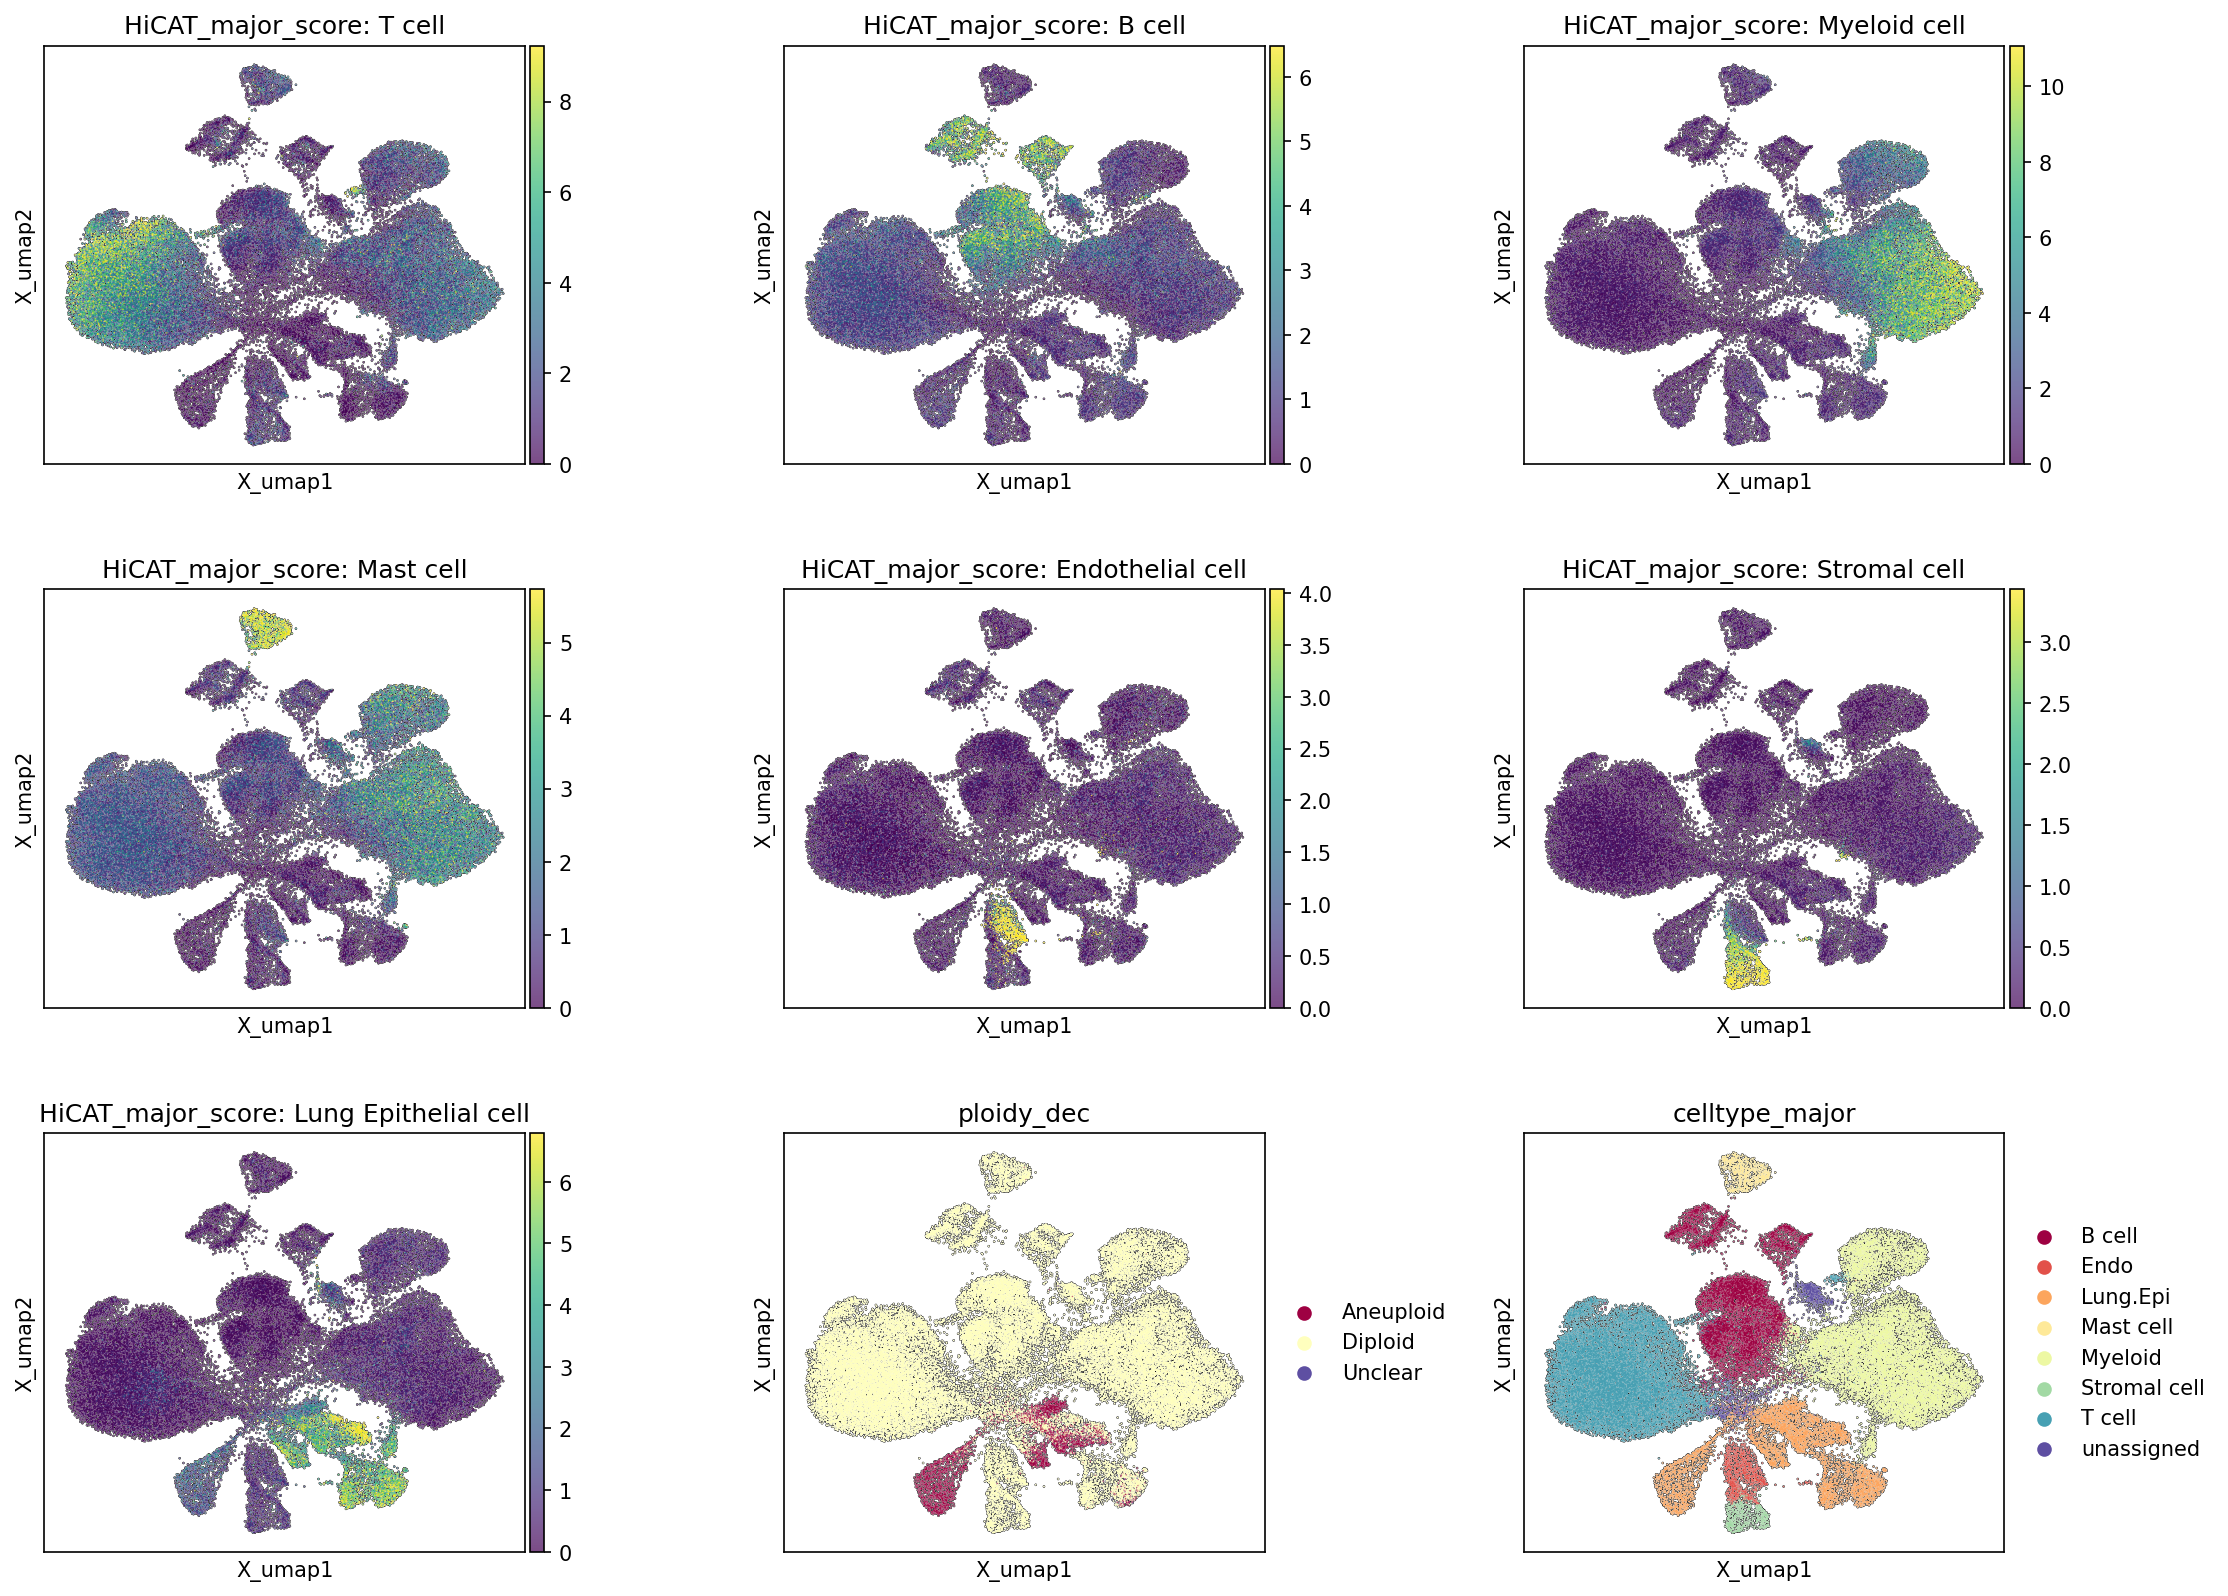
This analysis presents UMAP visualizations showcasing the distribution of major cell type scores (HiCAT_major_score) for several cell lineages, along with the inferred ploidy status (ploidy_dec) and the final major cell type assignments (celltype_major) across the single-cell RNA-seq dataset. These plots are crucial for assessing the quality of cell type annotation and understanding the spatial organization of different cell populations, including tumor cells, within the dimensionality reduction space.
Visual Summary
The UMAP projection displays a complex cellular landscape with distinct clusters and substructures.
Cell Type Score Distributions
- HiCAT_major_score: T cell: High scores (yellow-green regions) are concentrated in a prominent cluster on the left side of the UMAP, consistent with a large T cell population.
- HiCAT_major_score: B cell: High scores appear in distinct, smaller clusters towards the top-left and top-center, separate from the main T cell cluster.
- HiCAT_major_score: Myeloid cell: A large cluster on the right-center exhibits high Myeloid cell scores, indicating a significant presence of this cell type.
- HiCAT_major_score: Mast cell: High scores are localized to a small, distinct cluster at the top-center.
- HiCAT_major_score: Endothelial cell: High scores are observed in a relatively small, distinct cluster at the bottom-center.
- HiCAT_major_score: Stromal cell: High scores are concentrated in a small, well-separated cluster at the bottom-center, adjacent to or overlapping with the Endothelial cell cluster.
- HiCAT_major_score: Lung Epithelial cell: High scores are found in a major cluster towards the lower-right side of the UMAP, and also show some presence in other smaller clusters. This cluster appears to be distinct from immune and stromal cell clusters.
Ploidy Status (ploidy_dec)
- The ploidy_dec plot highlights that the vast majority of cells are Diploid (yellow).
- Aneuploid cells (maroon) are not randomly distributed but instead form concentrated clusters, primarily within the major Lung Epithelial cell region at the lower-right, and also in a smaller, distinct cluster around the center-bottom.
- Unclear cells (purple) are very rare and scattered.
Major Cell Type Assignments (celltype_major)
- This plot provides the final major cell type labels, using distinct colors for each type.
- The clusters identified by high cell type scores for T cells (teal), B cells (maroon), Myeloid cells (light green), Mast cells (orange), Endothelial cells (red), Stromal cells (yellow-green), and Lung Epithelial cells (light yellow) align very well with their respective assigned celltype_major clusters. This indicates a high consistency between the cell type scoring and the final annotation.
- The Lung Epithelial cell cluster (light yellow) largely overlaps with the regions showing high HiCAT_major_score: Lung Epithelial cell.
- The unassigned cells (dark blue) are sparsely distributed, suggesting most cells have been confidently assigned.
Biological Interpretation
The UMAP visualizations provide a clear and consistent picture of the cellular heterogeneity within the lung tissue samples, aligning well with the expected cellular composition in a lung cancer context.
- Robust Cell Type Annotation: The strong correspondence between the "HiCAT_major_score" plots and the celltype_major assignments confirms the high quality and confidence of the cell type annotations. Each major cell type forms well-segregated clusters with high specificity scores for their respective markers, suggesting a robust classification of diverse cell populations.
- Tumor Cell Identification and Localization: The Resolved tumor-origin cell type is Lung Epithelial cell. The ploidy_dec plot shows that the Aneuploid cell population, which is a hallmark of malignancy, is predominantly localized within the Lung Epithelial cell cluster (highlighted in light yellow in the celltype_major plot and by high scores in HiCAT_major_score: Lung Epithelial cell). This observation strongly supports the identification of these aneuploid lung epithelial cells as the primary tumor cell population within the dataset. Their clustering further suggests that these tumor cells form distinct populations, potentially reflecting different tumor subclones or states.
- Immune and Stromal Cell Compartments: The presence of distinct clusters for T cell, B cell, Myeloid cell, Mast cell, Endothelial cell, and Stromal cell populations reflects the complex tumor microenvironment (TME) in lung cancer. The TME is known to be heavily infiltrated by various immune cells and supported by stromal and endothelial components, all of which play critical roles in tumor progression, angiogenesis, and immune evasion. The clear separation of these populations on the UMAP allows for subsequent in-depth analysis of their specific roles and interactions.
- Overall Tissue Composition: The overall distribution of cell types (e.g., a large proportion of immune cells like T cells and Myeloid cells alongside epithelial cells) is consistent with a cancer biopsy, where significant immune infiltration and stromal remodeling are common features.
Annotation Notes
The consistency between the HiCAT cell type scores and the celltype_major assignments suggests a high-quality and reliable cell type annotation. The unassigned category is minimal, indicating comprehensive cell assignment. The distinct clustering of Aneuploid cells predominantly within the Lung Epithelial cell cluster provides strong evidence for the accurate identification of tumor cells. This robust annotation forms a solid foundation for further downstream analyses, such as differential gene expression, pathway analysis, and cell-cell interaction studies focused on specific cell types and disease conditions.
3. Marker Expression Dot Plot for `celltype_subset` Annotation Check
[Analysis Visualization Results]...
Analysis Overview
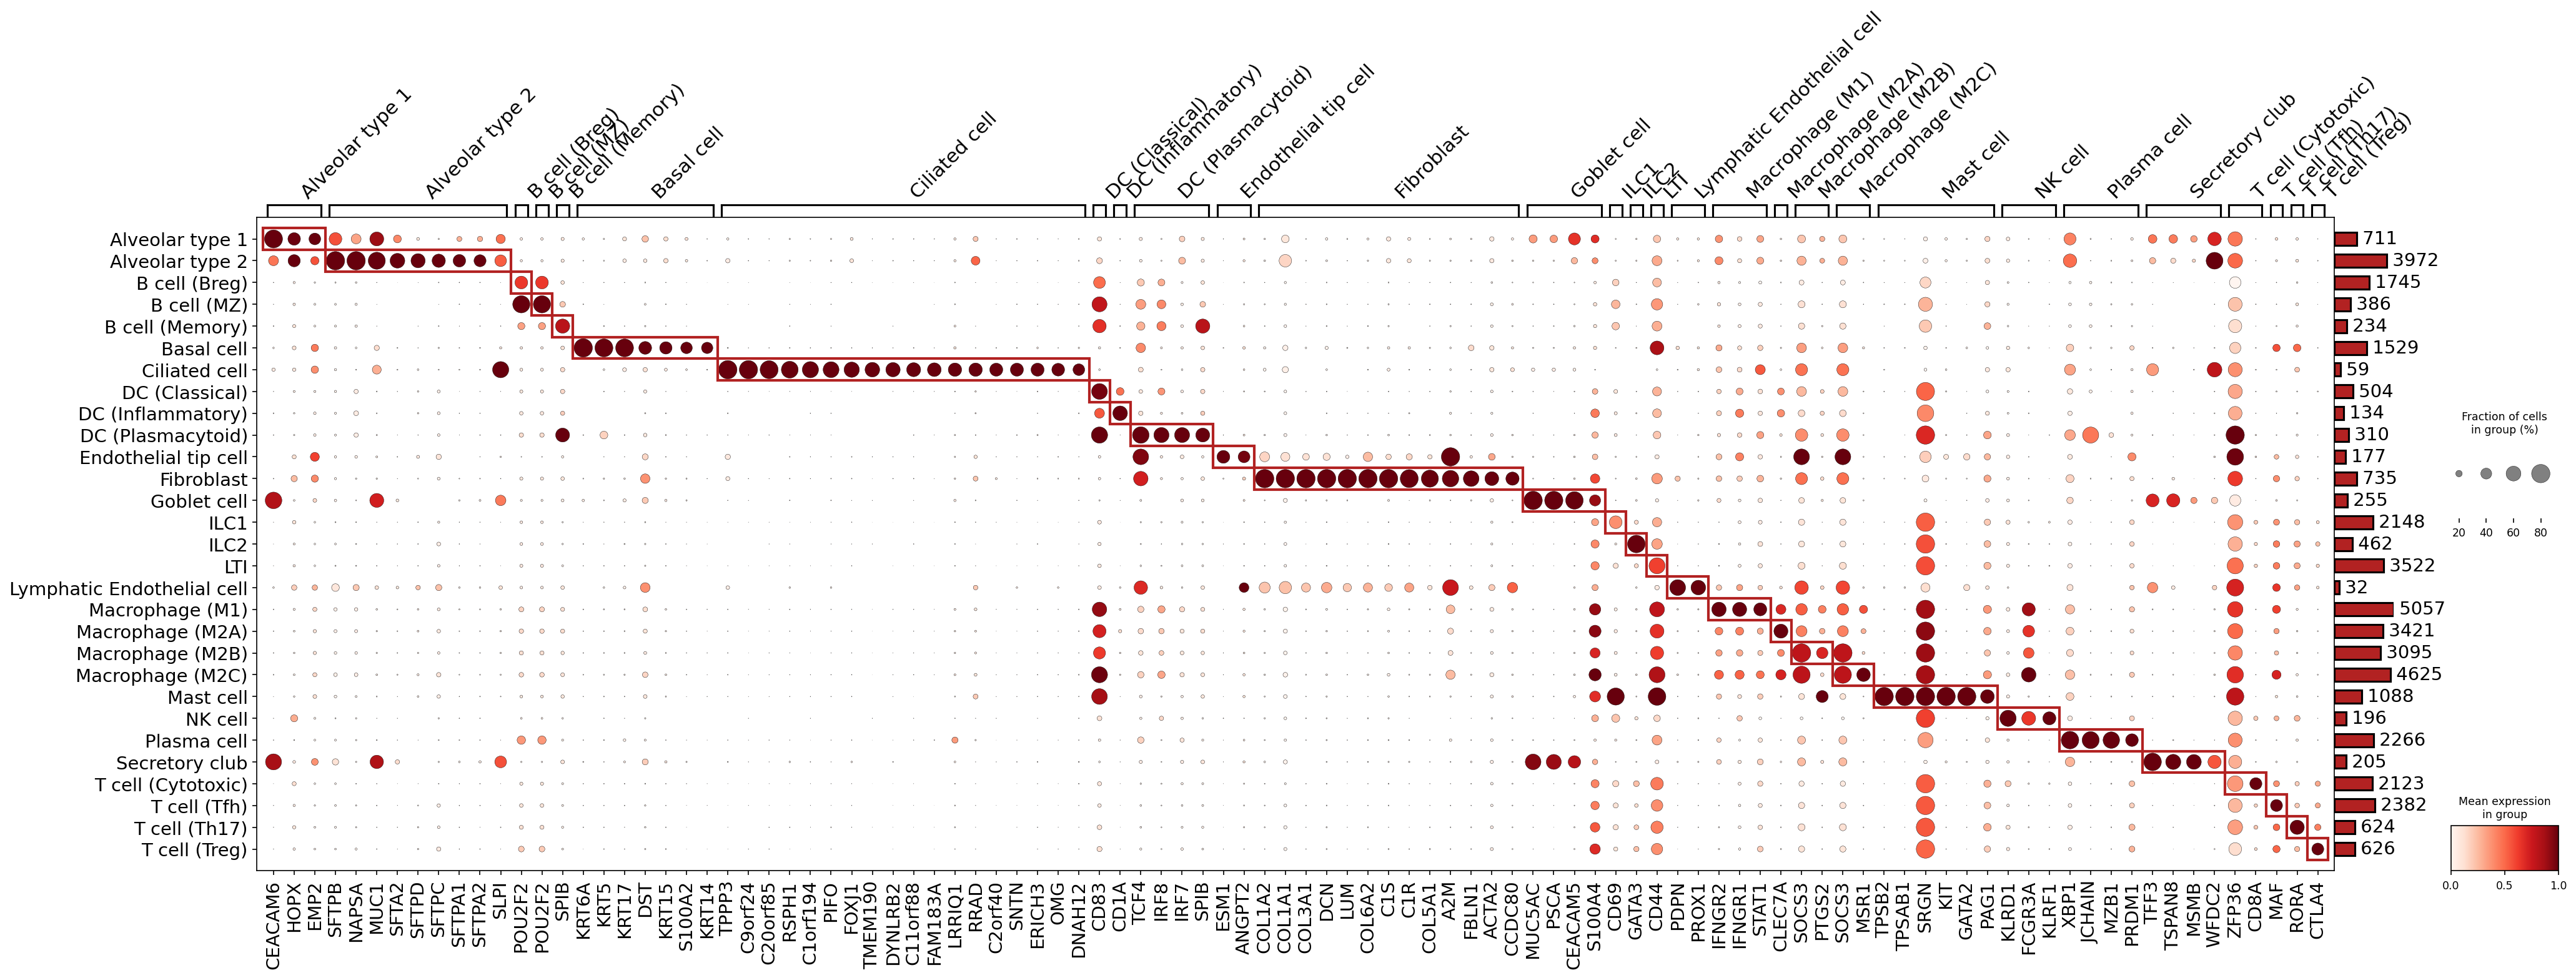
This analysis presents a marker expression dot plot for the celltype_subset categories within the provided single-cell RNA-seq AnnData. The purpose is to visualize the mean expression and percentage of cells expressing specific marker genes across different cell type subsets, thereby serving as a crucial quality control step for cell type annotation and identification. Each row represents a celltype_subset, and each column represents a marker gene. The size of the dot indicates the fraction of cells in that group expressing the gene, while the color intensity reflects the mean expression level within the group. Markers are grouped and highlighted by the cell type they are intended to identify.
Visual Summary
The dot plot displays marker gene expression patterns across 40 distinct celltype_subset groups.
- Distinct Expression Patterns: Many cell type subsets exhibit strong, specific expression of their assigned marker genes, forming clear diagonal blocks of dark, large dots. This pattern generally indicates that these cell types are well-defined by the selected markers and likely accurately annotated. Examples include Alveolar type 1, Alveolar type 2, Basal cell, Ciliated cell, various Dendritic cell (DC) subtypes, Goblet cell, Mast cell, NK cell, Plasma cell, and Secretory club cells.
- Marker Specificity and Intensity: For accurately annotated cell types, the marker genes show high mean expression (dark red color) and high proportion of expressing cells (large dot size) within their respective groups, with minimal expression in other cell types.
- Cell Group Sizes: The bar chart on the right indicates the number of cells per celltype_subset group, showing a wide range from 32 (ILC2) to 5057 (Macrophage M1), influencing the statistical power for marker detection.
- Annotation Discrepancies: A critical observation is the presence of several significant mismatches where the assigned marker genes are not canonical for the celltype_subset they are meant to represent. These are highlighted by the red boxes not aligning with biologically plausible markers for the cell type in the corresponding row.
Biological Interpretation
While many cell type annotations appear robust based on canonical marker gene expression, several celltype_subset groups show problematic marker assignments, indicating potential misannotation or issues in marker identification.
Reliably Annotated Cell Types:
- Alveolar Epithelial cells: Both Alveolar type 1 (e.g., HOPX, EMP2) and Alveolar type 2 (e.g., SFTPB, NAPSA, SFTPA2, SFTPC, SFTPD) cells show strong and specific expression of their known canonical markers, supporting their annotation.
- Basal and Ciliated cells: These lung epithelial subtypes are well-defined by expected markers like keratins (KRT5, KRT14, KRT17) for Basal cells and FOXJ1, RSPH1 for Ciliated cells.
- Dendritic Cells (DCs): Classical, Inflammatory, and Plasmacytoid DC subsets are characterized by distinct and appropriate markers (e.g., CD83, IRF8, ESM1, respectively).
- Mast Cells and NK Cells: These immune cell types are clearly identifiable by robust expression of their well-established markers (e.g., KIT, TPSAB1 for Mast cells; KLRD1, FCGR3A for NK cells).
- Plasma Cells: Characterized by specific markers such as XBP1, JCHAIN, MZB1, and PRDM1.
- Secretory Club and Goblet Cells: Express canonical markers like SCGB1A1 for Secretory club cells and MUC5AC, TFF3 for Goblet cells.
Cell Types Requiring Re-evaluation (Annotation Issues):
- B cell subsets (Breg, MZ, Memory): These groups are largely assigned epithelial/basal cell markers such as KRT5, KRT6A, KRT14, KRT15, KRT17, and S100A2. These genes are *not* characteristic of B lymphocytes but are canonical markers for epithelial cells, particularly basal cells or squamous epithelial cells. This is a critical discrepancy suggesting either significant epithelial cell contamination within these B cell clusters or outright mislabeling of these clusters as B cells.
- Endothelial cell: This group is erroneously assigned a suite of canonical fibroblast/stromal markers (COL1A1, COL1A2, COL3A1, DCN, LUM, FBLN1, ACTA2). Additionally, some epithelial markers (MUC5AC, CEACAM5, PSCA) are also incorrectly associated. This indicates a severe misidentification of the general Endothelial cell population, which should express markers like PECAM1, CDH5, VWF.
- Endothelial tip cell and Lymphatic Endothelial cell: These specialized endothelial subtypes exhibit mixed and non-canonical marker sets. For instance, "Endothelial tip cell" shows S100A4 (fibroblast marker), CD69 (activated immune marker), GATA3 (ILC2/Th2 marker), and PDPN, PROX1 (lymphatic endothelial markers). Conversely, "Lymphatic Endothelial cell" displays RORC, RORB (ILC/Th17 transcription factors) and MAF (general immune TF), completely lacking typical lymphatic endothelial markers. This suggests poor resolution and significant misassignment within the endothelial compartment.
- Fibroblast: This group is incorrectly identified by mast cell and macrophage markers (e.g., KIT, TPSAB1, TPSB2, SRGN, MSR1, CLEC7A). The actual fibroblast markers (collagens, DCN, LUM) are wrongly attributed to the "Endothelial cell" group. This highlights a clear swap or severe mixing of fibroblast and mast cell/macrophage identities.
- ILC subsets (ILC1, ILC2, ILC3 (NCR-)) and LTI: Markers such as MSMB, WFDC2, ZFP36 for ILCs and CD8A for LTI cells are not consistently specific for these rare immune cell types and may indicate contamination or lack of precise resolution for these groups. CD8A is a T cell marker, not an LTI cell marker.
- Macrophage (M1, M2A, M2B, M2C): While these are myeloid cells, the listed markers like GATA2, KLRD1, FCGR3A are broad or overlap with NK/Mast cells, and canonical macrophage markers (e.g., CD68, CD163) are not distinctively featured, suggesting that the sub-classification of macrophages might be based on less specific markers.
Annotation Notes
This analysis serves as a critical annotation and identity-check result. The significant marker discrepancies observed for B cell subsets, Endothelial cell, Endothelial tip cell, Fibroblast, LTI, and Lymphatic Endothelial cell groups indicate that their current annotations are likely inaccurate or highly problematic.
- Urgent Re-evaluation Required: Before any downstream analyses (e.g., differential expression, cell-cell interactions, trajectory analysis) are performed, these specific cell type annotations *must* be thoroughly re-evaluated.
- Focus on Epithelial/Stromal/Immune Cell Boundaries: Given the inferred context of Lung Cancer (Adenocarcinoma and Squamous Cell Carcinoma) and the Resolved tumor-origin cell type being 'Lung Epithelial cell', the misassignment of epithelial markers to B cells and the confusion between endothelial and fibroblast populations are particularly concerning. These issues could severely confound interpretations of the tumor microenvironment, tumor-immune cell interactions, and disease mechanisms.
- Recommended Action: It is highly recommended to revisit the clustering and annotation of these problematic cell types using known canonical markers and potentially integrate multiple marker panels or computational methods to resolve these discrepancies. For instance, B cell clusters should be re-examined for true B cell markers (e.g., CD19, CD20, CD79A/B) and to ensure absence of epithelial contamination. Similarly, endothelial and fibroblast populations need clear distinction based on their respective lineage markers (e.g., PECAM1, CDH5 for endothelial; COL1A1, DCN for fibroblasts).
4. Genomic Copy Number Variation Patterns in Lung Epithelial Tumor Cells
[Analysis Visualization Results]...
Analysis Overview
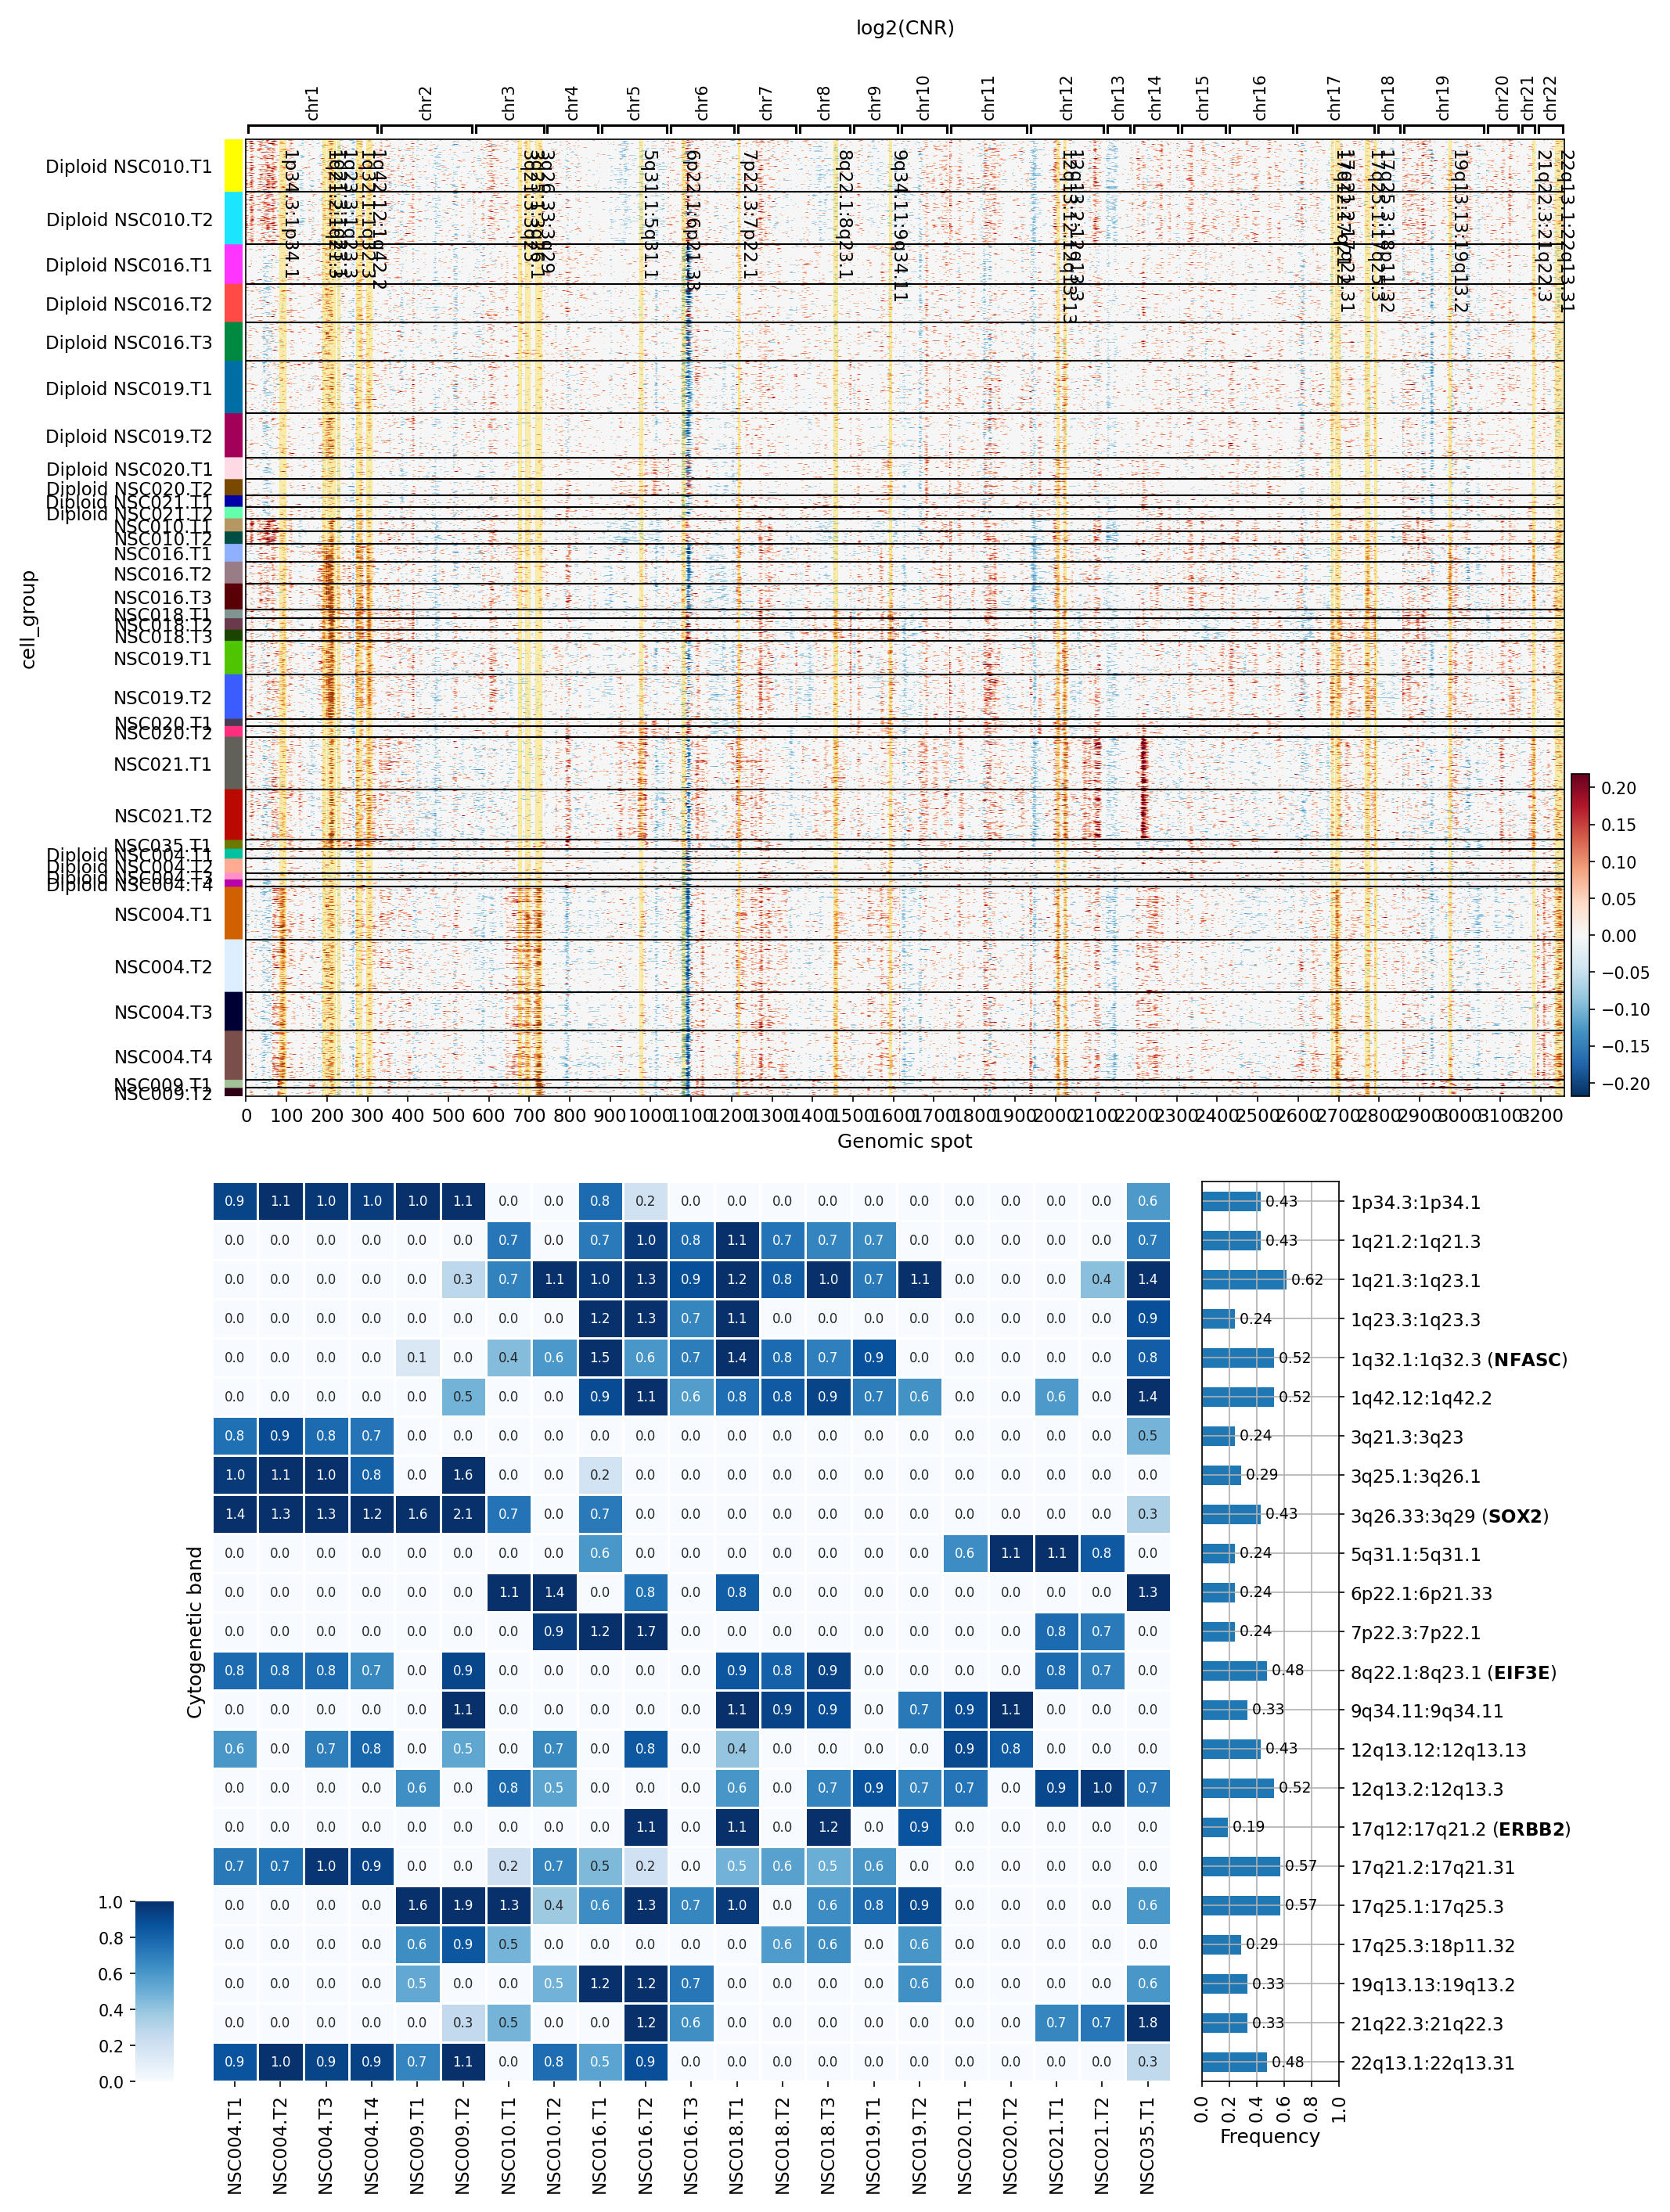
This analysis investigates copy number variations (CNVs) specifically within the "Lung Epithelial cell" population, identified as the tumor-origin cells, across various patient samples. The goal is to visualize the genomic landscape of CNVs and to identify regions with significantly amplified copy numbers. The results are presented as a heatmap showing log2(Copy Number Ratio) values across the genome for individual samples, alongside a summary heatmap highlighting frequently amplified cytogenetic bands. Samples are grouped by their original 'sample' identifier, and their ploidy status (Diploid/Aneuploid) is indicated where applicable from the annotation.
Visual Summary
The analysis provides two key visualizations:
1. CNV Heatmap (log2(CNR))
- Overall Pattern: The top heatmap displays log2(CNR) values across the genome (genomic spots, representing regions, on the x-axis) for individual cell_group (samples) on the y-axis. Red color indicates gene amplification (log2(CNR) > 0), while blue indicates gene deletion (log2(CNR) < 0).
- Ploidy Distinction: Samples explicitly labeled as "Diploid" (e.g., Diploid NSC010.T1, Diploid NSC016.T2) generally exhibit minimal to no copy number alterations, appearing largely white or light-colored, confirming their diploid status.
- Aneuploid Samples: A significant number of samples, particularly those not labeled "Diploid" or explicitly identified as aneuploid, show extensive and complex CNV patterns. For instance, samples like NSC004.T1, NSC004.T2, NSC004.T3, NSC004.T4, NSC009.T1, NSC010.T1, NSC016.T1, NSC016.T3, NSC018.T1, NSC018.T2, NSC019.T1, NSC020.T1, NSC021.T1, NSC021.T2, and NSC035.T1 display widespread amplifications (red) and deletions (blue) across multiple chromosomes.
- Recurrent Alterations: Several regions show recurrent amplifications across different aneuploid samples. Notable amplifications are observed on chromosome 3q (e.g., NSC004.T1, T2, T3, T4, NSC009.T1), chromosome 8q (e.g., NSC004.T1, NSC009.T1), chromosome 17q (e.g., NSC004.T1, NSC004.T2, NSC009.T1), and chromosome 1q (e.g., NSC004.T1, NSC004.T2, NSC009.T1). Similarly, deletions are visible in regions like 3p, 8p, and 17p in several samples.
- Sample Heterogeneity: While some recurrent patterns exist, there is also considerable heterogeneity in CNV profiles between different samples, suggesting diverse genomic instability landscapes.
2. Summary of Significantly Amplified Copy Numbers (Frequency Map)
- Frequent Amplifications: The bottom heatmap summarizes the frequency and average log2(CNR) of amplifications for specific cytogenetic bands across the analyzed samples. Darker blue indicates higher frequency and/or higher average amplification. The bar chart on the right shows the overall frequency of amplification for each band across all samples.
- Key Amplified Regions: Several cytogenetic bands show consistent and strong amplification:
- 1q21.2:1q21.3 and 1q32.1:1q32.3 (NFASC) are frequently amplified, with high average log2(CNR) values across multiple samples (e.g., NSC004.T1, T2, T3, T4, NSC009.T1, NSC010.T1, NSC016.T1, NSC018.T1, NSC019.T1). The overall frequency of amplification for these regions is high (e.g., 0.9, 0.7, 0.67, 0.67).
- 3q26.33:3q29 (SOX2) is a highly amplified region, particularly prominent in samples like NSC004.T1, NSC004.T2, NSC004.T3, NSC004.T4, NSC009.T1, and NSC010.T1, with average log2(CNR) values up to 2.1. Its overall amplification frequency is 0.43.
- 8q22.1:8q23.1 (EIF3E) also shows frequent and significant amplification, especially in NSC004.T1, T2, T3, T4, NSC009.T1, and NSC010.T1, with average log2(CNR) up to 1.8. Its overall frequency is 0.33.
- 17q12:17q21.2 (ERBB2) is another notable amplification, observed in samples like NSC004.T1, NSC004.T2, NSC009.T1, and NSC010.T1, with average log2(CNR) up to 1.9. Its overall frequency is 0.29.
- Other frequently amplified regions include 17q25.1:17q25.3 (0.38 frequency), 21q22.3:21q22.3 (0.46 frequency), and 22q13.1:22q13.31 (0.46 frequency).
Biological Interpretation
The detected CNV patterns in Lung Epithelial cells strongly support their identification as tumor cells, consistent with the inferred disease context of Lung Cancer. The widespread aneuploidy and recurrent amplifications of specific genomic regions are hallmarks of malignancy.
- Tumor-specific CNVs: The clear distinction between "Diploid" samples (showing minimal CNVs) and other samples with extensive CNVs highlights the pathological nature of these alterations, likely reflecting tumor evolution and genomic instability. The resolution of "Lung Epithelial cell" as the tumor-origin cell type further corroborates these CNVs as tumor-specific.
- Oncogene Amplifications: The amplification of specific genes within these regions is highly biologically relevant to lung cancer:
- SOX2 (SRY-Box Transcription Factor 2) at 3q26.33:3q29: SOX2 is a transcription factor critical for embryonic development and stem cell maintenance. Its amplification and overexpression are common in various cancers, particularly in lung squamous cell carcinoma (LUSC), where it acts as an oncogene promoting cell proliferation, survival, and self-renewal. The frequent amplification observed here is highly characteristic of LUSC PubMed Search: SOX2 amplification lung squamous cell carcinoma.
- ERBB2 (HER2) (Erb-B2 Receptor Tyrosine Kinase 2) at 17q12:17q21.2: ERBB2 (HER2) is a well-known oncogene, a member of the epidermal growth factor receptor (EGFR) family. ERBB2 amplification and overexpression occur in a subset of lung adenocarcinomas and are associated with aggressive disease. Its amplification is a significant driver mutation and a predictive biomarker for targeted therapies in breast cancer and, to a lesser extent, lung cancer GeneCards: ERBB2.
- EIF3E (Eukaryotic Translation Initiation Factor 3 Subunit E) at 8q22.1:8q23.1: EIF3E is a component of the eukaryotic translation initiation factor 3 (eIF3) complex. Dysregulation of eIF3 components, including EIF3E amplification, has been implicated in promoting tumorigenesis by enhancing oncogene translation and cellular proliferation in various cancers, including lung cancer PubMed Search: EIF3E amplification cancer.
- NFASC (Neurofascin) at 1q32.1:1q32.3: NFASC encodes a cell adhesion molecule. While primarily known for its role in nervous system development, altered expression or CNVs of adhesion molecules can impact tumor cell migration and invasion. Further research might be needed to clarify its specific oncogenic role in lung cancer.
- Chromosomal Instability: The presence of multiple, complex CNVs across many chromosomes underscores the genomic instability prevalent in these lung cancer cells. This instability contributes to tumor heterogeneity and can drive resistance to therapy.
Clinical or Translational Implications
The identification of recurrent CNVs, particularly amplifications of known oncogenes like SOX2 and ERBB2, has several clinical implications for lung cancer:
- Diagnostic and Prognostic Biomarkers: These recurrent CNVs, especially SOX2 amplification for LUSC and ERBB2 amplification for lung adenocarcinoma, can serve as diagnostic markers to differentiate tumor subtypes and potentially inform prognosis.
- Therapeutic Targets: ERBB2 (HER2) amplification is an actionable mutation, meaning there are targeted therapies (e.g., trastuzumab deruxtecan) available or under investigation for patients with HER2-amplified lung cancer PubMed Search: HER2 targeted therapy lung cancer. While SOX2 itself is not directly targetable with current small-molecule inhibitors, its amplification can indicate a specific biological subtype that might respond differently to various treatments.
- Tumor Heterogeneity: The sample-to-sample variability in CNV profiles highlights the challenge of tumor heterogeneity, suggesting that a single biopsy might not capture the full genomic landscape of a patient's tumor. This has implications for comprehensive genomic profiling in clinical practice.
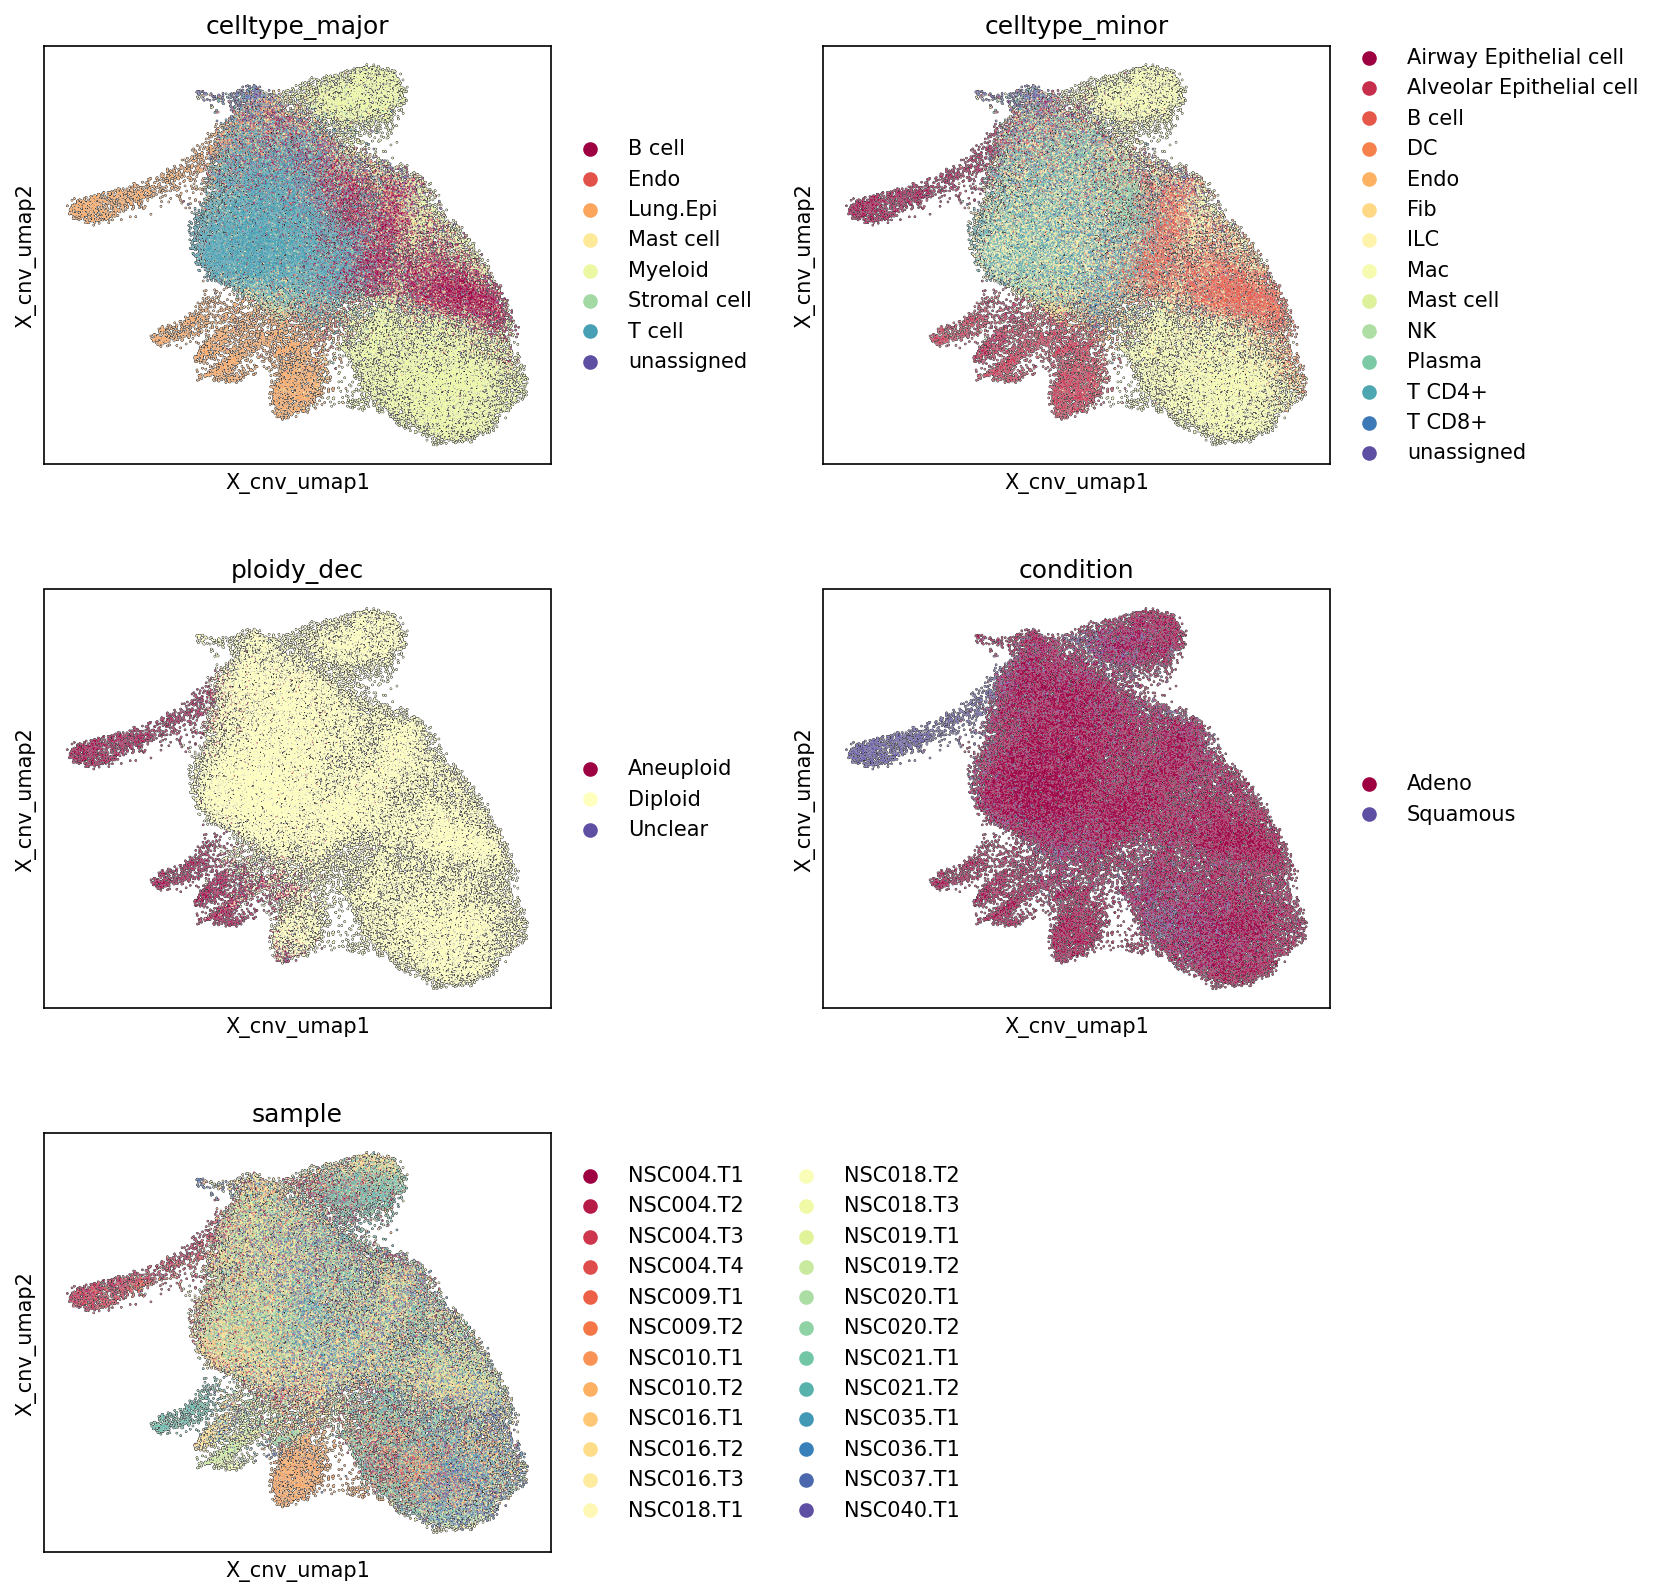
5. UMAP Visualization of CNV Patterns Across Cell Types, Ploidy States, Conditions, and Samples
[Analysis Visualization Results]...
Analysis Overview
This analysis presents five UMAP (Uniform Manifold Approximation and Projection) plots, all derived from CNV (Copy Number Variation) patterns, to visualize the relationships between cells based on their genomic alterations. The UMAPs are colored by different metadata categories: major cell type, minor cell type, ploidy status, disease condition (Adeno vs. Squamous), and individual sample origin. This allows for an assessment of how these biological and technical factors contribute to the observed CNV-driven cellular heterogeneity. The UMAP embedding used cnv: True, indicating that the dimensionality reduction explicitly incorporates CNV features.
Visual Summary
- celltype_major: The UMAP shows distinct clustering of major cell types. "Lung Epithelial cell" (light orange) forms a large, somewhat diffuse cluster, particularly in the upper-right and central regions, extending towards the left. "Myeloid cell" (light green) and "T cell" (light blue) populations are also prominent, occupying distinct regions, primarily within the larger, more dispersed areas. Other cell types like "B cell" (dark red), "Endo" (red), "Mast cell" (yellow), and "Stromal cell" (teal) form smaller, more localized clusters.
- celltype_minor: Provides a more granular view, revealing sub-populations within the major cell types. "Airway Epithelial cell" (dark red) and "Alveolar Epithelial cell" (orange) are largely contained within the "Lung Epithelial cell" major cluster. "Macrophage" (light green) dominates the "Myeloid" region, and "T cell CD8+" (dark blue) and "T cell CD4+" (light blue) form the core of the "T cell" clusters. The overall structure remains consistent with the major cell type map.
- ploidy_dec: This UMAP reveals a striking separation based on ploidy. A highly distinct and concentrated cluster of "Aneuploid" cells (dark red) is clearly visible, primarily on the left side and extending into the center of the UMAP. The vast majority of cells are "Diploid" (light yellow), forming a large, more diffuse cluster that surrounds and partially overlaps with the aneuploid population. A small number of "Unclear" cells (purple) are scattered. This strong separation highlights the distinct genomic signature of aneuploid cells.
- condition: The "Aneuploid" cluster identified in the ploidy_dec map appears to be predominantly composed of "Adeno" (dark red) cells. "Squamous" (dark blue) cells are also present within the aneuploid region but are less abundant and tend to form more scattered smaller clusters. The "Diploid" regions contain a mix of both "Adeno" and "Squamous" cells, with Adeno being more broadly distributed across the UMAP.
- sample: There is a notable degree of sample-specific clustering, indicating heterogeneity across individual patient samples. While some regions show a mix of samples, specific sub-clusters, including parts of the aneuploid population, are enriched for cells from particular samples (e.g., NSC004.T1, NSC018.T2, etc.). This suggests inter-patient variability in tumor characteristics and/or cellular composition.
Biological Interpretation
The UMAPs, explicitly constructed using CNV information, provide a powerful visualization of the genomic landscape of the single-cell data in the context of lung cancer.
- Identification of Tumor Cells by Ploidy: The ploidy_dec UMAP clearly delineates an "Aneuploid" cell population that is spatially distinct from the "Diploid" cells. Given the cnv: True parameter for UMAP embedding and the general understanding that cancer cells often exhibit aneuploidy, this strongly suggests that this distinct aneuploid cluster represents the malignant tumor cell population.
- Tumor Origin from Lung Epithelial Cells: By comparing the ploidy_dec and celltype_major UMAPs, the prominent "Aneuploid" cluster largely overlaps with a significant portion of the "Lung Epithelial cell" population (light orange in celltype_major), especially the cluster extending to the left and center-left. This aligns perfectly with the Resolved tumor-origin cell type being "Lung Epithelial cell", confirming that the aneuploid cells, presumed to be tumor cells, indeed originate from the epithelial compartment of the lung. Other major cell types (Myeloid, T cell, Stromal, Endothelial) mostly reside in the diploid regions, as expected for immune and stromal components of the tumor microenvironment.
- Condition-Specific Distribution of Tumor Cells: The condition UMAP indicates that both "Adeno" (Adenocarcinoma) and "Squamous" (Squamous Cell Carcinoma) conditions contribute to the aneuploid cell population. While "Adeno" cells appear to be more broadly represented and form the dominant component of the main aneuploid cluster, "Squamous" cells are also present, albeit in smaller, potentially more dispersed clusters within the aneuploid region. This observation is consistent with the presence of both cancer types in the dataset and suggests that both can exhibit aneuploidy.
- Inter-Sample Heterogeneity: The sample UMAP highlights considerable sample-to-sample variation. Even within the aneuploid cluster, cells from different samples contribute, though some samples might show more localized contributions. This emphasizes the biological heterogeneity between individual patients, which is a common characteristic of cancer, reflecting different genetic backgrounds, tumor evolution, and microenvironment compositions.
Annotation Notes
- The clear separation of aneuploid cells based on CNV patterns validates the ploidy_dec annotations and the effectiveness of using CNVs for tumor cell identification.
- The alignment of the aneuploid population with the "Lung Epithelial cell" type further reinforces the accuracy of the cell type annotation for tumor cells and their biological origin.
- The embedding, being CNV-driven, effectively clusters cells based on their genomic stability, providing a robust foundation for downstream analyses related to tumor evolution or microenvironment interactions.
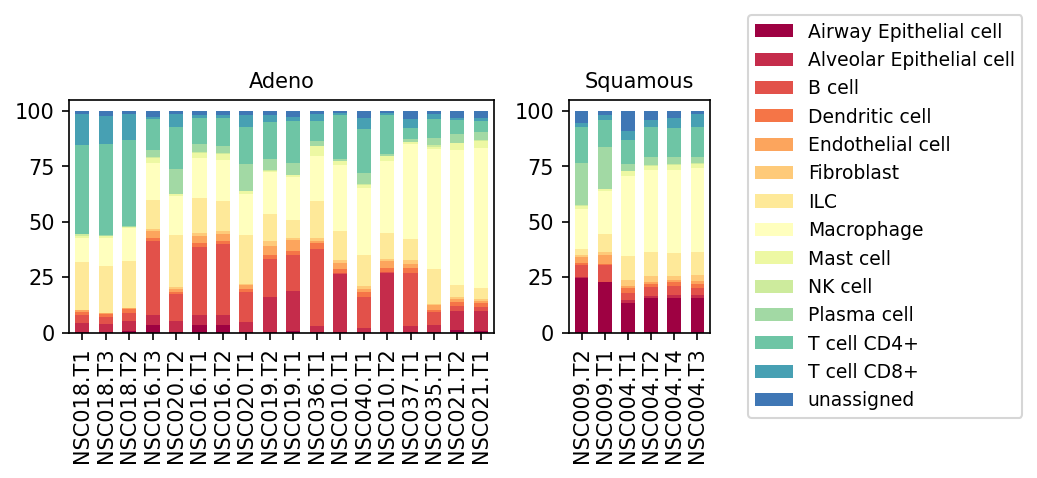
6. Minor Cell Type Population Analysis in Lung Adenocarcinoma and Squamous Cell Carcinoma
[Analysis Visualization Results]...
Analysis Overview
This analysis presents a population bar plot illustrating the relative abundance of different minor cell types within individual samples from lung adenocarcinoma (Adeno) and lung squamous cell carcinoma (Squamous) cohorts. Each bar represents a single sample, with stacked segments showing the percentage contribution of various minor cell types. This visualization helps in understanding the cellular composition and heterogeneity of the tumor microenvironment (TME) across different lung cancer histologies and individual patients.
Visual Summary
The plot displays two main panels: "Adeno" (left) and "Squamous" (right), each representing the cell type composition for multiple patient samples.
- Overall Composition: Both Adeno and Squamous samples exhibit a complex cellular landscape, including various epithelial, stromal, and immune cell populations.
Prominent Cell Types:
- Epithelial Cells: Airway Epithelial cells (dark red) and Alveolar Epithelial cells (red) constitute a significant proportion in many samples, as expected, given that these are epithelial-derived cancers and the 'Resolved tumor-origin cell type' is 'Lung Epithelial cell'. Airway Epithelial cells appear particularly prominent in Squamous samples.
- Stromal Cells: Fibroblasts (light orange) are consistently present across most samples in both conditions, often representing a substantial fraction. Endothelial cells (light orange) are also observed.
- Immune Cells: Macrophages (light yellow) are a ubiquitous and often abundant immune cell type. Plasma cells (light green) and T cells (CD4+ in teal, CD8+ in blue-green) are also observed, indicating varying degrees of immune infiltration. Other immune cells like B cells, Dendritic cells, ILC, Mast cells, and NK cells are present in smaller proportions.
- Heterogeneity within Conditions: There is notable sample-to-sample variability in cell type proportions within both the Adeno and Squamous cohorts. For instance, some Adeno samples (e.g., NSC016.T1, NSC019.T2) show a very high proportion of epithelial cells, while others (e.g., NSC018.T1, NSC018.T2) exhibit a more balanced mix with higher immune cell components.
Differences between Conditions (Adeno vs. Squamous):
- While both conditions are heterogeneous, Squamous samples generally appear to have a more prominent Airway Epithelial cell component compared to Alveolar Epithelial cells, which is biologically consistent with the origins of these cancers.
- The overall balance of immune and stromal cells relative to epithelial cells seems to vary, although no clear trend emerges without statistical comparison.
- Unassigned Cells: A small proportion of cells are labeled as "unassigned" (dark blue) in most samples, indicating cells that could not be confidently classified into specific minor cell types.
Biological Interpretation
The observed cell population profiles provide insights into the distinct and shared features of the tumor microenvironment (TME) in lung adenocarcinoma and squamous cell carcinoma.
- Tumor Cell Dominance: The significant presence of Airway and Alveolar Epithelial cells in the samples is expected, as these are the cell types from which lung carcinomas originate. The high proportion of these epithelial cells in certain samples might reflect high tumor purity or proliferative activity. The distinction between Airway and Alveolar epithelial cell proportions aligns with the known histopathological differences, where Squamous Cell Carcinoma typically originates from bronchial basal/airway epithelial cells, and Adenocarcinoma often from alveolar type 2 cells or club cells.
- Immune Infiltration: The presence of various immune cell types, including Macrophages, T cells (CD4+ and CD8+), Plasma cells, B cells, and NK cells, highlights the active immune response within the TME of both cancer types.
- Macrophages: Macrophages are frequently associated with tumor progression, angiogenesis, and immune suppression in the TME (often termed Tumor-Associated Macrophages or TAMs), making their high abundance significant [PubMed search: Tumor associated macrophages lung cancer].
- T cells: The presence of both CD4+ and CD8+ T cells suggests an ongoing adaptive immune response, which can be either anti-tumorigenic (e.g., cytotoxic CD8+ T cells) or pro-tumorigenic (e.g., some regulatory T cell subsets within CD4+ T cells or exhausted T cells). The heterogeneity in T cell proportions across samples suggests variable immune infiltration and potential differences in immune checkpoint blockade responsiveness.
- Plasma cells: The presence of Plasma cells indicates a local humoral immune response within the tumor.
- Stromal Components: The consistent presence of Fibroblasts and Endothelial cells underscores their crucial role in shaping the TME. Fibroblasts, often differentiating into Cancer-Associated Fibroblasts (CAFs), contribute to extracellular matrix remodeling, angiogenesis, and immune modulation, fostering tumor growth and metastasis [GeneCards: FAP]. Endothelial cells are essential for tumor vascularization and nutrient supply.
- Inter-sample Heterogeneity: The significant variability in cell type proportions among individual patient samples within both Adeno and Squamous groups emphasizes the highly personalized nature of the TME. This heterogeneity can impact disease progression and response to therapies.
Clinical or Translational Implications
Understanding the cellular composition of the TME at single-cell resolution has several clinical and translational implications for lung cancer:
- Biomarker Discovery: Distinct cellular compositions could serve as prognostic or predictive biomarkers for patient stratification. For example, a higher proportion of specific immune suppressive cells (e.g., certain macrophage subtypes or regulatory T cells, which are part of the 'Macrophage' and 'T cell CD4+' minor cell types shown here) might predict resistance to immunotherapy, while an abundance of cytotoxic T cells might indicate a better response [PubMed search: TME biomarkers lung cancer immunotherapy].
- Targeted Therapies: Identifying prevalent stromal or immune cell populations can highlight potential therapeutic targets beyond direct targeting of cancer cells. For instance, modulating CAF activity or re-educating TAMs could be viable strategies to enhance anti-tumor immunity or overcome therapeutic resistance [PubMed search: CAF targeting lung cancer].
- Disease Subtyping: The observed differences in epithelial cell subtypes (Airway vs. Alveolar) between Squamous and Adeno reinforce the distinct biological underpinnings of these histologies. A deeper dive into these epithelial populations could reveal specific tumor-intrinsic vulnerabilities.
- Monitoring Treatment Response: Changes in cell type proportions over time (e.g., after therapy) could serve as dynamic indicators of treatment efficacy or acquired resistance. A favorable response to immunotherapy, for example, might be accompanied by an increase in effector immune cells and a decrease in suppressive populations.
7. T Cell Subset Population Analysis in Lung Adenocarcinoma and Squamous Cell Carcinoma
[Analysis Visualization Results]...
Analysis Overview
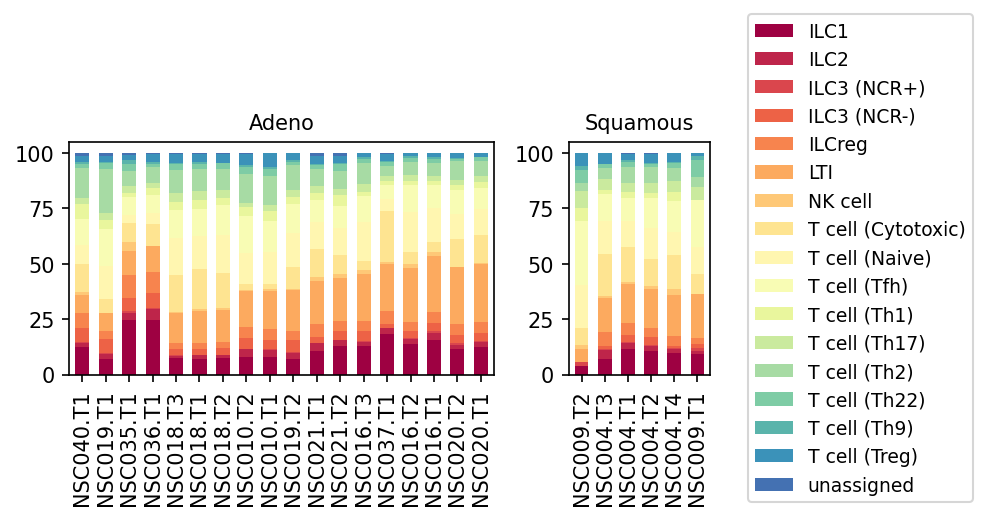
This analysis presents a population bar plot illustrating the relative proportions of various lymphoid cell subsets within the celltype_major 'T cell' compartment, across individual samples from patients diagnosed with Lung Adenocarcinoma (Adeno) and Squamous Cell Carcinoma (Squamous). The celltype_major 'T cell' population in this context encompasses a broader range of lymphocytes, including conventional T cells (e.g., Cytotoxic, Naive, Th subsets, Treg), Natural Killer (NK) cells, and Innate Lymphoid Cells (ILCs such as ILC1, ILC2, ILC3, ILCreg, and LTI). This visualization allows for a comparison of the immune cell landscape within the 'T cell' major population between the two distinct lung cancer conditions at a single-cell resolution.
Visual Summary
The stacked bar plots display the proportional representation of 17 distinct lymphoid subsets across multiple individual samples for both Adenocarcinoma (Adeno, 18 samples) and Squamous Cell Carcinoma (Squamous, 6 samples).
- Overall Composition: In both conditions, conventional T cell subsets such as T cell (Cytotoxic), T cell (Naive), T cell (Tfh), and T cell (Th1) consistently form a significant portion of the total lymphoid population represented. Innate Lymphoid Cells (ILC1, ILC2, ILC3 (NCR+), ILC3 (NCR-), ILCreg, LTI) and NK cells also contribute to the overall composition. T cell (Treg) populations are present but generally constitute a smaller fraction across all samples.
Comparison between Adeno and Squamous:
- Adenocarcinoma Samples: A notable feature in Adeno samples is the generally higher relative proportion of Innate Lymphoid Cells (ILCs, including ILC1, ILC2, ILC3, ILCreg, LTI) and NK cells. In many Adeno samples (e.g., NSC036.T1, NSC018.T1, NSC010.T1, NSC019.T2), these innate lymphocytes collectively account for approximately 40% to 60% of the represented population. The distribution of subsets within Adeno samples shows considerable heterogeneity, indicating diverse immune microenvironments among individual patients.
- Squamous Cell Carcinoma Samples: In contrast, Squamous samples generally exhibit a relatively lower contribution from ILCs and NK cells. Instead, conventional T cell subsets, particularly T cell (Cytotoxic) and T cell (Naive), appear to comprise a larger proportion of the overall lymphoid compartment shown. The subset distribution in Squamous samples appears somewhat more consistent across individuals compared to Adeno, with T cell (Cytotoxic) often being a dominant component.
- Minor Subsets: T cell (Th17), T cell (Th2), T cell (Th22), T cell (Th9), and T cell (Treg) are present in smaller proportions in both conditions, without a visually striking difference between Adeno and Squamous, although detailed quantitative analysis would be needed for definitive conclusions.
Biological Interpretation
The distinct lymphoid cell subset compositions observed between Lung Adenocarcinoma and Squamous Cell Carcinoma suggest differences in their tumor immune microenvironments, which could profoundly influence tumor progression and response to therapy.
- Distinct Immune Milieux: The relative enrichment of ILCs and NK cells within the broader 'T cell' major population in Adenocarcinoma samples points towards a potentially more pronounced role for innate immune responses or regulatory mechanisms. ILCs are diverse and rapidly respond to local signals, playing roles in tissue homeostasis, inflammation, and anti-tumor immunity, often by orchestrating adaptive immune responses [1]. NK cells are crucial for direct tumor cell lysis and cytokine secretion. The higher prevalence of these innate cells might indicate a specific type of inflammatory or immunosuppressive environment in Adeno, depending on the specific ILC subsets involved.
- Adaptive vs. Innate Dominance: Conversely, the relatively higher proportion of conventional T cell subsets, especially T cell (Cytotoxic) and T cell (Naive), in Squamous Cell Carcinoma samples suggests a greater reliance on adaptive, antigen-specific T cell responses. Cytotoxic T cells are primary effectors in anti-tumor immunity by directly killing cancer cells [2]. The presence of naive T cells could signify ongoing immune cell recruitment into the tumor site or less extensive immune exhaustion compared to more differentiated effector subsets. These differences might reflect distinct oncogenic pathways or exposure to different environmental factors influencing immune cell infiltration and activation in the two cancer types.
Clinical or Translational Implications
These findings hold significant implications for understanding lung cancer immunology and for guiding therapeutic strategies.
- Immunotherapy Stratification: The observed differences in lymphoid cell populations between Adenocarcinoma and Squamous Cell Carcinoma could influence patient responses to existing immunotherapies, particularly immune checkpoint inhibitors. Tumors with a higher proportion of cytotoxic T cells might be more responsive, whereas tumors dominated by certain ILCs might require different or combinatorial approaches.
- Biomarker Discovery: The specific profiles of ILCs and T cell subsets could serve as potential biomarkers for classifying lung cancer immune subtypes, predicting prognosis, or forecasting response to specific treatments. For instance, the ratio of specific ILCs to cytotoxic T cells might have prognostic value.
- Targeted Immunomodulation: A deeper understanding of these immune disparities can inform the development of novel, subtype-specific immunotherapies. For Adenocarcinoma, strategies targeting or modulating ILC function might be particularly effective, while for Squamous Cell Carcinoma, approaches aimed at enhancing or sustaining conventional T cell anti-tumor activity might be prioritized.
---
References:
- Innate Lymphoid Cells: A search on PubMed for "innate lymphoid cells cancer immunity" provides extensive literature. For example, a general overview can be found via: https://pubmed.ncbi.nlm.nih.com/?term=innate+lymphoid+cells+cancer+immunity&filter=pubmed.2023
- Cytotoxic T Cells: For information on cytotoxic T cells in cancer, a PubMed search for "cytotoxic T cells cancer" is helpful: https://pubmed.ncbi.nlm.nih.com/?term=cytotoxic+T+cells+cancer&filter=pubmed.2023
8. Differential T Cell and Lymphoid Subset Proportions in Lung Adenocarcinoma vs. Squamous Cell Carcinoma
[Analysis Visualization Results]...
Analysis Overview
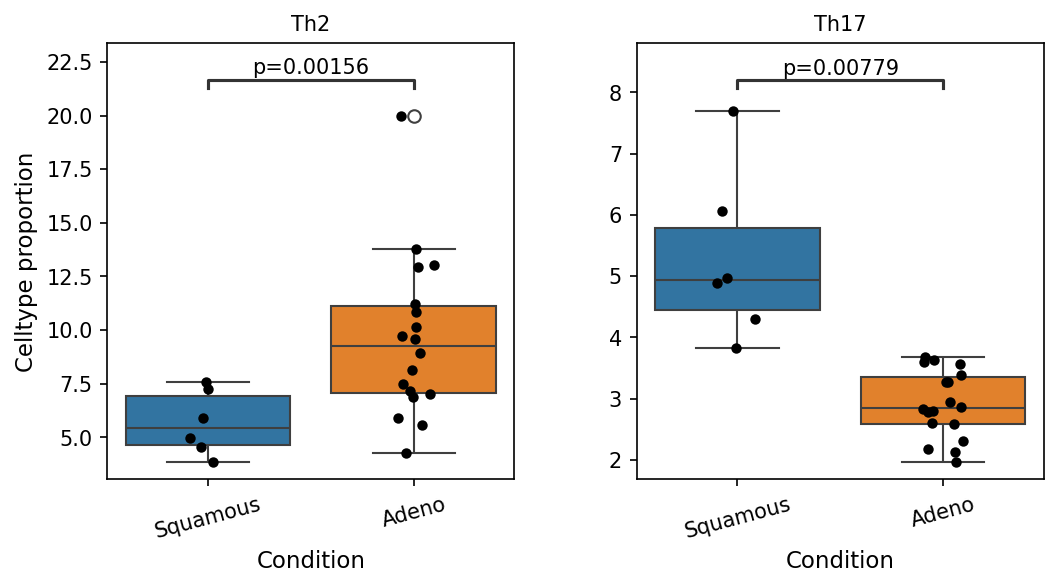
This analysis investigates the differences in the proportions of various T cell and related innate lymphoid cell (ILC) subsets between two distinct lung cancer conditions: Squamous Cell Carcinoma (Squamous) and Adenocarcinoma (Adeno). Using single-cell RNA-seq data, the relative abundance of specific lymphoid populations within each sample was quantified, and statistically significant differences between the two conditions were identified and visualized using box plots. The statistical significance was determined using a p-value cutoff of 0.1, as per the analysis parameters.
Visual Summary
The box plots display the cell type proportion for five distinct lymphoid subsets that show statistically significant differences between Squamous and Adeno conditions. Each plot includes individual data points (black dots) along with the box plot representation (median, interquartile range, and whiskers).
- Th2 cells: The proportion of Th2 cells is significantly higher in Adenocarcinoma (Adeno) compared to Squamous Cell Carcinoma (Squamous) (p=0.00156). The median proportion for Th2 cells is approximately 9% in Adeno versus approximately 6% in Squamous. One outlier in the Adeno group shows a particularly high proportion exceeding 20%.
- Th17 cells: Conversely, Th17 cell proportions are significantly higher in Squamous Cell Carcinoma compared to Adenocarcinoma (p=0.00779). The median Th17 proportion is around 5% in Squamous versus approximately 3% in Adeno.
- unassigned cells: An "unassigned" cell population, likely representing T cells or other lymphocytes that could not be classified into more specific subsets, is significantly more abundant in Adenocarcinoma compared to Squamous Cell Carcinoma (p=0.00932). The median proportion in Adeno is around 0.25-0.3%, with a wider spread and several samples showing proportions above 1%, whereas Squamous samples generally remain below 0.4%.
- ILC3(-): The proportion of NCR-negative Group 3 Innate Lymphoid Cells (ILC3(-)) is significantly elevated in Adenocarcinoma compared to Squamous Cell Carcinoma (p=0.00969). The median proportion is approximately 4% in Adeno versus around 1.5% in Squamous.
- ILC1: Group 1 Innate Lymphoid Cells (ILC1) show a marginally higher proportion in Adenocarcinoma compared to Squamous Cell Carcinoma (p=0.0519). The median proportion is around 12% in Adeno versus approximately 9% in Squamous.
Biological Interpretation
These findings reveal distinct immunological landscapes within the tumor microenvironment of lung Adenocarcinoma and Squamous Cell Carcinoma, focusing on specific T cell and ILC subsets.
- Th2-skewed immunity in Adenocarcinoma: The increased proportion of Th2 cells in Adenocarcinoma suggests a shift towards a type 2 immune response. Th2 cells are typically associated with allergic reactions and humoral immunity, but in cancer, their cytokines (e.g., IL-4, IL-13) can promote tumor growth, angiogenesis, and immune suppression by inhibiting Th1-mediated anti-tumor responses and promoting M2 macrophage polarization [PubMed search: Th2 cells lung cancer progression]. This Th2 bias in Adeno could contribute to a more immune-evasive phenotype.
- Elevated Th17 cells in Squamous Cell Carcinoma: The higher abundance of Th17 cells in Squamous Cell Carcinoma points to a different inflammatory milieu. Th17 cells, known for producing IL-17, have a dual role in cancer; they can either promote tumor growth by inducing inflammation and angiogenesis or exert anti-tumor effects by recruiting other immune cells [PubMed search: Th17 cells lung squamous carcinoma]. In the context of Squamous Cell Carcinoma, this could signify a particular type of chronic inflammation that might be either beneficial or detrimental depending on other immune components.
- ILC3(-) and ILC1 in Adenocarcinoma: The elevated ILC3(-) cells in Adenocarcinoma further support a pro-inflammatory environment potentially conducive to tumor progression. ILC3s, particularly NCR-negative subsets, are known for producing IL-17 and IL-22, playing roles in tissue repair, inflammation, and sometimes promoting tumor growth by shaping the stromal compartment and recruiting myeloid cells [PubMed search: ILC3 lung cancer]. The marginal increase in ILC1s, which typically produce IFN-gamma and are associated with anti-tumor responses, presents a complex picture. It could represent a compensatory anti-tumor effort or a distinct ILC1 subtype with different functionalities within the Adeno microenvironment.
- "Unassigned" populations: The higher proportion of "unassigned" lymphoid cells in Adenocarcinoma warrants further investigation. This could represent novel, uncharacterized T cell or ILC states, or cells undergoing significant phenotypic changes within the tumor microenvironment that defy standard classification. Their increased presence suggests greater cellular heterogeneity or unique immune responses in Adeno compared to Squamous.
Collectively, these distinct profiles highlight fundamental differences in how the immune system interacts with and is modulated by these two common lung cancer subtypes. Adenocarcinoma appears to be characterized by a potentially more immune-suppressive (Th2-skewed) and pro-inflammatory (ILC3(-)) environment, whereas Squamous Cell Carcinoma presents with a more pronounced Th17-mediated inflammatory response.
Clinical or Translational Implications
The observed differences in lymphoid subset proportions between lung Adenocarcinoma and Squamous Cell Carcinoma have significant clinical and translational implications:
- Prognostic Biomarkers: These specific T cell and ILC subset proportions could serve as prognostic biomarkers, potentially indicating disease aggressiveness or recurrence risk in either Adenocarcinoma or Squamous Cell Carcinoma patients.
- Differential Immunotherapy Response: The distinct immune landscapes suggest that patients with Adenocarcinoma and Squamous Cell Carcinoma might respond differently to various immunotherapeutic approaches. For instance, therapies targeting Th2 or ILC3 pathways might be more effective in Adenocarcinoma, while strategies modulating Th17 responses could be more relevant for Squamous Cell Carcinoma.
- Targeted Therapeutic Development: Understanding these immune cell shifts can inform the development of novel, subtype-specific immunotherapies. For example, strategies to counteract Th2-mediated suppression in Adeno or to steer Th17 responses towards an anti-tumor phenotype in Squamous could be explored.
- Monitoring Disease Progression: Changes in these specific cell populations could potentially be monitored during treatment to assess therapeutic efficacy or detect early signs of resistance.
- Understanding Cancer Biology: These findings contribute to a deeper understanding of the distinct pathogenic mechanisms and immune evasion strategies employed by different histological subtypes of lung cancer.
9. Macrophage Subset Composition in Lung Adenocarcinoma and Squamous Cell Carcinoma
[Analysis Visualization Results]...
Analysis Overview
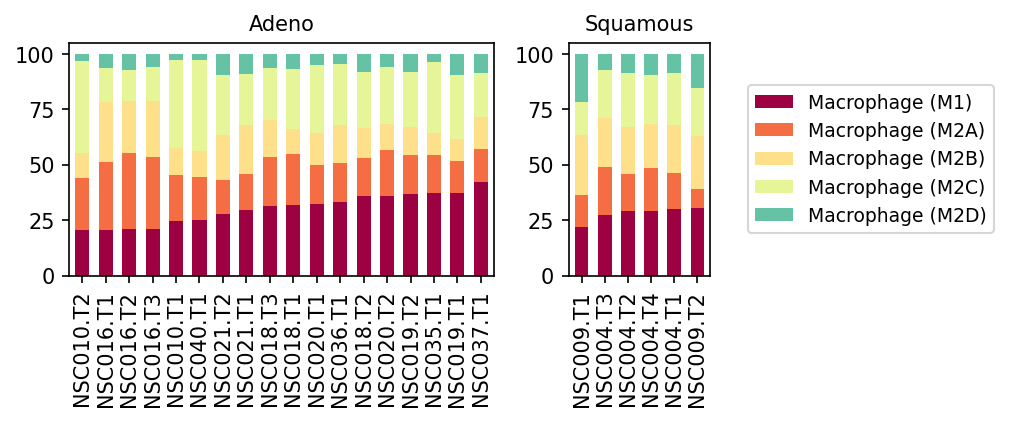
This analysis presents a population bar plot illustrating the relative proportions of different macrophage subsets (M1, M2A, M2B, M2C, M2D) within the overall macrophage population across individual patient samples. The data is stratified by two lung cancer conditions: Adenocarcinoma (Adeno) and Squamous Cell Carcinoma (Squamous). Each bar represents a single sample, and the stacked segments show the percentage contribution of each macrophage subset to the total macrophages identified in that sample. This visualization provides insight into the heterogeneity and potential polarization states of macrophages within the tumor microenvironment of different lung cancer types.
Visual Summary
The plot consists of two panels, one for Adeno samples and one for Squamous samples, each displaying multiple stacked bar charts.
- Macrophage Subsets: Five distinct macrophage subsets are identified and colored: Macrophage (M1) in dark red, Macrophage (M2A) in orange, Macrophage (M2B) in light yellow, Macrophage (M2C) in pale yellow/light green, and Macrophage (M2D) in turquoise.
- Dominant Subsets: In both Adeno and Squamous conditions, Macrophage (M1) and Macrophage (M2A) collectively constitute the largest proportions of the total macrophage population across most samples. M1 macrophages are typically found at the base of the stacks, indicating their significant presence. M2A macrophages consistently form a substantial layer above M1.
- M2 Heterogeneity: The M2 spectrum (M2A, M2B, M2C, M2D) shows varying contributions. M2B is a consistent component, albeit generally in smaller proportions than M1 or M2A. M2C and M2D subsets are present in most samples but typically represent smaller fractions of the total macrophage population. M2D generally appears to be the least abundant subset.
- Sample-to-Sample Variability: There is notable heterogeneity in the exact proportions of each macrophage subset across individual samples within both the Adeno and Squamous groups. For example, some Adeno samples show a relatively higher M1 component (e.g., NSC019.T1), while others display a larger M2A fraction (e.g., NSC020.T2). Similar variability is observed in Squamous samples.
- Condition-Specific Trends: While both conditions exhibit a mixed population of M1 and various M2 subsets, the visual inspection does not immediately reveal a stark, consistent difference in the overall M1/M2 balance between Adeno and Squamous samples at a global level, although subtle distinctions may exist. Both conditions are characterized by a significant presence of M1 and M2A macrophages.
Biological Interpretation
Macrophages are critical immune cells within the tumor microenvironment (TME), playing dual roles in cancer progression. They are broadly categorized into M1-like (classically activated) and M2-like (alternatively activated) phenotypes, with the M2 category being further diversified.
- M1 Macrophages: These are typically pro-inflammatory and anti-tumorigenic, promoting immune responses against cancer cells by producing pro-inflammatory cytokines and mediating direct cytotoxicity. Their presence suggests an ongoing, albeit potentially insufficient, anti-tumor immune activity [PubMed search: M1 macrophage anti-tumor function].
- M2 Macrophages: These are generally considered pro-tumorigenic, contributing to immune suppression, angiogenesis, tumor growth, and metastasis. The M2 spectrum is diverse:
- M2A (alternatively activated): Often associated with allergic reactions, parasitic infections, and wound healing. In cancer, they can promote fibrosis and tumor progression.
- M2B (immunoregulatory): Involved in immune regulation, responding to immune complexes and Toll-like receptor agonists.
- M2C (deactivated): Associated with immune suppression, tissue remodeling, and efferocytosis, often seen in advanced tumors.
- M2D (tumor-associated macrophage-like): Frequently induced by hypoxia and adenosine, promoting angiogenesis and immune evasion. This subtype is often considered a key component of tumor-associated macrophages (TAMs) [GeneCards: CD163 (M2 marker), iNOS (M1 marker)].
The findings indicate that both lung adenocarcinoma and squamous cell carcinoma are characterized by a complex and heterogeneous macrophage landscape. The substantial presence of both M1 and various M2 subsets, particularly M2A, suggests a dynamic interplay of pro-inflammatory and immunosuppressive signals within the TME. The considerable proportion of M2-like macrophages collectively points towards an environment that may favor tumor growth, immune evasion, and tissue remodeling in both cancer types. The observed sample-to-sample variability highlights the intrinsic diversity of the immune response even within the same cancer subtype, suggesting that macrophage polarization can be highly individualized.
Clinical or Translational Implications
- Therapeutic Targeting of TAMs: The presence of a significant proportion of M2-like macrophages, which are often pro-tumorigenic, suggests that therapeutic strategies aimed at repolarizing M2 macrophages to an M1 phenotype or selectively depleting M2 populations could be beneficial in lung cancer. Such strategies are actively being investigated in cancer immunology [PubMed search: targeting tumor associated macrophages lung cancer therapy].
- Biomarker Potential: The specific composition and ratio of M1 to M2 macrophage subsets could potentially serve as prognostic or predictive biomarkers for patient outcomes, disease progression, or response to immunotherapy. For instance, a higher M1/M2 ratio might correlate with better prognosis or response to immune checkpoint blockade [PubMed search: M1 M2 ratio cancer prognosis].
- Personalized Medicine: The significant sample-to-sample heterogeneity observed underscores the importance of personalized approaches in oncology. Understanding the specific macrophage subset profiles in individual patients could guide more tailored immunotherapeutic interventions.
- Immune Microenvironment Context: The co-existence of M1 and M2 populations highlights the complexity of the lung cancer TME. Future studies could explore the spatial distribution of these subsets and their interactions with other immune and stromal cells to uncover more precise therapeutic targets.
10. Differential Macrophage Subset Proportions in Lung Adenocarcinoma and Squamous Cell Carcinoma
[Analysis Visualization Results]...
Analysis Overview
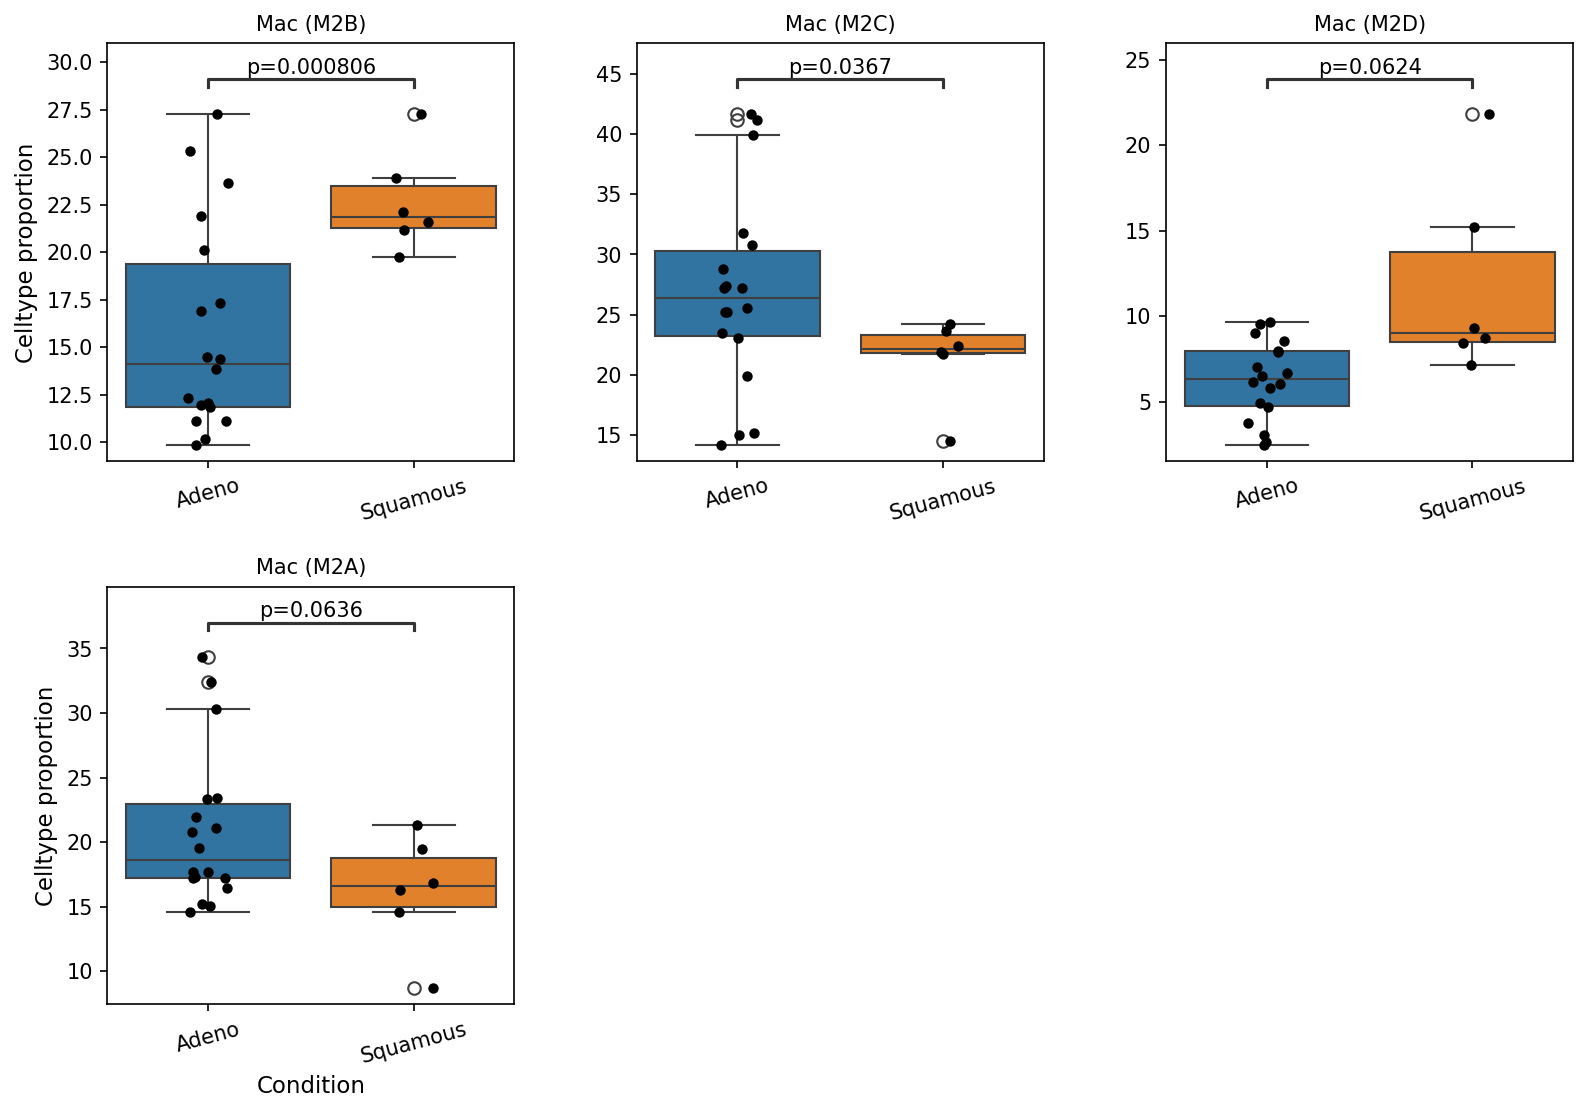
This analysis presents box plots illustrating the cell type proportions of specific macrophage subsets (M2A, M2B, M2C, M2D) within the lung tissue. These proportions are compared between two major lung cancer conditions: Adenocarcinoma (Adeno) and Squamous Cell Carcinoma (Squamous). The goal is to identify macrophage subsets that exhibit statistically significant differences in their representation between these two cancer types.
Visual Summary
The box plots reveal distinct differences in the proportions of various macrophage M2 subsets between Adenocarcinoma and Squamous Cell Carcinoma conditions:
- Macrophage (M2B): This subset shows a significantly higher proportion in Squamous Cell Carcinoma compared to Adenocarcinoma (p = 0.000806), indicating a strong enrichment in the squamous subtype.
- Macrophage (M2C): Conversely, Mac (M2C) exhibits a significantly higher proportion in Adenocarcinoma compared to Squamous Cell Carcinoma (p = 0.0367).
- Macrophage (M2D): There is a notable trend towards a higher proportion of Mac (M2D) in Squamous Cell Carcinoma relative to Adenocarcinoma (p = 0.0624), reaching statistical significance based on the applied cutoff of p < 0.1.
- Macrophage (M2A): Similarly, Mac (M2A) shows a trend of higher proportion in Adenocarcinoma compared to Squamous Cell Carcinoma (p = 0.0636), also meeting the significance threshold.
All four macrophage subsets evaluated displayed statistically significant differences in their proportions between the two lung cancer conditions.
Biological Interpretation
Macrophages are integral components of the tumor microenvironment (TME) and are often categorized into M1 (pro-inflammatory, anti-tumor) and M2 (anti-inflammatory, pro-tumor) phenotypes. The subsets analyzed here (M2A, M2B, M2C, M2D) are all considered M2-like macrophages, known for their roles in immune suppression, angiogenesis, tissue remodeling, and promoting tumor growth and metastasis.
The observed differential enrichment of these M2 macrophage subsets suggests distinct immunological landscapes within Adenocarcinoma and Squamous Cell Carcinoma, consistent with the known heterogeneity of these lung cancer subtypes.
- Enrichment of Mac (M2B) and Mac (M2D) in Squamous Cell Carcinoma: M2B macrophages are often associated with regulatory and inflammatory responses, while M2D macrophages are linked to tumor progression and angiogenesis. Their increased presence in Squamous Cell Carcinoma could signify a microenvironment that is more conducive to tumor development through specific immune suppressive or pro-angiogenic mechanisms compared to Adenocarcinoma. This might reflect a stronger reliance on these specific M2 pathways in LUSC.
- Enrichment of Mac (M2A) and Mac (M2C) in Adenocarcinoma: M2A macrophages are typically involved in tissue repair and immune evasion, while M2C macrophages are highly immunosuppressive, promoting tumor progression and metastasis. The higher proportions of these subsets in Adenocarcinoma suggest that the TME of this subtype may be characterized by distinct immune evasion strategies and a greater emphasis on immunosuppressive mechanisms driven by M2A and M2C populations. This aligns with findings that LUAD often exhibits different immune evasion mechanisms compared to LUSC.
These findings highlight that while both cancer types may leverage M2 macrophage functions for tumor progression, they might do so by selectively promoting different M2-like populations. This specificity could arise from unique genetic alterations, stromal components, or inflammatory cues characteristic of each histological subtype.
Clinical or Translational Implications
The differential distribution of macrophage M2 subsets between lung Adenocarcinoma and Squamous Cell Carcinoma has several potential clinical and translational implications:
- Biomarker Potential: The distinct profiles of macrophage M2 subsets could serve as prognostic biomarkers, potentially predicting disease aggressiveness or patient outcomes specific to each lung cancer subtype.
- Personalized Immunotherapy: Understanding the specific M2 macrophage populations enriched in each cancer type could guide the development of more targeted and effective immunotherapeutic strategies. For instance, therapies aimed at repolarizing or depleting M2B/M2D macrophages might be more effective in Squamous Cell Carcinoma, while strategies targeting M2A/M2C might show greater efficacy in Adenocarcinoma. This subtype-specific targeting could enhance therapeutic responses and reduce off-target effects.
- Drug Development: These findings could inform the discovery of novel therapeutic targets specific to the pathways that drive the recruitment, differentiation, or activation of particular M2 macrophage subsets in Adenocarcinoma or Squamous Cell Carcinoma.
- Monitoring Treatment Response: Changes in the proportions of these macrophage subsets could potentially be monitored during treatment to assess therapeutic efficacy and predict response to immune checkpoint inhibitors or other immunomodulatory agents.
11. Ploidy Distribution in Lung Epithelial Tumor Cells by Cancer Subtype
[Analysis Visualization Results]...
Analysis Overview
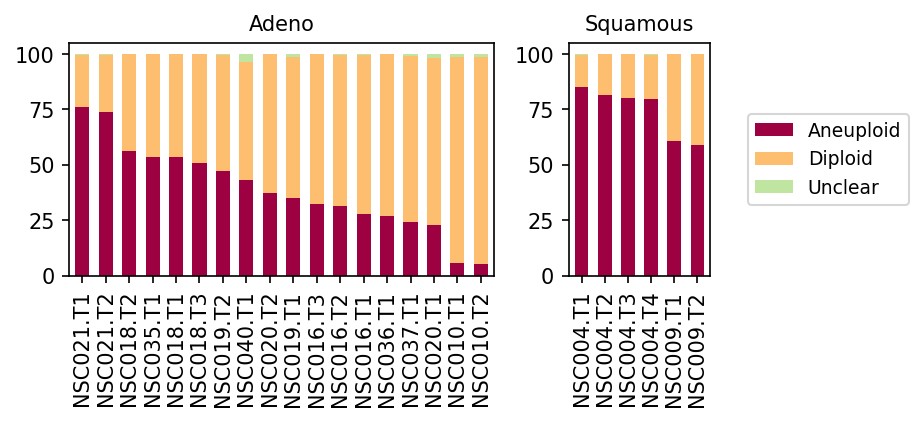
This analysis investigates the ploidy status (Aneuploid, Diploid, and Unclear) within "Lung Epithelial cell" populations, which have been identified as tumor-origin cells. The distribution is presented for individual patient samples, stratified by lung cancer histology: Adenocarcinoma (Adeno) and Squamous Cell Carcinoma (Squamous). This visualization provides insight into the genomic stability and heterogeneity of the presumed tumor cell compartment across different patients and cancer subtypes.
Visual Summary
The stacked bar charts illustrate the proportions of aneuploid, diploid, and unclear cells within the Lung Epithelial cell population for each sample.
- Adeno Samples: A significant range of aneuploidy is observed across Adenocarcinoma samples. Some samples, such as NSC021.T1, NSC018.T2, and NSC035.T1, show a high proportion of aneuploid cells, exceeding 50% and reaching up to approximately 75%. In contrast, other Adeno samples, notably NSC010.T1 and NSC010.T2, display a much lower percentage of aneuploid cells, around 5-10%, with the majority being diploid. The 'Unclear' cell population is consistently minimal or absent across all Adeno samples.
- Squamous Samples: Squamous Cell Carcinoma samples generally exhibit a consistently high proportion of aneuploid cells. Samples like NSC004.T1, NSC004.T2, NSC004.T3, and NSC004.T4 show over 80% aneuploid cells. NSC009.T1 and NSC009.T2 also demonstrate a substantial aneuploid fraction, around 60%. Similar to Adeno, the 'Unclear' population in Squamous samples is very small or not detected.
Biological Interpretation
Aneuploidy, defined as an abnormal number of chromosomes, is a well-established hallmark of cancer and contributes to genomic instability, a key driver of tumor evolution 1. The high prevalence of aneuploid cells within the "Lung Epithelial cell" population strongly supports their designation as tumor-origin cells, aligning with the pre-computed Resolved tumor-origin cell type.
- Tumor Cell Identification: The presence of a significant aneuploid population serves as a robust indicator for identifying malignant epithelial cells from benign ones, as normal somatic cells are typically diploid.
- Inter-sample Heterogeneity in Adenocarcinoma: The marked variability in aneuploid cell proportions among Adenocarcinoma samples suggests considerable biological and genomic heterogeneity across patients. This could reflect differences in tumor purity within the collected samples (i.e., varying contamination with normal epithelial cells), diverse stages of tumor progression, or varying degrees of genomic instability inherent to different Adeno subtypes. Samples with very low aneuploidy might represent cases with a smaller tumor burden in the analyzed epithelial compartment or less extensive genomic alterations.
- High and Consistent Aneuploidy in Squamous Cell Carcinoma: The consistently high proportion of aneuploid cells across most Squamous Cell Carcinoma samples indicates a more uniform and pervasive genomic instability in this subtype within the analyzed cohort. This finding is consistent with the generally higher genomic complexity and more aggressive nature often associated with Lung Squamous Cell Carcinoma compared to some Adenocarcinoma subtypes 2.
Clinical or Translational Implications
The insights from ploidy analysis of tumor-origin cells can have several clinical and translational implications:
- Biomarker for Tumor Burden and Genomic Instability: The percentage of aneuploid cells within the epithelial compartment could serve as a quantitative biomarker reflecting tumor burden or the degree of genomic instability. High aneuploidy is often correlated with more aggressive disease behavior and potentially poorer prognosis in various cancers 3.
- Patient Stratification and Therapeutic Guidance: The distinct patterns of aneuploidy between Adeno and Squamous types, and the heterogeneity within Adeno, suggest that ploidy status could be valuable for patient stratification. For instance, patients with high aneuploidy might be more responsive to therapies targeting DNA damage response pathways, mitotic checkpoints, or polyploidy, which are often dysregulated in aneuploid cells 4. Conversely, high aneuploidy can also drive intra-tumor heterogeneity, potentially leading to treatment resistance.
- Understanding Treatment Response: Monitoring ploidy changes after therapy could offer insights into treatment effectiveness and the evolution of resistant clones.
---
References:
- Thompson, S. L., & Pellman, D. (2018). Mechanisms of Aneuploidy. *Cold Spring Harbor Perspectives in Biology*, *10*(12), a032242. PubMed Search Link
- Cancer Genome Atlas Research Network. (2014). Comprehensive genomic characterization of squamous cell lung cancers. *Nature*, *511*(7511), 541–548. PubMed Search Link
- Liu, S., et al. (2019). Aneuploidy: A Common Pathological Feature of Cancer. *Frontiers in Oncology*, *9*, 596. PubMed Search Link
- Davoli, T., & de Lange, T. (2014). The causes and consequences of polyploidy in cancer. *Annual Review of Cancer Biology*, *2*, 49–63. PubMed Search Link
12. Cell-Cell Interaction Patterns in Lung Adenocarcinoma and Squamous Cell Carcinoma
[Analysis Visualization Results]...
Analysis Overview
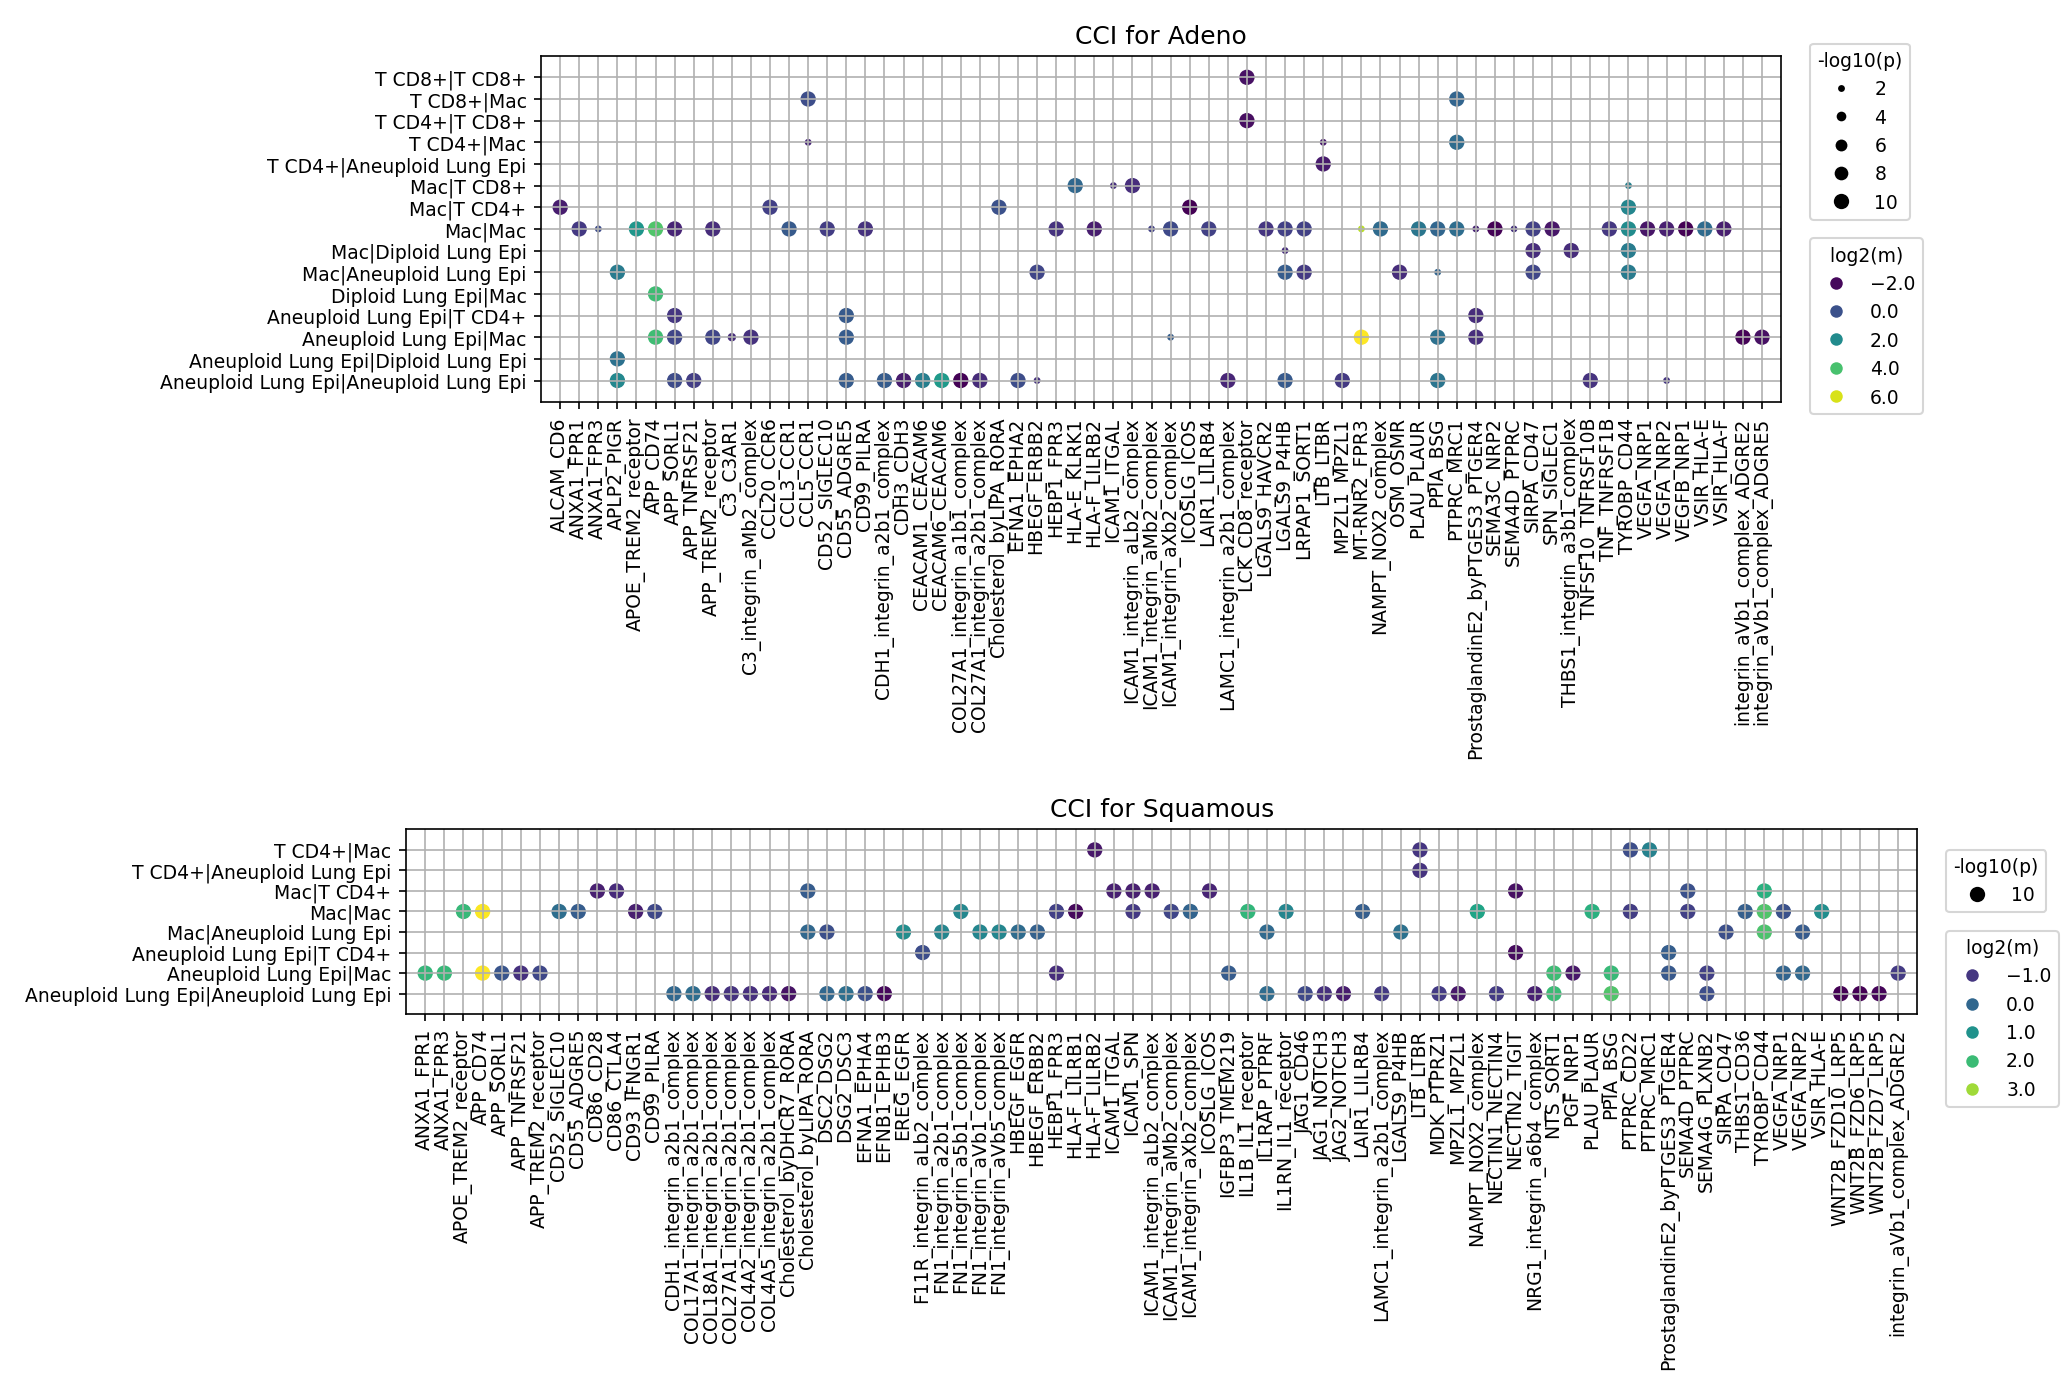
This analysis investigates cell-cell interaction (CCI) patterns using CellPhoneDB results, focusing on key cell types relevant to the tumor microenvironment in lung adenocarcinoma (Adeno) and lung squamous cell carcinoma (Squamous) conditions. The plot_cci_dots tool was used to visualize significant ligand-receptor interactions, emphasizing the roles of tumor-origin cells (Aneuploid Lung Epithelial cells), non-tumor epithelial cells (Diploid Lung Epithelial cells), macrophages, and T cells (CD4+ and CD8+). Interactions are filtered for significance (p-value < 0.05) and expression level (mean expression > 0.01). The plots display the strength of interaction as log2(mean) (color intensity) and statistical significance as -log10(p) (dot size).
Visual Summary
The analysis presents two dot plots, one for each lung cancer condition: "CCI for Adeno" and "CCI for Squamous."
- Plot Structure: Each plot displays cell-cell sender-receiver pairs on the y-axis and specific ligand-receptor (L-R) gene pairs or complexes on the x-axis.
- Cell Types Represented: The y-axis predominantly features interactions involving:
- Aneuploid Lung Epi: Tumor-origin lung epithelial cells (identified by aneuploidy).
- Diploid Lung Epi: Non-tumor lung epithelial cells.
- Mac: Macrophages.
- T cell CD4+ and T cell CD8+: Subtypes of T lymphocytes.
- Notably, interactions explicitly labeled for 'Fibroblast' are not among the top 80 pairs shown in these plots, despite being included in the target cell types for analysis, suggesting fewer highly significant or abundant interactions involving fibroblasts met the visualization criteria.
Interaction Strength and Significance:
- The color of each dot indicates the log2(mean) expression of the L-R pair, with warmer colors (yellow/green) representing higher expression and cooler colors (blue/purple) representing lower expression.
- The size of each dot reflects the statistical significance, -log10(p). Larger dots correspond to more significant interactions (smaller p-values). A p-value cutoff of 0.05 means only interactions with -log10(p) > 1.3 are shown.
Overall Density of Interactions:
- The "CCI for Adeno" plot appears to show a broader array of significant and highly expressed interactions across various cell-cell pairs and L-R complexes, especially involving 'Aneuploid Lung Epi' and 'Diploid Lung Epi' with immune and other epithelial cells.
- The "CCI for Squamous" plot shows a slightly sparser but still significant set of interactions, with some distinct patterns emerging.
Biological Interpretation
Common and Condition-Specific Interaction Landscape
- Aneuploid Lung Epithelial Cell (Tumor Cell) Interactions:
- Aneuploid Lung Epi Self-Interactions: Both Adeno and Squamous show significant self-interactions among aneuploid lung epithelial cells, suggesting autocrine signaling. Prominent examples include SPP1-integrin_aVb1_complex and VEGFA-NRP1 in Adeno, and various collagen-integrin interactions in Squamous. These could promote tumor cell proliferation, survival, and migration.
- Aneuploid Lung Epi ↔ Macrophage Interactions: These are critical for shaping the tumor microenvironment (TME), particularly regarding tumor-associated macrophages (TAMs).
- In Adeno, strong interactions include SPP1-CD44, MDK-NRP1, VEGFA-NRP1, and several ICAM1-integrin complexes. These pathways are known to influence TAM recruitment, polarization towards pro-tumorigenic phenotypes (e.g., M2-like), angiogenesis, and immune suppression.
- In Squamous, similar patterns are observed with SPP1-CD44, MDK-NRP1, and collagen-integrin interactions, suggesting shared mechanisms of TAM modulation.
- Aneuploid Lung Epi ↔ T cell Interactions (CD4+/CD8+): These interactions are crucial for immune evasion or regulation.
- In Adeno, interactions such as ICAM1-integrin complexes (e.g., ICAM1_integrin_aLb2_complex with T cells) are observed, mediating cell adhesion and T cell activation/inhibition.
- In Squamous, interactions are also present, often involving ICAM1-integrin and CDH1_integrin_a2b1_complex.
- Aneuploid Lung Epi ↔ Diploid Lung Epi Interactions: Communication between tumor and adjacent normal epithelial cells.
- In Adeno, interactions like SPP1-integrin_aVb1_complex, VEGFA-NRP1, and MDK-NRP1 are noted. These could facilitate tumor expansion into surrounding tissue or influence the behavior of normal cells in the TME.
- In Squamous, these interactions are less prominent among the top pairs shown, but some collagen-integrin interactions are present.
- Macrophage Interactions:
- Macrophage Self-Interactions: Both conditions show macrophage-macrophage interactions, including CDH1-integrin_a2b1_complex and MDK-NRP1, indicating complex autocrine/paracrine signaling within the macrophage population, potentially involved in their activation state or aggregation.
- Macrophage ↔ T cell Interactions: Cross-talk between innate and adaptive immune cells.
- In Adeno, interactions involving ANXA1-FPR1, APOE-TREM2_receptor, and ICAM1-integrin are observed, which can influence T cell priming, activation, and function.
- In Squamous, similar interactions are seen, highlighting the importance of this immune cell communication axis in both cancer subtypes.
Key Ligand-Receptor Systems and their Biological Roles
- Integrin Complexes (e.g., ICAM1_integrin, CDH1_integrin, FN1_integrin, integrin_aVb1_complex): These are extensively involved in cell adhesion, migration, proliferation, and survival. Their widespread involvement, especially with 'Aneuploid Lung Epi', 'Macrophage', and 'T cells', underscores their role in tumor invasion, metastasis, and immune cell trafficking within the TME.
- ICAM1-integrin_aLb2_complex and ICAM1-integrin_aXb2_complex are particularly active in Adeno, mediating interactions between Aneuploid Lung Epi and both T cells and macrophages.
- Collagen (COL) and Fibronectin (FN1) - Integrin Interactions: These are notably more active in Squamous, suggesting a potentially distinct extracellular matrix (ECM) remodeling process or greater reliance on ECM-mediated signaling for tumor progression in this subtype.
- SPP1 (Osteopontin) - CD44/Integrin: SPP1-CD44 interactions are highly significant and expressed in both Adeno and Squamous, particularly between 'Aneuploid Lung Epi' and 'Macrophage', and within 'Aneuploid Lung Epi' populations. SPP1 is a key factor in ECM remodeling, promoting angiogenesis, immune suppression (especially TAM polarization), and metastasis in various cancers. [[GeneCards: SPP1]](GeneCards)
- VEGFA (Vascular Endothelial Growth Factor A) - NRP1 (Neuropilin 1): This axis is prominent in Adeno, especially for interactions involving 'Aneuploid Lung Epi' and 'Macrophage'. VEGFA is a primary driver of angiogenesis, but the VEGFA-NRP1 pathway also influences tumor cell survival, invasiveness, and immune evasion. [[PubMed Search: VEGFA NRP1 cancer]](PubMed Search)
- MDK (Midkine) - NRP1: Similar to VEGFA, MDK-NRP1 interactions are significant, especially in Adeno involving 'Aneuploid Lung Epi' and 'Macrophage'. Midkine is a pleiotropic growth factor overexpressed in many cancers, promoting proliferation, survival, migration, and angiogenesis. [[GeneCards: MDK]](GeneCards)
- WNT2B: Interactions involving WNT2B are observed in Squamous, particularly between 'Aneuploid Lung Epi' and 'Macrophage', and within 'Aneuploid Lung Epi'. Wnt signaling is crucial for cell development and often aberrantly activated in cancer, promoting cell proliferation and survival.
Distinguishing Features Between Adeno and Squamous
- ECM Remodeling: Squamous seems to exhibit a higher number and strength of interactions involving collagen (COL) and fibronectin (FN1) with integrins, suggesting a potentially more prominent role for ECM-mediated signaling and structural changes in this subtype.
- Angiogenesis/Growth Factor Axis: The VEGFA-NRP1 and MDK-NRP1 axes appear particularly strong in Adeno, indicating robust pro-angiogenic and growth factor signaling from tumor cells to macrophages and other epithelial cells.
- Immune Interactions: While both conditions show extensive tumor-immune cell interactions, the specific combinations and strengths might vary, contributing to distinct immune microenvironments. Adeno appears to have a slightly broader set of highly significant interactions involving 'Diploid Lung Epi' and 'Macrophage' cells interacting with 'Aneuploid Lung Epi' cells.
Clinical or Translational Implications
The distinct and common CCI patterns revealed in this analysis offer valuable insights for targeted therapeutic development and biomarker identification in lung cancer.
Therapeutic Target Prioritization:
- SPP1-CD44 Axis: Given its prominence and known roles in tumor progression, angiogenesis, and immune suppression in both Adeno and Squamous, targeting the SPP1-CD44 interaction could be a promising therapeutic strategy.
- VEGFA-NRP1 and MDK-NRP1: These pathways, particularly robust in Adeno, represent potential targets for anti-angiogenic therapies or inhibitors of tumor cell survival and invasion. Given the context of Neuropilin 1's role in angiogenesis and immune regulation, strategies to block NRP1 could be explored.
- Integrin Complexes: The diverse integrin interactions highlight their broad utility as therapeutic targets, especially specific integrins mediating tumor-ECM or tumor-immune interactions. Blocking particular integrin complexes could disrupt tumor cell adhesion, migration, and proliferation, as well as immune cell trafficking.
- WNT2B: For Squamous cell carcinoma, targeting the WNT2B pathway could inhibit pro-tumorigenic signaling.
- Biomarker Discovery: The identified condition-specific CCI profiles could serve as prognostic or predictive biomarkers for patient stratification and treatment response in Adeno versus Squamous. For example, high expression of specific collagen-integrin interactions might be prognostic for Squamous.
- Immunotherapy Enhancement: Understanding the precise ligand-receptor interactions between tumor cells, macrophages, and T cells can inform strategies to enhance anti-tumor immunity. Disrupting immunosuppressive interactions (e.g., those promoting M2-like macrophage polarization or T cell exhaustion) could improve the efficacy of existing immunotherapies.
- Experimental Validation: The specific ligand-receptor pairs identified provide a strong basis for further experimental validation using in vitro co-culture systems, patient-derived organoids, or in vivo animal models to confirm their functional significance in lung cancer progression and response to therapy. For example, blocking antibodies against SPP1, CD44, VEGFA, NRP1, or specific integrin subunits could be tested.
13. Cell-Cell Interaction Analysis of Immune Checkpoint and Cell Cycle Genes in Lung Adenocarcinoma and Squamous Cell Carcinoma
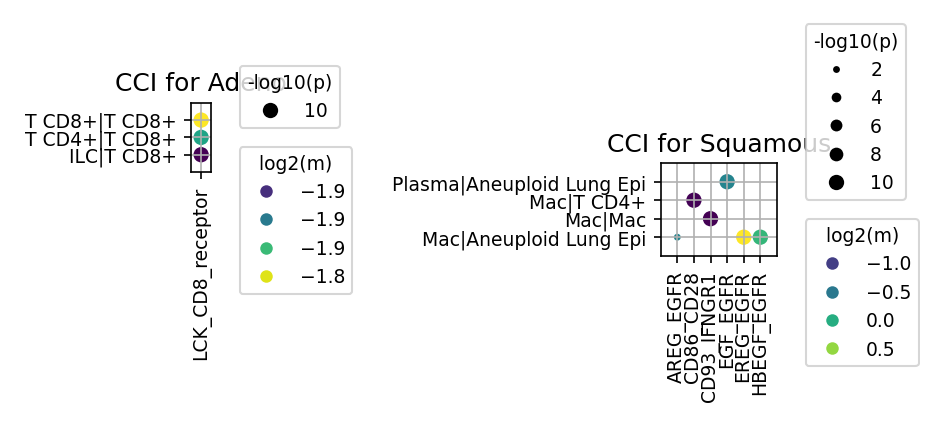
[Analysis Visualization Results]...
Analysis Overview
This analysis investigates cell-cell interactions (CCI) mediated by a selected panel of genes involved in immune checkpoint regulation and cell cycle pathways. The plot_cci_dots tool was used to visualize significant ligand-receptor interactions across different cell types in two lung cancer conditions: Adenocarcinoma (Adeno) and Squamous Cell Carcinoma (Squamous). Interactions are deemed significant based on a p-value cutoff of 0.05 and a mean expression cutoff of 0.01 for the ligand-receptor pair. The tumor-origin cell type has been identified as 'Lung Epithelial cell', with 'Aneuploid Lung Epi' specifically referring to tumor cells.
Visual Summary
CCI for Adeno
The dot plot for Adenocarcinoma reveals a highly focused set of interactions primarily centered around the LCK_CD8_receptor complex.
- Gene Pair: Only the LCK_CD8_receptor interaction is significantly observed. LCK is an intracellular tyrosine kinase crucial for T-cell receptor signaling, particularly associated with CD4 and CD8 co-receptors. This notation likely refers to interactions that activate or involve the CD8 receptor complex and its associated LCK signaling within T cells.
- Cell Pairs: The interactions are observed between various immune cells, with T CD8+ cells consistently acting as the receptor cell. Specifically, these interactions occur in:
- T CD8+|T CD8+: Self-interaction within CD8+ T cells.
- T CD4+|T CD8+: Interaction where CD4+ T cells are the ligand-expressing cells and CD8+ T cells are the receptor cells.
- ILC|T CD8+: Interaction where Innate Lymphoid Cells (ILC) are the ligand-expressing cells and CD8+ T cells are the receptor cells.
- Significance and Expression: All observed interactions for Adeno show maximal statistical significance (indicated by the largest dot size, corresponding to -log10(p) = 10), while the mean expression levels (log2(m)) are relatively low, ranging from -1.9 to -1.8.
CCI for Squamous
The dot plot for Squamous Cell Carcinoma presents a more diverse range of cell-cell interactions involving several distinct gene pairs.
- Gene Pairs: Several interactions involving the Epidermal Growth Factor Receptor (EGFR) pathway (AREG-EGFR, EGF-EGFR, EREG-EGFR, HBEGF-EGFR), the immune co-stimulatory molecule CD86-CD28, and the IFN-gamma receptor (CD93-IFNGR1) are highlighted.
- Cell Pairs: The interactions involve immune cells (Macrophages, Plasma cells, T CD4+ cells) and the identified tumor cells (Aneuploid Lung Epi). Key interactions include:
- Plasma|Aneuploid Lung Epi: Interaction via AREG-EGFR.
- Mac|T CD4+: Interaction via CD86-CD28.
- Mac|Mac: Self-interaction between Macrophages via CD93-IFNGR1.
- Mac|Aneuploid Lung Epi: Interactions via various EGFR ligands (EGF-EGFR, EREG-EGFR, HBEGF-EGFR).
Significance and Expression:
- EGFR-mediated interactions (AREG-EGFR, EGF-EGFR, EREG-EGFR, HBEGF-EGFR) involving Aneuploid Lung Epi generally show high significance and moderate to high mean expression (yellow/lighter dots, log2(m) around 0.5).
- The CD86-CD28 interaction between Mac|T CD4+ is highly significant with moderate mean expression (log2(m) around 0.5).
- The CD93-IFNGR1 interaction between Mac|Mac shows varying significance and lower mean expression.
Biological Interpretation
Distinct Immune and Growth Factor Signaling Profiles by Lung Cancer Subtype
The analysis reveals notable differences in cell-cell communication patterns between Adenocarcinoma and Squamous Cell Carcinoma, particularly concerning immune checkpoint and cell cycle-related pathways.
- Adenocarcinoma (Adeno): T-Cell Intrinsic Activation and Crosstalk
The prominent LCK_CD8_receptor interaction in Adeno suggests a focus on T-cell mediated immunity. LCK is a critical component of the T-cell receptor (TCR) signaling pathway, indispensable for T-cell activation and proliferation. The observed self-interactions within T CD8+ cells and interactions with T CD4+ cells and ILCs indicate active immune surveillance or response mechanisms involving cytotoxic T lymphocytes (CTLs). This implies a microenvironment where T cells are actively sensing, responding, or being modulated by other immune cells. The high statistical significance despite lower mean expression could suggest that these are potent, context-dependent interactions, possibly involved in maintaining T-cell function or chronic activation, even if the overall expression levels are not exceptionally high.
- Squamous Cell Carcinoma (Squamous): EGFR Pathway Dominance and Immune Cell-Tumor Crosstalk
In contrast, Squamous Cell Carcinoma exhibits a strong signal for growth factor receptor signaling, particularly involving the EGFR pathway.
- Tumor-Immune Cell Interactions: Macrophages (Mac) and Plasma cells actively communicate with Aneuploid Lung Epi (tumor cells) through various EGFR ligands (AREG, EGF, EREG, HBEGF). This paracrine signaling can promote tumor cell proliferation, survival, and drug resistance, highlighting a pro-tumorigenic role for the immune microenvironment in Squamous NSCLC. EGFR overexpression and activation are well-established drivers in various cancers, including lung cancer [1, 2].
- Immune Co-stimulation: The CD86-CD28 interaction between Mac and T CD4+ cells signifies active immune co-stimulation. CD86, expressed on antigen-presenting cells like macrophages, provides a crucial second signal to CD28 on T cells, essential for robust T-cell activation and differentiation. This indicates that the adaptive immune response is being actively shaped in the Squamous microenvironment.
- Macrophage Autocrine/Paracrine Signaling: Mac|Mac interactions via CD93-IFNGR1 suggest autocrine or paracrine signaling among macrophages, potentially influencing their activation state, polarization, or immune regulatory functions within the tumor microenvironment. Interferon-gamma (IFN-γ) signaling through IFNGR1 can have complex effects on tumor immunity, ranging from anti-tumor activity to promoting immune evasion.
Clinical or Translational Implications
The distinct CCI profiles between Adenocarcinoma and Squamous Cell Carcinoma suggest differential therapeutic vulnerabilities and opportunities for intervention.
- Targeting EGFR in Squamous Cell Carcinoma: The prominent and highly significant EGFR-mediated signaling from immune cells to Aneuploid Lung Epi in Squamous Cell Carcinoma strongly supports the rationale for EGFR inhibitors in this subtype. This could be particularly effective if the tumor cells are reliant on these paracrine growth signals. Identifying the specific immune cell types (Macrophages, Plasma cells) as sources of EGFR ligands could also lead to combination therapies targeting both the tumor cells and the pro-tumorigenic immune cells in the microenvironment. Further characterization of the genetic status of EGFR in these tumors (e.g., activating mutations) would further refine this strategy.
- Modulating T-cell Activity in Adenocarcinoma: The observed LCK-CD8 receptor interactions in Adenocarcinoma highlight active T-cell receptor signaling. Strategies aimed at enhancing or sustaining T-cell function, such as immune checkpoint inhibitors that prevent T-cell exhaustion (e.g., anti-PD-1/PD-L1), could be particularly relevant in Adenocarcinoma to bolster anti-tumor immunity. Investigating the functional state of these T cells (e.g., activation, exhaustion markers) would provide deeper insight.
- Immunomodulation in Squamous Cell Carcinoma: The CD86-CD28 interaction indicates active antigen presentation and T-cell priming. This pathway could be targeted to either enhance (e.g., agonistic CD28 antibodies) or suppress (e.g., CTLA-4 inhibitors, which compete with CD28 for CD80/CD86 binding) T-cell responses depending on the desired outcome. The macrophage-macrophage interactions via CD93-IFNGR1 suggest that modulating macrophage polarization or their response to IFN-γ could reshape the immune microenvironment.
- Biomarker Development: These specific cell-cell interaction pairs could serve as biomarkers to stratify lung cancer patients for different immunotherapy or targeted therapy regimens. For example, high EGFR ligand expression from tumor-infiltrating macrophages could predict response to EGFR inhibitors in Squamous Cell Carcinoma, while distinct LCK-CD8 pathway activity might predict response to T-cell-directed immunotherapies in Adenocarcinoma.
---
References:
- EGFR signaling: A general overview of EGFR's role in cancer: https://www.genecards.org/cgi-bin/carddisp.pl?gene=EGFR
- EGFR in Lung Cancer: For clinical relevance of EGFR in lung cancer: https://pubmed.ncbi.nlm.nih.gov/?term=EGFR+lung+cancer+treatment
14. Condition-Specific Cell-Cell Interaction Patterns in Lung Adenocarcinoma and Squamous Cell Carcinoma
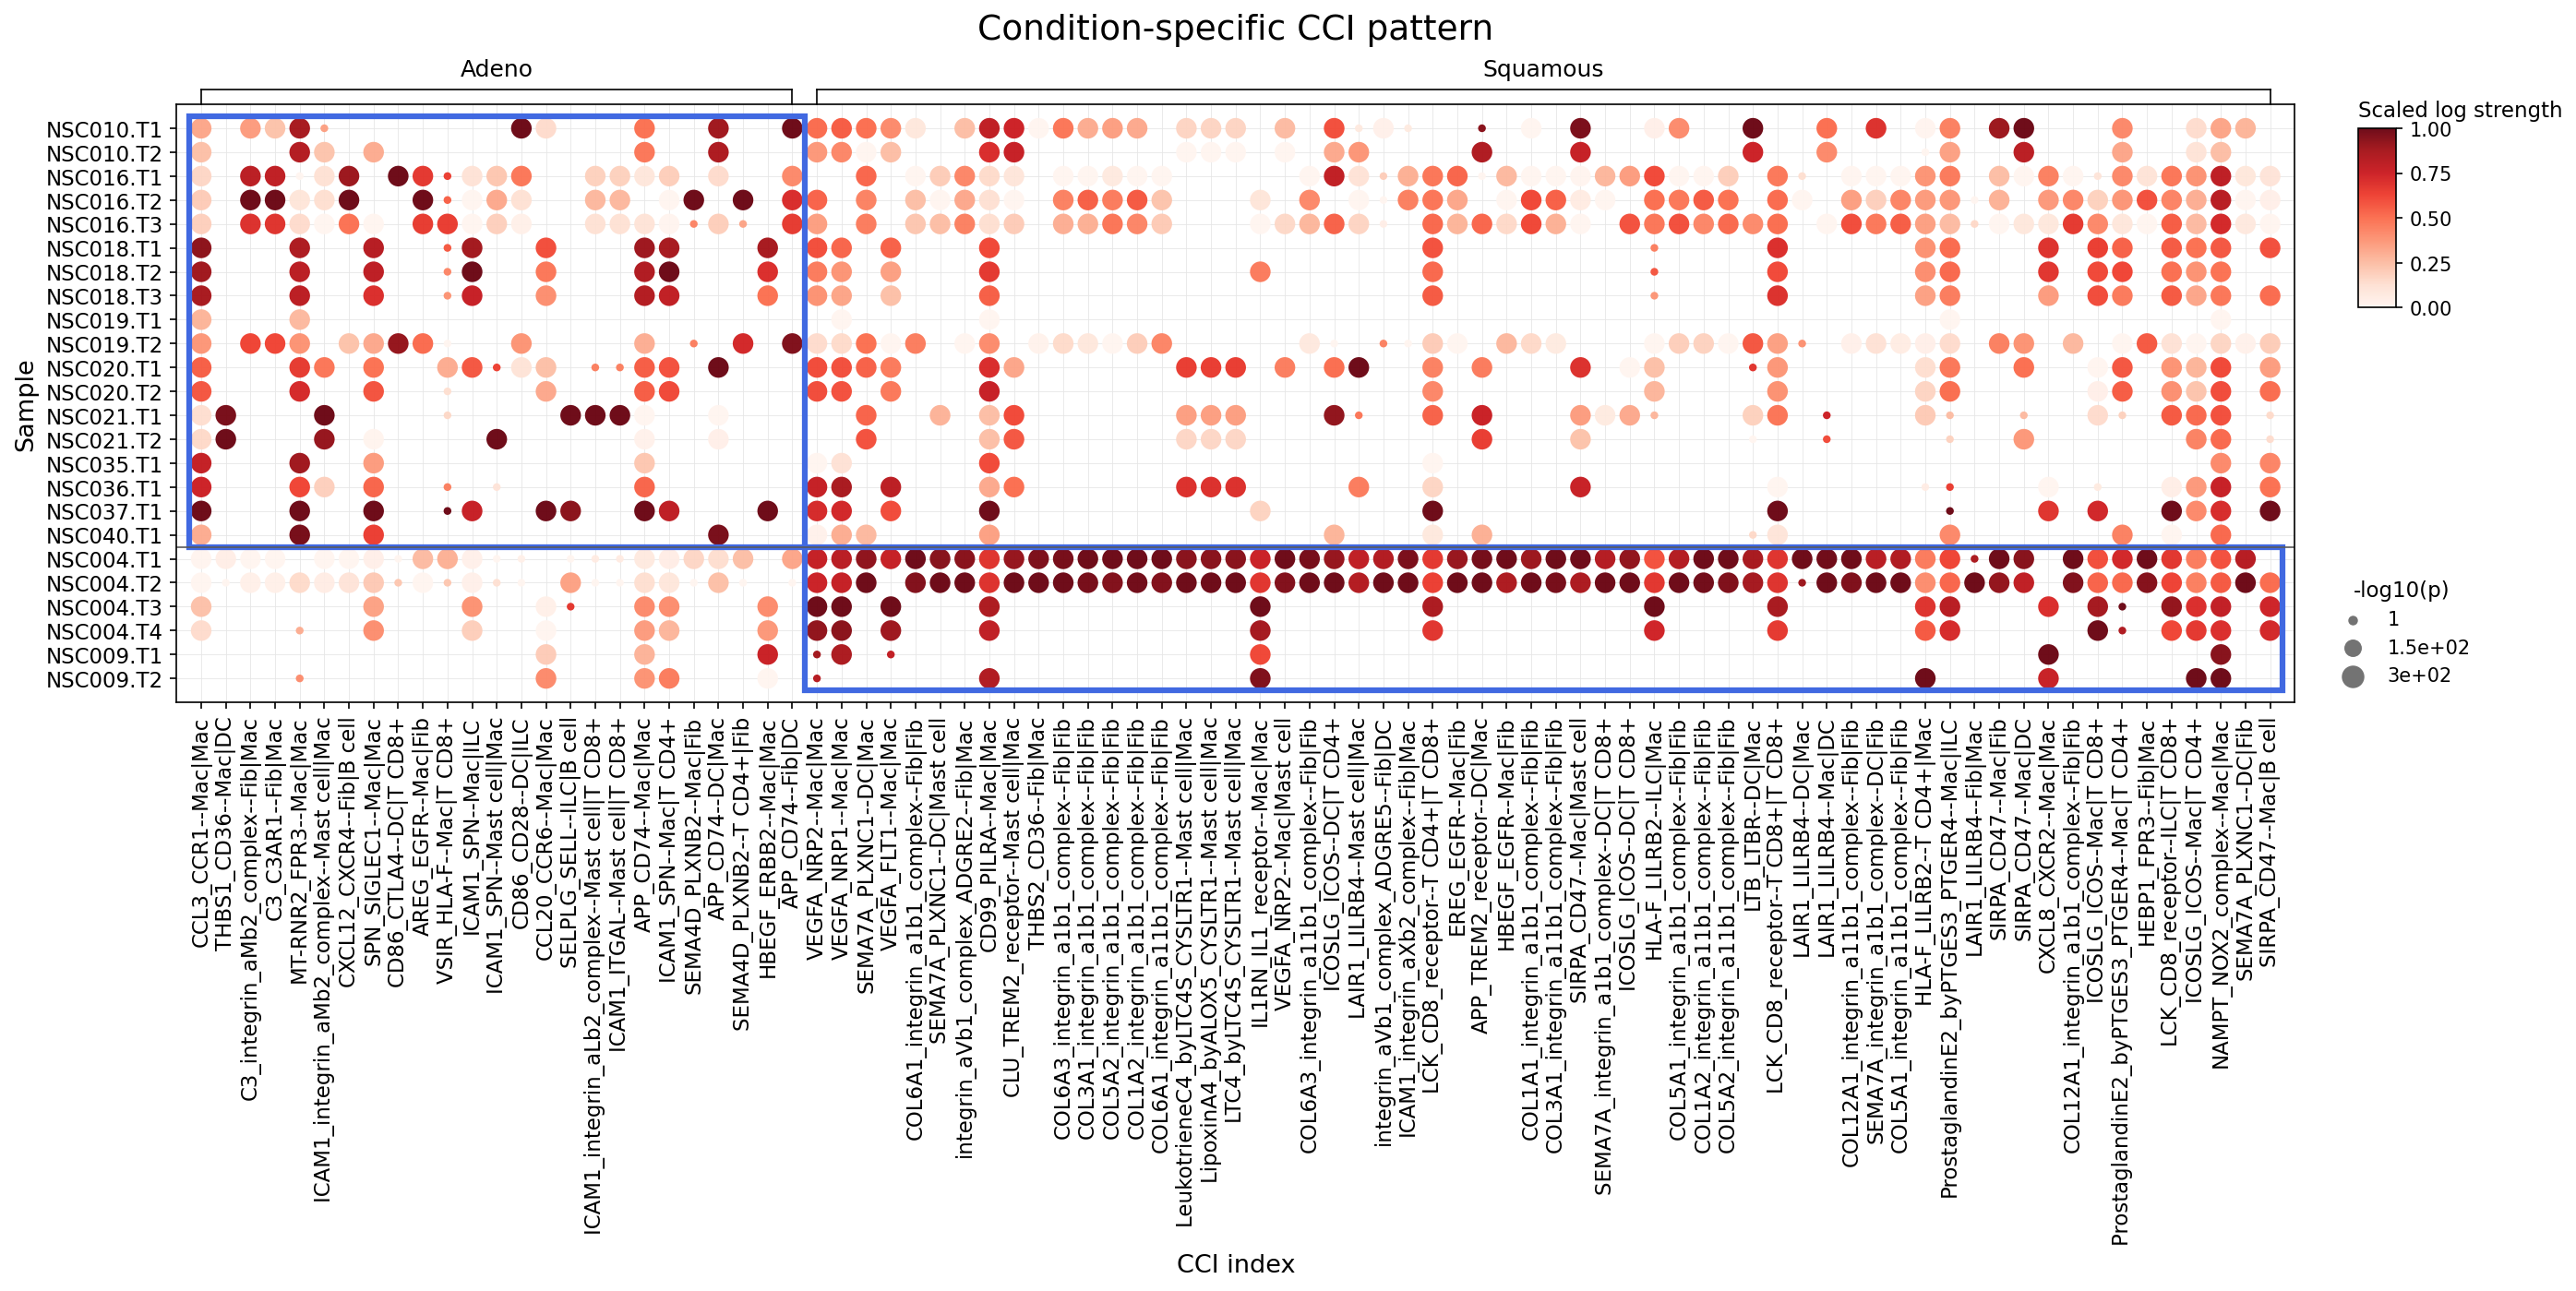
[Analysis Visualization Results]...
Analysis Overview
This analysis investigates condition-specific cell-cell interaction (CCI) patterns involving major immune and stromal cell types in lung cancer, comparing Adenocarcinoma ('Adeno') and Squamous Cell Carcinoma ('Squamous') conditions. The dot plot visualizes the strength and significance of various ligand-receptor interactions between specified cell types across individual samples for each condition. Dot size represents the negative logarithm of the p-value (-log10(p)), indicating statistical significance, while dot color reflects the scaled log strength of the interaction, indicating its intensity. The goal is to identify CCIs that differ significantly between these two lung cancer subtypes and to interpret their biological and potential clinical implications.
Visual Summary
The dot plot displays a comprehensive landscape of cell-cell interactions, highlighting distinct patterns between Adenocarcinoma and Squamous Cell Carcinoma.
- Overall Pattern: The Squamous condition exhibits a generally more widespread and stronger network of cell-cell interactions compared to the Adeno condition. Many samples in the Squamous group show consistently large and darkly colored dots across a broader range of CCI pairs.
Adenocarcinoma (Adeno) Condition:
- Interactions appear more heterogeneous across samples. Some samples (e.g., NSC010.T1, NSC016.T1, NSC018.T1) show moderate to strong interactions for specific ligand-receptor pairs, while others are less active.
- Notable interactions include CCL3_CCR1--Mac|Mac, ICAM1_integrin_aM2_complex--Fib|Mac, SPP1_SPN--Mac|Mac, and CXCL12_CXCR4--Fib|B cell. These interactions, when present, tend to be moderately significant and strong.
Squamous Cell Carcinoma (Squamous) Condition:
- This condition is characterized by a high density of strong and significant interactions, particularly evident in samples like NSC004.T1-T4 and NSC009.T1-T2, which display numerous large, dark red dots across many CCI pairs.
- A prominent feature in Squamous is the extensive involvement of collagen-integrin interactions (e.g., COL6A1_integrin_a1b1_complex--Fib|Fib, COL3A1_integrin_a1b1_complex--Fib|Fib, COL5A1_integrin_a1b1_complex--Fib|Fib), predominantly between Fibroblasts.
- Other highly active interactions in Squamous include VEGFA_NRP1--Mac|Mac, SIRPA_CD47--Mac|Mac, ICOSLG_ICOS--DC|T CD8+, APP_TREM2_receptor--Mac|Mac, SEMA7A_PLXNC1--DC|Mac, and ProstaglandinE2_byPTGES3-PTGER4--Mac|Mac.
- Cell Type Involvement: Macrophages (Mac), Fibroblasts (Fib), and T cells (CD8+, CD4+) are frequently observed as interacting partners, along with Dendritic cells (DC) and B cells, emphasizing the critical role of immune and stromal cells in the tumor microenvironment of both cancer types, with greater overall activity in Squamous.
Biological Interpretation
The distinct CCI patterns observed between Adenocarcinoma and Squamous Cell Carcinoma highlight fundamental differences in their tumor microenvironments (TMEs) and underlying biological processes.
Interactions Stronger in Adenocarcinoma:
CCL3_CCR1--Mac|Mac (Macrophage-Macrophage)
- Pathways/Mechanisms: This interaction involves the chemokine CCL3 (MIP-1α) binding to its receptor CCR1. It mediates chemotaxis, recruiting macrophages and other immune cells to inflammatory sites, including tumors. In the TME, it can contribute to the accumulation of tumor-associated macrophages (TAMs), which can be pro-tumorigenic.
- Therapeutic Potential: Targeting CCR1 could inhibit macrophage infiltration and reshape the immune microenvironment.
- Therapeutic Agents: CCR1 antagonists are being explored in various inflammatory and autoimmune diseases, with potential applicability in cancer to modulate macrophage recruitment.
ICAM1_integrin_aM2_complex--Fib|Mac (Fibroblast-Macrophage)
- Pathways/Mechanisms: Intercellular Adhesion Molecule 1 (ICAM1) on fibroblasts interacting with integrin αMβ2 (Mac-1 or CD11b/CD18 complex) on macrophages. This mediates cell adhesion, crucial for immune cell extravasation, migration, and stable interactions within tissues. It plays a role in regulating inflammatory responses and cellular communication within the TME.
- Therapeutic Potential: Disrupting ICAM1-integrin interactions could impede immune cell trafficking and stromal-immune cell communication within the tumor.
- Therapeutic Agents: Antibodies targeting ICAM1 or integrin αMβ2 have been developed for inflammatory conditions, potentially transferable to cancer contexts to modulate immune cell infiltration. PubMed search: ICAM1 integrin cancer therapy
SPP1_SPN--Mac|Mac (Macrophage-Macrophage)
- Pathways/Mechanisms: Secreted Phosphoprotein 1 (SPP1), also known as Osteopontin, interacting with SPN (likely a receptor like CD44 variant or another cell surface molecule). SPP1 is a matricellular protein involved in extracellular matrix remodeling, cell adhesion, migration, and survival. It promotes angiogenesis, immune cell trafficking, and metastatic processes.
- Therapeutic Potential: Targeting SPP1 or its receptors could inhibit multiple aspects of tumor progression and alter the immune landscape.
- Therapeutic Agents: SPP1-targeting antibodies or small molecule inhibitors are under investigation for various cancers. GeneCards: SPP1
CXCL12_CXCR4--Fib|B cell (Fibroblast-B cell)
- Pathways/Mechanisms: Chemokine (C-X-C motif) Ligand 12 (CXCL12) binding to its receptor C-X-C Motif Chemokine Receptor 4 (CXCR4). This axis is critical for cell trafficking, angiogenesis, lymph node development, and immune cell homing. In cancer, it mediates tumor cell migration, invasion, metastasis, and retention of immune cells within the TME.
- Therapeutic Potential: Inhibiting CXCR4 can block tumor progression, reduce metastasis, and enhance immune cell infiltration into the tumor core.
- Therapeutic Agents: CXCR4 antagonists, such as Plerixafor, are approved for stem cell mobilization and are being investigated in various cancers to block metastasis and improve chemo/immunotherapy responses. GeneCards: CXCR4
Interactions Stronger in Squamous Cell Carcinoma:
- COLx_integrin_a1b1_complex--Fib|Fib (e.g., COL6A1_integrin_a1b1_complex--Fib|Fib, COL3A1_integrin_a1b1_complex--Fib|Fib, COL5A1_integrin_a1b1_complex--Fib|Fib) (Fibroblast-Fibroblast)
- Pathways/Mechanisms: These represent interactions between various collagen types (e.g., COL6A1, COL3A1, COL5A1) and integrin alpha1beta1 complexes. This extensive network signifies significant extracellular matrix (ECM) remodeling and strong fibroblast-fibroblast adhesion, contributing to desmoplasia. Such a rigid and abundant ECM promotes tumor growth, invasion, and protects cancer cells from immune surveillance.
- Therapeutic Potential: Targeting specific integrins involved in ECM remodeling could disrupt tumor architecture, inhibit invasion, and potentially sensitize tumors to other therapies.
- Therapeutic Agents: Integrin inhibitors, such as cilengitide (targeting αvβ3 and αvβ5 integrins), are in clinical development for various cancers. Developing inhibitors specific to α1β1 integrin in the context of lung SCC could be beneficial. PubMed search: Integrin inhibitors cancer therapy
- VEGFA_NRP1--Mac|Mac & VEGFA_FLT1--Mac|Mac (Macrophage-Macrophage)
- Pathways/Mechanisms: Vascular Endothelial Growth Factor A (VEGFA) binding to Neuropilin 1 (NRP1) and Fms-Like Tyrosine Kinase 1 (FLT1/VEGFR1) on macrophages. This signaling axis is a key driver of angiogenesis and lymphangiogenesis. Macrophage-derived VEGFA or VEGFA signaling *between* macrophages can promote pro-tumorigenic macrophage polarization and support tumor neovascularization independently or synergistically with endothelial cells.
- Therapeutic Potential: Beyond direct anti-angiogenic therapies, targeting macrophage-specific VEGFA signaling or its receptors (NRP1, FLT1) could inhibit tumor angiogenesis and macrophage functions.
- Therapeutic Agents: Bevacizumab (anti-VEGFA antibody) is widely used. Anti-NRP1 antibodies and VEGFR1/FLT1 specific inhibitors are also under investigation. GeneCards: VEGFA
- SIRPA_CD47--Mac|Mac / DC|Mac / Fib|Mac (Macrophage/Dendritic Cell/Fibroblast-Macrophage)
- Pathways/Mechanisms: Signal Regulatory Protein Alpha (SIRPα) on phagocytic cells (macrophages, dendritic cells) interacting with Cluster of Differentiation 47 (CD47) on other cells (including tumor cells and various stromal/immune cells). This is a well-known "don't eat me" signal that prevents phagocytosis and allows cancer cells to evade immune destruction. Its prevalence here suggests broad immune evasion within the TME.
- Therapeutic Potential: Blocking the CD47-SIRPα axis is a promising strategy to enable macrophage-mediated phagocytosis of tumor cells.
- Therapeutic Agents: Several CD47 or SIRPα blocking antibodies (e.g., magrolimab, lemzoparlimab) are in clinical trials for various solid tumors and hematological malignancies. PubMed search: CD47 SIRPA checkpoint inhibitor
ICOSLG_ICOS--DC|T CD8+ (Dendritic Cell-T cell CD8+)
- Pathways/Mechanisms: Inducible T-cell Co-stimulator Ligand (ICOSLG) on dendritic cells (APCs) binding to Inducible T-cell Co-stimulator (ICOS) on CD8+ T cells. This provides a critical co-stimulatory signal for T cell activation, proliferation, and differentiation, important for maintaining anti-tumor immunity. However, sustained ICOS signaling can sometimes lead to T cell exhaustion or the generation of immunosuppressive T regulatory cells depending on the TME context.
- Therapeutic Potential: Modulating ICOS signaling can enhance anti-tumor T cell responses.
- Therapeutic Agents: ICOS agonists are being investigated to boost T cell immunity, while ICOS antagonists might be used to target specific pro-tumorigenic ICOS+ T cell subsets. GeneCards: ICOS
APP_TREM2_receptor--Mac|Mac (Macrophage-Macrophage)
- Pathways/Mechanisms: Amyloid Precursor Protein (APP) interacting with Triggering Receptor Expressed on Myeloid cells 2 (TREM2). TREM2 is a key receptor on myeloid cells that regulates their activation, phagocytosis, and cytokine production. In cancer, TREM2+ macrophages can adopt pro-tumorigenic phenotypes, promoting immunosuppression and tumor growth. The interaction between macrophages suggests autocrine/paracrine regulation of macrophage function.
- Therapeutic Potential: Targeting TREM2 could reprogram pro-tumorigenic macrophages to an anti-tumorigenic state or inhibit their accumulation.
- Therapeutic Agents: TREM2-modulating antibodies or small molecules are in early development, primarily for neurodegenerative diseases, but with growing interest in cancer immunology. PubMed search: TREM2 cancer therapy
- ProstaglandinE2_byPTGES3-PTGER4--Mac|Mac / Mac|T (Macrophage-Macrophage / Macrophage-T cell)
- Pathways/Mechanisms: Prostaglandin E2 (PGE2), synthesized by PTGES3, binding to its receptor Prostaglandin E Receptor 4 (PTGER4/EP4). PGE2 is a potent lipid mediator involved in inflammation, immunosuppression, and cancer progression. In the TME, macrophage-derived PGE2 can promote tumor growth, angiogenesis, and suppress anti-tumor immune responses, particularly by inhibiting T cell activation and promoting regulatory T cells.
- Therapeutic Potential: Inhibiting PGE2 synthesis or blocking its receptor EP4 could reverse immunosuppression and dampen pro-tumorigenic inflammation.
- Therapeutic Agents: COX-2 inhibitors (e.g., celecoxib) reduce PGE2 synthesis. EP4 receptor antagonists are in clinical trials for various cancers, aiming to restore anti-tumor immunity. PubMed search: PTGER4 antagonist cancer
SEMA7A_PLXNC1--DC|Mac (Dendritic Cell-Macrophage)
- Pathways/Mechanisms: Semaphorin 7A (SEMA7A) interacting with Plexin C1 (PLXNC1). Semaphorins are a family of guidance cues involved in diverse biological processes, including immune responses, nervous system development, and angiogenesis. SEMA7A can act as an inflammatory mediator, stimulating myeloid cells and influencing immune cell trafficking and polarization.
- Therapeutic Potential: Modulating SEMA7A-PLXNC1 signaling could alter dendritic cell and macrophage functions, influencing the overall immune response within the TME.
- Therapeutic Agents: Therapies targeting semaphorin pathways are an emerging area, with potential for modulating immune responses in cancer. GeneCards: SEMA7A
Clinical or Translational Implications
The significant differences in cell-cell interaction patterns between lung Adenocarcinoma and Squamous Cell Carcinoma have substantial clinical and translational implications:
- Distinct TME Signatures: The findings underscore that Adenocarcinoma and Squamous Cell Carcinoma possess fundamentally different tumor microenvironments, which likely contribute to their varied clinical behaviors and responses to therapy. Squamous Cell Carcinoma, in particular, appears to have a highly active and complex stromal-immune network characterized by extensive ECM remodeling and multifaceted macrophage involvement.
- Subtype-Specific Therapeutic Strategies: The identified condition-specific CCIs suggest opportunities for developing or applying subtype-specific therapeutic interventions.
- Squamous Cell Carcinoma: Patients with Squamous Cell Carcinoma might particularly benefit from therapies targeting the prominent stromal-immune interactions, such as:
- Integrin inhibitors to disrupt extensive fibroblast-mediated ECM remodeling and tumor invasion.
- CD47-SIRPα blocking antibodies to overcome pervasive immune evasion.
- VEGF signaling modulators focusing on macrophage-driven angiogenesis.
- EP4 antagonists to reverse PGE2-mediated immunosuppression.
- Adenocarcinoma: While less globally active in these specific interactions, the identified CCIs such as CCL3-CCR1, SPP1-SPN, and CXCL12-CXCR4 still represent potential targets for modulating macrophage recruitment, stromal-immune interplay, and tumor cell retention, respectively.
- Squamous Cell Carcinoma: Patients with Squamous Cell Carcinoma might particularly benefit from therapies targeting the prominent stromal-immune interactions, such as:
- Biomarker Development: The differential expression of these CCI pathways could serve as diagnostic or prognostic biomarkers, helping to stratify patients into responders for specific targeted or immunotherapies. For instance, high activity in collagen-integrin or CD47-SIRPα axes in Squamous patients could indicate suitability for specific inhibitors.
- Combination Therapies: Understanding these distinct TME landscapes can guide the rational design of combination therapies. For example, combining immune checkpoint inhibitors with agents targeting fibroblast activation (e.g., integrin inhibitors) or macrophage function (e.g., CD47 blockers or EP4 antagonists) might synergistically improve outcomes, particularly in Squamous Cell Carcinoma.
- Further Validation: The observed sample-level heterogeneity within each condition, especially the highly active NSC004 and NSC009 samples in Squamous, warrants further investigation to understand potential patient-specific drivers and validate these CCI patterns as robust biomarkers or therapeutic targets in larger cohorts.
15. Condition-Specific Surfaceome Marker Expression in Lung Epithelial Tumor Cells
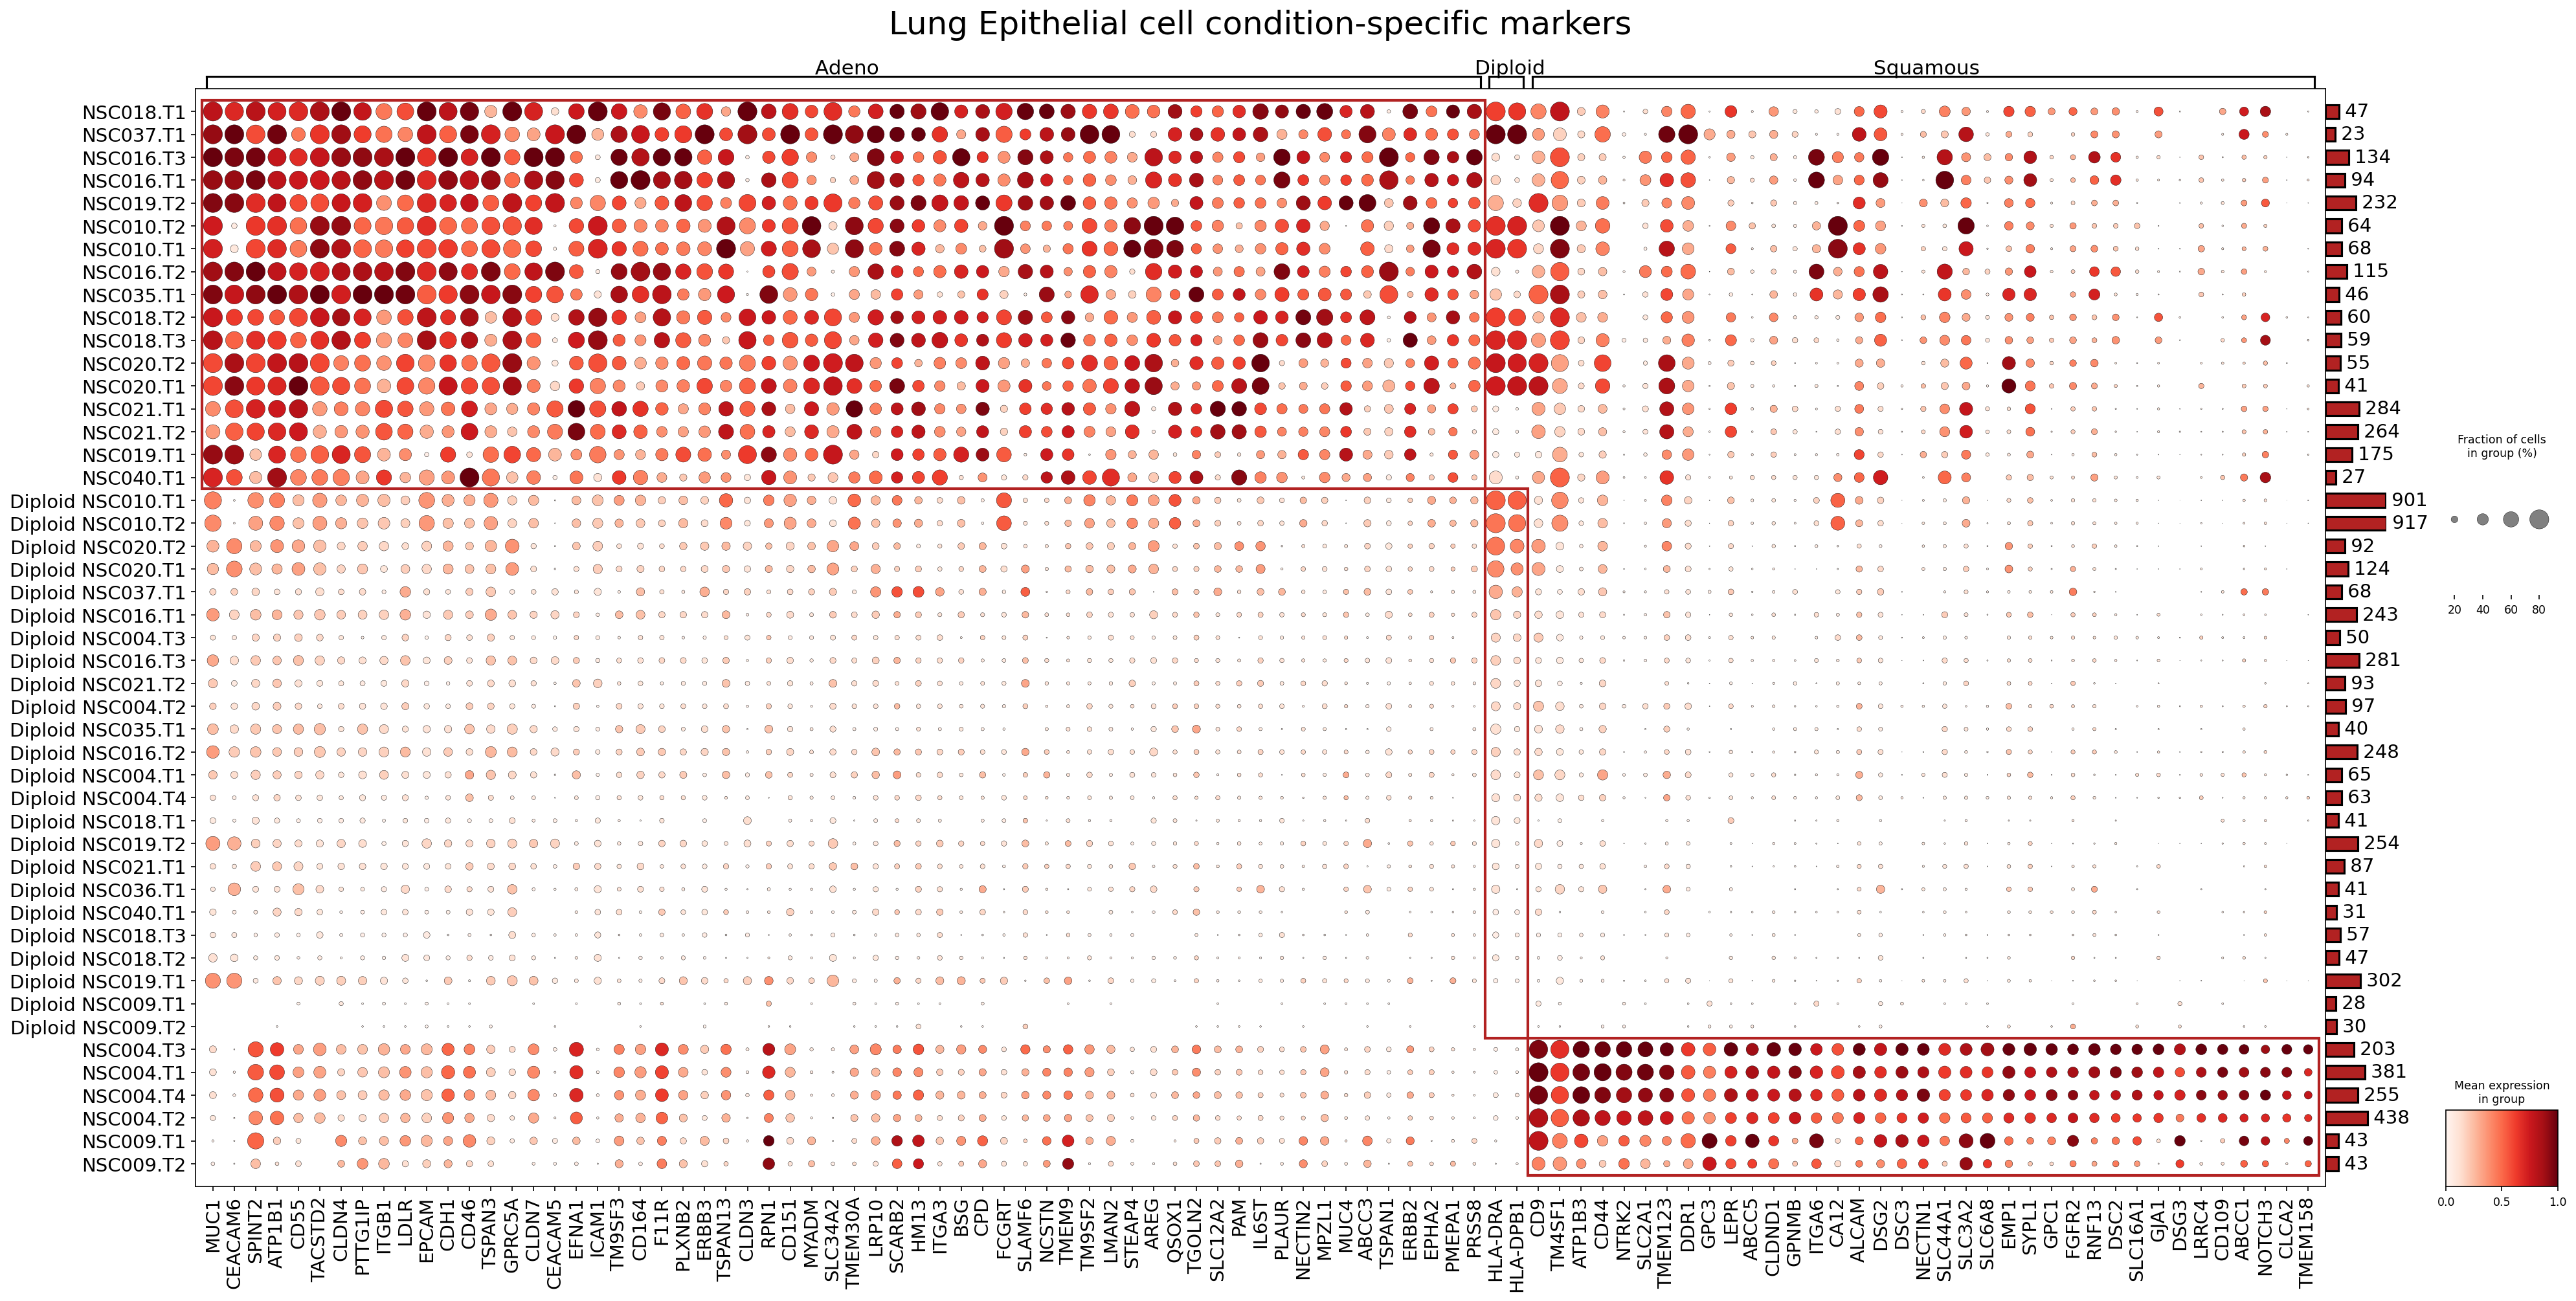
[Analysis Visualization Results]...
Analysis Overview
This analysis identifies and visualizes the expression of surfaceome markers in Lung Epithelial cells across different conditions: Adenocarcinoma (Adeno), Squamous Cell Carcinoma (Squamous), and Diploid cells (likely representing non-malignant or normal-like epithelial cells). The dot plot displays both the mean expression level (color intensity) and the fraction of cells expressing each marker (dot size) for individual samples within each condition. The primary goal is to identify unique and shared surfaceome markers that could serve as therapeutic targets or diagnostic biomarkers in lung adenocarcinomas and squamous cell carcinomas.
Visual Summary
The dot plot effectively delineates distinct expression patterns for surfaceome markers across the three conditions.
- Adenocarcinoma (Adeno) Markers: A prominent cluster of markers shows high expression and high cellular prevalence primarily within the Adeno samples (leftmost panel). Key markers in this group include MUC1, CEACAM6, TACSTD2, EPCAM, and CLDN4. These markers are largely absent or expressed at very low levels in both the Diploid and Squamous samples, indicating their specificity to adenocarcinoma.
- Diploid Markers: Samples identified as "Diploid NSC..." generally exhibit very low expression for most of the markers presented in the plot. This suggests that the selected markers are indeed enriched in malignant cells and are not broadly expressed by non-malignant lung epithelial cells. There isn't a strong cluster of "Diploid-specific" markers among the selected tumor-enriched surfaceome markers, reinforcing their tumor association.
- Squamous Cell Carcinoma (Squamous) Markers: A distinct and robust cluster of markers is highly expressed and prevalent exclusively in the Squamous samples (rightmost panel). This cluster includes prominent genes such as CD44, SLC2A1 (GLUT1), DDR1, CD24, SDC1, GPNMB, EGFR, and FGFR2. Similar to the Adeno-specific markers, these are minimally expressed in Diploid and Adeno samples, highlighting their specificity to squamous cell carcinoma.
- Overall Trend: The plot clearly demonstrates significant molecular heterogeneity between lung adenocarcinoma and squamous cell carcinoma at the surfaceome level, with each subtype harboring its own set of highly expressed, specific surface markers. This distinction is crucial for targeted therapeutic strategies.
Biological Interpretation
The differential expression of surfaceome markers in Lung Epithelial tumor cells reflects the distinct biological pathways and cellular characteristics of adenocarcinoma and squamous cell carcinoma, derived from their different cellular origins and oncogenic drivers.
Adenocarcinoma-Specific Markers (Established & Potential Therapeutic Targets)
- MUC1 (Mucin 1) - Established Therapeutic Target
- Signaling Pathways & Mechanisms: MUC1 is a transmembrane glycoprotein involved in cell signaling, adhesion, proliferation, differentiation, and anti-apoptosis. It modulates pathways like EGFR, β-catenin, and ErbB2. Its aberrant glycosylation and overexpression in cancer contribute to immune evasion and metastasis [PubMed Search: MUC1 cancer signaling].
- Therapeutic Agents: Antibody-drug conjugates (ADCs) targeting MUC1, such as sacituzumab govitecan (targeting TROP2, often co-expressed with MUC1), or investigational MUC1-specific ADCs and vaccines.
- Supporting Evidence: Overexpression of MUC1 is common in adenocarcinomas, including lung adenocarcinoma, and correlates with poor prognosis.
- TACSTD2 (TROP2) (Trophoblast Cell Surface Antigen 2) - Established Therapeutic Target
- Signaling Pathways & Mechanisms: TROP2 is a cell surface glycoprotein that plays a role in cell proliferation, self-renewal, and tumor growth through interactions with signaling pathways such as the Wnt/β-catenin pathway and cell cycle regulation. It promotes tumor initiation and metastasis [PubMed Search: TROP2 cancer signaling].
- Therapeutic Agents: Antibody-drug conjugates (ADCs) like sacituzumab govitecan, which is approved for other epithelial cancers and under investigation for lung cancer.
- Supporting Evidence: TROP2 is frequently overexpressed in various epithelial cancers, including lung adenocarcinoma, and its expression correlates with poor prognosis.
- EPCAM (Epithelial Cell Adhesion Molecule) - Established Therapeutic Target/Marker
- Signaling Pathways & Mechanisms: EPCAM is involved in cell adhesion, proliferation, differentiation, and cell signaling, including Wnt pathway activation. It plays a role in regulating cell polarity and self-renewal, often linked to cancer stem cell properties [PubMed Search: EPCAM cancer stem cell].
- Therapeutic Agents: Monoclonal antibodies (e.g., Catumaxomab for malignant ascites) and ADCs targeting EPCAM have been developed and tested in various epithelial cancers.
- Supporting Evidence: EPCAM is widely expressed in normal epithelial tissues and often overexpressed in carcinomas, including lung adenocarcinoma, where it can contribute to tumor progression and serves as a marker for circulating tumor cells.
- CEACAM6 (Carcinoembryonic Antigen Related Cell Adhesion Molecule 6) - Potential Therapeutic Target
- Signaling Pathways & Mechanisms: CEACAM6 is a glycosylphosphatidylinositol-anchored cell surface protein involved in cell adhesion, anti-apoptosis, and proliferation. It can activate signaling pathways like ERK and AKT, promoting cancer cell survival and resistance to chemotherapy [PubMed Search: CEACAM6 cancer drug resistance].
- Therapeutic Agents: Investigational antibodies and ADCs targeting CEACAM6 are in preclinical development.
- Supporting Evidence: Overexpression of CEACAM6 is observed in various cancers, including lung adenocarcinoma, and is associated with tumor progression and drug resistance.
Squamous Cell Carcinoma-Specific Markers (Established & Potential Therapeutic Targets)
- EGFR (Epidermal Growth Factor Receptor) - Established Therapeutic Target
- Signaling Pathways & Mechanisms: EGFR is a receptor tyrosine kinase that, upon ligand binding, activates downstream pathways such as RAS/MAPK, PI3K/AKT, and JAK/STAT, leading to cell proliferation, survival, angiogenesis, and metastasis. EGFR gene amplification and activating mutations are major oncogenic drivers [PubMed Search: EGFR lung cancer therapy].
- Therapeutic Agents: Tyrosine kinase inhibitors (TKIs) like erlotinib, gefitinib, osimertinib, and monoclonal antibodies like cetuximab or necitumumab are approved for lung cancer, particularly Squamous NSCLC (necitumumab) or NSCLC with activating EGFR mutations.
- Supporting Evidence: EGFR is highly expressed and often amplified in squamous cell lung carcinoma. While activating mutations are more common in adenocarcinoma, EGFR overexpression and copy number alterations are significant in Squamous, making it a critical target.
- CD44 (CD44 Antigen) - Established Therapeutic Target/Marker
- Signaling Pathways & Mechanisms: CD44 is a cell adhesion molecule and a major receptor for hyaluronan. It plays critical roles in cell migration, invasion, proliferation, and survival, often associated with cancer stem cell properties. Different splice variants (e.g., CD44v6) contribute to distinct functions and signaling via pathways like Wnt/β-catenin and STAT3 [PubMed Search: CD44 cancer stem cells].
- Therapeutic Agents: Investigational antibodies targeting CD44 or specific splice variants are in preclinical and early clinical development.
- Supporting Evidence: CD44 is highly expressed in squamous cell carcinomas, including lung SqCC, and is considered a marker of cancer stem-like cells, contributing to therapy resistance and recurrence.
- SDC1 (CD138) (Syndecan 1) - Established Therapeutic Target
- Signaling Pathways & Mechanisms: SDC1 is a heparan sulfate proteoglycan that acts as a co-receptor for growth factors and cytokines, influencing cell adhesion, proliferation, and migration. It can interact with growth factor receptors like FGFR and EGFR, modulating their signaling [PubMed Search: Syndecan-1 cancer signaling].
- Therapeutic Agents: Monoclonal antibodies targeting SDC1 (e.g., indatuximab ravtansine, anti-CD138 ADCs) are primarily investigated in multiple myeloma but have potential in solid tumors.
- Supporting Evidence: SDC1 is overexpressed in various epithelial cancers, including squamous cell carcinoma, and is associated with tumor aggressiveness and prognosis.
- SLC2A1 (GLUT1) (Solute Carrier Family 2 Member 1) - Potential Therapeutic Target
- Signaling Pathways & Mechanisms: GLUT1 is a glucose transporter responsible for basal glucose uptake. Its overexpression in cancer cells reflects the Warburg effect, where cells rely heavily on glycolysis for energy, and it is a key metabolic vulnerability [PubMed Search: GLUT1 cancer metabolism].
- Therapeutic Agents: Inhibitors of glucose metabolism, including GLUT1 inhibitors, are under preclinical and clinical investigation as anti-cancer agents.
- Supporting Evidence: High GLUT1 expression is characteristic of many aggressive cancers, including squamous cell lung carcinoma, and is linked to poor prognosis. It serves as a metabolic target.
- FGFR2 (Fibroblast Growth Factor Receptor 2) - Established Therapeutic Target
- Signaling Pathways & Mechanisms: FGFR2 is a receptor tyrosine kinase involved in crucial cellular processes such as proliferation, differentiation, survival, and angiogenesis. Activating mutations, fusions, or amplifications of FGFR2 drive oncogenesis by constitutively activating downstream pathways like RAS/MAPK and PI3K/AKT [PubMed Search: FGFR2 lung cancer therapy].
- Therapeutic Agents: FGFR inhibitors (e.g., pemigatinib, futibatinib) are approved for FGFR-driven cancers (e.g., cholangiocarcinoma) and are being investigated in lung cancers with FGFR alterations.
- Supporting Evidence: While less common than EGFR, FGFR alterations (amplifications, fusions) can occur in lung squamous cell carcinoma and other NSCLC subtypes, making FGFR2 a relevant therapeutic target in subsets of patients.
Clinical or Translational Implications
The identification of highly expressed, condition-specific surfaceome markers in Lung Epithelial tumor cells holds significant clinical and translational implications:
- Diagnostic and Prognostic Biomarkers: Markers like MUC1, TACSTD2, EPCAM for Adeno, and CD44, SDC1, EGFR, FGFR2, SLC2A1 for Squamous, could serve as highly specific diagnostic or prognostic markers for distinguishing between lung adenocarcinoma and squamous cell carcinoma, potentially even at early stages or via liquid biopsy.
- Targeted Therapy Development: The distinct surfaceome profiles offer opportunities for developing novel, subtype-specific targeted therapies. For instance, ADCs targeting TROP2 (Adeno) or GPNMB (Squamous) could deliver cytotoxic payloads specifically to tumor cells, minimizing off-target toxicity.
- Patient Stratification: These markers can be used to stratify patients for clinical trials or to guide treatment decisions, ensuring that therapies are directed to patients most likely to respond based on the molecular profile of their tumor.
- Immunotherapy Combinations: Surface markers often play roles in immune evasion (e.g., MUC1, CEACAM6, CD44). Targeting these markers could enhance the efficacy of existing immunotherapies or provide new avenues for immune-oncology strategies.
- Overcoming Resistance: Understanding the signaling pathways associated with these surface markers can help develop combination therapies to overcome resistance mechanisms to current treatments, particularly for established targets like EGFR.
- Drug Repurposing: For markers like SDC1 and FGFR2, which already have approved or investigational therapies in other cancers, these findings suggest potential for repurposing existing drugs for specific subsets of lung cancer patients.
16. Macrophage Condition-Specific Surfaceome Markers in Lung Adenocarcinoma vs. Squamous Cell Carcinoma
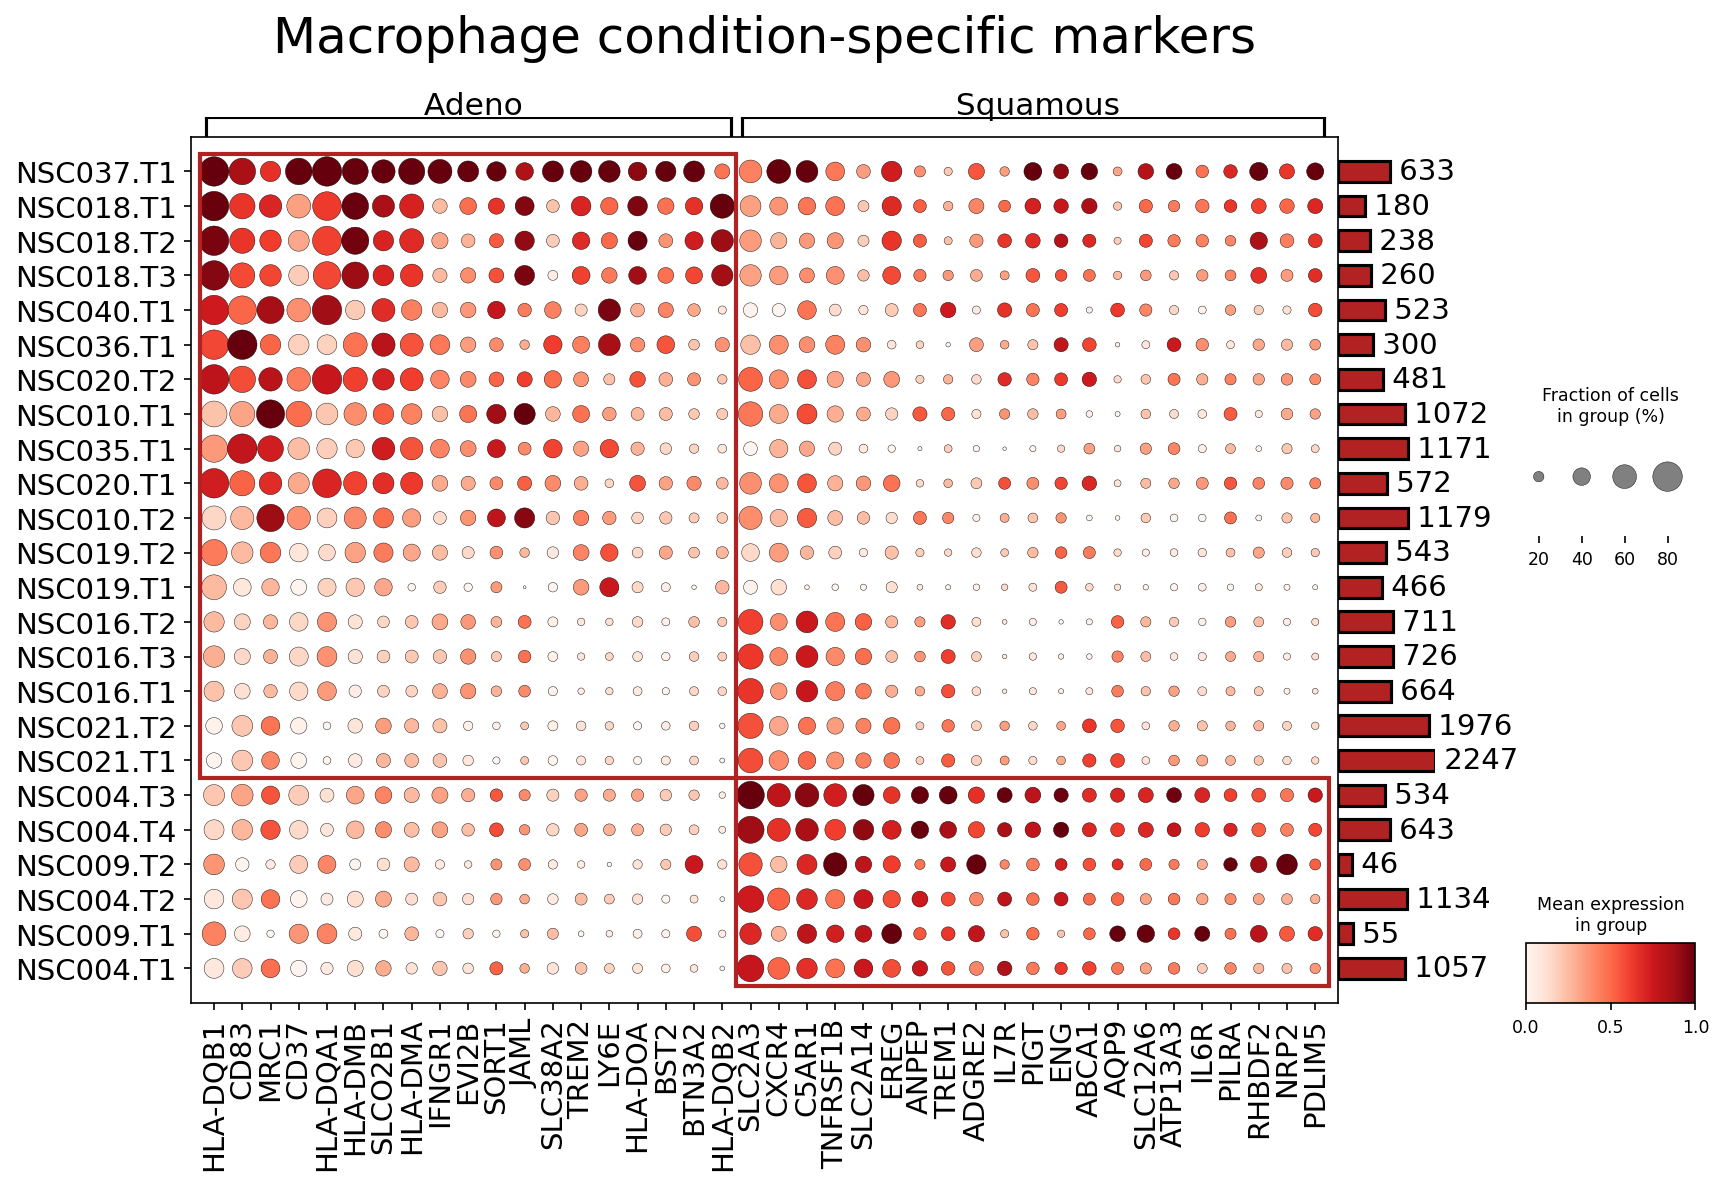
[Analysis Visualization Results]...
Analysis Overview
This analysis identifies and visualizes surfaceome markers specifically expressed by Macrophage cells in lung cancer, comparing Adenocarcinoma (Adeno) and Squamous Cell Carcinoma (Squamous) conditions. The dot plot displays mean expression levels and the fraction of cells expressing each marker across individual patient samples within each cancer subtype. This approach aims to uncover subtype-specific macrophage phenotypes that could serve as diagnostic biomarkers or therapeutic targets.
Visual Summary
The dot plot categorizes macrophage markers into two main groups: those predominantly expressed in Adenocarcinoma and those in Squamous Cell Carcinoma.
- Adenocarcinoma-associated markers: A distinct set of markers, including HLA-DQB1, CD83, MRC1, CD37, HLA-DOA1, HLA-DMB, SLC02B1, HLA-DMA, IFNGR1, SORT1, JAML, SLC33A2, and TREM2, show higher mean expression (darker red color) and often a higher fraction of expressing cells (larger dot size) in Macrophages from Adeno samples (top section of the plot). There is variability in marker expression across individual Adeno samples, but a general trend of higher expression for these markers is evident.
- Squamous Cell Carcinoma-associated markers: Conversely, markers such as C5AR1, TNFRSF1B, SLC2A14, CXCR4, EREG, ANPEP, TREM1, ADGRE2, PIGT, ENG, ABCA1, AQP9, SLC12A6, ATP13A3, IL6R, PILRA, NRP2, and PDLIM5 exhibit stronger expression and prevalence in Macrophages derived from Squamous samples (bottom section of the plot). Similar to Adeno, there is sample-to-sample heterogeneity in expression.
- Overall Pattern: The visualization clearly distinguishes two macrophage phenotypic profiles that are largely specific to either Adenocarcinoma or Squamous Cell Carcinoma, indicating distinct tumor microenvironment (TME) influences on macrophage populations in these lung cancer subtypes. The number of cells per sample group (right bar plot) varies, but the marker expression and fraction are normalized per group.
Biological Interpretation
The differential expression of surfaceome markers on macrophages highlights distinct functional states and roles in the TME of lung Adenocarcinoma and Squamous Cell Carcinoma. These markers provide insights into macrophage polarization, immune regulatory functions, and interactions with tumor cells.
Macrophage Markers Predominant in Lung Adenocarcinoma
Macrophages in Adenocarcinoma samples show elevated expression of markers often associated with antigen presentation and M2-like functions, but also some immune activation markers.
- HLA-DQB1, HLA-DOA1, HLA-DMB, HLA-DMA, HLA-DQB2 (MHC Class II molecules): These major histocompatibility complex (MHC) class II genes are crucial for antigen presentation to CD4+ T cells. Elevated expression suggests an active role in antigen processing and presentation, which can be part of an anti-tumor immune response or, in the context of tumor-associated macrophages (TAMs), can contribute to immune tolerance by presenting self-antigens or by inducing T-cell anergy/exhaustion.
- Signaling Pathways: Antigen presentation pathway, T-cell receptor signaling.
- TME Role: Can facilitate or subvert T-cell responses. High MHC-II on TAMs can be associated with M2-like polarization in some contexts, promoting T cell suppression. GeneCards: HLA-DQB1
- MRC1 (CD206): The Mannose Receptor 1 is a well-established marker for M2 macrophages, which are typically immunosuppressive and pro-tumorigenic. It is involved in pathogen recognition, endocytosis, and immune evasion.
- Signaling Pathways: Phagocytosis, endocytosis, innate immunity.
- TME Role: Promotes immune suppression, angiogenesis, tissue remodeling, and tumor growth. UniProt: MRC1
- TREM2: Triggering Receptor Expressed on Myeloid Cells 2 is implicated in phagocytosis of cellular debris, lipid metabolism, and promoting an immunosuppressive microenvironment in cancer. It is often associated with TAMs and M2-like polarization, driving tumor growth and metastasis.
- Signaling Pathways: DAP12 signaling, phagocytosis, lipid metabolism.
- TME Role: Contributes to immune evasion, tumor growth, and metastasis by fostering M2-like macrophage functions. GeneCards: TREM2
- IFNGR1: Interferon Gamma Receptor 1. Macrophages expressing IFNGR1 can respond to IFN-gamma, a key cytokine in anti-tumor immunity. However, chronic IFN-gamma signaling in the TME can also lead to macrophage exhaustion or reprogram them to a pro-tumor phenotype.
- Signaling Pathways: JAK-STAT pathway, IFN-gamma signaling.
- TME Role: Crucial for macrophage activation, but its role can be context-dependent, potentially contributing to either anti-tumor or pro-tumor responses based on other TME signals. UniProt: IFNGR1
Macrophage Markers Predominant in Lung Squamous Cell Carcinoma
Macrophages in Squamous Cell Carcinoma samples show enrichment for markers associated with inflammatory responses, chemotaxis, and pro-tumorigenic signaling pathways.
- C5AR1 (CD88): Complement C5a Receptor 1 is activated by C5a, a potent anaphylatoxin that mediates inflammation and immune cell recruitment. C5a-C5aR1 signaling on macrophages can promote an immunosuppressive and pro-tumorigenic phenotype.
- Signaling Pathways: G-protein coupled receptor signaling, complement system, inflammation.
- TME Role: Contributes to chronic inflammation, angiogenesis, and M2 polarization of TAMs, thereby fostering tumor progression. GeneCards: C5AR1
- TNFRSF1B (TNFR2): Tumor Necrosis Factor Receptor Superfamily Member 1B (TNFR2) mediates pro-survival and anti-apoptotic signals. Its expression on myeloid cells is often associated with immune suppression and promotion of tumor growth and metastasis.
- Signaling Pathways: NF-$\kappa$B pathway, MAPK pathway, cell survival signaling.
- TME Role: Promotes TAM survival and can contribute to M2 polarization and T-cell suppression. UniProt: TNFRSF1B
- CXCR4: Chemokine (C-X-C motif) Receptor 4 is a receptor for CXCL12 (SDF-1) and plays a critical role in cell migration, homing, and angiogenesis. High CXCR4 on TAMs can facilitate their recruitment to the tumor and promote metastasis.
- Signaling Pathways: G-protein coupled receptor signaling, cell migration, angiogenesis.
- TME Role: Essential for macrophage recruitment, promotes angiogenesis, and facilitates tumor cell invasion and metastasis. GeneCards: CXCR4
- EREG (Epiregulin): An EGF family member that acts as a ligand for the EGFR receptor. EREG signaling can stimulate cell proliferation, survival, and angiogenesis.
- Signaling Pathways: EGFR signaling, MAPK/AKT pathways.
- TME Role: Can promote tumor growth and modulate TAM functions, potentially contributing to a pro-tumor phenotype.
- TREM1: Triggering Receptor Expressed on Myeloid Cells 1. Unlike TREM2, TREM1 is generally considered a pro-inflammatory receptor that amplifies immune responses. Its role in cancer is complex, but in some contexts, it contributes to chronic inflammation that can support tumor progression.
- Signaling Pathways: DAP12 signaling, inflammatory pathways.
- TME Role: Can contribute to the inflammatory milieu within the tumor, which may promote tumor growth in chronic settings. GeneCards: TREM1
- IL6R (CD126): Interleukin-6 Receptor is the alpha subunit of the receptor for IL-6, a pleiotropic cytokine involved in inflammation, immunity, and hematopoiesis. IL-6/IL6R signaling is often pro-tumorigenic in the TME, promoting TAM polarization and tumor cell survival.
- Signaling Pathways: JAK-STAT pathway, MAPK/AKT pathways, IL-6 signaling.
- TME Role: Drives inflammation, M2-like polarization of macrophages, and supports tumor cell proliferation and survival. UniProt: IL6R
- ENG (CD105): Endoglin is a co-receptor for TGF-$\beta$ and is highly expressed on activated endothelial cells, but also on certain immune cells, including some TAM populations. It plays a significant role in angiogenesis and immune regulation.
- Signaling Pathways: TGF-$\beta$ signaling, angiogenesis.
- TME Role: Promotes tumor angiogenesis and can contribute to immunosuppression. GeneCards: ENG
- NRP2 (Neuropilin-2): A co-receptor for VEGF and semaphorins, NRP2 is involved in angiogenesis, lymphangiogenesis, and neuronal guidance. Its expression on macrophages in the TME can facilitate vessel formation and immune cell trafficking.
- Signaling Pathways: VEGF signaling, semaphorin signaling.
- TME Role: Promotes tumor angiogenesis, lymphangiogenesis, and can influence macrophage migration and function within the TME. UniProt: NRP2
Clinical or Translational Implications
The identification of condition-specific surfaceome markers on macrophages in lung Adenocarcinoma and Squamous Cell Carcinoma offers significant clinical and translational potential.
- Subtype-Specific Biomarkers: These distinct macrophage phenotypes, as characterized by their surface marker expression, could serve as diagnostic or prognostic biomarkers for distinguishing lung cancer subtypes or predicting disease progression. Immunohistochemistry or flow cytometry on tumor biopsies could be used to assess the prevalence of macrophages expressing these markers.
- Therapeutic Targets for Macrophage Reprogramming: Given the critical role of TAMs in cancer progression and immune evasion, targeting these condition-specific markers presents an opportunity for novel therapeutic strategies.
Adenocarcinoma-Specific Targets:
- MRC1 (CD206): As a classic M2 marker, targeting MRC1+ macrophages could involve antibody-drug conjugates (ADCs) to deplete pro-tumor TAMs or inhibitors to reprogram their function.
- TREM2: Blocking TREM2 activity with antibodies or small molecules could convert immunosuppressive TAMs into anti-tumorigenic phenotypes, enhancing immunotherapy efficacy. PubMed Search: TREM2 cancer therapy
- MHC Class II: While complex, strategies to enhance effective antigen presentation by TAMs or to mitigate their immunosuppressive functions through MHC-II modulation could be explored.
Squamous Cell Carcinoma-Specific Targets:
- C5AR1: Antagonists of C5aR1 are in clinical development for inflammatory diseases and cancer (e.g., Avacopan), aiming to reduce pro-tumor inflammation and immunosuppression. PubMed Search: C5AR1 antagonist cancer
- CXCR4: CXCR4 inhibitors (e.g., Plerixafor) are approved for stem cell mobilization and are being investigated in various cancers to block TAM recruitment and metastasis. PubMed Search: CXCR4 inhibitor cancer
- TNFRSF1B (TNFR2): Blocking TNFR2 on TAMs could reduce their survival and immunosuppressive activity, offering a strategy to improve anti-tumor immunity. PubMed Search: TNFR2 blockade cancer
- IL6R: Antibodies against IL-6R (e.g., Tocilizumab) are used in inflammatory conditions and are being tested in cancer to curb pro-tumor inflammation. PubMed Search: IL6R antibody cancer
- ENG (CD105): Targeting Endoglin, particularly on TAMs, could offer an anti-angiogenic and immune-modulatory approach. PubMed Search: Endoglin cancer therapy
- Combination Therapies: Understanding these macrophage phenotypes can inform rational design of combination therapies, pairing immune checkpoint inhibitors with agents that reprogram TAMs to enhance therapeutic responses in a subtype-specific manner.
- Experimental Validation: Further experimental validation using spatial transcriptomics, multiplex immunofluorescence, or functional assays in relevant in vitro and in vivo models is crucial to confirm the specific roles of these markers and their associated pathways in the respective lung cancer subtypes.
17. Fibroblast Condition-Specific Surfaceome Marker Expression in Lung Cancer
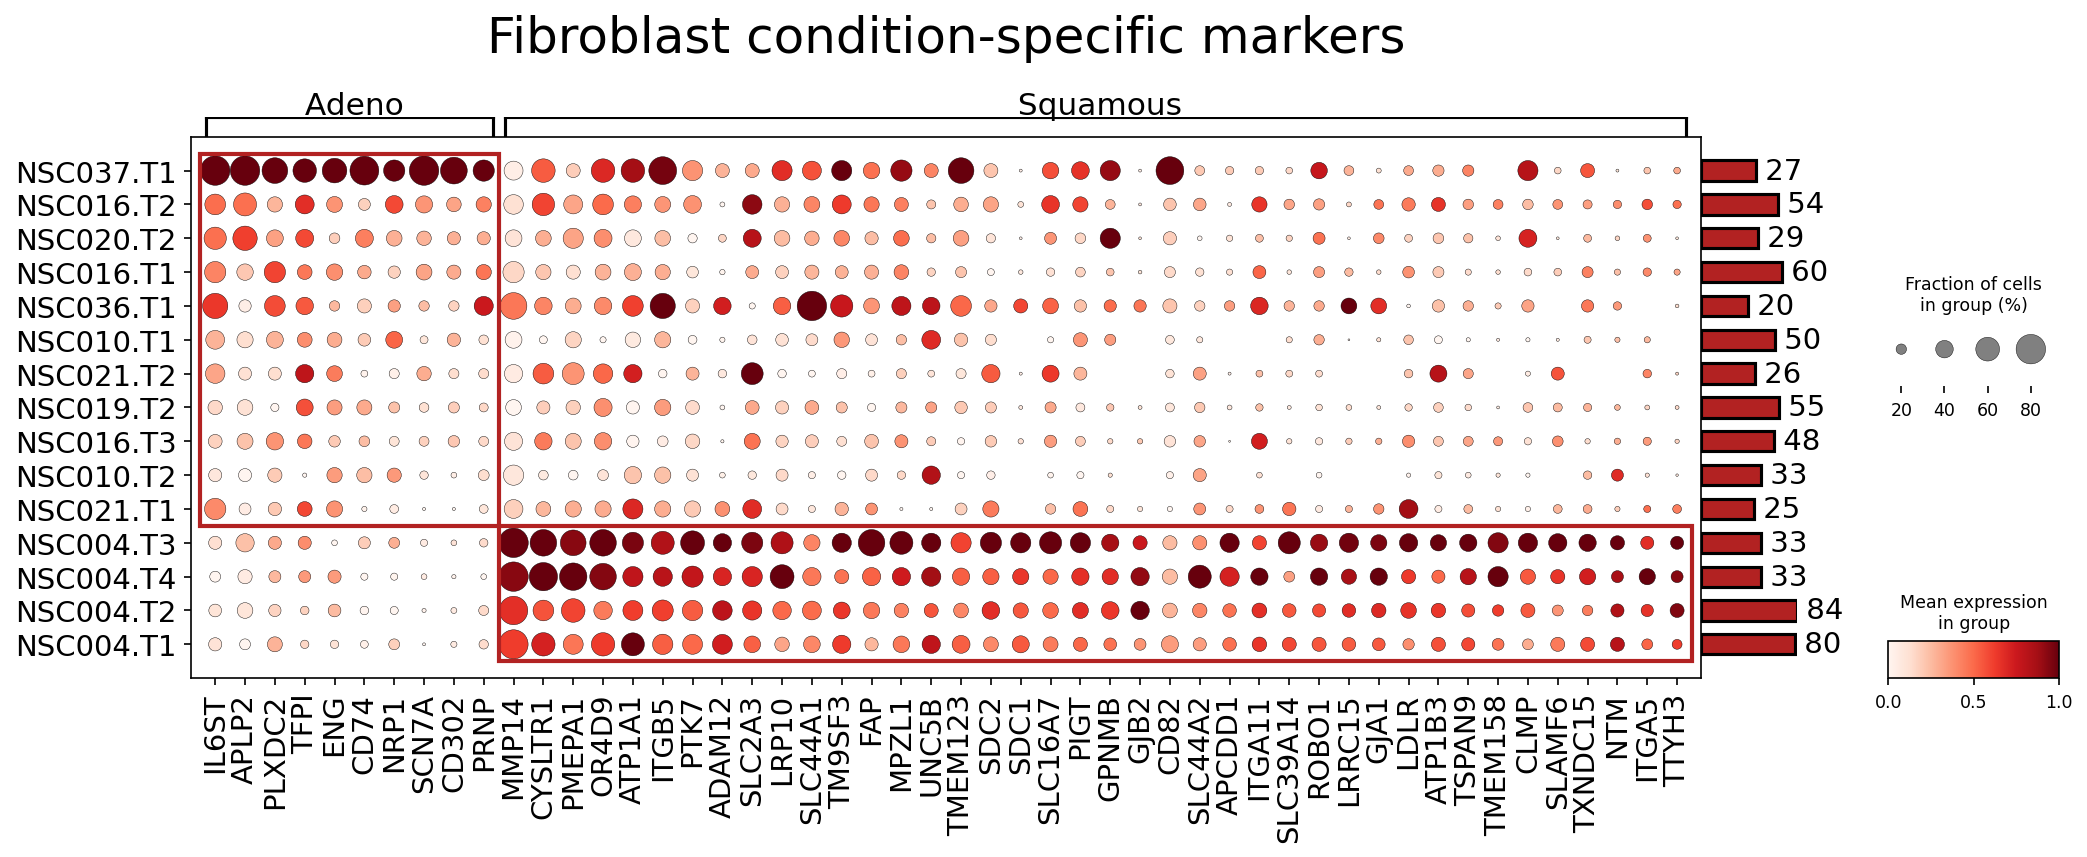
[Analysis Visualization Results]...
Analysis Overview
This analysis identifies and visualizes surfaceome markers differentially expressed by Fibroblast cells across Adenocarcinoma (Adeno) and Squamous Cell Carcinoma (Squamous) conditions in lung tissue. The dot plot displays the mean expression level (color intensity) and the fraction of cells expressing each marker (dot size) for individual samples within each condition. The focus is on identifying potential cell-type-specific therapeutic targets and understanding the distinct roles of fibroblasts in the tumor microenvironment (TME) of these two major lung cancer subtypes. The markers were selected based on differential expression analysis, with a specific filter for surfaceome proteins.
Visual Summary
The dot plot, titled "Fibroblast condition-specific markers," clearly segregates samples by their primary tumor type: Adeno and Squamous.
- Condition-Specific Clustering: A distinct pattern of marker expression is observed, with markers largely clustering into two groups corresponding to the Adeno and Squamous conditions.
- The upper red box highlights a set of markers predominantly expressed in Fibroblasts from Adeno samples. Samples like NSC037.T1, NSC016.T2, and NSC020.T2 show high expression and cell fraction for markers such as IL6ST, APLP2, PLXDC2, TFPI, ENG, CD74, NRP1, SCN7A, CD302, and PRNP. The expression levels and fractions vary among Adeno samples, indicating heterogeneity.
- The lower red box delineates a larger cluster of markers strongly expressed in Fibroblasts from Squamous samples (NSC004.T3, NSC004.T4, NSC004.T2, NSC004.T1). These samples consistently display high mean expression and a large fraction of cells expressing markers like MMP14, CYSLTR1, PMEPA1, OR4D9, ATP1A1, ITGB5, PTK7, ADAM12, SLC2A3, LRP10, SLC44A1, TM9SF3, FAP, UNC5B, MPZL1, SDC2, TMEM123, SDC1, SLC16A7, PIGT, GPNMB, CD82, GJB2, APCDD1, SLC44A2, ITGA11, OSMR, TMEM30A, CLSTN1, SLC39A14, LRRC15, ROBO1, GJA1, LDLR, C5orf15, ATP1B3, TSPAN9, FZD1, TMEM158, and MYOF. This suggests a more robust and uniform fibroblast signature in these Squamous samples compared to Adeno samples in this dataset.
- Heterogeneity within Conditions: While clear condition-specific patterns emerge, there is still sample-to-sample variability within both Adeno and Squamous groups in terms of marker expression levels and cell fractions. For instance, in the Adeno group, NSC037.T1 shows very strong expression for many markers, while NSC010.T1 shows weaker expression for the same markers.
- Low-Level Overlap: A few markers might show some background or lower-level expression in the "non-specific" condition, but the overall trend highlights distinct signatures.
Biological Interpretation
Fibroblasts, particularly Cancer-Associated Fibroblasts (CAFs), are critical components of the tumor microenvironment (TME) and play diverse roles in cancer progression, metastasis, angiogenesis, and immune modulation. The distinct surfaceome signatures observed here suggest that CAFs adopt different phenotypes and contribute to lung Adenocarcinoma and Squamous Cell Carcinoma through unique mechanisms.
Markers Enriched in Adenocarcinoma-Associated Fibroblasts
Several surfaceome markers show enrichment in Fibroblasts from Adeno samples, indicating potential distinct roles in this lung cancer subtype.
IL6ST (gp130)
- Signaling Pathways: IL6ST is the common signal-transducing subunit for the IL-6 family of cytokines (e.g., IL-6, Oncostatin M, LIF). It mediates signaling through the JAK/STAT, MAPK, and PI3K/AKT pathways, promoting cell proliferation, survival, and inflammation. GeneCards: IL6ST
- Role in TME: CAF-expressed IL6ST can mediate pro-tumorigenic effects by responding to inflammatory cytokines, contributing to immune suppression, promoting tumor cell growth, and extracellular matrix remodeling. Its activation can fuel tumor-stroma crosstalk.
- Therapeutic Potential: Targeting the IL-6/JAK/STAT pathway, which heavily relies on IL6ST, is a known strategy in several inflammatory diseases and cancers. Given its surface location, it could be accessible for antibody-based therapies or small molecule inhibitors blocking its activation.
- Relevant Therapeutic Agents: Anti-IL-6 receptor antibodies (e.g., Tocilizumab) or JAK inhibitors (e.g., Ruxolitinib) are approved for other conditions and are being investigated in cancer. Direct targeting of IL6ST on CAFs could be explored.
ENG (CD105)
- Signaling Pathways: Endoglin (CD105) is a co-receptor for TGF-β, primarily modulating TGF-β1, TGF-β3, and activin signaling. It influences Smad-dependent and Smad-independent pathways, affecting angiogenesis, cell proliferation, and extracellular matrix production. GeneCards: ENG
- Role in TME: CAFs expressing ENG are often associated with pro-angiogenic activity and increased TGF-β signaling, promoting fibrosis, immune suppression, and tumor growth in the TME. Its presence on activated fibroblasts can mark a pro-tumorigenic subset.
- Therapeutic Potential: ENG is recognized as a marker of activated endothelial cells and CAFs in many cancers, making it an attractive anti-angiogenic and anti-fibrotic target.
- Relevant Therapeutic Agents: TRC105 (Carotuximab) is a humanized monoclonal antibody targeting ENG, which has been evaluated in clinical trials for various solid tumors, including lung cancer, often in combination with anti-angiogenic agents.
CD74
- Signaling Pathways: CD74 acts as an invariant chain for MHC class II molecules but also serves as a receptor for macrophage migration inhibitory factor (MIF) and is involved in B-cell receptor signaling. It can activate NF-κB and MAPK pathways. GeneCards: CD74
- Role in TME: While commonly associated with immune cells, CD74 expression on CAFs can contribute to chronic inflammation and immune evasion by interacting with MIF. It can also support CAF proliferation and survival.
- Therapeutic Potential: CD74 has been explored as a therapeutic target in hematological malignancies. Its expression on CAFs in lung adenocarcinoma suggests a broader role and potential for targeting the MIF-CD74 axis in the TME.
- Relevant Therapeutic Agents: Milatuzumab, an anti-CD74 monoclonal antibody, has been investigated for lymphomas and leukemias. Its potential in solid tumors via CAF targeting warrants further investigation.
NRP1 (Neuropilin-1)
- Signaling Pathways: NRP1 is a co-receptor for various ligands, including VEGF-A (VEGF receptor pathway), semaphorins (plexin receptor pathway), and other growth factors like PDGF and FGF. It is crucial for angiogenesis, neuronal guidance, and immune regulation. GeneCards: NRP1
- Role in TME: CAFs expressing NRP1 can enhance angiogenesis and tumor growth by modulating VEGF signaling and promoting an immunosuppressive environment. It can also facilitate crosstalk between tumor cells and stromal cells.
- Therapeutic Potential: NRP1 is a promising target due to its role in multiple pro-tumorigenic processes. Targeting NRP1 could inhibit angiogenesis, reduce tumor growth, and potentially re-sensitize tumors to immunotherapy.
- Relevant Therapeutic Agents: Antibodies and peptides targeting NRP1 are under investigation to disrupt its interactions with VEGF and other ligands, aiming to block tumor growth and metastasis.
Markers Enriched in Squamous Cell Carcinoma-Associated Fibroblasts
The Squamous-associated fibroblasts exhibit a broad and robust signature of highly expressed surfaceome markers, pointing to distinct mechanisms of TME contribution.
MMP14 (MT1-MMP)
- Signaling Pathways: Matrix metalloproteinase 14 is a membrane-bound protease that degrades extracellular matrix components (e.g., collagen, fibronectin). It activates other MMPs (like MMP2) and growth factors, contributing to tissue remodeling and cell invasion. GeneCards: MMP14
- Role in TME: CAFs are a major source of MMPs. High MMP14 expression indicates aggressive TME remodeling, facilitating tumor cell invasion, angiogenesis, and metastasis. It can also release sequestered growth factors, promoting tumor cell proliferation.
- Therapeutic Potential: Targeting MMP14 could inhibit tumor invasion and metastasis. Given its surface location, it is a direct target for enzyme inhibition or antibody-mediated blockade.
- Relevant Therapeutic Agents: Pan-MMP inhibitors have faced challenges in clinical trials due to toxicity and lack of specificity. However, more specific MMP14 inhibitors or antibodies are under development to overcome these limitations.
ITGB5 (Integrin Beta 5)
- Signaling Pathways: Integrin Beta 5 forms heterodimers with ITGAV (alpha V integrin) to bind components of the extracellular matrix (ECM) like vitronectin and fibronectin. It activates focal adhesion kinase (FAK) and Src pathways, influencing cell adhesion, migration, and proliferation. GeneCards: ITGB5
- Role in TME: CAFs expressing ITGB5 contribute to altered cell-ECM interactions, promoting a stiffer, more pro-tumorigenic microenvironment that facilitates tumor cell invasion and survival. It can also modulate TGF-β activation.
- Therapeutic Potential: Integrins are well-established therapeutic targets, especially in angiogenesis and metastasis. Targeting ITGB5 on CAFs could disrupt critical adhesion and signaling pathways that support tumor growth and spread.
- Relevant Therapeutic Agents: Integrin antagonists, including antibodies and small molecules, have been developed for various conditions. Specific targeting of ITGB5 could be explored for lung SCC.
FAP (Fibroblast Activation Protein)
- Signaling Pathways: FAP is a serine protease that cleaves ECM proteins and also has dipeptidyl peptidase activity. It can modulate growth factor signaling (e.g., FGF-2, TGF-β) and contribute to ECM remodeling. GeneCards: FAP
- Role in TME: FAP is a classic marker of activated CAFs in virtually all solid tumors, including lung cancer. FAP-positive CAFs promote tumor growth, angiogenesis, immune suppression, and metastasis by remodeling the ECM and secreting pro-tumorigenic factors.
- Therapeutic Potential: FAP is an extremely attractive and widely investigated target due to its restricted expression in adult healthy tissues and high expression on CAFs in tumors. Targeting FAP can reduce tumor growth, metastasis, and improve chemotherapy efficacy.
- Relevant Therapeutic Agents: Numerous FAP-targeted strategies are in development, including FAP-targeting antibodies (e.g., Sibrotuzumab), FAP-activated prodrugs, FAP-targeting CAR T-cells, and FAP-targeted radionuclide therapies.
SDC1 (Syndecan-1)
- Signaling Pathways: SDC1 is a heparan sulfate proteoglycan that interacts with various growth factors (e.g., FGF, HGF, VEGF), chemokines, and ECM components. It acts as a co-receptor, modulating receptor tyrosine kinase signaling (e.g., FGFR, HGFR, VEGFR) and adhesion pathways. GeneCards: SDC1
- Role in TME: CAFs expressing SDC1 can facilitate the retention and activation of growth factors, contributing to tumor cell proliferation, angiogenesis, and immune modulation. It is often shed from the cell surface, and soluble SDC1 can also have pro-tumorigenic effects.
- Therapeutic Potential: SDC1 is overexpressed in many cancers and is associated with poor prognosis. Targeting SDC1 could disrupt growth factor signaling and cell-matrix interactions critical for tumor progression.
- Relevant Therapeutic Agents: Anti-SDC1 antibodies and strategies to inhibit SDC1 shedding are being explored as potential therapeutic interventions.
GPNMB (Osteoactivin)
- Signaling Pathways: Glycoprotein NMB is a transmembrane protein that promotes cell growth, migration, and invasion. It can activate the FAK-Src pathway and PI3K/AKT signaling. GeneCards: GPNMB
- Role in TME: GPNMB is expressed in various tumor cells and associated stromal cells. In CAFs, it can contribute to tumor progression by supporting cell survival and invasiveness, and influencing the immune microenvironment.
- Therapeutic Potential: GPNMB is a known target in melanoma and breast cancer. Its expression on CAFs in lung SCC makes it a relevant candidate for targeted therapy to inhibit stromal support for tumor growth.
- Relevant Therapeutic Agents: Glembatumumab vedotin (CDX-011) is an antibody-drug conjugate (ADC) targeting GPNMB, which has been investigated in melanoma and breast cancer.
LRRC15
- Signaling Pathways: Leucine rich repeat containing 15 is a transmembrane protein identified as a receptor for collagen and a binding partner for multiple extracellular matrix proteins. It has been implicated in cell adhesion and invasion, potentially modulating TGF-β signaling. GeneCards: LRRC15
- Role in TME: LRRC15 is a recently identified CAF marker that has been shown to promote tumor progression, metastasis, and to create an immunosuppressive microenvironment. It may play a role in collagen alignment and ECM stiffening.
- Therapeutic Potential: As a novel CAF-specific target, LRRC15 offers a promising avenue for disrupting CAF-mediated tumor support, especially in tumors where it is highly expressed on CAFs, such as lung SCC.
- Relevant Therapeutic Agents: Research is ongoing, but therapeutic strategies could include antibodies blocking LRRC15 function or ADCs targeting LRRC15-positive CAFs.
FZD1 (Frizzled-1)
- Signaling Pathways: Frizzled-1 is a receptor for Wnt proteins, mediating both canonical (β-catenin-dependent) and non-canonical Wnt signaling pathways. These pathways regulate cell proliferation, differentiation, migration, and stem cell maintenance. GeneCards: FZD1
- Role in TME: CAFs can contribute to Wnt signaling within the TME, either by secreting Wnt ligands or by expressing Frizzled receptors. FZD1 expression on CAFs suggests their involvement in Wnt-driven processes that promote tumor growth, self-renewal, and immune evasion in lung SCC.
- Therapeutic Potential: The Wnt pathway is a crucial oncogenic pathway. Targeting FZD1 on CAFs could inhibit Wnt signaling in the TME, thereby curbing tumor progression and potentially sensitizing tumor cells to other therapies.
- Relevant Therapeutic Agents: Small molecule inhibitors and antibodies against Frizzled receptors or Wnt ligands are being developed for various cancers. Targeting FZD1 specifically on CAFs could be a strategy.
Clinical or Translational Implications
The distinct surfaceome marker profiles of Fibroblasts in Lung Adenocarcinoma versus Squamous Cell Carcinoma have significant translational implications for personalized medicine and TME-targeted therapies.
- Subtype-Specific CAF Targeting: The findings suggest that a "one-size-fits-all" approach to targeting CAFs in lung cancer may be suboptimal. Therapies directed against ENG or IL6ST might be more effective in Adenocarcinoma, while agents targeting FAP, MMP14, ITGB5, SDC1, GPNMB, LRRC15, or FZD1 could be more impactful in Squamous Cell Carcinoma. This provides a rationale for developing and testing subtype-specific CAF-targeted therapies.
- Biomarker Development: These differentially expressed surfaceome markers could serve as diagnostic or prognostic biomarkers. For instance, high expression of FAP or LRRC15 on fibroblasts might indicate a more aggressive Squamous Cell Carcinoma, guiding treatment decisions. They could also be used to stratify patients for clinical trials of CAF-targeted therapies.
- Combination Therapies: Targeting CAFs often aims to normalize the TME, making tumors more susceptible to conventional chemotherapy, radiation, or immunotherapy. Identifying these specific CAF markers allows for rational design of combination therapies, pairing CAF-targeted agents with existing treatments, tailored to the specific lung cancer subtype. For example, in Squamous Cell Carcinoma, combining FAP inhibitors with immune checkpoint blockade could be particularly effective.
- Drug Repurposing and Novel Drug Discovery: Known therapeutic agents targeting pathways associated with these markers (e.g., IL-6/JAK/STAT, TGF-β, MMPs, Wnt) could be repurposed for lung cancer, specifically in the context of CAF modulation. Furthermore, these identified markers provide direct targets for novel antibody-drug conjugates (ADCs) or bispecific antibodies that selectively eliminate or reprogram pro-tumorigenic CAFs.
- Understanding Disease Pathogenesis: The distinct CAF signatures underscore the differing biological processes driven by the stromal compartment in Adenocarcinoma versus Squamous Cell Carcinoma, contributing to a deeper understanding of subtype-specific disease pathogenesis and therapeutic resistance mechanisms.
18. T cell CD4+ Condition-Specific Surfaceome Marker Expression in Squamous Lung Carcinoma
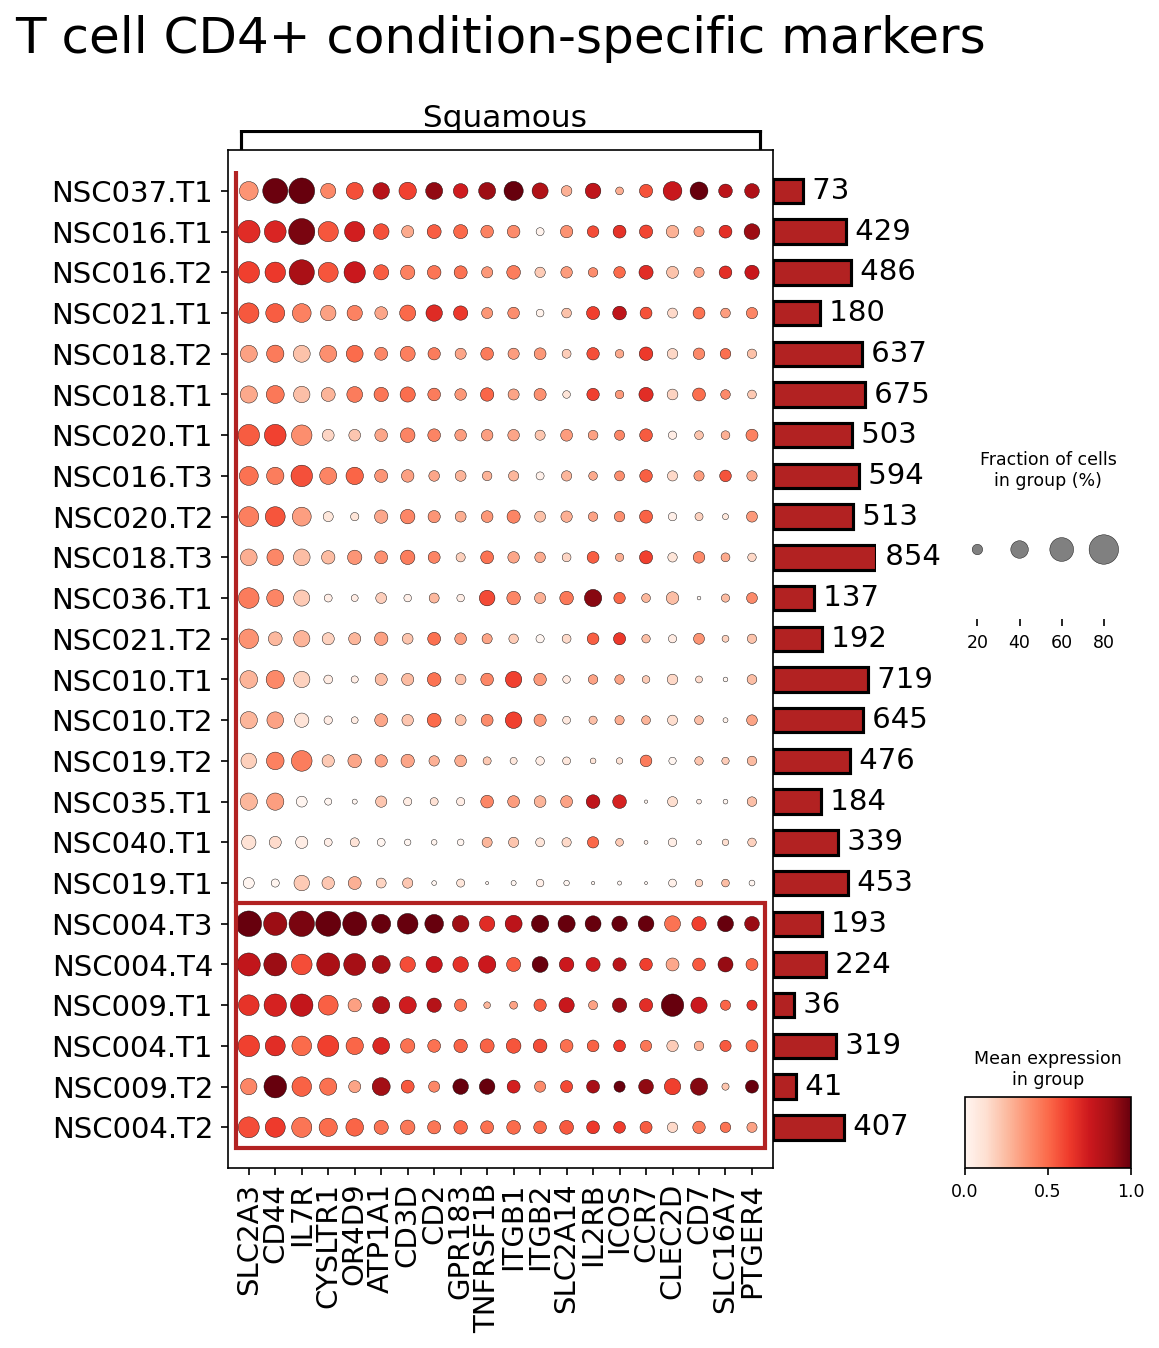
[Analysis Visualization Results]...
Analysis Overview
This analysis investigates the expression of surfaceome markers on CD4+ T cells across various individual tumor samples (identified by sample IDs, e.g., NSC037.T1) within the Squamous Cell Carcinoma (Squamous) condition of lung cancer. The dot plot visualizes both the mean expression level (color intensity, ranging from white for low to dark red for high) and the fraction of cells expressing each marker (dot size, ranging from small for low to large for high) for each sample. The goal is to identify cell-type-specific markers that might characterize CD4+ T cell phenotypes in this specific tumor microenvironment, offering insights into their biological roles and potential as therapeutic targets.
Visual Summary
The dot plot displays the expression profiles of 21 surfaceome markers across 24 distinct Squamous lung carcinoma samples. Each row represents a sample, and each column represents a marker. A bar chart on the right indicates the total number of CD4+ T cells per sample included in the analysis.
Key observations include:
- General Marker Expression: Most samples show expression of a core set of T cell markers such as CD3D, CD2, CD7, CD44, and IL7R, albeit with varying intensities and fractions of positive cells.
- Highly Expressed and Prevalent Markers: SLC2A3, CD44, CD3D, CD2, ITGB1, ITGB2, ICOS, CCR7, CD7, SLC16A7, and PTGER4 are frequently observed with high expression levels and/or in a large fraction of CD4+ T cells across many samples.
- Distinct Sample Cluster: A notable cluster of six samples (NSC004.T3, NSC004.T4, NSC009.T1, NSC004.T1, NSC009.T2, NSC004.T2), highlighted by a red box, exhibits a consistently high mean expression and high fraction of expressing cells for almost all tested markers. This suggests a distinct phenotypic state or activation profile of CD4+ T cells in these particular tumor samples, compared to the other samples in the Squamous group. Markers like ICOS, CCR7, PTGER4, and SLC16A7 show particularly strong signals in this group, often appearing with higher intensity and prevalence than in other samples.
- Lowly Expressed Markers: OR4D9 and CLEC2D generally show low expression and/or low prevalence across most samples.
Biological Interpretation
The observed marker expression patterns on CD4+ T cells in Squamous lung carcinoma samples provide insights into their activation, migration, metabolism, and potential functional states within the tumor microenvironment (TME). The distinct cluster of samples (e.g., NSC004 series) with broadly upregulated markers suggests a potentially unique immune context within these tumors.
Here's a detailed interpretation of several notable markers:
- CD3D, CD2, CD7: These are fundamental surface markers for T cells, part of the T cell receptor (TCR) complex (CD3D) or accessory molecules (CD2, CD7) involved in T cell activation and adhesion. Their consistent expression confirms the identity of these cells as CD4+ T lymphocytes. High expression, particularly in the highlighted cluster, underscores active T cell presence.
- Associated Signaling: CD3D is part of the TCR complex that initiates downstream signaling cascades (e.g., ZAP70, LCK, LAT) upon antigen recognition, leading to T cell activation, proliferation, and differentiation. CD2 enhances TCR signaling and plays a role in cell adhesion, while CD7 is a pan-T cell marker with roles in T cell development and activation.
- Role in TME: These markers indicate the presence of functional CD4+ T cells, which are crucial for orchestrating adaptive immune responses. Depending on their polarization (e.g., Th1, Th2, Th17, Treg), CD4+ T cells can promote anti-tumor immunity or contribute to immunosuppression.
- CD44: A cell adhesion molecule and receptor for hyaluronan, CD44 is broadly expressed on various immune cells. In T cells, it's often associated with activated, memory, or effector phenotypes, playing roles in T cell migration, activation, and survival. Its high expression suggests an active or memory state of CD4+ T cells in the Squamous TME, facilitating their interaction with the extracellular matrix and other cells.
- Associated Signaling: CD44 can interact with various ligands and signaling pathways (e.g., ERK, Akt) involved in cell proliferation, survival, and migration. [GeneCards CD44: GeneCards]
- Role in TME: High CD44 expression on tumor-infiltrating lymphocytes (TILs) in lung cancer can be associated with enhanced migration into the tumor and prolonged survival.
- ICOS (Inducible T-cell Co-stimulator): ICOS is a critical co-stimulatory receptor expressed on activated T cells, particularly T follicular helper (Tfh) cells and Th17 cells. It's crucial for sustained T cell activation, proliferation, and cytokine production. Its strong signal in the highlighted sample cluster suggests a highly activated or differentiated state of CD4+ T cells.
- Associated Signaling: Upon binding to its ligand, ICOSL, ICOS delivers positive co-stimulatory signals that enhance TCR-mediated activation, promote the differentiation of various helper T cell subsets, and sustain their effector functions. [GeneCards ICOS: GeneCards]
- Role in TME: The role of ICOS in the TME is complex, often associated with anti-tumor responses through promoting effector T cell function, but can also be expressed on regulatory T cells (Tregs) in some contexts. In lung cancer, ICOS+ CD4+ T cells can be enriched in TILs.
- CCR7 (C-C Chemokine Receptor Type 7): A chemokine receptor, CCR7 is critical for T cell homing to secondary lymphoid organs (SLOs) and for guiding central memory T cells. Its expression suggests that these CD4+ T cells may retain migratory capacity or represent a central memory phenotype capable of circulating and re-entering SLOs, or may be trafficking to specific regions within the tumor or draining lymph nodes.
- Associated Signaling: CCR7 binds to chemokines CCL19 and CCL21, activating G-protein coupled receptor signaling pathways that induce cell migration and chemotaxis. [GeneCards CCR7: GeneCards]
- Role in TME: While typically associated with homing to SLOs, CCR7 can also influence T cell positioning within the tumor. Its presence on TILs might suggest recent egress from lymphoid organs or a specific migratory phenotype within the TME.
- PTGER4 (Prostaglandin E2 Receptor EP4): PTGER4 is one of four receptors for Prostaglandin E2 (PGE2). PGE2 is a potent immunosuppressive mediator often abundant in the TME, promoting tumor growth and inhibiting anti-tumor immunity. High PTGER4 expression on CD4+ T cells makes them susceptible to PGE2-mediated suppression, which can inhibit effector functions and promote the development of regulatory T cells (Tregs).
- Associated Signaling: PTGER4 activates G-protein coupled signaling, primarily through Gs, leading to increased cAMP levels, which generally inhibits T cell proliferation and cytokine production. [GeneCards PTGER4: GeneCards]
- Role in TME: High PTGER4 expression suggests a vulnerability of these CD4+ T cells to immunosuppressive signals from the tumor and stromal cells, potentially leading to a dysfunctional anti-tumor response in Squamous lung carcinoma.
- ITGB1 (Integrin Beta-1, CD29) and ITGB2 (Integrin Beta-2, CD18): These are integrin subunits that form heterodimeric receptors involved in cell-extracellular matrix (ECM) and cell-cell adhesion. ITGB1 pairs with various alpha subunits (e.g., to form VLA-integrins) and mediates adhesion to ECM components like fibronectin and collagen. ITGB2 pairs with CD11a, CD11b, or CD11c to form leukocyte-specific integrins (e.g., LFA-1, MAC-1), critical for T cell adhesion to antigen-presenting cells (APCs) and endothelial cells. High expression indicates active adhesive capabilities and strong potential for interaction within the TME, crucial for T cell trafficking and immune synapse formation.
- Associated Signaling: Integrins link the ECM to the cytoskeleton, mediating outside-in and inside-out signaling that affects cell migration, proliferation, and survival. [GeneCards ITGB1: GeneCards], [GeneCards ITGB2: GeneCards]
- Role in TME: These integrins are essential for CD4+ T cell extravasation into the tumor, retention within the TME, and effective engagement with tumor cells or APCs.
- SLC2A3 (GLUT3): Glucose Transporter 3, a facilitative glucose transporter. Activated immune cells, including T cells, undergo significant metabolic reprogramming and increase glucose uptake to fuel their energy demands for proliferation and effector functions. Upregulation of SLC2A3 suggests a metabolically active state of CD4+ T cells.
- Associated Signaling: SLC2A3 is part of the cellular machinery for glucose metabolism, indirectly impacting processes like glycolysis and oxidative phosphorylation, which are regulated by pathways like PI3K/Akt/mTOR. [GeneCards SLC2A3: GeneCards]
- Role in TME: In the hypoxic and nutrient-poor TME, glucose competition is common. High SLC2A3 may indicate an attempt by CD4+ T cells to meet their metabolic needs in a challenging environment.
- SLC16A7 (Monocarboxylate Transporter 2, MCT2): SLC16A7 is involved in the transport of monocarboxylates like lactate. Lactate is a major metabolic byproduct in the TME, often promoting an immunosuppressive environment. High SLC16A7 on CD4+ T cells could indicate an adaptation to lactate-rich conditions or a specific metabolic phenotype, potentially linked to impaired effector function.
- Associated Signaling: SLC16A7 facilitates the import or export of lactate, influencing intracellular pH and metabolic fluxes, which can impact T cell function and survival. [GeneCards SLC16A7: GeneCards]
- Role in TME: In a tumor context, SLC16A7 expression on T cells can be indicative of metabolic stress or an attempt to adapt to the hostile TME, but also potentially leading to T cell exhaustion or dysfunction.
- IL7R (Interleukin-7 Receptor Alpha, CD127): IL7R is crucial for T cell survival, proliferation, and maintenance, especially of naive and memory T cells. It is often downregulated on regulatory T cells (Tregs) and activated effector T cells. Its presence indicates a population of CD4+ T cells capable of responding to IL-7 for survival and homeostatic proliferation.
- Associated Signaling: IL7R signaling, primarily through the JAK/STAT pathway (STAT5), promotes cell survival and proliferation. [GeneCards IL7R: GeneCards]
- Role in TME: IL7R expression on CD4+ T cells can be associated with different T cell subsets in the TME. High IL7R can suggest a population with survival advantage, potentially influencing the long-term persistence of anti-tumor T cells or the maintenance of central memory T cells.
Clinical or Translational Implications
The identification of specific surfaceome markers on CD4+ T cells in Squamous lung carcinoma offers several potential clinical and translational avenues, particularly for therapeutic targeting and biomarker development. The distinct expression profile in the highlighted sample cluster suggests that these markers could serve as indicators of specific immune responses or vulnerabilities in different patients.
- Therapeutic Targeting of ICOS: Given its role as a co-stimulatory receptor for T cell activation, ICOS is an attractive target for immunotherapy. Agonistic antibodies targeting ICOS are being investigated in clinical trials to enhance anti-tumor T cell responses, especially in combination with checkpoint inhibitors. The high expression in a subset of samples suggests that these patients might particularly benefit from ICOS agonist therapies. [PubMed search for ICOS agonist cancer: PubMed Search]
- Targeting the PGE2-PTGER4 Axis: PTGER4 is a promising target for reversing immunosuppression in the TME. Pharmacological inhibition of PTGER4 with antagonists can block PGE2-mediated suppression of T cell function, potentially reactivating anti-tumor immunity. Clinical trials exploring EP4 antagonists in various cancers, including lung cancer, are underway. High PTGER4 expression on CD4+ T cells suggests that these patients' T cells might be particularly susceptible to PGE2-mediated suppression, making them good candidates for EP4 blockade. [PubMed search for EP4 antagonist cancer: PubMed Search]
- Modulating Integrin-Mediated Interactions (ITGB1, ITGB2): Integrins play crucial roles in T cell trafficking and interactions within the TME. While direct therapeutic targeting of pan-integrins can have broad off-target effects, understanding their expression patterns can inform strategies to enhance or inhibit T cell migration or adhesion in specific contexts, potentially impacting the success of adoptive cell therapies or modulating immune cell infiltration.
- Metabolic Reprogramming (SLC2A3, SLC16A7): The differential expression of glucose (SLC2A3) and lactate (SLC16A7) transporters highlights the importance of T cell metabolism in the TME. Strategies aimed at modulating T cell metabolism, for instance, by altering glucose availability or targeting lactate transport, could enhance anti-tumor immunity. Identifying patients whose T cells are highly reliant on specific metabolic pathways could lead to personalized metabolic immunotherapies.
- Biomarker Potential: The distinct expression patterns, especially in the highlighted cluster, could serve as biomarkers to identify patients with specific TME characteristics. For example, high ICOS and PTGER4 could indicate a TME with active T cell responses but also significant immunosuppression, informing patient stratification for combination immunotherapies. These markers could also be used to monitor treatment response.
- Functional Characterization of CD4+ T cell Subsets: The co-expression of markers like ICOS (activation/Tfh), CCR7 (homing/memory), and PTGER4 (immunosuppression susceptibility) in specific samples suggests a complex interplay of CD4+ T cell subsets. Further immunophenotyping or functional studies could reveal whether these are pro-tumor or anti-tumor populations, guiding more precise immune interventions.
19. Differential Expression of Cell Cycle Genes in Lung Epithelial Cells Between Squamous and Adenocarcinoma
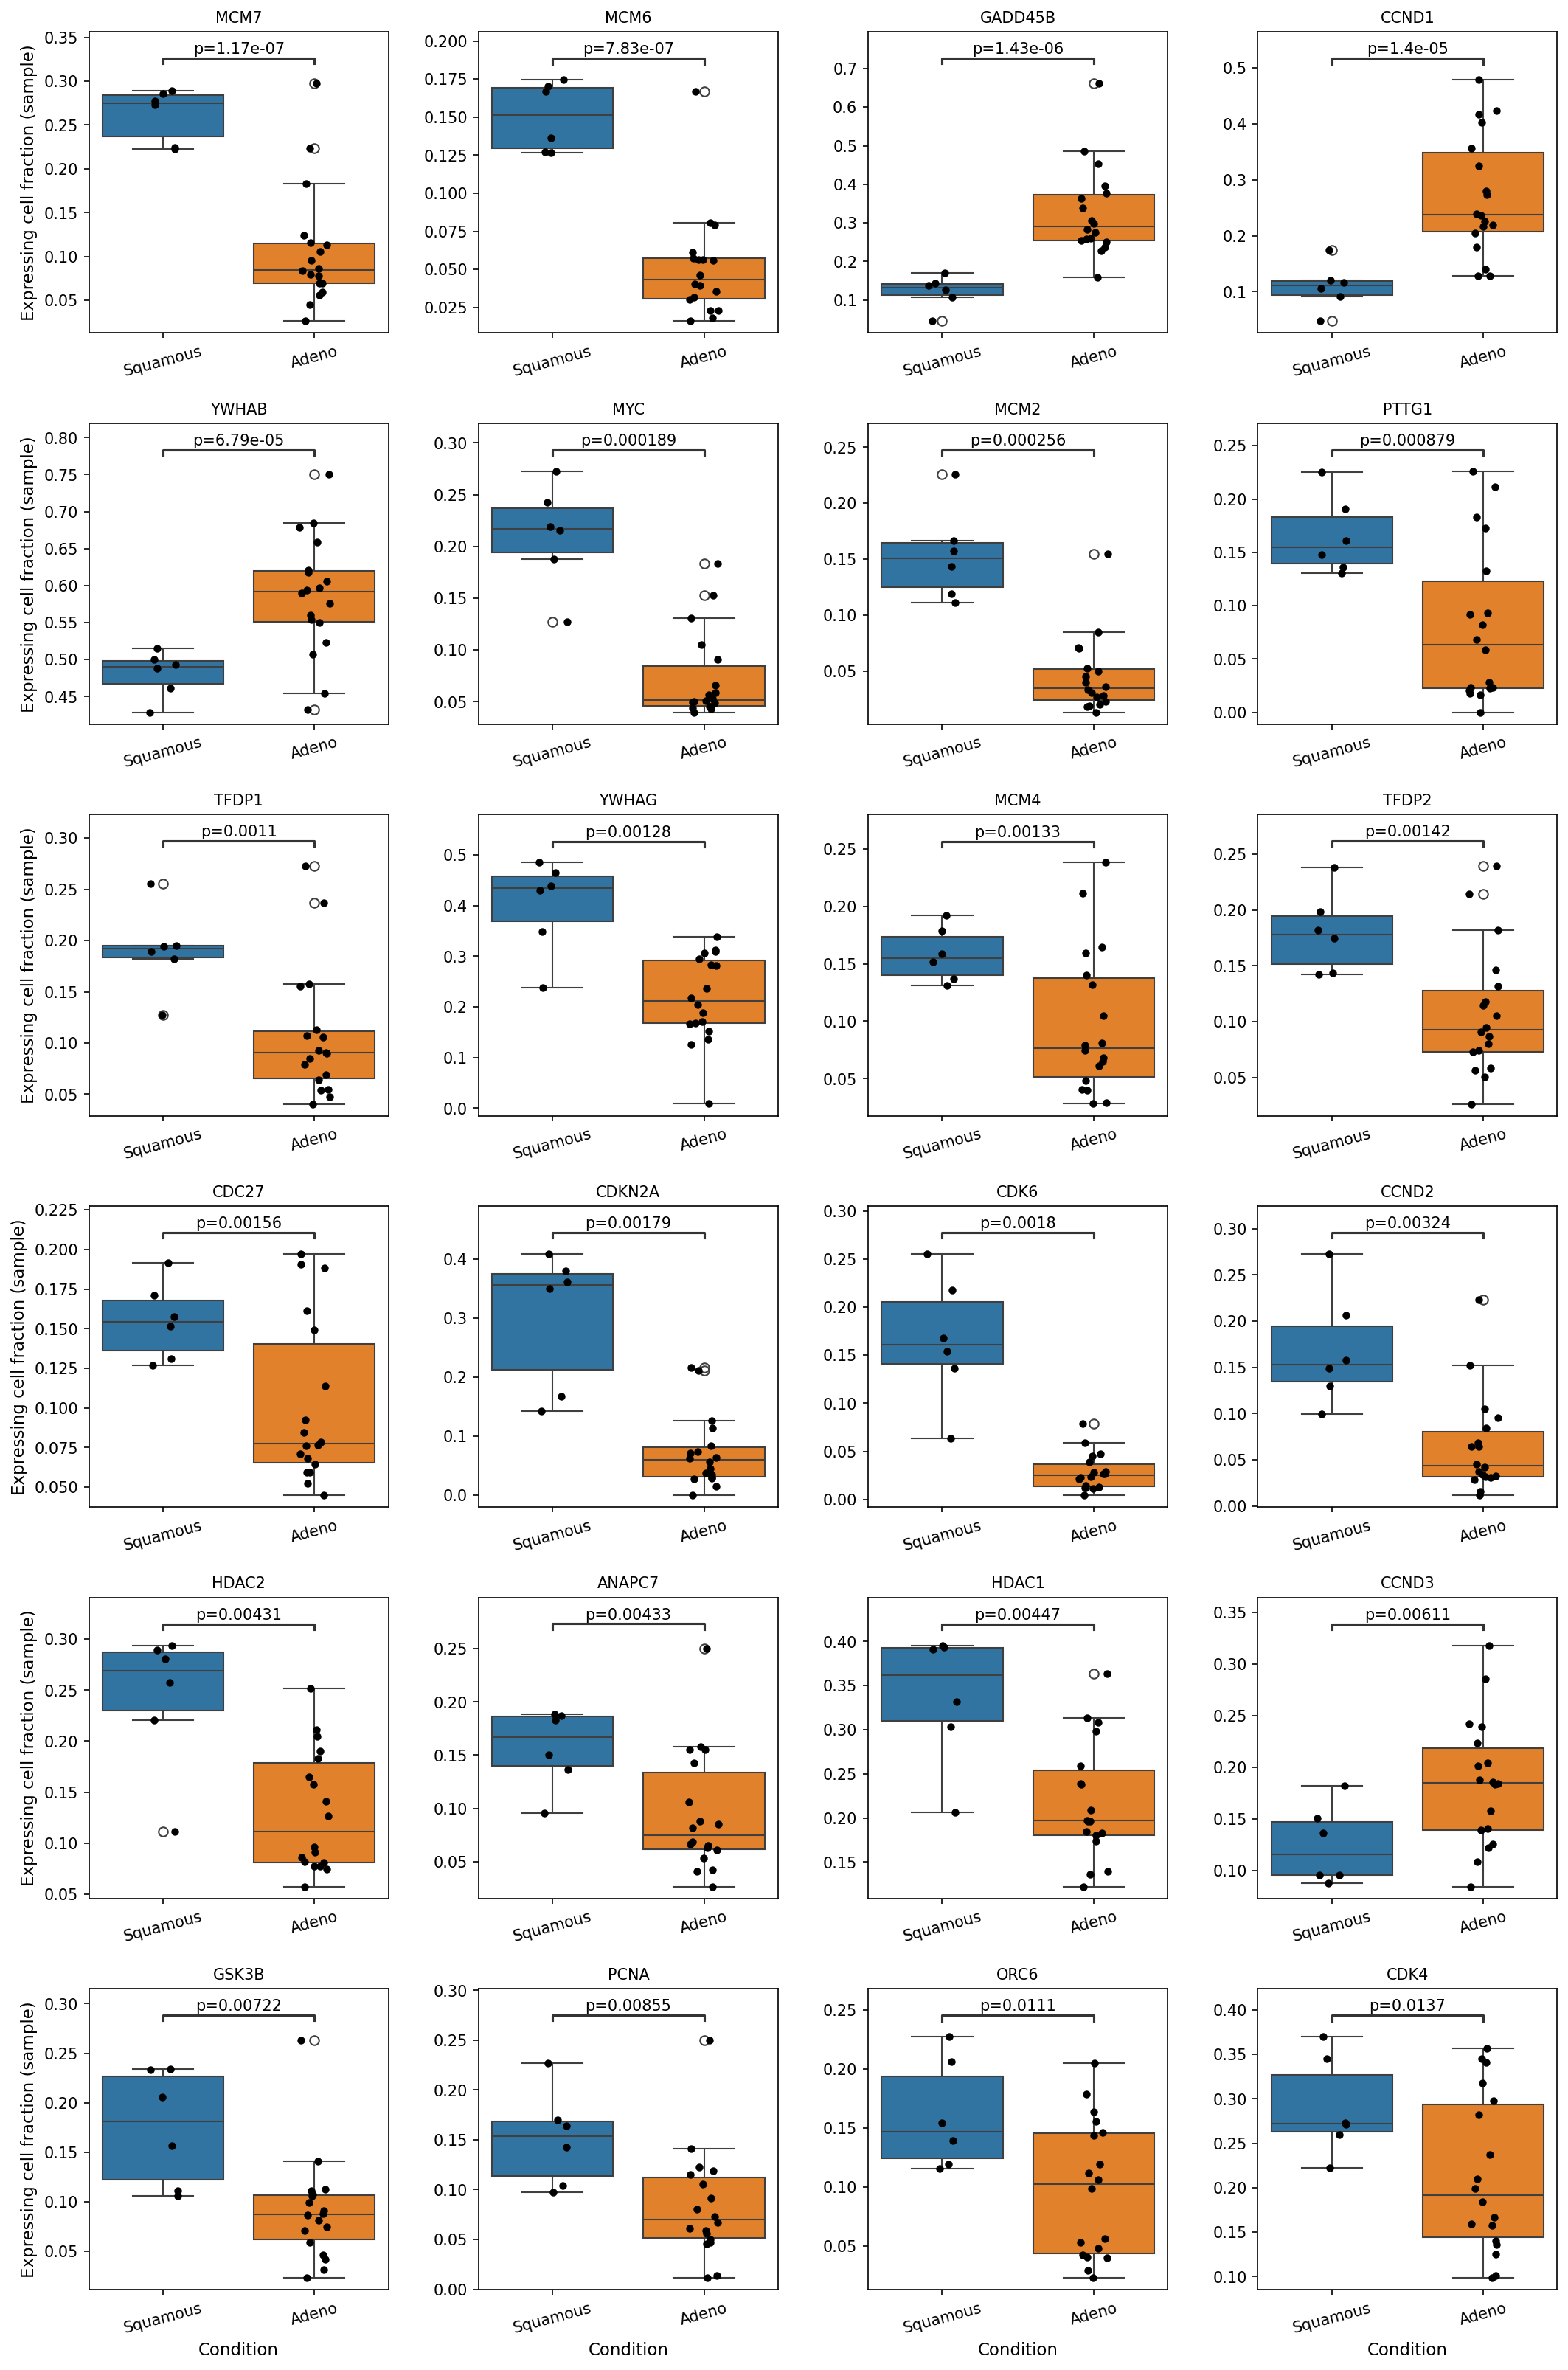
[Analysis Visualization Results]...
Analysis Overview
This analysis investigates the differential expression of a curated panel of cell cycle pathway genes within Lung Epithelial cells, comparing two distinct lung cancer conditions: Squamous Cell Carcinoma (Squamous) and Adenocarcinoma (Adeno). The data is derived from single-cell RNA sequencing, and the analysis focuses on the "expressing cell fraction (sample)" for each gene, which represents the proportion of cells within a given sample that express the gene. Statistically significant differences were identified and visualized using box plots. The Lung Epithelial cell population is the resolved tumor-origin cell type in this dataset, indicating that the observed differences likely reflect intrinsic characteristics of the malignant cells themselves.
Visual Summary
The visualization presents 24 box plots, each illustrating the expressing cell fraction for a specific cell cycle gene across Squamous (blue boxes) and Adeno (orange boxes) conditions. A p-value is displayed for each gene, indicating a statistically significant difference (p < 0.05) between the two conditions.
Key visual patterns observed:
- Genes predominantly higher in Adenocarcinoma: A notable cluster of genes, including MCM2, MCM6, MCM7, PCNA, ORC6, CCND1, CCND3, CDK4, MYC, PTTG1, and GADD45B, show a significantly higher median expressing cell fraction in Adeno samples compared to Squamous samples. The box plots for these genes typically show the orange box (Adeno) positioned higher than the blue box (Squamous), with less overlap and distinct distributions.
- Genes predominantly higher in Squamous Cell Carcinoma: Conversely, genes such as CDKN2A, CCND2, CDK6, TFDP1, TFDP2, HDAC1, HDAC2, CDC27, ANAPC7, GSK3B, YWHAB, YWHAQ, and MCM4 exhibit a higher median expressing cell fraction in Squamous samples compared to Adeno samples. Here, the blue box (Squamous) is generally positioned higher.
- The spread and distribution within each condition, as indicated by the interquartile range and individual data points (black dots), show variability across samples, but the consistent shift in medians and significant p-values highlight robust differences between the conditions for these cell cycle regulators.
Biological Interpretation
The observed differential expression of cell cycle genes in Lung Epithelial cells highlights distinct regulatory landscapes and proliferative characteristics between Lung Squamous Cell Carcinoma and Lung Adenocarcinoma.
Enhanced Proliferative Signature in Adenocarcinoma:
- Many genes associated with DNA replication initiation and elongation, such as the Minichromosome Maintenance Complex components (MCM2, MCM6, MCM7), Proliferating Cell Nuclear Antigen (PCNA), and Origin Recognition Complex subunit 6 (ORC6), are significantly upregulated in Adeno. This strongly indicates a higher rate of DNA synthesis and cellular proliferation in Adenocarcinoma. [GeneCards: MCM2, MCM6, MCM7, PCNA, ORC6]
- Key drivers of the G1-S cell cycle transition, including Cyclin D1 (CCND1), Cyclin D3 (CCND3), and Cyclin Dependent Kinase 4 (CDK4), are also notably higher in Adeno. This suggests a more rapid progression through the G1 phase into DNA replication. [GeneCards: CCND1, CCND3, CDK4]
- The proto-oncogene MYC, a critical regulator of cell growth and proliferation, shows higher expression in Adeno, further supporting an aggressive proliferative phenotype. [GeneCards: MYC]
- The lower expression of the tumor suppressor CDKN2A (p16INK4a) in Adeno (relative to Squamous) implies a compromised G1 checkpoint, removing a critical brake on CDK4/6 activity and contributing to uncontrolled cell cycle progression. [GeneCards: CDKN2A]
Distinct Cell Cycle Regulation in Squamous Cell Carcinoma:
- While Adeno exhibits a clear hyper-proliferative signature through specific pathways, Squamous cells show relatively higher expression of other cell cycle components, including MCM4, Cyclin D2 (CCND2), and Cyclin Dependent Kinase 6 (CDK6). This suggests that while both are cancerous, they might utilize different combinations of G1-S regulators or have different dependencies.
- Higher expression of Transcription Factors Dp1 and Dp2 (TFDP1, TFDP2), components of the E2F complex that regulate S-phase genes, in Squamous cells, alongside higher levels of Histone Deacetylases (HDAC1, HDAC2) and components of the Anaphase-Promoting Complex (CDC27, ANAPC7), points to potentially distinct epigenetic regulation and mitotic control mechanisms. [PubMed: HDAC1, HDAC2 in cancer]
- The higher expression of CDKN2A in Squamous might indicate a relatively more intact G1 checkpoint mechanism compared to Adeno, or that its dysregulation occurs through alternative mechanisms in Squamous.
Overall, the findings suggest that Lung Adenocarcinoma in Lung Epithelial cells is characterized by a particularly robust and dysregulated cell cycle, driven by key G1-S transition and DNA replication machinery, often coupled with reduced tumor suppressor activity (e.g., CDKN2A). Lung Squamous Cell Carcinoma, while also exhibiting cell cycle alterations, presents a different molecular signature for proliferation and cell cycle control.
Clinical or Translational Implications
The distinct cell cycle gene expression profiles between Lung Squamous Cell Carcinoma and Lung Adenocarcinoma in Lung Epithelial cells have several potential clinical and translational implications:
- Diagnostic and Prognostic Biomarkers: The specific pattern of upregulated genes in Adeno (e.g., MCM2/6/7, CCND1, MYC, PCNA, ORC6) and downregulated CDKN2A could serve as a valuable molecular signature to distinguish Adenocarcinoma from Squamous Cell Carcinoma in clinical diagnostics, especially in cases where histological classification is ambiguous. These differences could also correlate with prognosis, with the highly proliferative Adeno signature potentially indicating a more aggressive disease course.
- Therapeutic Targeting: The differential expression of cell cycle regulators could highlight distinct vulnerabilities and therapeutic opportunities.
- The consistent upregulation of CCND1, CCND3, and CDK4 in Adenocarcinoma suggests that CDK4/6 inhibitors, currently used in other cancers, might be particularly effective in specific subtypes of lung Adenocarcinoma.
- The high expression of MYC and various MCM genes in Adeno could point to these as potential targets for novel therapeutic agents aimed at inhibiting proliferation. [PubMed: MYC as a therapeutic target]
- Conversely, the relatively higher expression of HDAC1/2 in Squamous suggests different epigenetic vulnerabilities, potentially making HDAC inhibitors more relevant for Squamous Cell Carcinoma, although further investigation into the specific roles and dependencies is warranted. [PubMed: HDAC inhibitors in lung cancer]
- Understanding Tumor Heterogeneity: These molecular distinctions underscore the importance of precision medicine in lung cancer, emphasizing that therapeutic strategies should be tailored not just to the broad diagnosis of lung cancer, but to the specific histopathological subtype and its underlying molecular drivers within the tumor cells.
20. Gene Ontology (GSA) Analysis of Lung Epithelial Cells by Condition and Ploidy
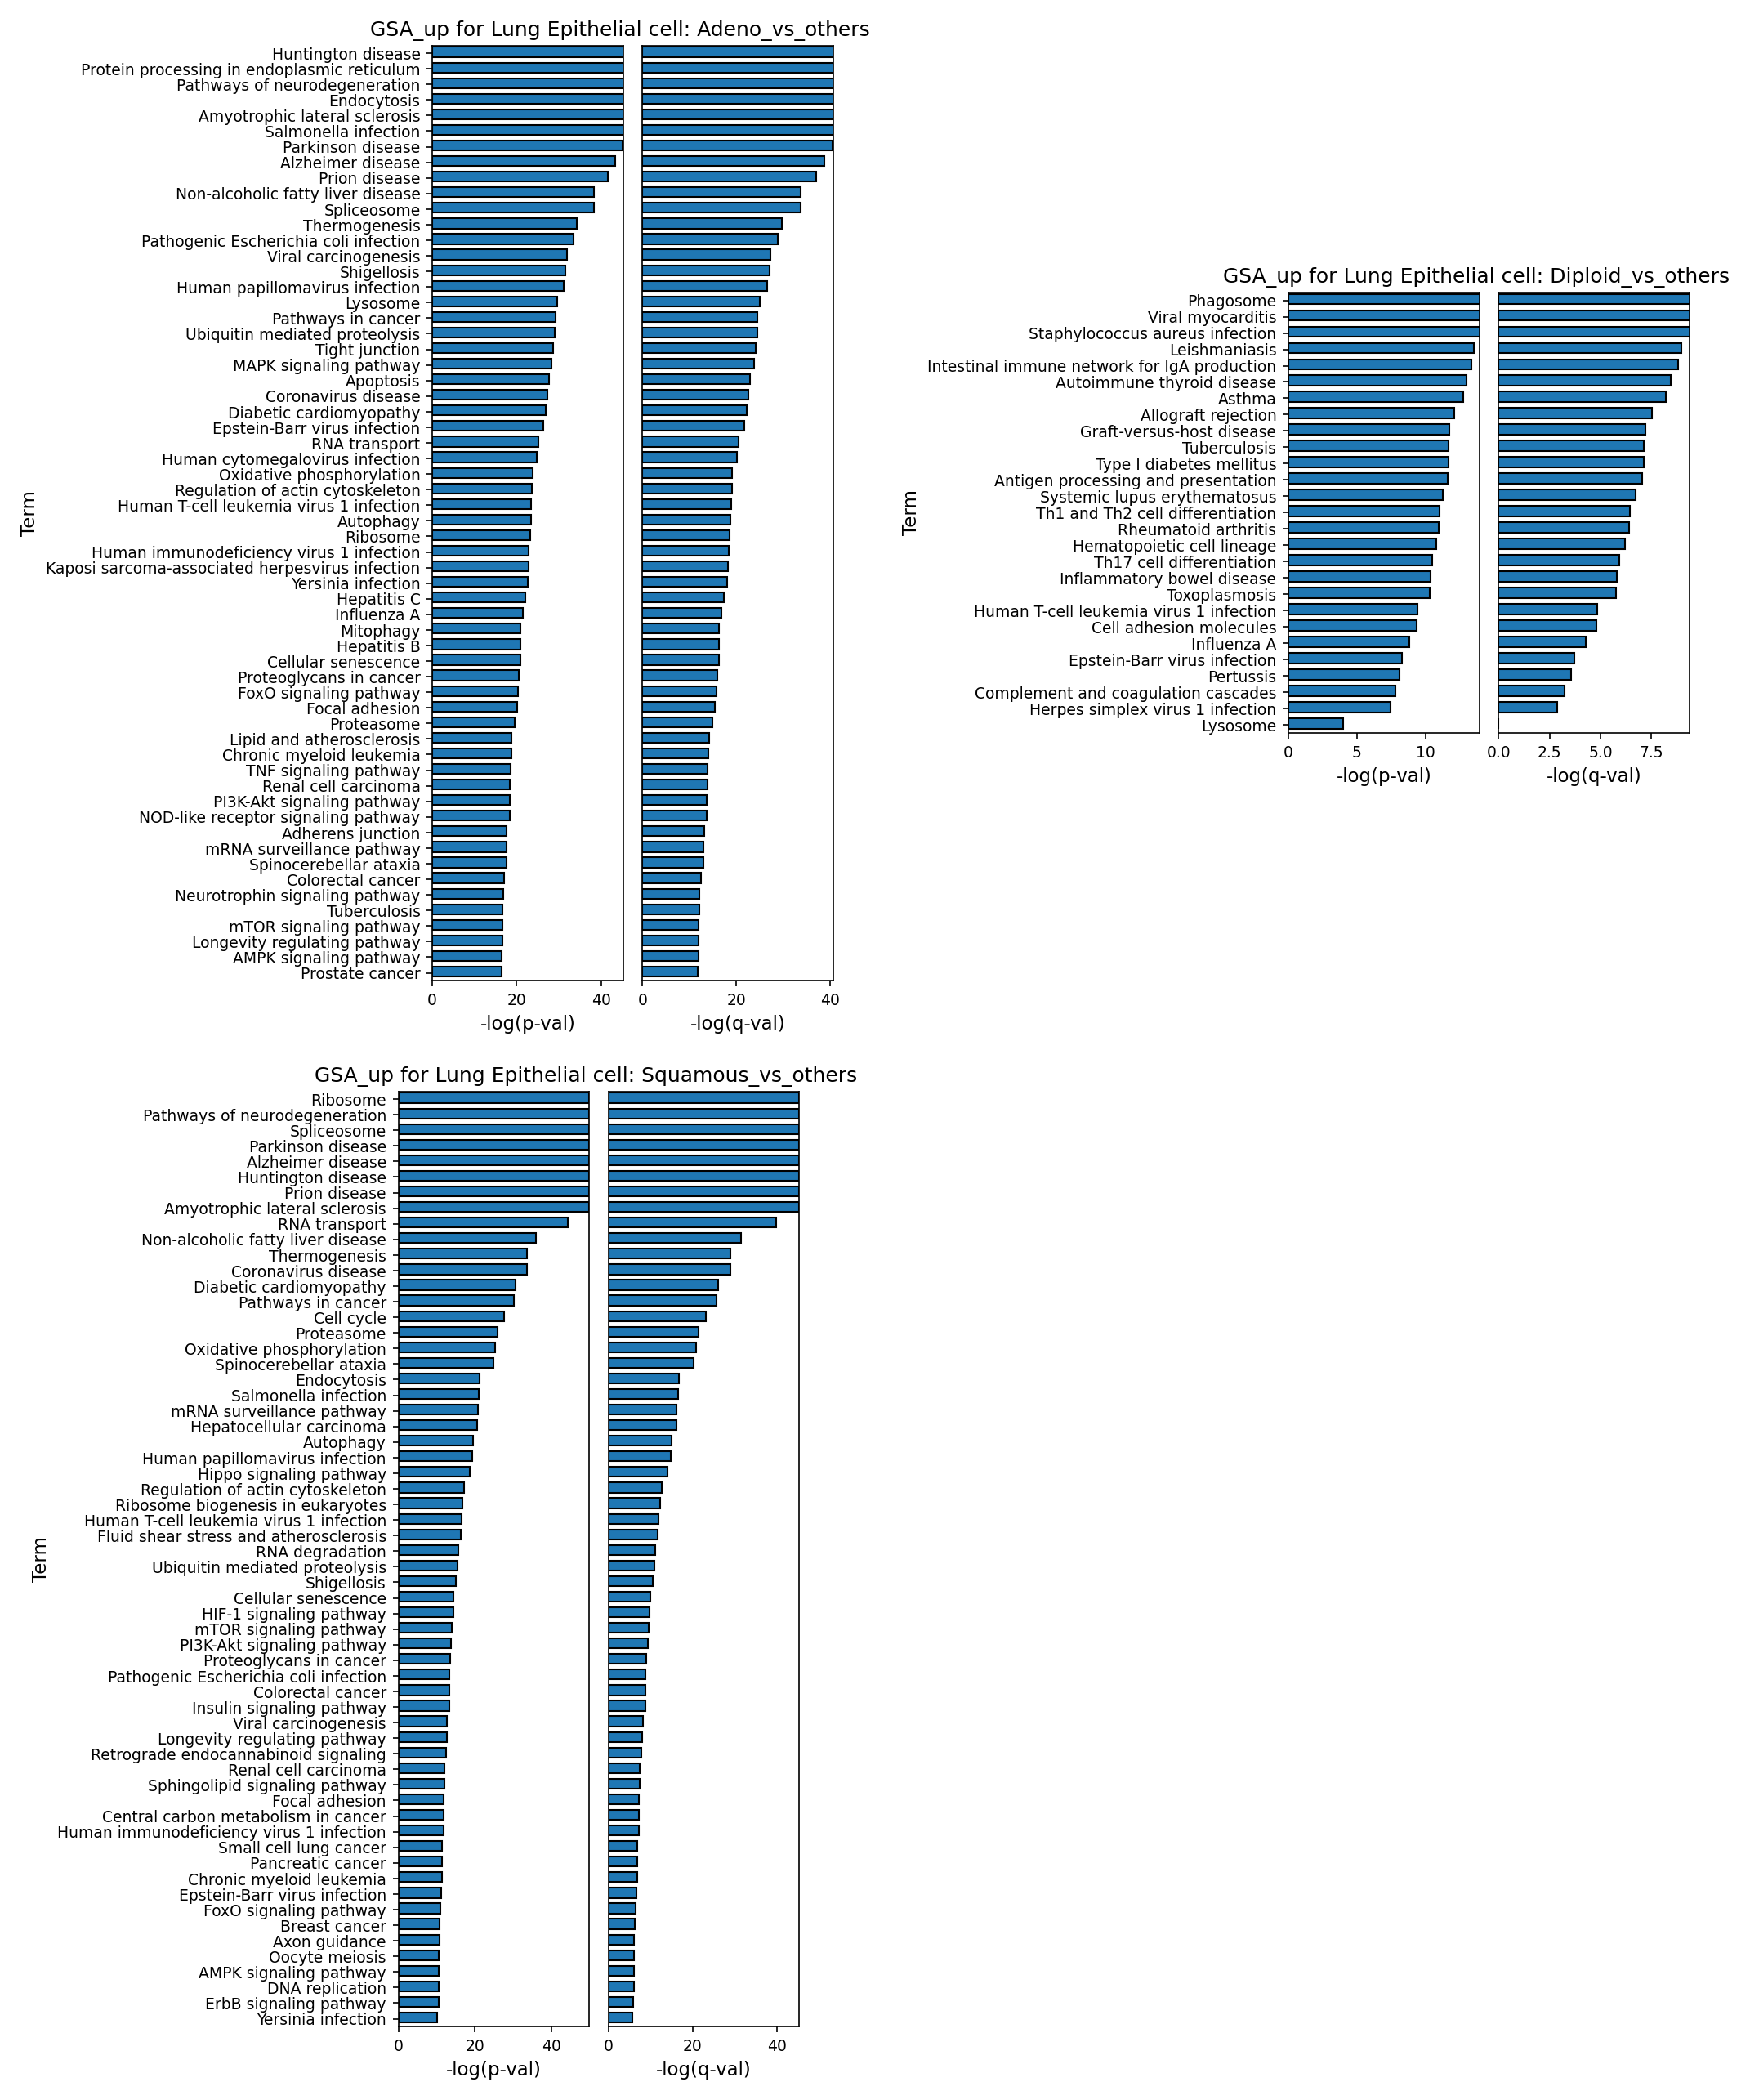
[Analysis Visualization Results]...
Analysis Overview
This analysis presents Gene Ontology (GO) enrichment results for Lung Epithelial cells, comparing different conditions (Adenocarcinoma vs. other conditions, Squamous Cell Carcinoma vs. other conditions) and ploidy states (Diploid vs. other ploidy states). The enrichment analysis, performed using Gene Set Analysis (GSA), identifies biological processes and pathways that are significantly upregulated in Lung Epithelial cells under these specific contexts. The results are visualized as bar plots, where the length of the bar represents the statistical significance (-log(p-val) and -log(q-val)) of the enriched GO terms. The goal is to identify distinct biological features of Lung Epithelial cells in the context of lung cancer (Adeno and Squamous) and to contrast them with those in diploid cells.
Visual Summary
The analysis provides three bar plots illustrating the top enriched Gene Ontology (GO) terms for Lung Epithelial cells under different comparisons:
- GSA_up for Lung Epithelial cell: Adeno_vs_others: This plot displays GO terms significantly upregulated in Lung Epithelial cells from Adenocarcinoma samples compared to all other samples. The most prominent terms include "Protein processing in endoplasmic reticulum," various "Pathways of neurodegeneration" (e.g., Huntington disease, Parkinson disease, Alzheimer disease), "Endocytosis," "Spliceosome," and several infection-related pathways. Key cancer-related signaling, such as "MAPK signaling pathway," and cellular processes like "Apoptosis," "Lysosome," and "Ubiquitin mediated proteolysis," are also highly enriched.
- GSA_up for Lung Epithelial cell: Diploid_vs_others: This plot highlights GO terms significantly upregulated in diploid Lung Epithelial cells compared to all other Lung Epithelial cells (which would include aneuploid and unclear ploidy cells). This plot shows a strikingly different profile, dominated by immune and inflammatory response pathways. Top terms include "Phagosome," various infection responses (e.g., *Staphylococcus aureus infection*, *Leishmaniasis*, *Tuberculosis*, *Influenza A*), "Intestinal immune network for IgA production," "Antigen processing and presentation," and pathways related to T-cell differentiation and autoimmune diseases (e.g., "Autoimmune thyroid disease," "Systemic lupus erythematosus").
- GSA_up for Lung Epithelial cell: Squamous_vs_others: This plot shows GO terms significantly upregulated in Lung Epithelial cells from Squamous Cell Carcinoma samples compared to all other samples. Similar to Adenocarcinoma, many "Pathways of neurodegeneration," "Spliceosome," "RNA transport," "Proteasome," and "Ubiquitin mediated proteolysis" are enriched. Distinctly, terms like "Ribosome," "Cell cycle," "Oxidative phosphorylation," "Hippo signaling pathway," "HIF-1 signaling pathway," "mTOR signaling pathway," and "PI3K-AKT signaling pathway" are highly prominent, pointing towards intense cellular proliferation and metabolic reprogramming.
In general, the Adeno and Squamous conditions show significant overlap in enriched GO terms, particularly concerning protein handling, RNA processing, and cellular stress responses. The Diploid comparison, however, reveals a unique enrichment for immune and inflammatory functions, contrasting sharply with the cancer-associated profiles.
Biological Interpretation
Lung Epithelial Cells in Adenocarcinoma (Adeno_vs_others)
The strong enrichment of terms such as "Protein processing in endoplasmic reticulum," "Ubiquitin mediated proteolysis," "Lysosome," and "Endocytosis" suggests that Lung Epithelial cells in Adenocarcinoma exhibit heightened activity in protein synthesis, folding, degradation, and cellular trafficking. This is consistent with the high metabolic demands and increased proteotoxic stress often observed in rapidly proliferating cancer cells, which can lead to an accumulation of misfolded proteins and activation of the unfolded protein response (UPR) [PubMed search: "protein processing endoplasmic reticulum cancer"]. The presence of "Spliceosome" and "RNA transport" terms also points to active mRNA processing and regulation, critical for gene expression in cancer cells.
The frequent appearance of "Pathways of neurodegeneration" (e.g., Huntington, Parkinson, Alzheimer, ALS) is intriguing. While these are primarily neurological diseases, the underlying cellular dysfunctions often involve common mechanisms like protein aggregation, mitochondrial dysfunction, and oxidative stress, which are also highly relevant in cancer pathogenesis and cellular stress responses [PubMed search: "neurodegeneration pathways cancer protein aggregation"]. The enrichment of "MAPK signaling pathway" and "Apoptosis" directly implicates these well-known cancer pathways in adenocarcinoma progression. "Viral carcinogenesis" suggests potential viral involvement or activation of common pathways associated with oncogenic viruses.
Lung Epithelial Cells in Squamous Cell Carcinoma (Squamous_vs_others)
Many terms enriched in Squamous Cell Carcinoma overlap with those in Adenocarcinoma, reinforcing the importance of protein/RNA processing, cellular stress, and altered cellular trafficking in both lung cancer subtypes. However, Squamous Cell Carcinoma shows a more pronounced enrichment for "Ribosome," "Cell cycle," and "Oxidative phosphorylation." This pattern strongly indicates robust protein synthesis, active cell division, and significant metabolic reprogramming geared towards energy production to fuel rapid proliferation, all hallmarks of aggressive cancer growth [PubMed search: "cancer cell metabolism oxidative phosphorylation"].
The enrichment of "Hippo signaling pathway," "HIF-1 signaling pathway," "mTOR signaling pathway," and "PI3K-AKT signaling pathway" further underscores the activation of major oncogenic pathways that regulate cell proliferation, survival, and adaptation to hypoxia in squamous cell lung cancer [GeneCards: HIF1A, MTOR, PIK3CA]. Terms like "Proteoglycans in cancer" and "Focal adhesion" suggest altered extracellular matrix interactions and cell adhesion, critical for tumor invasion and metastasis.
Diploid Lung Epithelial Cells (Diploid_vs_others)
In stark contrast to the cancer-associated cells, diploid Lung Epithelial cells show a strong enrichment for pathways related to immune response, host defense, and inflammation. Terms such as "Phagosome," "Antigen processing and presentation," "Th1 and Th2 cell differentiation," and numerous infection-response pathways highlight their active role in innate and adaptive immunity. Lung epithelial cells are known to function as a crucial barrier and participant in immune responses within the respiratory tract, orchestrating defenses against pathogens and contributing to the inflammatory milieu [PubMed search: "lung epithelial cell immune function"]. The enrichment of terms related to autoimmune diseases and T-cell differentiation suggests these cells are actively involved in immune regulation or are responding to chronic inflammation or immune challenges, possibly reflecting the host's response to the tumor or other environmental factors in what are presumed to be less malignant or normal-like epithelial cells.
Clinical or Translational Implications
The distinct Gene Ontology profiles of Lung Epithelial cells in Adenocarcinoma, Squamous Cell Carcinoma, and diploid states offer valuable insights into the underlying biology of lung cancer and the role of the epithelial compartment.
- Targeting Protein Homeostasis and Metabolism: The high enrichment of protein processing, RNA metabolism, and in Squamous cells, oxidative phosphorylation, suggests that targeting these fundamental cellular processes could be effective therapeutic strategies for both Adenocarcinoma and Squamous Cell Carcinoma. Interventions disrupting the UPR, proteasome activity, or specific metabolic pathways might selectively affect cancer cells more than healthy cells.
- Oncogenic Signaling Pathways: The prominent role of MAPK, PI3K-AKT, mTOR, Hippo, and HIF-1 signaling in cancerous Lung Epithelial cells provides further validation for existing targeted therapies and identifies potential new drug targets specific to these pathways in lung cancer patients.
- Immune Microenvironment Context: The strong immune-related signature in diploid Lung Epithelial cells highlights their potential role in modulating the tumor immune microenvironment. Understanding how these immune functions are suppressed or altered by adjacent cancer cells could inform immunotherapeutic strategies. Preserving or boosting these immune-competent epithelial cells might enhance anti-tumor immunity.
- Biomarker Identification: The identified enriched pathways could harbor novel biomarkers for diagnosis, prognosis, or prediction of treatment response for specific lung cancer subtypes. Differences between Adeno and Squamous epithelial cells, particularly in proliferative and metabolic signatures, may guide personalized treatment approaches.
21. Gene Set Enrichment Analysis (GSEA) of Lung Cancer Subtypes Across Diverse Cell Populations
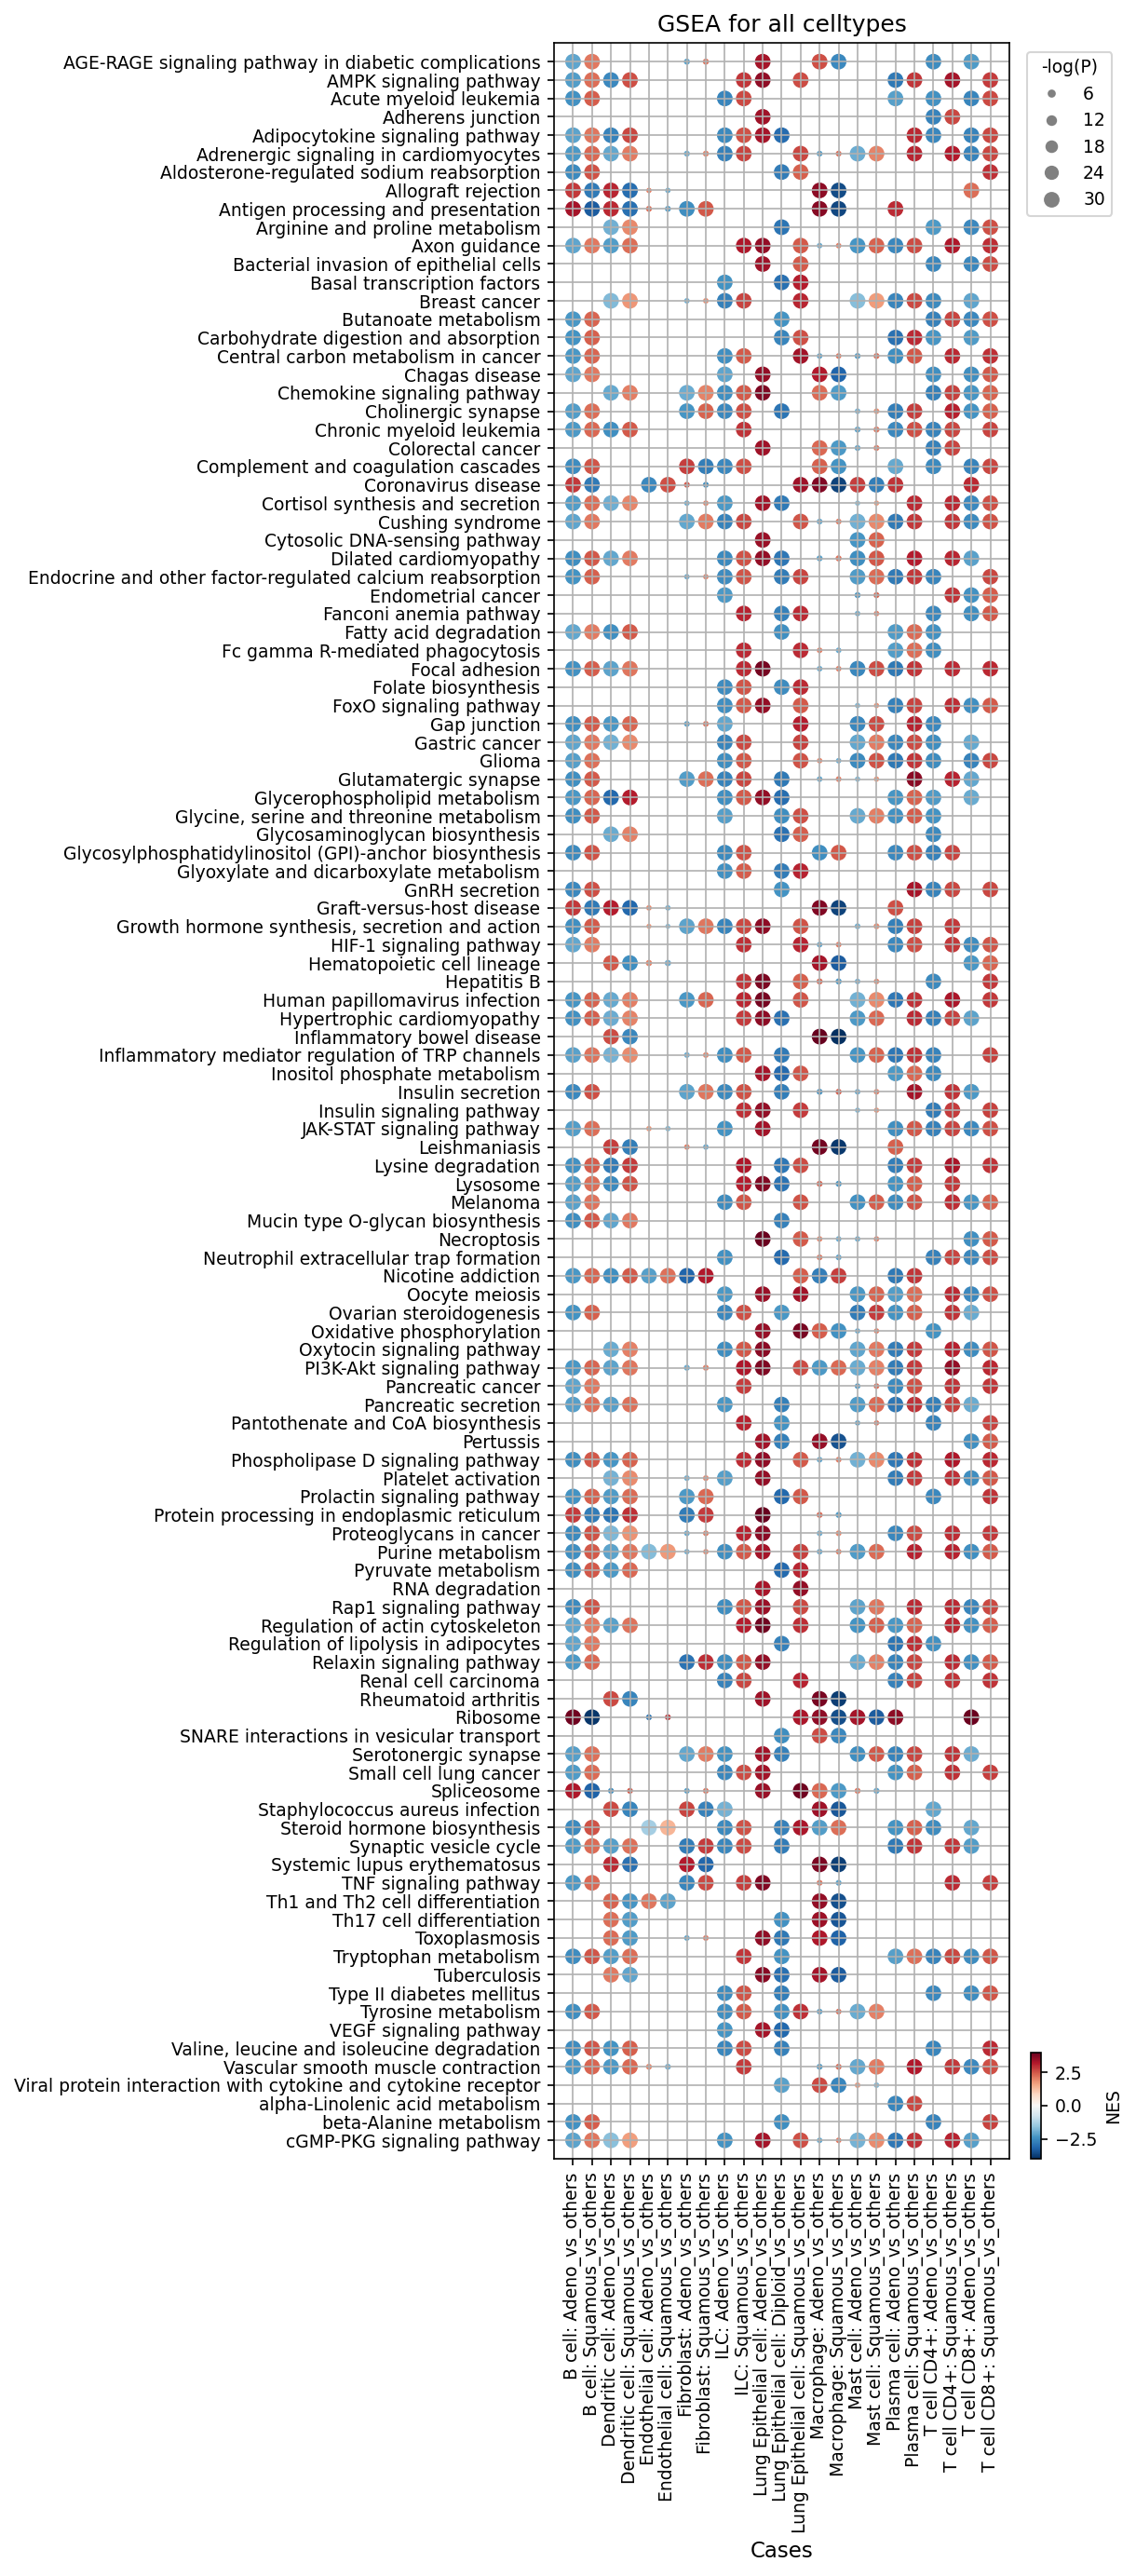
[Analysis Visualization Results]...
Analysis Overview
This analysis presents Gene Set Enrichment Analysis (GSEA) results as a dot plot, illustrating the enrichment of specific biological pathways across different cell types and lung cancer conditions (Adenocarcinoma, "Adeno", vs. Squamous Cell Carcinoma, "Squamous"). The enrichment scores (Normalized Enrichment Score, NES) indicate the direction and strength of pathway activity in one condition compared to the other within each cell type. Dot size corresponds to the statistical significance (-log(p-val)), and color (red for positive NES, blue for negative NES) indicates enrichment or depletion, respectively. This visualization allows for the identification of subtype-specific and cell-type-specific biological processes that are active in lung cancer.
The comparison is framed as [Condition]_vs_others, where 'others' refers to the alternative lung cancer condition within the dataset. Thus, 'Adeno_vs_others' compares gene expression in Adenocarcinoma cells to Squamous Cell Carcinoma cells of the same cell type, and 'Squamous_vs_others' compares Squamous Cell Carcinoma cells to Adenocarcinoma cells of the same cell type.
Visual Summary
The dot plot displays 120 key pathways (y-axis) against various cell types segmented by cancer subtype comparison (x-axis).
- Distinct Patterns by Cell Type and Subtype: Many pathways show clear differential enrichment (red dots for positive NES, blue dots for negative NES) across cell types and between the Adeno_vs_others and Squamous_vs_others comparisons. For a given cell type and pathway, if it's enriched in Adeno_vs_others, it generally appears depleted in Squamous_vs_others, confirming the pairwise comparison.
- High Significance: A considerable number of pathways exhibit large dot sizes, indicating high statistical significance (low p-values) for their differential enrichment.
- Tumor-Origin Cell Type (Lung Epithelial Cell): This cell type shows strong enrichment for pathways related to metabolism (e.g., Glycolysis/Gluconeogenesis, Oxidative phosphorylation), oncogenic signaling (HIF-1 signaling pathway, PI3K-Akt signaling pathway, VEGF signaling pathway), cell adhesion, and extracellular matrix interactions (Focal adhesion, Regulation of actin cytoskeleton, Proteoglycans in cancer) in Adeno relative to Squamous. Conversely, Squamous cells show relative enrichment in pathways like Arginine and proline metabolism and Purine metabolism when compared to Adeno cells. Both subtypes show depletion in pathways like Ribosome, Lysosome, and Antigen processing and presentation.
- Stromal Cells (Fibroblast, Endothelial cell): These cells display pronounced enrichment in pathways associated with extracellular matrix remodeling, angiogenesis, and cell motility (e.g., Focal adhesion, Regulation of actin cytoskeleton, VEGF signaling pathway, PI3K-Akt signaling pathway) more strongly in the Adeno microenvironment compared to the Squamous.
Immune Cells (Macrophage, Dendritic cell, T cell CD4+, T cell CD8+)
- Macrophages in Adeno samples (compared to Squamous) show enrichment in Chemokine signaling pathway, TNF signaling pathway, and Fc gamma R-mediated phagocytosis, alongside a depletion of Antigen processing and presentation.
- T cells (both CD4+ and CD8+) in Adeno samples (compared to Squamous) exhibit enrichment in Th1 and Th2 cell differentiation, Th17 cell differentiation, and TNF signaling pathway, suggesting differential T cell activation and inflammatory responses.
- Across several immune cell types and both conditions, Antigen processing and presentation is notably depleted, especially in Macrophages and T cell CD8+.
Biological Interpretation
The GSEA results highlight key biological differences between Adenocarcinoma and Squamous Cell Carcinoma at a single-cell level, impacting both tumor cells and their microenvironment.
- Metabolic Reprogramming: Adenocarcinoma epithelial cells, when compared to Squamous cells, show a stronger enrichment for aerobic glycolysis (Glycolysis/Gluconeogenesis), oxidative phosphorylation, and the HIF-1 signaling pathway. This indicates a heightened metabolic demand and adaptation to hypoxia, characteristic hallmarks of aggressive cancer. PubMed search: cancer metabolism HIF-1 glycolysis Conversely, Squamous cells exhibit relative enrichment in Arginine and proline metabolism and Purine metabolism, suggesting distinct metabolic vulnerabilities or dependencies.
- Oncogenic Signaling and Angiogenesis: The consistent enrichment of the PI3K-Akt signaling pathway and VEGF signaling pathway in Adeno epithelial, fibroblast, and endothelial cells (relative to Squamous) points to more pronounced activation of proliferative, survival, and angiogenic pathways in Adenocarcinoma. This suggests a more active pro-tumorigenic microenvironment in Adeno, driving neovascularization and tumor growth. GeneCards: PIK3CA, GeneCards: VEGFA
- Extracellular Matrix (ECM) Remodeling and Cell Motility: Pathways related to Focal adhesion, Regulation of actin cytoskeleton, and Proteoglycans in cancer are notably enriched in Adeno epithelial cells and fibroblasts (relative to Squamous). This indicates increased cell-matrix interactions and cytoskeletal dynamics, which are critical for cell migration, invasion, and metastatic potential. Fibroblasts in the Adeno microenvironment appear particularly active in ECM remodeling. PubMed search: cancer ECM remodeling focal adhesion
- Immune Evasion and Differential Immune Activation:
- The consistent *depletion* of Antigen processing and presentation in Lung Epithelial cells, Macrophages, and CD8+ T cells in Adeno (relative to Squamous) suggests a potential mechanism of immune evasion. This could impair effective anti-tumor immune responses, making tumors less visible to cytotoxic T lymphocytes.
- Enrichment of Chemokine signaling, TNF signaling, and Fc gamma R-mediated phagocytosis in Adeno macrophages (relative to Squamous) points towards an active, yet potentially immunosuppressive or pro-tumorigenic, macrophage phenotype.
- The differential activation and differentiation of T cells (Th1, Th2, Th17 differentiation, TNF signaling) in both Adeno and Squamous conditions suggest distinct adaptive immune responses that may contribute to disease progression or response to therapy.
Clinical or Translational Implications
The identified GSEA patterns offer several clinical and translational insights:
- Subtype-Specific Therapeutic Targeting: The distinct metabolic (e.g., Arginine and proline metabolism in Squamous) and signaling (e.g., stronger PI3K-Akt/VEGF in Adeno) pathway enrichments suggest that therapeutic strategies targeting these pathways might have differential efficacy between lung adenocarcinoma and squamous cell carcinoma. For instance, drugs targeting glycolysis or angiogenesis might be particularly effective in Adenocarcinoma.
- Metabolic Vulnerabilities: The prominent metabolic reprogramming in lung epithelial cells, particularly the strong enrichment of HIF-1 signaling and glycolysis in Adeno, highlights these as potential targets for therapeutic intervention across both subtypes, possibly with greater impact in Adeno.
- Immune Checkpoint Blockade and Combination Therapies: The observed depletion of antigen processing and presentation pathways in both tumor and immune cells in Adeno compared to Squamous could indicate a mechanism of resistance to current immunotherapies. Strategies to enhance antigen presentation or combine immunotherapies with agents that modulate the tumor microenvironment could be explored, especially in Adenocarcinoma.
- Stromal-Targeted Therapies: The robust activation of ECM remodeling and angiogenesis pathways in fibroblasts and endothelial cells, especially in Adenocarcinoma, supports the development of therapies that target the tumor microenvironment to inhibit tumor progression and metastasis.
- Prognostic Biomarkers: Specific pathway signatures identified (e.g., strong VEGF signaling in Adeno endothelial cells) could serve as prognostic biomarkers or predictors of response to targeted therapies in specific lung cancer subtypes.
22. Discussion
This comprehensive single-cell analysis elucidates the profound molecular and cellular disparities distinguishing lung adenocarcinoma (Adeno) from squamous cell carcinoma (Squamous), extending insights beyond bulk tissue characterizations. The UMAP visualizations clearly demarcate 'Adeno' and 'Squamous' populations, particularly within the 'Lung Epithelial cell' clusters, which are predominantly 'Aneuploid', confirming their malignant identity. This initial segregation underscores that these two major lung cancer subtypes possess fundamentally different cellular and genomic architectures.
Genomic analysis of tumor-origin Lung Epithelial cells revealed a pervasive and consistently high degree of aneuploidy in Squamous samples, in contrast to the more variable aneuploid fractions in Adeno. This suggests a more uniform and aggressive genomic instability characteristic of Squamous Cell Carcinoma. Recurrent amplifications of oncogenes such as SOX2 (in Squamous) and ERBB2 (HER2, in Adeno) were identified, providing direct evidence for subtype-specific driver events. Furthermore, GSA analysis confirmed distinct underlying biological pathways: Adeno epithelial cells showed enrichment in protein processing, neurodegeneration pathways (reflecting proteotoxic stress), and MAPK signaling, while Squamous epithelial cells exhibited strong signals for ribosome biogenesis, cell cycle progression, oxidative phosphorylation, and major oncogenic pathways including Hippo, HIF-1, mTOR, and PI3K-AKT signaling, indicating intense proliferative and metabolic reprogramming. This metabolic divergence was corroborated by GSEA, showing stronger glycolysis and HIF-1 signaling in Adeno epithelial cells versus relative enrichment of arginine/proline and purine metabolism in Squamous epithelial cells.
The tumor microenvironment (TME) also demonstrated remarkable subtype-specific characteristics. T cell population analysis revealed significantly higher proportions of Th2 cells, ILC3(-), and ILC1 in Adeno, indicative of a potentially more immunosuppressive or pro-inflammatory (type 2) immune milieu. Conversely, Squamous exhibited significantly higher Th17 cells, suggesting a different inflammatory landscape. Macrophage subset analysis further refined this distinction: M2A and M2C macrophages were enriched in Adeno, while M2B and M2D subsets were higher in Squamous. This differential macrophage polarization points to distinct immune evasion strategies employed by each cancer type. The consistent depletion of antigen processing and presentation pathways in immune cells and tumor cells within Adeno, as shown by GSEA, further supports a more immune-evasive phenotype in this subtype.
Cell-cell interaction (CCI) analyses revealed extensive subtype-specific crosstalk. In Adeno, prominent interactions included SPP1-integrin/CD44 and VEGFA-NRP1, particularly involving aneuploid epithelial cells and macrophages, suggesting strong pro-angiogenic and immune-modulatory signals. Squamous, however, displayed a globally more robust and widespread CCI network, dominated by extensive collagen-integrin interactions between fibroblasts, indicative of heightened extracellular matrix (ECM) remodeling and desmoplasia. Furthermore, critical immune checkpoint pathways, such as CD47-SIRPα, ICOS-ICOSLG, and PGE2-PTGER4, were significantly active in Squamous, suggesting pervasive immune evasion and T-cell modulation. The striking activation of EGFR-mediated signaling from macrophages/plasma cells to tumor cells in Squamous also highlights a distinct tumor-immune crosstalk for growth factor dependence, in contrast to Adeno's focus on LCK-CD8 receptor signaling within T cells.
Finally, surfaceome marker expression on tumor and stromal cells presented clear, actionable distinctions. Adeno epithelial cells highly expressed MUC1, TROP2, and EPCAM, while Squamous epithelial cells were characterized by high EGFR, CD44, SDC1, GLUT1, and FGFR2 expression. Fibroblasts in Squamous showed strong FAP, MMP14, ITGB5, SDC1, GPNMB, LRRC15, and FZD1 signatures, indicating an active, pro-tumorigenic stroma. Macrophages also exhibited subtype-specific surface marker profiles, with MRC1 and TREM2 elevated in Adeno, and C5AR1, CXCR4, TNFRSF1B, IL6R, and ENG predominant in Squamous. These markers provide precise molecular handles for targeted therapeutic development and patient stratification, underscoring that therapeutic strategies must be tailored to the specific histological and molecular landscape of each lung cancer subtype.
Hypotheses:
- Lung Adenocarcinoma cells, driven by distinct metabolic reprogramming and growth factor signaling (e.g., VEGFA-NRP1, PI3K-Akt), exhibit higher proteotoxic stress and a more immunosuppressive TME, characterized by Th2-skewed immunity, M2A/M2C macrophages, and impaired antigen presentation.
- Lung Squamous Cell Carcinoma cells are defined by a more aggressive genomic instability (higher aneuploidy, SOX2 amplification), intense cell cycle activity, and a highly desmoplastic and immune-evasive microenvironment, orchestrated by extensive fibroblast-mediated ECM remodeling (e.g., collagen-integrin), active EGFR signaling from immune cells, M2B/M2D macrophages, and prominent CD47-SIRPα interactions.
- The distinct surfaceome marker profiles on tumor cells, macrophages, and fibroblasts in Adenocarcinoma versus Squamous Cell Carcinoma reflect specific therapeutic vulnerabilities that can be exploited by subtype-specific targeted agents or immunotherapies.
- The differential activation of T cell and ILC subsets (e.g., Th2, ILC3(-) in Adeno; Th17 in Squamous) drives divergent adaptive and innate immune responses, dictating differential responsiveness to immune checkpoint blockade and requiring distinct immunomodulatory strategies for each lung cancer subtype.
Potential therapeutic targets:
- ERBB2 (HER2): Amplification of ERBB2 (HER2) is an oncogenic driver in lung adenocarcinoma, promoting cell proliferation and aggressive disease. Evidence: Section 4: '17q12:17q21.2 (ERBB2) is another notable amplification, observed in samples... with average log2(CNR) up to 1.9.' Validation: Fluorescence in situ hybridization (FISH) or immunohistochemistry (IHC) for HER2 amplification/expression in validation cohorts. In vitro and in vivo studies testing HER2-targeted therapies (e.g., trastuzumab deruxtecan).
- EGFR: EGFR is highly expressed and often amplified in squamous cell lung carcinoma. Immune and stromal cells actively communicate with tumor cells via EGFR ligands, promoting tumor cell proliferation and survival. Evidence: Section 15: 'EGFR is highly expressed and often amplified in squamous cell lung carcinoma.' Section 13: 'Squamous Cell Carcinoma... a strong signal for growth factor receptor signaling, particularly involving the EGFR pathway... Macrophages and Plasma cells actively communicate with Aneuploid Lung Epi (tumor cells) through various EGFR ligands.' Validation: In vitro functional assays to assess sensitivity to EGFR inhibitors in Squamous Cell Carcinoma cell lines and patient-derived organoids. Validation in patient cohorts with EGFR-overexpressing Squamous Cell Carcinoma for response to EGFR TKIs or antibodies (e.g., necitumumab).
- TROP2 (TACSTD2): TROP2 is frequently overexpressed in lung adenocarcinoma and plays a role in cell proliferation, self-renewal, and tumor growth, promoting tumor initiation and metastasis. Evidence: Section 15: 'TROP2 is frequently overexpressed in various epithelial cancers, including lung adenocarcinoma, and its expression correlates with poor prognosis.' Validation: IHC for TROP2 expression in adenocarcinoma cohorts. Efficacy testing of TROP2-targeting antibody-drug conjugates (ADCs) like sacituzumab govitecan in patient-derived xenograft (PDX) models of lung adenocarcinoma.
- FAP (Fibroblast Activation Protein): FAP is a classic and highly specific marker of activated Cancer-Associated Fibroblasts (CAFs) in squamous cell carcinoma. FAP-positive CAFs promote tumor growth, angiogenesis, immune suppression, and metastasis by remodeling the extracellular matrix. Evidence: Section 17: 'FAP is a classic marker of activated CAFs in virtually all solid tumors, including lung cancer... FAP-positive CAFs promote tumor growth, angiogenesis, immune suppression, and metastasis.' Validation: Immunohistochemistry for FAP on squamous tumor biopsies to assess prevalence and correlation with clinical outcomes. Preclinical efficacy testing of FAP-targeting agents (e.g., FAP-targeting antibodies or CAR T-cells) in Squamous Cell Carcinoma models.
- CD47 (via SIRPA-CD47 axis): The CD47-SIRPα axis acts as a 'don't eat me' signal, enabling cancer cells and other TME components to evade macrophage-mediated phagocytosis. This interaction is highly active in the squamous microenvironment, contributing to broad immune evasion. Evidence: Section 14: 'SIRPA_CD47--Mac|Mac / DC|Mac / Fib|Mac... is a well-known 'don't eat me' signal that prevents phagocytosis and allows cancer cells to evade immune destruction. Its prevalence here suggests broad immune evasion within the TME.' Validation: In vitro functional assays demonstrating enhanced phagocytosis of squamous tumor cells and TME cells upon CD47 blockade. Clinical trials of CD47 or SIRPα blocking antibodies (e.g., magrolimab) in Squamous Cell Carcinoma patients.
- PTGER4 (Prostaglandin E2 Receptor EP4): PTGER4 is highly expressed on CD4+ T cells in squamous cell carcinoma, making them susceptible to PGE2-mediated immunosuppression, which inhibits T cell effector functions and promotes regulatory T cells, thus contributing to an immune-suppressive TME. Evidence: Section 18: 'High PTGER4 expression on CD4+ T cells makes them susceptible to PGE2-mediated suppression...' Section 14: 'ProstaglandinE2_byPTGES3-PTGER4--Mac|Mac / Mac|T' in Squamous, mediating immunosuppression. Validation: Functional assays assessing T cell activation and cytokine production from patient-derived T cells with and without EP4 antagonists. Clinical trials evaluating EP4 antagonists in combination with immunotherapies in Squamous Cell Carcinoma.
Follow-up validation ideas:
- Validate recurrent CNVs (SOX2, ERBB2) via FISH or ddPCR in larger independent cohorts of lung adenocarcinoma and squamous cell carcinoma to confirm their prevalence and prognostic significance.
- Perform spatial transcriptomics or multiplex immunofluorescence on lung tumor biopsies to map the precise localization of subtype-specific macrophage (e.g., MRC1+, C5AR1+, CXCR4+) and fibroblast (e.g., FAP+, LRRC15+) populations relative to tumor cells and their influence on TME architecture.
- Utilize in vitro co-culture systems of primary tumor epithelial cells with macrophages and fibroblasts, and in vivo patient-derived xenograft (PDX) models, to functionally validate key cell-cell interactions (e.g., VEGFA-NRP1 in Adeno; CD47-SIRPα in Squamous) and their impact on tumor growth and immune evasion using blocking antibodies or small molecule inhibitors.
- Conduct functional assays (e.g., cytokine production, proliferation, cytotoxicity) on isolated T cell subsets (Th2, Th17, ILCs) from Adeno and Squamous tumors to confirm their polarized states and responsiveness to immunomodulatory agents (e.g., EP4 antagonists for PTGER4+ T cells).
- Investigate the metabolic vulnerabilities highlighted by GSEA (e.g., HIF-1 signaling, glycolysis in Adeno; arginine/proline metabolism in Squamous) using metabolic inhibitors in patient-derived organoids or cell lines from each subtype, correlating with therapeutic response.
- Test the efficacy of subtype-specific targeted agents (e.g., TROP2-ADCs for Adeno; EGFR inhibitors or FAP-targeted therapies for Squamous) in preclinical models and early-phase clinical trials, stratified by the identified surfaceome biomarkers.
Limitations:
The findings presented are largely correlative and derived from a single-cell RNA-seq dataset, thus limiting definitive causal inferences without further experimental validation. The observed heterogeneity within conditions, particularly in Adenocarcinoma samples, suggests that broader patient cohorts are needed to confirm generalizability. Cell type annotations, especially for subsets, require careful re-evaluation for problematic groups. Furthermore, the single-cell resolution might not fully capture the spatial organization and dynamic interactions within the complex tumor microenvironment. Clinical validation studies are required to translate these molecular insights into actionable diagnostic or therapeutic strategies.
23. Query List
- Show and save UMAPs for condition, sample, major cell type, minor cell type, ploidy_dec, and celltype_subset in two columns.
- Show major cell type scores on UMAP and save the result.
- Show and save a marker expression dot plot for celltype_subset. SET target_cell = None and var_group_rotation = 45. Leave all other arguments at their default values.
- Select Lung Epithelial cell tumor-origin cells, show a CNV heatmap grouped by sample together with a summary of regions with significantly amplified copy numbers, and save the results.
- Show and save UMAPs of CNV patterns colored by major cell type, minor cell type, ploidy results, condition, and sample in two columns.
- Show and save a population bar plot of minor cell types.
- Show and save a population bar plot of T cell subsets.
- Show and save box plots of T cell subset populations with statistically significant differences between conditions, if any. Choose ncols based on the total number of panels.
- Show and save a population bar plot of macrophage subsets.
- Show and save box plots of macrophage subset populations with statistically significant differences between conditions, if any. Choose ncols based on the total number of panels.
- Select Lung Epithelial cell tumor-origin cells, show their ploidy populations as a bar plot, and save the result.
- Show and save cell-cell interaction patterns involving Lung Epithelial cell tumor-origin cells, fibroblasts, macrophages, T cells, and other relevant cell types. Select at most 80 cell-cell interactions per group.
- Select only genes associated with immune checkpoint and cell cycle pathways, show cell-cell interactions for these genes, and save the result.
- Find cell-cell interactions involving major immune and stromal cells that differ significantly between conditions, show them as a dot plot, and save the result. Set max_n_items_per_group to 60. For each interaction identified under each condition, using the provided dataset context, describe the associated signaling pathways and mechanisms, its potential as a therapeutic target, and relevant therapeutic agents.
- Show marker expressions for Lung Epithelial cell tumor-origin cells in a dot plot, and save the result. Use only surfaceome markers, with at most 60 markers per condition. For the markers identified under each condition, distinguish between established therapeutic targets and less well-characterized markers with potential as therapeutic targets. For each marker, using the provided dataset context, describe the associated signaling pathways and mechanisms, relevant therapeutic agents, and supporting evidence.
- Show marker expressions for Macrophage in a dot plot, and save the result. Use only surfaceome markers, with at most 40 markers per condition. For each marker identified under each condition, using the provided dataset context, describe the associated signaling pathways, the role of the corresponding cell type in the tumor microenvironment, the marker’s potential as a therapeutic target, relevant therapeutic agents, and other pertinent information.
- Show marker expressions for Fibroblast in a dot plot, and save the result. Use only surfaceome markers, with at most 40 markers per condition. For each marker identified under each condition, using the provided dataset context, describe the associated signaling pathways, the role of the corresponding cell type in the tumor microenvironment, the marker’s potential as a therapeutic target, relevant therapeutic agents, and other pertinent information.
- Show marker expressions for T cell CD4+ in a dot plot, and save the result. Use only surfaceome markers, with at most 40 markers per condition. For each marker identified under each condition, using the provided dataset context, describe the associated signaling pathways, the role of the corresponding cell type in the tumor microenvironment, the marker’s potential as a therapeutic target, relevant therapeutic agents, and other pertinent information.
- Among cell cycle pathway genes, select those with statistically significant expression differences between conditions in Lung Epithelial cells, show box plots, and save the result. Set max_n_items_to_plot to 24 and choose ncols based on the total number of panels for an overall width-to-height ratio of approximately 2:3.
- Show and save Gene Ontology (GSA) analysis results for Lung Epithelial cell tumor-origin cells as a bar plot.
- Show Gene Set Enrichment Analysis results as a dot plot, and save it. Set the color map to RdBu_r, n_pws_to_show to 120, and target_cells to None.