Single-Cell Atlas of Pancreatic Ductal Adenocarcinoma Reveals Aberrant Cell States and Intercellular Crosstalk in the Tumor Microenvironment
Pancreatic Ductal Adenocarcinoma (PDAC) presents a highly altered cellular landscape compared to adjacent normal tissue. Genomic instability, characterized by widespread aneuploidy, is a hallmark of malignant Ductal cells. The tumor microenvironment exhibits dramatic shifts in cell type composition, including reduced cytotoxic T cells, increased immunosuppressive T cells (Tregs), and a surprisingly M1-dominant macrophage population alongside extensive stromal expansion. Complex and dysregulated cell-cell interactions drive tumor progression and immune evasion, highlighting a coordinated multi-cellular reprogramming.
Contents
- Dataset overview
- UMAP Visualization of Pancreatic Single-Cell Transcriptome Data
- UMAP 기반 주요 세포 유형 점수 및 주석 시각화
- Overall Celltype_subset Marker Expression Pattern Analysis
- Genomic Copy Number Variation Analysis in Tumor-Origin and Unassigned Pancreatic Cells
- CNV 기반 UMAP 시각화를 통한 세포 유형, 이수성, 조건 및 샘플 분포 분석
- Minor Cell Type Population Analysis in Pancreatic Tissues
- T cell Subpopulation Shifts in Pancreatic Ductal Adenocarcinoma (PDAC)
- Changes in T Cell Subset Proportions in Pancreatic Ductal Adenocarcinoma (PDAC) Tumor Microenvironment
- Macrophage Subset Population Analysis in Pancreatic Ductal Adenocarcinoma (PDAC)
- Macrophage Gene Expression Shifts in Pancreatic Ductal Adenocarcinoma (PDAC)
- Ploidy Analysis of Tumor-Origin (Ductal) and Unassigned Cells in Pancreatic Cancer
- Cell-Cell Interaction Patterns in Pancreatic Ductal Adenocarcinoma (PDAC) vs. Adjacent Normal Tissue
- Condition-Specific Cell-Cell Interaction Patterns in Pancreatic Ductal Adenocarcinoma (PDAC)
- Immune Checkpoint Pathway Interactions in Pancreatic Tissue
- Condition-Specific Cell-Cell Interaction Patterns in Pancreatic Cancer
- Ductal Cell Condition-Specific Surfaceome Markers in Pancreatic Cancer
- Macrophage Condition-Specific Surfaceome Markers in Pancreatic Cancer
- CD4+ T Cell Condition-Specific Surfaceome Markers in Pancreatic Adenocarcinoma
- Ductal Cell Cycle Gene Dysregulation in Pancreatic Ductal Adenocarcinoma (PDAC)
- Gene Ontology (GSA) Analysis of Ductal Cells in Pancreatic Conditions
- Gene Set Enrichment Analysis (GSEA) of Ductal Cells, Macrophages, and CD4+ T Cells in Pancreatic Tissue
- Discussion
- Query List
0. Dataset overview
Dataset Summary
- Dimensions: This dataset contains single-cell RNA-seq data for 49,221 cells and 23,910 genes.
- Origin: The data is from human Pancreas tissue.
- Conditions: The samples are categorized under two conditions: 'Adj_normal' and 'PDAC'.
Cell Type Annotations: Cells are annotated at three hierarchical levels
- Major: Stromal cell, Endothelial cell, Acinar cell, T cell, Myeloid cell, Mast cell, Ductal cell, B cell.
- Minor: Smooth muscle cell, Endothelial cell, Acinar cell, T cell CD8+, T cell CD4+, Macrophage, Mast cell, Ductal cell, Stellate cell, B cell, ILC, Fibroblast, NK cell, Dendritic cell, Plasma cell.
- Subset: Further granular cell types like Smooth muscle cell, Endothelial cell, T cell (Cytotoxic), Macrophage (M2C), etc.
- Tumor Origin Celltype: Ductal cell is identified as the tumor origin cell type.
- Ploidy Status: Cells are classified by 'ploidy_dec' as Aneuploid or Diploid.
- Reference Condition: 'Adj_normal' is used as the reference for differential expression (DEG), GSEA, and GSA analyses.
Precomputed Results Overview
- Cell-Cell Interaction (CCI): Precomputed CCI results (from CellPhoneDB) are available per condition (uns['CCI']) and per sample (uns['CCI_sample']).
- Differential Gene Expression (DEG): DEG results comparing one condition versus the rest are available for specific celltype_minor groups (uns['DEG']).
- Gene Set Enrichment Analysis (GSEA): GSEA results comparing one condition versus the rest are available for specific celltype_minor groups (uns['GSEA']).
- Gene Ontology (GO/GSA): GO (GSA) results for upregulated genes comparing one condition versus the rest are available for specific celltype_minor groups (uns['GSA_up']).
- Copy Number Variation (CNV): CNV estimates (obsm['X_cnv']) and ploidy inference labels (obs['ploidy_dec']) are available.
1. UMAP Visualization of Pancreatic Single-Cell Transcriptome Data
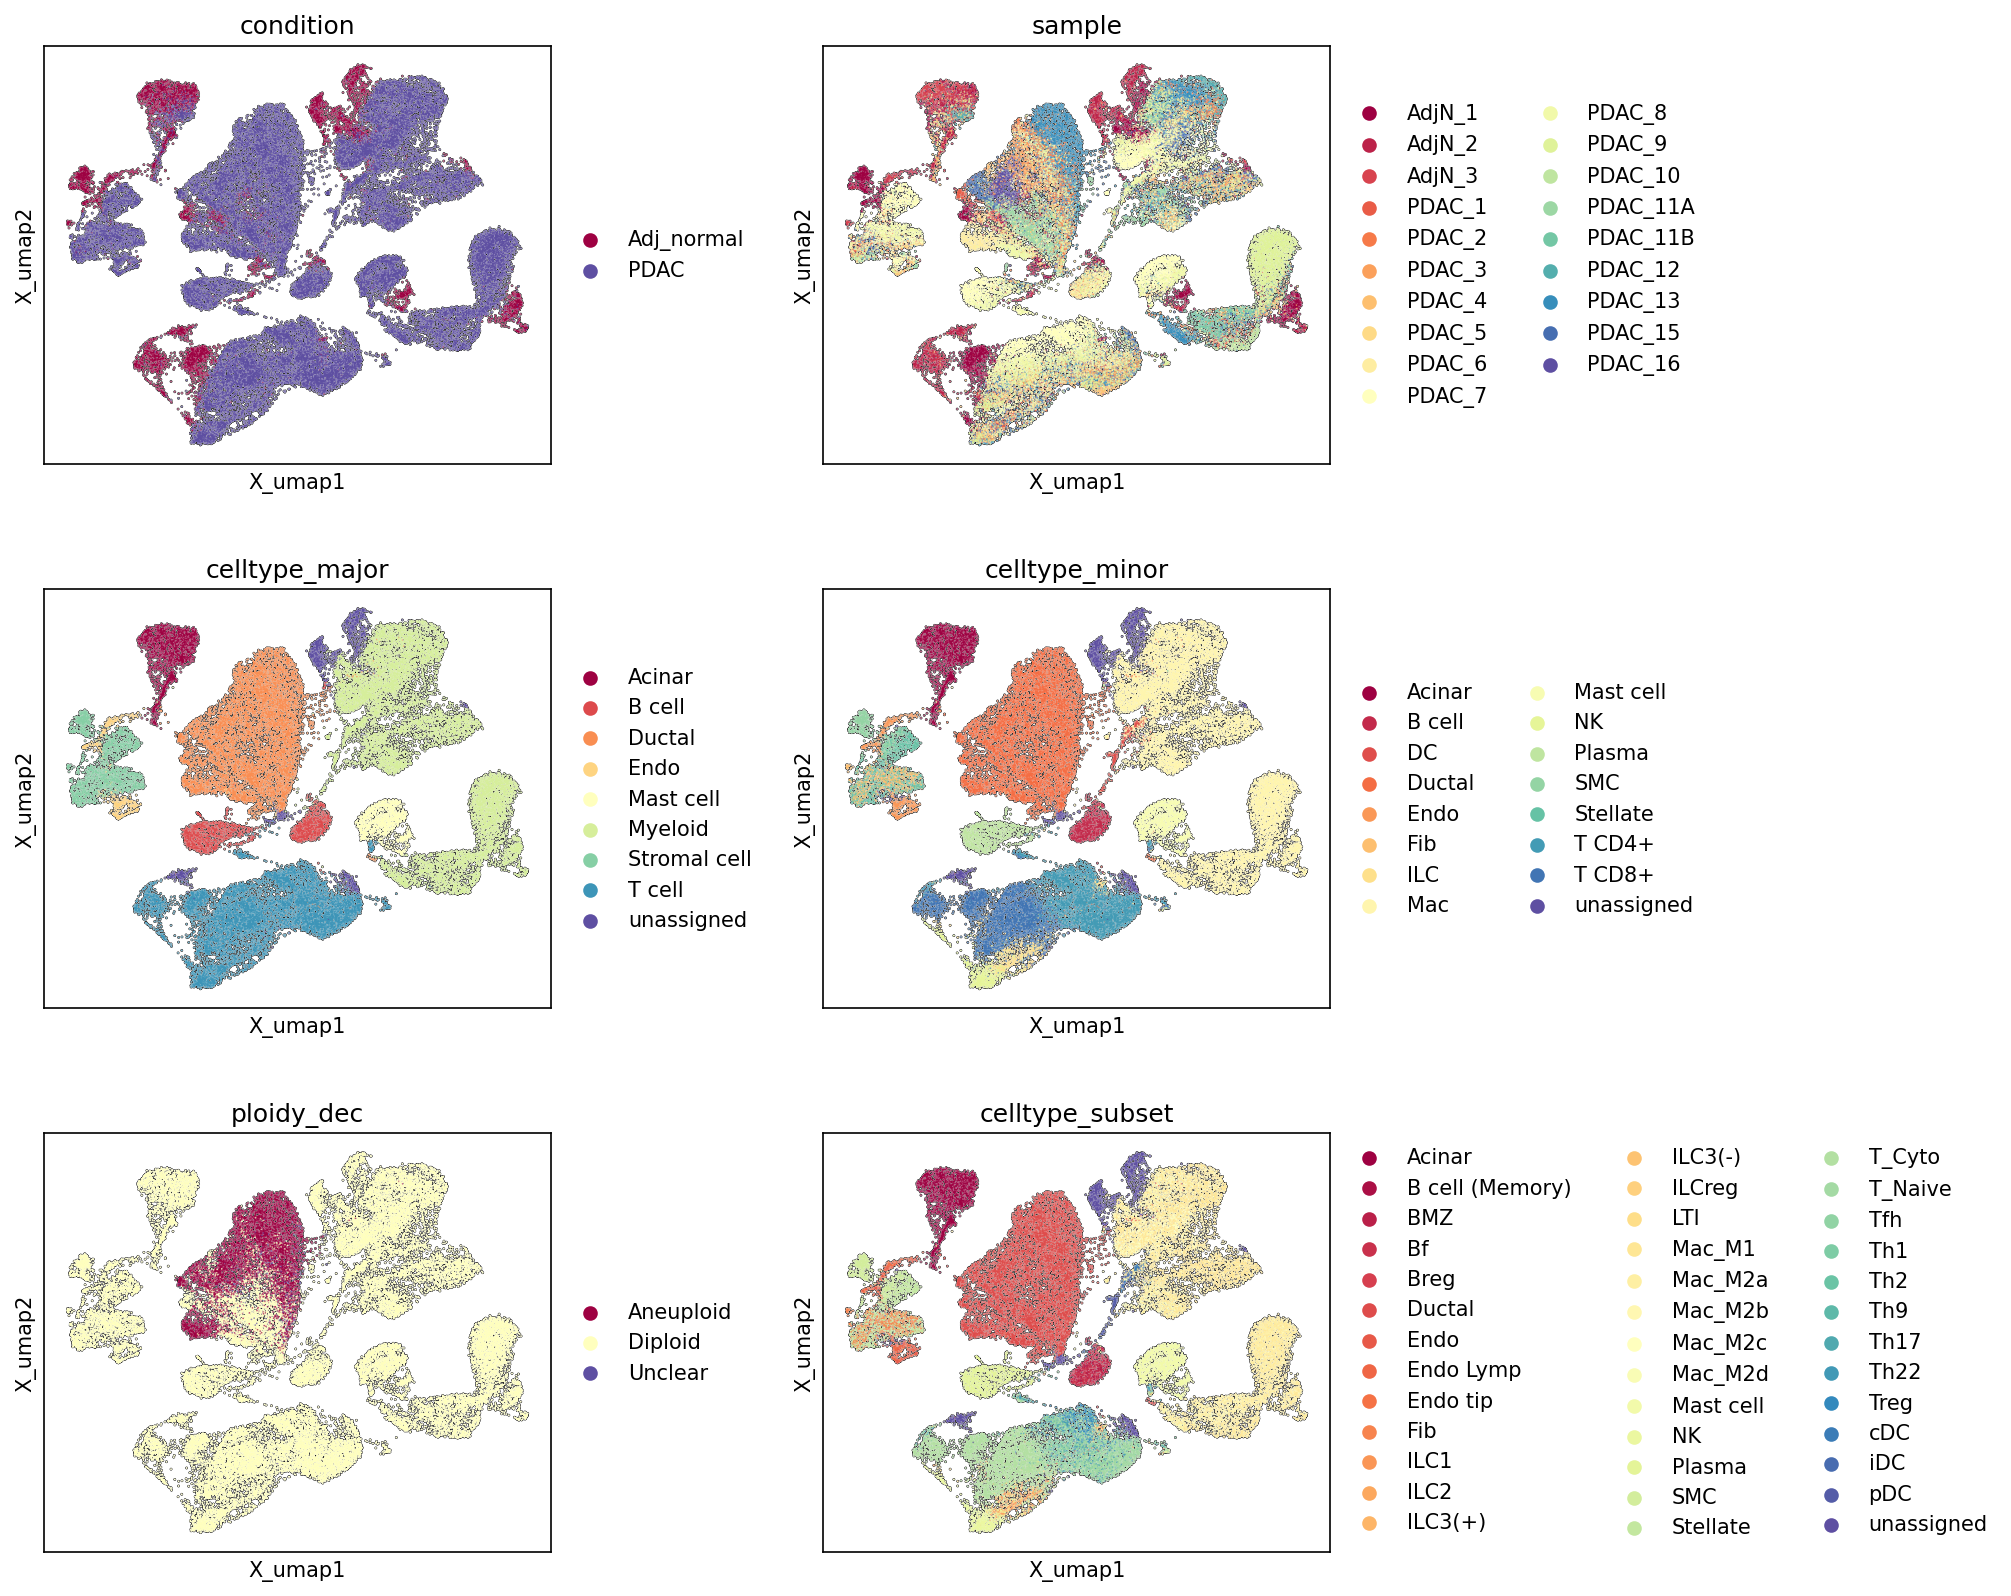
[Analysis Visualization Results]...
Analysis Overview
This analysis presents a series of Uniform Manifold Approximation and Projection (UMAP) plots, visualizing the global transcriptional landscape of 49,221 single cells from human pancreas tissue. The UMAPs are colored by various metadata features: condition (Adj_normal vs. PDAC), sample, celltype_major, celltype_minor, ploidy_dec (Aneuploid, Diploid), and celltype_subset. This visualization helps to understand the distribution of cells, the distinctness of cell populations, the presence of condition- or sample-specific clusters, and the ploidy status of different cell types within the dataset.
Visual Summary
- Condition UMAP: The UMAP clearly shows distinct separation between cells from Adj_normal (red) and PDAC (purple) conditions, particularly in the upper-left and central clusters. While some overlap exists, suggesting shared cell types or states, large regions are dominated by one condition, indicating significant transcriptional differences and potentially altered cell composition in PDAC. Specifically, the large central-to-upper cluster appears predominantly PDAC, while a major cluster in the lower-left is largely Adj_normal.
- Sample UMAP: Cells from different samples generally mix well within their respective conditions (Adj_normal vs. PDAC clusters). This indicates that batch effects between samples are largely mitigated, and observed differences are more likely driven by biological variation related to condition rather than technical artifacts. The Adj_normal samples (AdjN_1, AdjN_2, AdjN_3) cluster together in the bottom-left, distinct from the PDAC samples (PDAC_1 through PDAC_16) which form the larger, more distributed clusters.
- Celltype_major UMAP: The major cell types show well-defined and largely distinct clusters on the UMAP, demonstrating robust cell type annotation. Acinar cells form a tight cluster in the bottom-left. Ductal cells occupy a prominent central cluster. Stromal cells form a distinct cluster in the lower-right. Immune cells such as T cells, B cells, and Myeloid cells form more interconnected clusters in the upper-right and central regions. Endothelial cells are present in various smaller clusters. unassigned cells are dispersed, indicating they may represent rare populations, transition states, or cells that do not clearly fit predefined cell type markers.
- Celltype_minor UMAP: This plot provides a more granular view, confirming the distinctness of sub-populations. For instance, T cells from the major cell type split into T cell CD4+ and T cell CD8+. Myeloid cells separate into Macrophage, Dendritic cell, and Mast cell. Stromal cells resolve into Stellate cell and Fibroblast. Ductal cells remain a large, central population, aligning with the "Tumor origin celltype" information. The clear separation of these minor types further supports the quality of cell type annotation.
- Ploidy_dec UMAP: A striking pattern emerges for ploidy_dec. A significant proportion of cells, particularly within the large PDAC-dominated cluster (from the condition UMAP), are labeled Aneuploid (red). These Aneuploid cells largely overlap with the central Ductal cell cluster and some surrounding Stromal and Myeloid cells, which is consistent with the Ductal cell origin of PDAC. Most other cell types, including the Acinar and Adj_normal clusters, are predominantly Diploid (yellow). A small number of Unclear cells are scattered.
- Celltype_subset UMAP: This plot offers the most detailed cellular resolution. It further differentiates populations such as various Macrophage subtypes (M1, M2A, M2B, M2C, M2D), T cell subsets (Cytotoxic, Th1, Th2, Th17, Treg, Naive, Tfh, Th9, Th22), B cell subsets (Follicular, Memory, Breg, MZ), and ILC subtypes, among others. These subsets generally maintain distinct clustering patterns, indicating fine-grained resolution of cell states and identities. The extensive annotation confirms the rich cellular heterogeneity captured in this dataset.
Biological Interpretation
The UMAP visualizations provide critical insights into the cellular composition and state changes associated with Pancreatic Ductal Adenocarcinoma (PDAC).
- Disease-Associated Cell State Changes: The clear separation of Adj_normal and PDAC cells suggests significant transcriptional reprogramming occurring in the tumor microenvironment. This likely involves not only the malignant cells but also the diverse stromal and immune cells that infiltrate and support tumor growth.
- Tumor Cell Identification and Ploidy: The Ductal cell cluster is central and prominent, consistent with its designation as the tumor origin cell type. Crucially, the ploidy_dec UMAP shows that a large proportion of these Ductal cells within the PDAC cluster are Aneuploid. Aneuploidy, the presence of an abnormal number of chromosomes, is a hallmark of cancer and strongly supports the identification of these cells as malignant tumor cells. The relatively confined aneuploid population suggests that the ploidy inference is specific to the likely malignant compartment.
- Tumor Microenvironment Composition: The presence of diverse Stromal cells (Fibroblasts, Stellate cells), Endothelial cells (Endo, Endo Lymp, Endo tip), and various Immune cells (T cells, B cells, Macrophages, Mast cells, NK cells, DCs, Plasma cells, ILCs) within the PDAC-dominated region highlights the complex and heterogeneous tumor microenvironment. The differential distribution of these immune and stromal subsets between conditions (though not explicitly shown as condition overlay for cell subsets, implied by the overall condition separation) would warrant further investigation to understand their roles in tumor progression and immune evasion.
- Annotation Quality: The consistent and hierarchical clustering from celltype_major to celltype_subset demonstrates the high quality and robustness of the cell type annotations. Cells of the same type generally cluster together, and sub-types further refine these clusters, indicating a comprehensive and accurate cellular atlas.
- Sample Integration: The good mixing of samples within conditions, without clear sample-specific clusters, indicates successful integration of data from multiple donors, allowing for robust comparisons between disease states without confounding batch effects.
Annotation Notes
The UMAPs collectively provide a strong overview of the dataset's quality and the biological signals present. The distinct clustering of major and minor cell types, coupled with the clear separation of conditions and the localized aneuploidy in suspected tumor cells, validates the robust annotation and embedding structure. The presence of 'unassigned' cells across different annotation levels, while small, could indicate either rare populations not yet classified or cells in transient states, warranting potential further investigation to refine the annotation.
2. UMAP 기반 주요 세포 유형 점수 및 주석 시각화
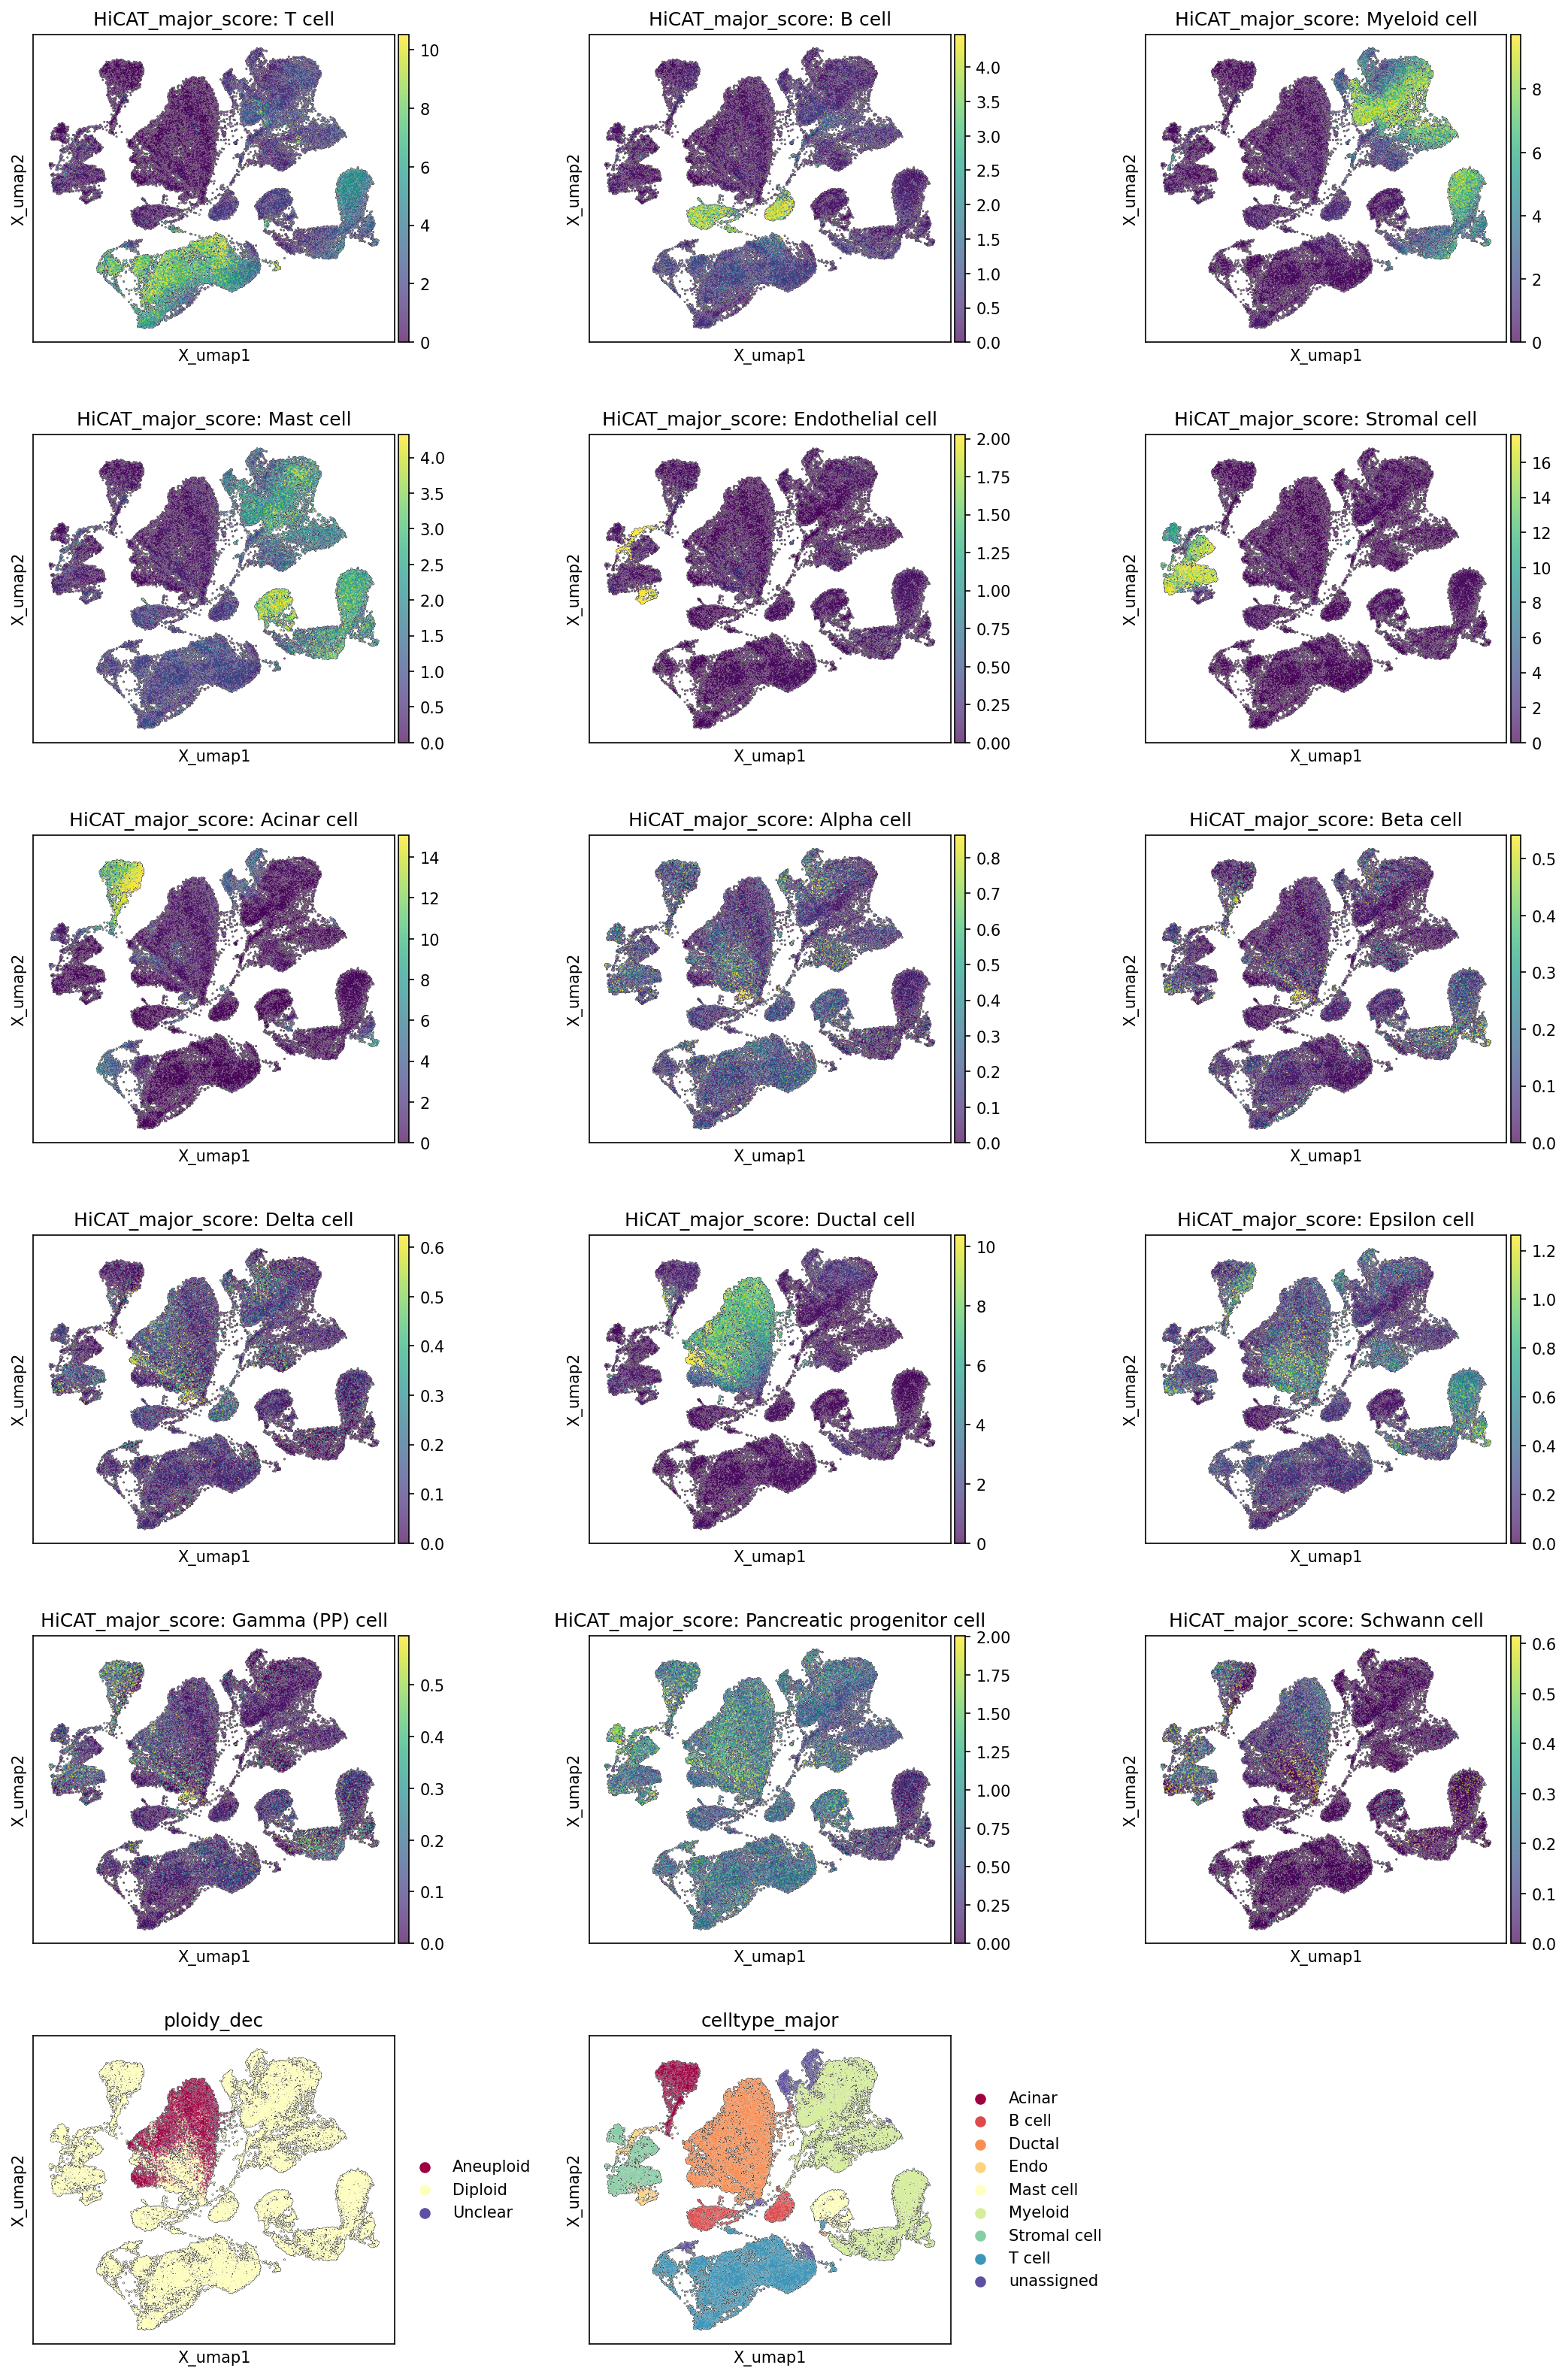
[Analysis Visualization Results]...
Analysis Overview
제공된 분석은 단일 세포 RNA 시퀀싱(scRNA-seq) 데이터를 기반으로 췌장(Pancreas) 조직의 세포 유형을 UMAP 공간에 시각화한 결과입니다. 이 분석은 각 세포가 특정 주요 세포 유형(celltype_major)에 속할 확률 또는 특이성을 나타내는 점수(HiCAT_major_score)를 UMAP에 매핑하여 보여줍니다. 또한, 각 세포의 플로이드 상태(ploidy_dec: Aneuploid/Diploid)와 최종적으로 할당된 주요 세포 유형(celltype_major)도 함께 시각화하여 세포 유형 분류의 일관성과 종양 관련 특성을 평가합니다. 데이터는 인접 정상(Adj_normal) 및 췌장 선암(PDAC) 조건에서 유래하며, 종양 기원 세포는 Ductal cell로 정의되어 있습니다.
Visual Summary
제공된 UMAP 플롯은 전체 49,221개의 세포를 23,910개 유전자를 기반으로 저차원 공간에 투영한 결과를 보여줍니다.
주요 세포 유형 점수(HiCAT_major_score) 분포:
- 각 UMAP 플롯은 특정 celltype_major의 점수를 색상 강도로 나타냅니다. 점수가 높은 영역은 해당 세포 유형의 정체성을 강하게 나타내는 클러스터를 형성합니다.
- 예를 들어, T cell, B cell, Myeloid cell, Mast cell, Endothelial cell, Stromal cell, Acinar cell, Ductal cell 등 대부분의 주요 세포 유형은 UMAP 공간에서 명확하고 분리된 클러스터 또는 특정 영역에 높은 점수를 보이며 응집되어 있습니다. 이는 각 세포 유형이 고유한 전사체 프로파일을 가지고 잘 분리되어 있음을 시사합니다.
- 특히, Acinar cell과 Ductal cell은 췌장의 주요 실질 세포로서 UMAP 상에서 뚜렷하게 큰 클러스터를 형성하고 있습니다.
- Alpha, Beta, Delta, Epsilon, Gamma (PP) cell과 같은 췌장 내분비 세포 유형은 Acinar cell 및 Ductal cell 클러스터와 인접한 작은 클러스터들을 형성하며, 이들 역시 해당 세포 유형의 점수가 높게 나타납니다. Pancreatic progenitor cell과 Schwann cell도 특정 영역에 높은 점수를 보입니다.
- 일부 세포 유형, 특히 수가 적거나 전사체 유사성이 높은 세포 유형의 경우 클러스터가 더 작거나 분산되어 보일 수 있습니다.
플로이드 상태(ploidy_dec) 분포:
- ploidy_dec UMAP 플롯에서는 특정 클러스터(UMAP 중앙 상단부)가 뚜렷하게 'Aneuploid' (붉은색) 세포로 구성되어 있음을 보여줍니다. 이 클러스터는 UMAP의 다른 대부분의 'Diploid' (노란색) 세포 클러스터와 명확하게 구분됩니다. 'Unclear' (보라색) 세포는 매우 적게 나타납니다.
- Aneuploid 클러스터는 PDAC 종양 세포 집단을 나타낼 가능성이 높습니다.
주요 세포 유형(celltype_major) 주석:
- celltype_major UMAP 플롯은 각 세포에 할당된 최종 주요 세포 유형을 색상으로 구분하여 보여줍니다.
- 이 플롯은 HiCAT_major_score 플롯에서 관찰된 각 세포 유형의 고점수 영역과 높은 일관성을 보이며, 잘 분리된 클러스터로 표현됩니다.
- 특히, Ductal cell (주황색) 클러스터가 UMAP 중앙 상단부에 크게 존재하며, 이 클러스터의 상당 부분이 ploidy_dec 플롯에서 Aneuploid로 표시된 영역과 일치하는 것으로 보입니다. 이는 Ductal cell이 종양 기원 세포라는 데이터 컨텍스트와 부합합니다.
- Acinar cell (갈색), Stromal cell (청록색), T cell (하늘색), Myeloid cell (밝은 노란색) 등 다른 주요 세포 유형도 UMAP 상에서 잘 구분된 클러스터를 형성하고 있습니다.
Biological Interpretation
이러한 시각화 결과는 췌장 조직 내 세포 이질성을 효과적으로 보여주며, 특히 PDAC 미세 환경에 대한 중요한 통찰력을 제공합니다.
- 세포 유형 식별의 견고성: HiCAT_major_score 플롯이 각 세포 유형의 고유한 클러스터를 명확하게 보여주고, 이 분포가 최종 celltype_major 주석과 높은 일관성을 보인다는 것은 세포 유형 식별이 robust하게 이루어졌음을 시사합니다. 이는 전사체 데이터를 기반으로 한 세포 유형 분류의 신뢰성을 높여줍니다.
- 종양 세포의 식별 및 특성:
- ploidy_dec 플롯에서 관찰된 Aneuploid 세포 클러스터는 PDAC의 종양 세포를 나타내는 강력한 증거입니다. 암세포는 흔히 이수성(aneuploidy)을 특징으로 합니다 PubMed search: cancer aneuploidy.
- 이 Aneuploid 클러스터가 celltype_major 플롯의 Ductal cell 클러스터와 주로 겹친다는 점은 데이터 컨텍스트에서 'Tumor origin celltype: Ductal cell'이라고 명시된 바와 같이, 췌장 선암의 기원이 췌장 관세포(Ductal cell)임을 강력하게 뒷받침합니다. 이는 PDAC 샘플에서 변형된 Ductal cells이 종양의 주요 구성 요소임을 시사합니다.
- 췌장 미세 환경의 구성:
- UMAP은 면역 세포(T cell, B cell, Myeloid cell, Mast cell), 기질 세포(Stromal cell - Smooth muscle cell, Stellate cell, Fibroblast 포함), 혈관 내피 세포(Endothelial cell), 그리고 췌장의 기능적 실질 세포(Acinar cell, Ductal cell, Alpha/Beta/Delta/Epsilon/Gamma cell 등 내분비 세포)가 각각 독립적인 클러스터를 형성하고 있음을 보여줍니다. 이는 췌장 미세 환경의 복잡성을 시각적으로 잘 나타냅니다.
- 이들 비종양 세포는 대부분 Diploid 상태를 유지하고 있어, Aneuploid 종양 세포와 명확하게 구분됩니다.
- 세포 상호작용의 잠재적 영역: UMAP 상에서 특정 세포 유형 클러스터들이 서로 근접하게 위치하는 것은 생물학적으로 관련성이 높은 세포 간 상호작용이 일어날 가능성이 있음을 시사합니다 (예: 면역 세포와 종양 세포 간의 상호작용). 향후 CCI 분석을 통해 이러한 가설을 탐색할 수 있습니다.
Annotation Notes
- HiCAT_major_score와 celltype_major 주석 간의 높은 일관성은 현재의 세포 유형 분류가 안정적임을 나타냅니다.
- ploidy_dec 정보를 활용하여 종양 세포 집단을 명확하게 식별하고, 이를 통해 종양 유래 세포와 비종양 유래 세포를 구분하는 데 있어 주석의 신뢰도를 더욱 높일 수 있습니다.
- 세포 유형 클러스터들이 UMAP 공간에서 잘 분리되어 있지만, 일부 작은 클러스터나 희귀 세포 유형에 대한 추가적인 검증(예: 특정 마커 유전자 발현 확인)은 주석의 정밀도를 향상시킬 수 있습니다.
3. Overall Celltype_subset Marker Expression Pattern Analysis
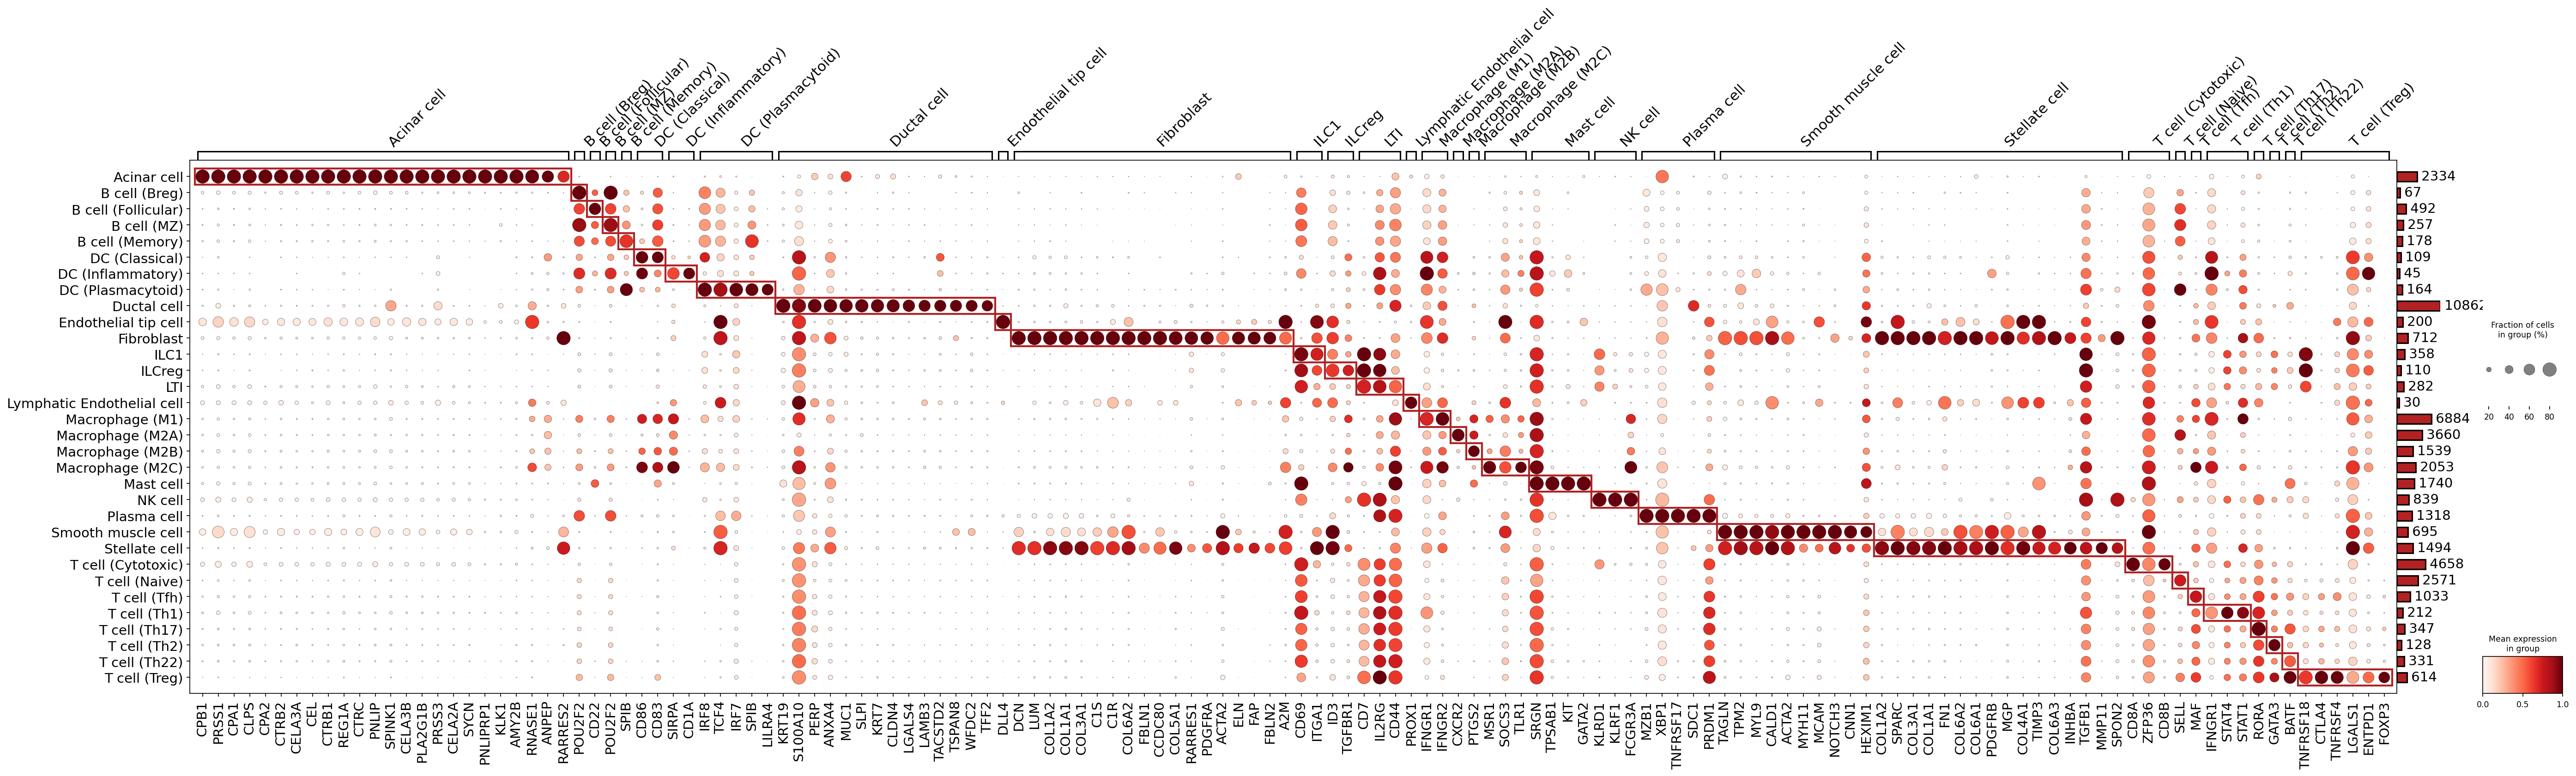
[Analysis Visualization Results]...
Analysis Overview
This analysis presents a dot plot illustrating the expression patterns of key marker genes across different celltype_subset populations identified in the single-cell RNA-seq data from the Pancreas tissue. The purpose of this visualization is to assess the robustness and specificity of the cell type annotations by examining whether the identified marker genes align with known biological characteristics of each cell type. Each row represents a distinct cell type subset, and each column represents a marker gene. The size of each dot indicates the fraction of cells within that subset expressing the gene, while the color intensity (red scale) indicates the mean expression level of the gene in that subset.
Visual Summary
The dot plot displays a clear and well-organized pattern of marker gene expression. Distinct blocks of highly expressed and specific genes are evident along the diagonal, which is visually reinforced by the red boxes. This diagonal pattern suggests that most celltype_subset populations are characterized by unique sets of markers, supporting their distinct identities. Related cell types, such as different B cell subsets (Breg, Follicular, MZ, Memory, Plasma cell) or T cell subsets (Cytotoxic, Naive, Th1, Th17, Th2, Th22, Treg), tend to cluster together, sharing some broad lineage markers while also exhibiting subset-specific expression patterns.
Specifically:
- High Specificity: Many genes show very high expression (dark red) and prevalence (large dot size) within only one or a few closely related cell type subsets, indicating strong cell-type specificity.
- Lineage Relationships: Shared markers are visible among cells belonging to the same broad lineage (e.g., different B cell subsets expressing B cell lineage markers, or T cell subsets expressing T cell lineage markers), with additional markers distinguishing finer subsets.
- Expression Levels and Prevalence: There's a good balance between the fraction of cells expressing a gene and the mean expression level, suggesting that these markers are not only expressed by many cells within a group but also at significant levels.
- Distinct Compartments: Acinar, Ductal, Endothelial, Stromal (Fibroblast, Stellate, Smooth muscle), and Immune cell compartments (B cells, DCs, Macrophages, Mast cells, NK cells, T cells, ILCs) each exhibit highly characteristic marker profiles.
Biological Interpretation
The observed marker gene expression patterns strongly support the biological identities assigned to each celltype_subset.
- Acinar Cells: Display strong and specific expression of genes characteristic of pancreatic exocrine function, such as digestive enzymes (e.g., CPB1, PRSS1, CPA1, CELA3A, CTRB1, PNLIP, SPINK1). This confirms their identity as the primary producers of digestive enzymes in the pancreas.
- GeneCards: PRSS1
- B Cell Subsets: Show expected expression of pan-B cell markers (e.g., MS4A1, CD79A) across various B cell subtypes. Plasma cells are distinctly identified by markers like XBP1, SDC1 (CD138), and PRDM1 (BLIMP1), consistent with their role in antibody secretion.
- GeneCards: SDC1
- Ductal Cells: Are marked by characteristic epithelial cytokeratins and related genes (e.g., KRT7, KRT19, S100A10, ANXA4), confirming their epithelial origin and function in forming pancreatic ducts.
- GeneCards: KRT7
- Endothelial Cells: Both Endothelial tip cells and Lymphatic Endothelial cells show expression of endothelial lineage markers (e.g., FLT1, VWF, PECAM1). Lymphatic Endothelial cells are further specified by PROX1 and LYVE1, which are crucial for lymphatic vessel development and function.
- GeneCards: PROX1
- Stromal Cells (Fibroblast, Stellate, Smooth Muscle): These cell types, critical for structural support and tissue remodeling, exhibit distinct yet overlapping sets of markers.
- Fibroblasts: Express extracellular matrix components and regulators (e.g., COL1A1, COL1A2, DCN, LUM).
- Stellate Cells: Show expression of markers like SPARC, PDGFRB, and ACTA2 (alpha-smooth muscle actin), indicating their myofibroblast-like properties when activated, contributing to fibrosis.
- Smooth Muscle Cells: Are identified by classical contractile proteins (e.g., ACTA2, MYH11, CNN1, TAGLN).
- GeneCards: ACTA2
Myeloid Cells (DC, Macrophage, Mast cell)
- Dendritic Cells (DCs): Subsets (Classical, Inflammatory, Plasmacytoid) show unique markers (e.g., CD83 for DCs in general, SPIB for pDCs), reflecting their diverse roles in antigen presentation and immune activation.
- Macrophage Subsets (M1, M2A, M2B, M2C): While sharing some general macrophage markers, the plot indicates potential for distinguishing functional polarizations based on more subtle marker differences.
- Mast Cells: Highly specific markers such as KIT (CD117) and TPSAB1 (Tryptase alpha/beta 1) confirm their identity.
- GeneCards: KIT
Lymphoid Cells (ILC, NK, T cells)
- NK Cells: Express characteristic natural killer cell receptors and effectors (e.g., KLRD1, FCGR3A).
- T Cell Subsets: Exhibit classic T cell markers (e.g., CD3D, CD3E) and subset-specific markers such as CD8A/B for cytotoxic T cells, CD4 for helper T cells, and FOXP3/IL2RA for regulatory T cells (Tregs). Other helper T cell subsets (Th1, Th2, Th17, Th22, Tfh) are also distinguished by known lineage-defining transcription factors or cytokines.
- GeneCards: FOXP3
- ILC Subsets (ILC1, ILC2, ILC3): Show distinct marker profiles, reflecting their innate immune functions analogous to T helper cell subsets.
Annotation Notes
The comprehensive and largely distinct marker expression profiles for the various celltype_subset groups strongly affirm the quality and reliability of the cell type annotations. The identification of established, specific markers for nearly all subsets, including finer distinctions within B cells, T cells, and stromal populations, suggests a robust annotation process. The visual clarity of the dot plot, with well-defined clusters of specific markers for each cell type, provides strong evidence that the assigned cell identities are well-supported by the underlying gene expression data. This robust annotation forms a solid foundation for further downstream analyses.
4. Genomic Copy Number Variation Analysis in Tumor-Origin and Unassigned Pancreatic Cells
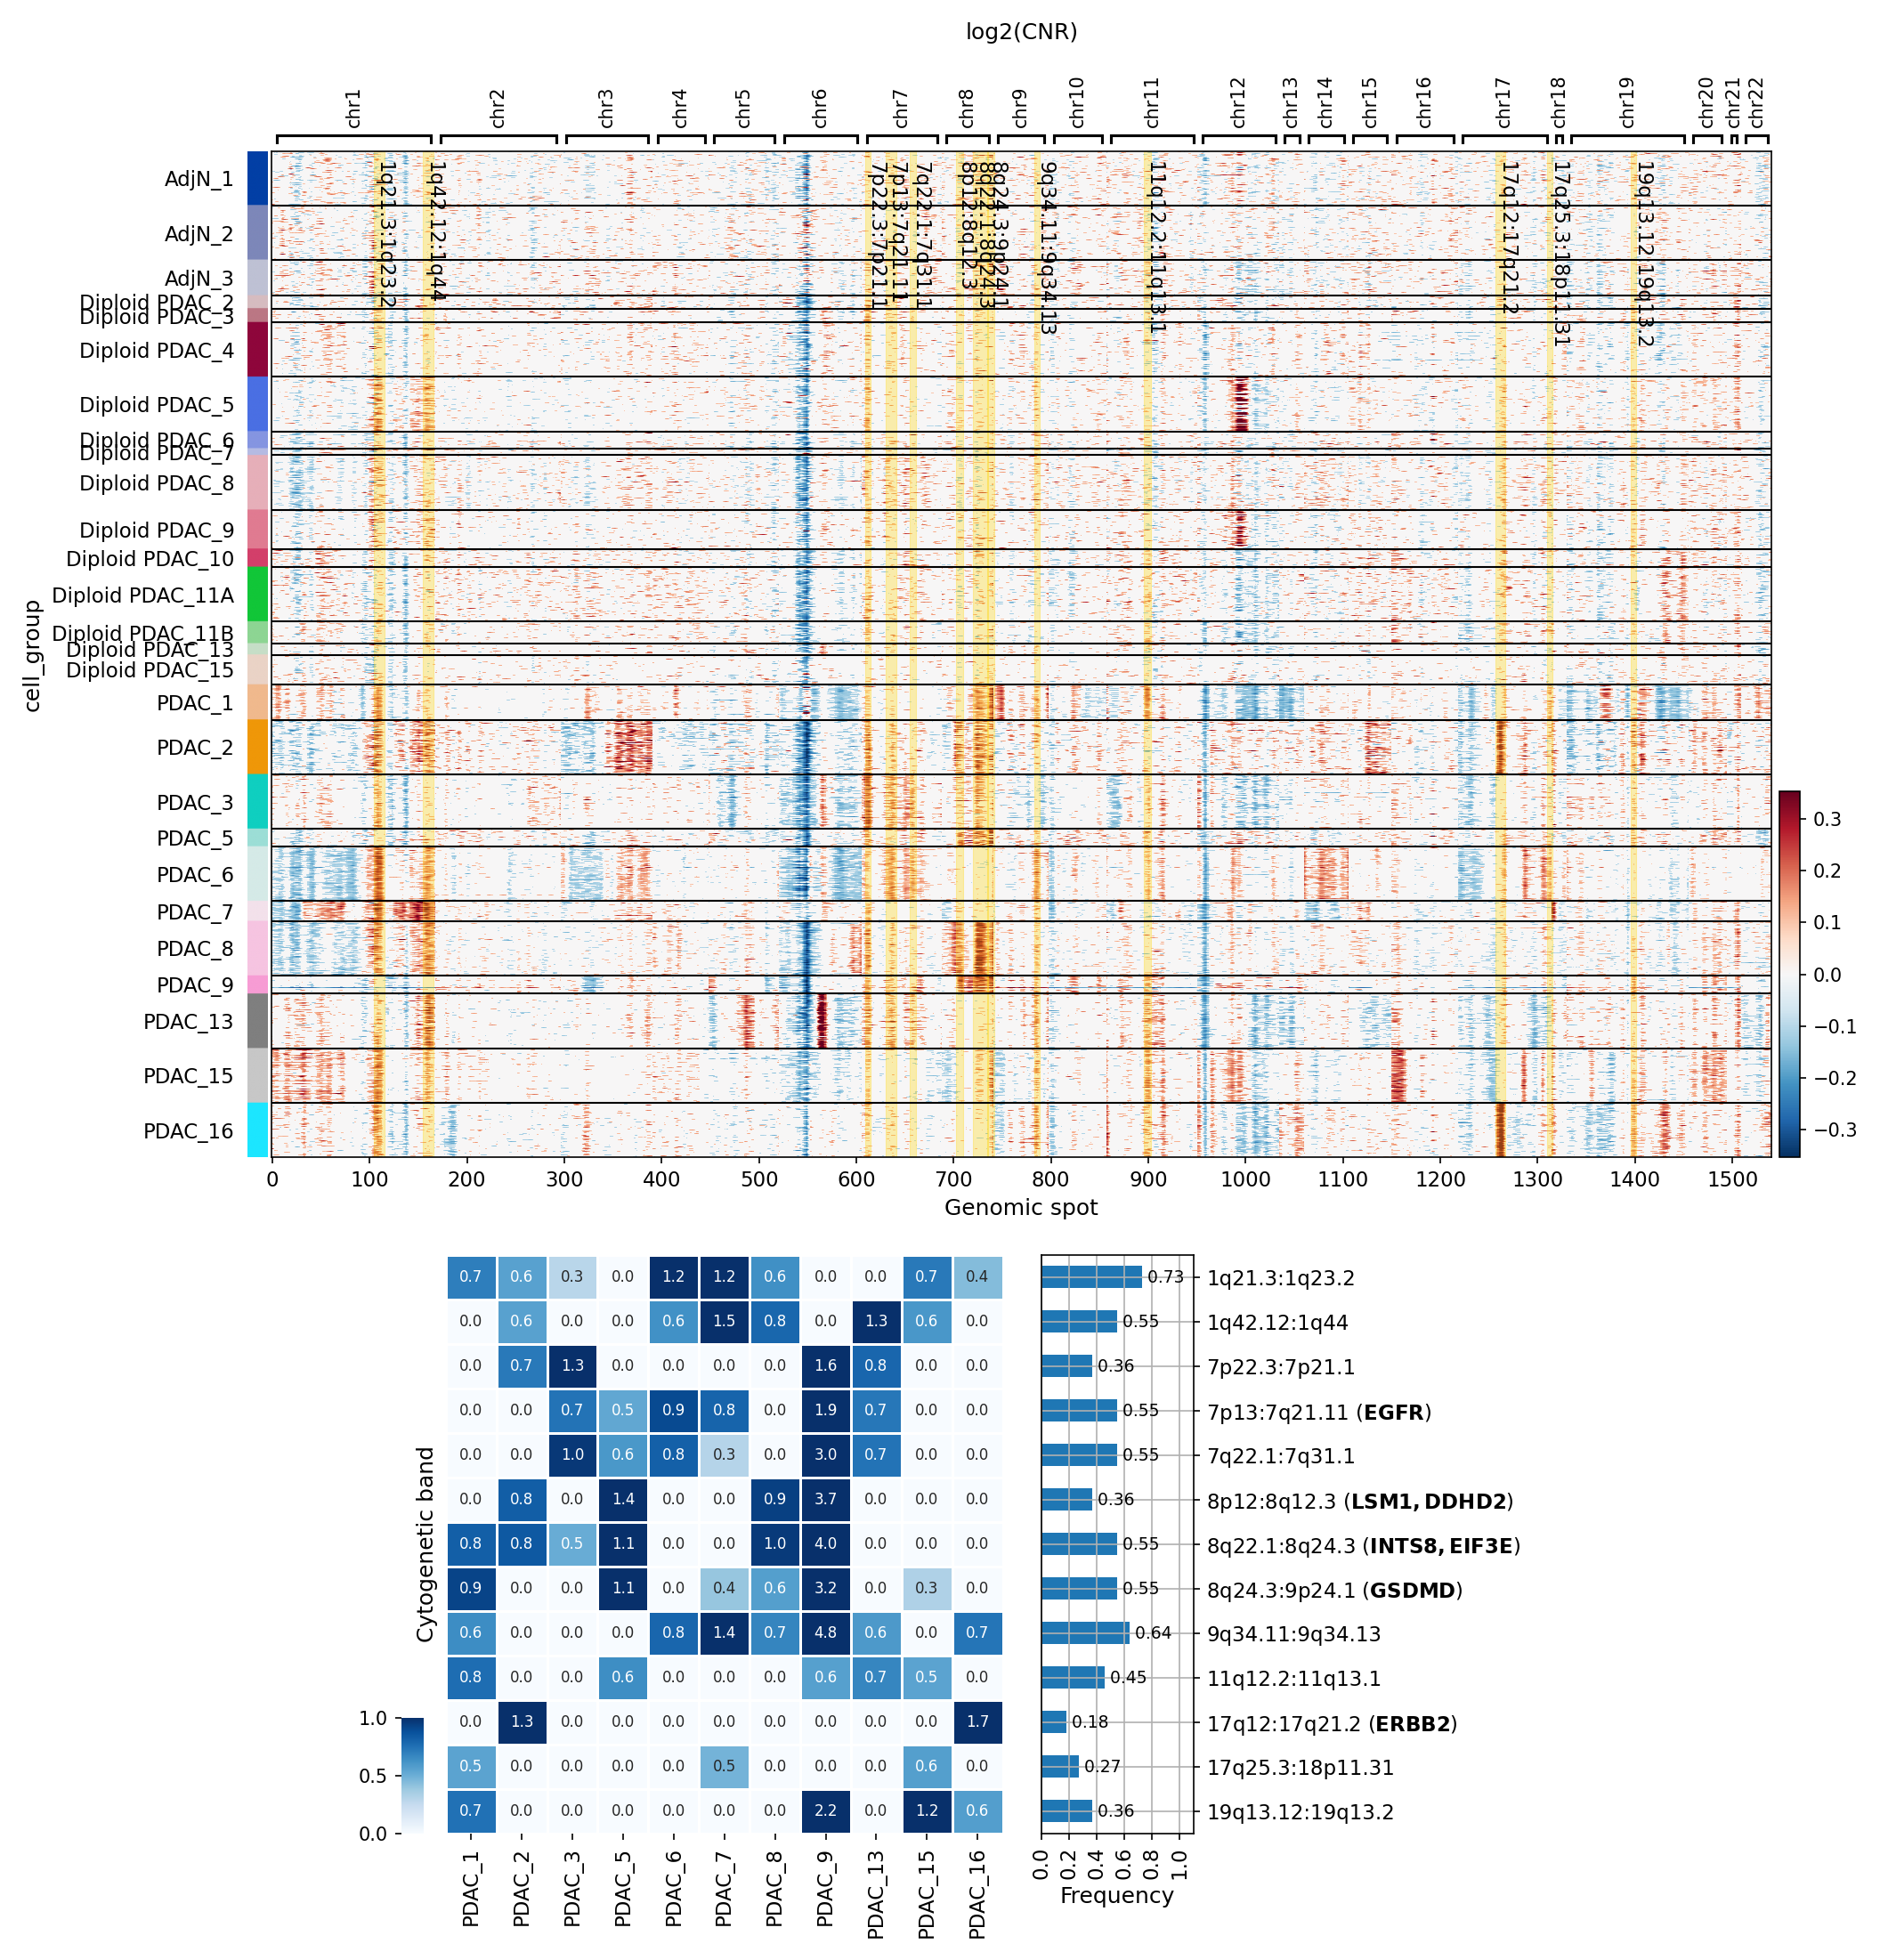
[Analysis Visualization Results]...
Analysis Overview
This analysis investigates genomic copy number variations (CNVs) in cells identified as "Ductal cell" (the presumed tumor-origin cell type for Pancreatic Ductal Adenocarcinoma, PDAC) and "unassigned" cells within various pancreatic tissue samples. The cells were grouped by sample and condition, and a heatmap of log2(Copy Number Ratio, CNR) values across genomic spots was generated. The results include a summary of significantly amplified cytogenetic regions and their frequencies across PDAC samples. This approach allows for the characterization of genomic instability, a hallmark of cancer, within the tumor compartment and potentially aids in classifying "unassigned" cells.
Visual Summary
CNV Heatmap (log2(CNR))
The heatmap displays log2(CNR) values across approximately 1500 genomic spots (representing the entire genome) for different cell groups. Red colors indicate amplifications (gain of genetic material), while blue colors indicate deletions (loss of genetic material).
- Adj_normal Samples: The "Adj_normal" samples (Adj_N_1, Adj_N_2) predominantly show a flat, near-zero log2(CNR) profile, indicating a largely diploid genome, as expected for normal adjacent tissue. There are very few, minor focal CNVs observed.
- PDAC Samples (Diploid vs. Aneuploid): The PDAC samples are categorized into "Diploid PDAC" and "PDAC" groups. This distinction likely reflects the inferred ploidy status, with "Diploid PDAC" samples generally having a more stable genomic landscape despite being from PDAC patients, while "PDAC" samples (implicitly representing aneuploid tumors) exhibit more extensive and pronounced CNVs.
- Diploid PDAC Samples: While labeled "Diploid", some samples in this group (e.g., Diploid PDAC_3, Diploid PDAC_7, Diploid PDAC_8, Diploid PDAC_13) show distinct focal amplifications or deletions. For instance, Diploid PDAC_3 shows amplification on chromosome 7 and 8, and Diploid PDAC_7 shows strong amplification on chromosome 8. This suggests that even 'diploid' tumors can harbor significant focal genetic alterations.
- Aneuploid PDAC Samples (labeled "PDAC"): These samples (PDAC_1 through PDAC_16) generally display more widespread and heterogeneous CNV patterns compared to the "Diploid PDAC" group. There are clear recurrent regions of amplification (red) and deletion (blue) across multiple samples.
- Recurrent Amplifications: Notable recurrent amplifications are observed on chromosomes 1q, 7p, 8q, 11q, 17q, and 19q. Specific cytobands like 1q21.3, 7p13, 8q12.3, 8q24.3, 11q22.1, 17q12, and 19q13.1 are frequently amplified, as visually highlighted in the heatmap.
- Recurrent Deletions: Regions on chromosomes 1p, 2q, 6q, 9p, 10q, and 18q show recurrent deletions (blue regions).
- Sample Heterogeneity: There is considerable heterogeneity in CNV profiles among individual PDAC samples, reflecting the clonal evolution and genomic diversity often observed in pancreatic cancer.
Summary of Significantly Amplified Copy Number Regions
The accompanying summary highlights specific cytogenetic bands that are significantly amplified across the selected PDAC samples.
- Frequency of Amplification: The bar chart on the right quantifies the frequency of these amplifications. The most frequently amplified regions include:
1q21.3: 73%
1q42.12: 55%
7p22.3-7p21.1: 36%
7p13-7q21.11 (EGFR): 55%
7q22.1-7q31.1: 55%
8p12-8q12.3 (LSM1, DDHD2): 36%
8q22.1-8q24.3 (INTS8, EIF3E, GSDMD): 55% (GSDMD highlighted)
9q34.11-9q34.13: 64%
11q12.2-11q13.1: 45%
17q12-17q21.2 (ERBB2): 18%
19q13.12-19q13.2: 45%
- Sample-Specific Amplifications: The heatmap on the left within the summary section details which samples exhibit amplification in these specific bands. For example, PDAC_1 shows amplification in 1q21.3 and 1q42.12, while PDAC_9 shows strong and widespread amplifications across many of the listed regions.
Biological Interpretation
The CNV profiles of "Ductal cell" and "unassigned" populations within PDAC samples reveal critical insights into genomic instability in pancreatic cancer:
- Genomic Instability as a PDAC Hallmark: The widespread and recurrent CNVs observed in the "PDAC" (aneuploid) samples underscore the significant genomic instability characteristic of pancreatic adenocarcinoma. This instability drives tumor evolution, heterogeneity, and resistance to therapy.
- Distinction by Ploidy: The clear differentiation between "Diploid PDAC" and "PDAC" samples suggests that PDAC can arise and progress through different genomic routes. While most advanced PDACs are aneuploid, some tumors might retain an overall diploid state but still harbor specific, critical focal CNVs. This highlights the complexity of tumor genomics beyond simple ploidy classification.
- Oncogenic Amplifications: Several amplified regions are biologically significant in PDAC:
- 7p13-7q21.11 (EGFR): Amplification of *EGFR* (Epidermal Growth Factor Receptor) is a known driver in various cancers, including subsets of PDAC. EGFR signaling promotes cell proliferation, survival, invasion, and metastasis PubMed Search: EGFR amplification pancreatic cancer.
- 17q12-17q21.2 (ERBB2): Amplification of *ERBB2* (also known as HER2) is a well-established oncogenic event, particularly in breast and gastric cancers. While less common than in other tumor types, HER2 amplification can occur in PDAC and contributes to tumor growth GeneCards: ERBB2.
- 8q24.3 (GSDMD): The amplification of *GSDMD* (Gasdermin D) is interesting. GSDMD is known for its role in pyroptosis, a form of programmed inflammatory cell death. Its amplification in cancer can have complex roles, sometimes promoting tumor growth by inducing inflammation or suppressing anti-tumor immunity, or conversely, making cells more susceptible to pyroptosis-inducing therapies GeneCards: GSDMD.
- 1q21.3 and 1q42.12: These regions often harbor genes involved in cell cycle regulation, proliferation, and apoptosis, and their amplification can contribute to uncontrolled cell growth.
- Implications for "Unassigned" Cells: Since the analysis was performed on a pooled population of "Ductal cell" and "unassigned" cells, the observed CNV patterns for PDAC samples represent the average genomic state of this combined tumor-enriched cell population. If a significant proportion of "unassigned" cells contribute to the overall aneuploid profile, it suggests they are likely tumor cells or tumor-associated cells exhibiting similar genomic alterations. Conversely, if some "unassigned" cells were truly normal, their signal would be diluted in the average, or if they were the dominant component in a sample, that sample would appear more diploid.
Clinical or Translational Implications
- Biomarker Potential: Recurrent CNVs, particularly amplifications of oncogenes like *EGFR* and *ERBB2*, represent potential diagnostic or prognostic biomarkers in PDAC. Detecting these amplifications could help in patient stratification.
- Therapeutic Targets: The identification of amplified oncogenes such as *EGFR* and *ERBB2* points to potential therapeutic vulnerabilities. Patients with *EGFR* or *ERBB2* amplifications might benefit from targeted therapies already approved for these pathways in other cancers, such as EGFR inhibitors (e.g., erlotinib, gefitinib) or HER2-targeted agents (e.g., trastuzumab, pertuzumab, lapatinib) PubMed Search: HER2 targeted therapy pancreatic cancer.
- Tumor Heterogeneity: The sample-to-sample variability in CNV profiles underscores the high degree of inter-tumor heterogeneity in PDAC. This highlights the need for personalized medicine approaches, where treatment decisions are tailored to the specific genomic landscape of each patient's tumor.
- Refining Cell Type Annotation: The CNV profiles can serve as a valuable tool for validating or refining cell type annotations. If "unassigned" cells consistently show tumor-specific CNVs, it strengthens the argument for their reclassification as tumor cells, which is crucial for accurate tumor cell burden estimation and downstream analyses.
5. CNV 기반 UMAP 시각화를 통한 세포 유형, 이수성, 조건 및 샘플 분포 분석
[Analysis Visualization Results]...
Analysis Overview
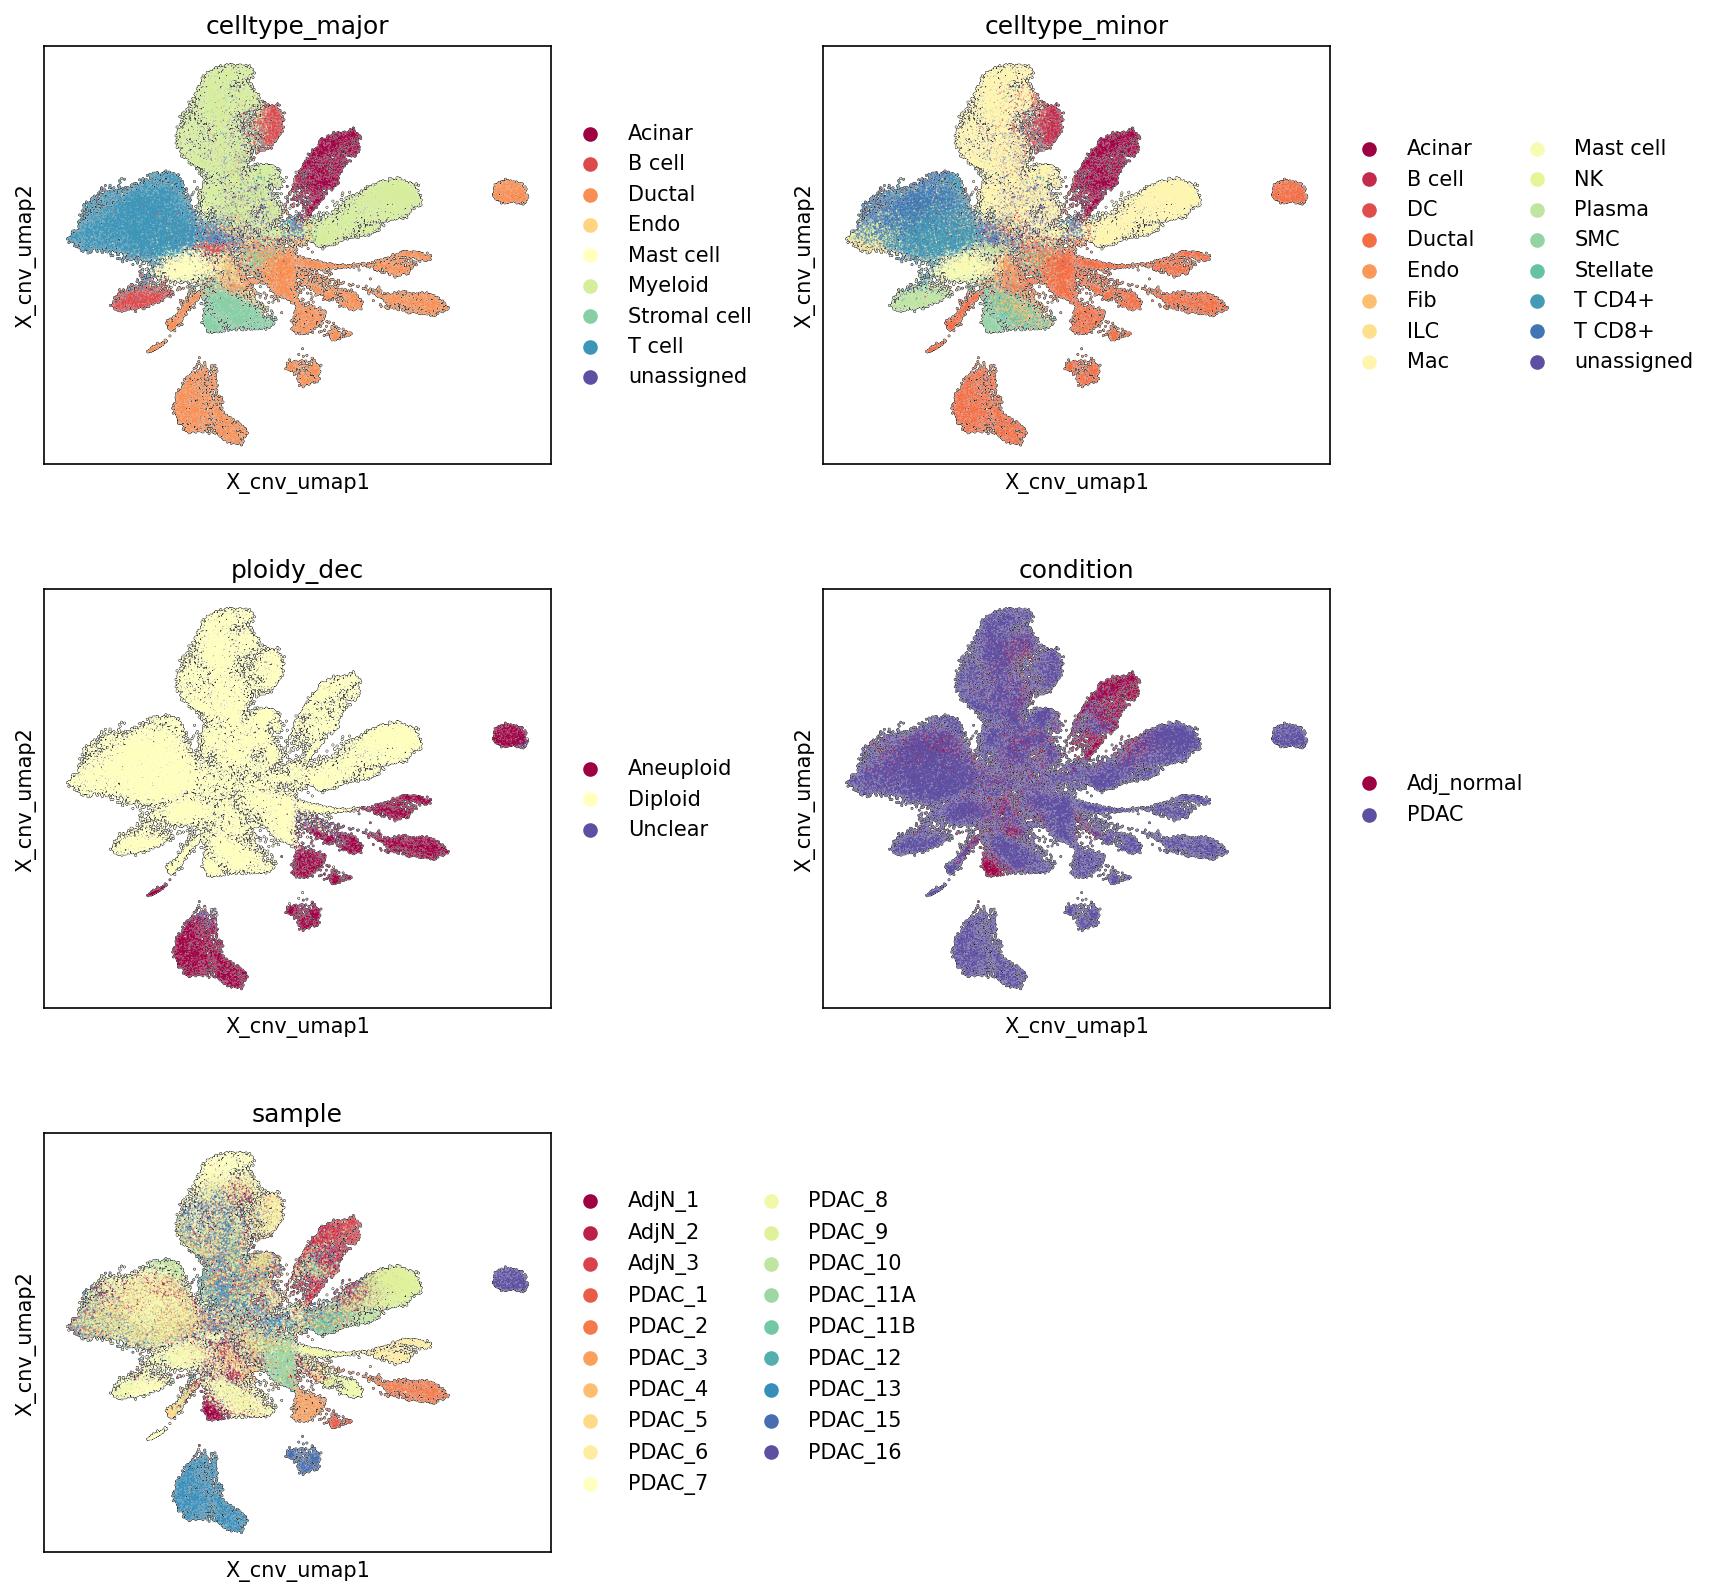
이 분석은 단일 세포 RNA 시퀀싱 데이터에서 얻은 AnnData 객체를 사용하여 CNV(Copy Number Variation) 추정치를 기반으로 UMAP 임베딩을 시각화한 결과입니다. UMAP 플롯은 celltype_major, celltype_minor, ploidy_dec (이수성 분류), condition (Adj_normal, PDAC), 및 sample 정보를 기준으로 색상이 지정되어, 각 메타데이터 범주가 CNV 공간에서 어떻게 분포하는지 보여줍니다. 이 분석은 세포 유형 식별, 종양 세포의 이수성 상태, 질병 조건과의 연관성, 그리고 샘플 간의 CNV 패턴을 이해하는 데 중점을 둡니다.
Visual Summary
CNV 추정치를 기반으로 한 UMAP 플롯은 다음과 같은 주요 특징을 보여줍니다.
세포 유형 분포 (celltype_major 및 celltype_minor)
- 대부분의 세포는 큰 중앙 클러스터를 형성하며, 이는 주로 Acinar, Stromal, T cell, Myeloid 등 다양한 정상 또는 미세환경 세포 유형으로 구성됩니다.
- Ductal cell (주황색)은 중앙 클러스터에서 분리되어 오른쪽 및 아래쪽으로 넓게 퍼진 형태의 뚜렷한 클러스터를 형성합니다. 이는 Ductal cell이 다른 세포 유형과 구별되는 CNV 패턴을 가짐을 시사합니다.
- "unassigned" 세포 (짙은 보라색)는 주로 UMAP의 오른쪽에 위치한 작은, 분리된 클러스터에 집중되어 있습니다.
- celltype_minor 레벨에서도 비슷한 패턴이 관찰되며, Ductal cell의 독특한 분포가 더욱 명확합니다.
이수성 상태 (ploidy_dec)
- 대부분의 세포는 'Diploid' (옅은 노란색)로 나타나며, 이는 CNV 패턴이 정상임을 의미합니다. 이들은 주로 중앙의 큰 클러스터를 구성합니다.
- 'Aneuploid' (자주색) 세포들은 UMAP의 오른쪽 및 아래쪽에 뚜렷하게 분리된 클러스터를 형성합니다. 이 Aneuploid 클러스터는 Ductal cell 클러스터와 상당한 부분 겹칩니다.
- 'Unclear' (짙은 보라색) 세포는 수가 매우 적으며, 주로 "unassigned" 세포가 집중된 UMAP의 오른쪽 클러스터에 나타납니다.
조건 (condition)
- 'Adj_normal' (자주색) 세포들은 주로 Diploid 세포가 분포하는 중앙의 큰 클러스터에 집중되어 있습니다.
- 'PDAC' (짙은 보라색) 세포들은 Aneuploid 세포 클러스터와 Ductal cell 클러스터에 걸쳐 넓게 분포합니다. 이는 PDAC 샘플에서 이수성 Ductal cell의 존재를 강력하게 시사합니다.
- 일부 PDAC 세포는 Adj_normal 세포와 함께 중앙 클러스터에 섞여 있는데, 이는 PDAC 종양 미세환경 내의 정상 세포나 초기 단계의 종양 세포를 반영할 수 있습니다.
샘플 (sample)
- 'Adj_normal' (AdjN_1, AdjN_2, AdjN_3) 샘플의 세포들은 중앙의 Diploid 클러스터에 광범위하게 섞여 있습니다. 이는 정상 세포들 간의 CNV 패턴이 샘플 간에 유사함을 나타냅니다.
- PDAC 샘플 (PDAC_1부터 PDAC_16)의 세포들은 Aneuploid 클러스터 및 Ductal cell 클러스터 내에서 샘플별로 약간의 차이를 보이며 분포합니다. 예를 들어, UMAP 오른쪽의 작은 클러스터는 주로 PDAC_15 및 PDAC_16 샘플의 세포로 구성되어 특정 샘플에서 독특한 CNV 패턴을 가진 세포 집단이 존재함을 시사합니다.
Biological Interpretation
이 CNV 기반 UMAP 분석은 췌장암(PDAC)의 주요 생물학적 특징을 명확하게 드러냅니다.
- CNV에 의한 종양 세포 및 정상 세포의 분리: UMAP이 CNV 데이터에 의해 임베딩되었기 때문에, 이수성(Aneuploid) 세포와 정상 이배체(Diploid) 세포가 뚜렷하게 분리되는 것은 매우 중요합니다. 이는 CNV가 종양 세포를 미세환경 내의 다른 정상 세포들로부터 구별하는 강력한 지표임을 보여줍니다.
- Ductal cell의 악성 변환: 'Ductal cell'이 암의 기원 세포(Tumor origin celltype)로 정의되었고, 이들이 주로 'Aneuploid' 상태이며 'PDAC' 조건에서 유래한 세포들과 겹치는 클러스터를 형성하는 것은, PDAC가 Ductal cell에서 유래한 이수성 암세포로 특징지어진다는 강력한 증거입니다. 췌장암은 종종 상당한 염색체 이수성을 보입니다 PubMed search: Pancreatic cancer aneuploidy.
- 종양 미세환경: 중앙의 Diploid 클러스터에 존재하는 다양한 면역 및 기질 세포(T cell, Myeloid cell, Stellate cell, Fibroblast 등)는 종양 미세환경을 구성하는 비악성 세포들로 해석될 수 있습니다. 이들은 Adj_normal 샘플과 PDAC 샘플 모두에 걸쳐 존재하며, PDAC 미세환경의 복잡성을 시사합니다.
- 미분화 또는 특이 CNV 패턴의 세포: UMAP의 오른쪽에 위치한 작은, 분리된 클러스터는 주로 "unassigned" 세포와 "Unclear" ploidy 세포, 그리고 일부 PDAC 샘플(특히 PDAC_15, PDAC_16)의 Ductal cell로 구성됩니다. 이 집단은 일반적인 Aneuploid PDAC 세포와는 다른 CNV 프로파일을 가지거나, 유전적 불안정성이 높은 미분화된 종양 세포일 가능성이 있습니다. 이러한 세포들은 PDAC 진행 또는 특정 하위 유형의 특징을 나타낼 수 있습니다.
Annotation Notes
- CNV 기반 UMAP은 유전체 불안정성 측면에서 세포를 효과적으로 분리하고, Ductal cell의 악성 전환과 이수성 상태의 연관성을 명확히 보여줍니다.
- celltype_major, celltype_minor, ploidy_dec, condition 간의 높은 일관성은 데이터의 품질과 CNV 추정치의 신뢰성을 지지합니다.
- 일부 'unassigned' 세포와 'Unclear' ploidy 세포가 뚜렷한 클러스터를 형성하는 것은, 이러한 세포들의 정체성과 유전체적 특성을 더 심층적으로 조사할 필요가 있음을 시사합니다. 이는 잠재적으로 새로운 세포 하위 유형 또는 기술적 아티팩트를 나타낼 수 있습니다.
- 샘플 간의 분포는 정상 세포 클러스터에서는 잘 섞여 있지만, Aneuploid/Ductal/PDAC 클러스터에서는 일부 샘플 특이적인 클러스터링이 관찰됩니다. 이는 특정 샘플이 독특한 CNV 프로파일을 가질 수 있음을 나타내며, 잠재적인 종양 이질성(tumor heterogeneity)을 반영할 수 있습니다.
6. Minor Cell Type Population Analysis in Pancreatic Tissues
[Analysis Visualization Results]...
Analysis Overview
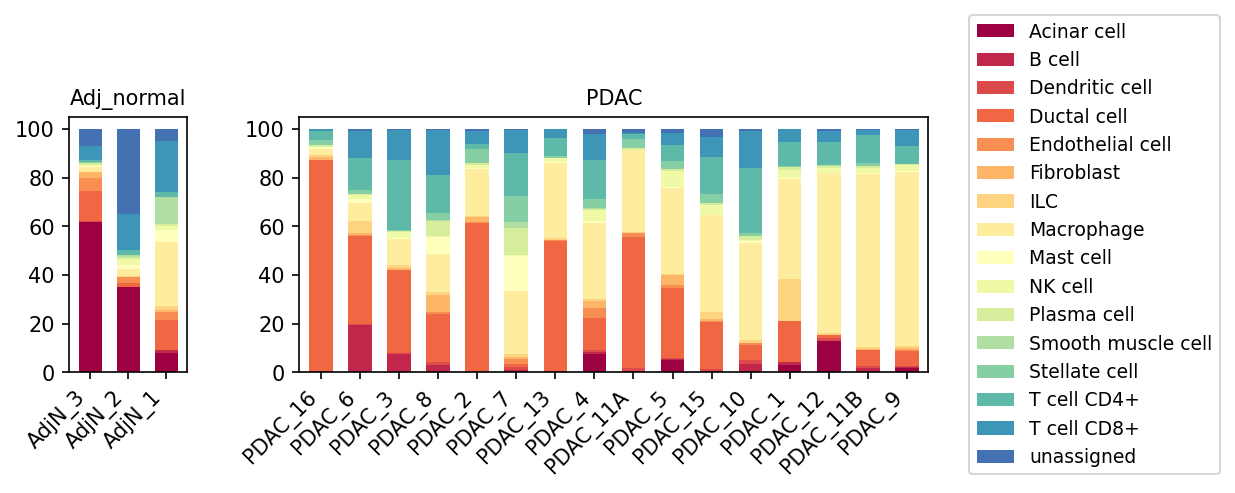
This analysis presents a population bar plot of minor cell types across individual samples, categorized by their condition: "Adj_normal" (adjacent normal pancreatic tissue) and "PDAC" (Pancreatic Ductal Adenocarcinoma). Each bar represents a sample, with stacked segments indicating the relative proportion of each identified minor cell type. This visualization provides an overview of cellular composition differences between healthy and cancerous pancreatic microenvironments, as well as heterogeneity within the PDAC cohort.
Visual Summary
The bar plot effectively displays the cellular landscape, highlighting distinct patterns between adjacent normal pancreas and PDAC samples.
Adj_normal Samples:
- The "Adj_normal" samples (AdjN_1, AdjN_2, AdjN_3) show a generally high proportion of Acinar cells, particularly in AdjN_3 and AdjN_1. Acinar cells constitute the primary functional parenchyma of the exocrine pancreas.
- AdjN_2 notably contains a very high proportion of "unassigned" cells, which stands out compared to other normal samples and may suggest specific biological characteristics of this sample or a challenge in cell type annotation for that particular sample.
- Other cell types such as Endothelial cells, Ductal cells, and various immune cells (T cells CD4+, T cells CD8+, Macrophage) are present in smaller, varying proportions.
PDAC Samples:
- A striking shift in cellular composition is observed in "PDAC" samples. Acinar cells are dramatically reduced, often constituting a minimal fraction, or completely absent, in most PDAC samples (e.g., PDAC_16, PDAC_6, PDAC_3).
- Ductal cells, identified as the "Tumor origin celltype" in the data context, show a substantial increase in many PDAC samples, indicating the presence of tumor cells (e.g., PDAC_16, PDAC_6, PDAC_3, PDAC_8, PDAC_7, PDAC_13, PDAC_4, PDAC_5, PDAC_10, PDAC_1). The proportion of Ductal cells varies significantly across different PDAC samples, reflecting inter-tumor heterogeneity.
- Stromal components are highly prominent in PDAC samples. Fibroblasts and Stellate cells (a specialized type of fibroblast in the pancreas) appear significantly enriched compared to Adj_normal samples, forming a substantial proportion of the tumor microenvironment (TME) in many PDAC samples (e.g., PDAC_11A, PDAC_15, PDAC_10, PDAC_1, PDAC_12, PDAC_11B, PDAC_9).
- Immune cells, particularly Macrophages, also contribute significantly to the TME in PDAC, often forming a large portion of the cellular infiltrate (e.g., PDAC_11A, PDAC_15, PDAC_10, PDAC_1, PDAC_12, PDAC_11B, PDAC_9). T cells (CD4+, CD8+) are consistently present across PDAC samples, though their relative proportions vary. Other immune cells like B cells, Plasma cells, Dendritic cells, ILC, Mast cells, and NK cells are also observed in varying, generally smaller, frequencies.
- There is considerable heterogeneity in cell type proportions among individual PDAC samples, suggesting diverse tumor microenvironment compositions across patients. For example, some PDAC samples are heavily dominated by Ductal cells and Macrophages (PDAC_10, PDAC_1), while others show a strong presence of Fibroblasts and Stellate cells (PDAC_11A, PDAC_11B).
Biological Interpretation
The observed shifts in cell type populations between adjacent normal pancreas and PDAC provide critical biological insights into pancreatic cancer progression and its microenvironment.
- Loss of Acinar Cells and Expansion of Ductal Cells: The near-disappearance of Acinar cells in PDAC samples reflects the destructive nature of the tumor, where cancerous ductal cells proliferate and replace normal pancreatic parenchyma. The dominance of Ductal cells in PDAC samples is consistent with the epithelial origin of pancreatic ductal adenocarcinoma [1].
- Desmoplastic Stroma Formation: The significant increase in Fibroblasts and Stellate cells in PDAC samples is a hallmark of the severe desmoplastic reaction characteristic of PDAC [2]. Pancreatic stellate cells (PSCs) are key drivers of fibrosis, secreting extracellular matrix components that lead to a dense, collagen-rich stroma. This desmoplastic reaction creates a physical barrier that hinders drug delivery and promotes tumor growth and metastasis.
- Immune Microenvironment Remodeling: The increased prevalence of Macrophages in PDAC is highly significant. Tumor-associated macrophages (TAMs) are often polarized towards an M2-like phenotype, promoting tumor proliferation, angiogenesis, immune suppression, and metastasis [3]. The presence of T cells (CD4+, CD8+) indicates an immune response, but their functional state (e.g., exhausted, suppressive) would require further investigation (e.g., via DEG or GSEA). The varying proportions of different immune cell types highlight the complexity and heterogeneity of the immune landscape within PDAC, which can influence disease progression and response to immunotherapy.
- Inter-tumor Heterogeneity: The substantial variation in cell type composition among individual PDAC samples underscores the inherent heterogeneity of pancreatic cancer. This variability suggests that different patients may have distinct tumor microenvironments, potentially influencing their disease trajectory and response to treatment. This highlights the need for personalized approaches in PDAC management.
Clinical or Translational Implications
Understanding these cellular population shifts has several clinical and translational implications:
- Biomarker Identification: Specific cell type proportions or ratios could serve as prognostic or predictive biomarkers. For example, a high proportion of stromal components (Fibroblasts, Stellate cells) or specific immune cell subsets (e.g., M2-like Macrophages) might correlate with disease aggressiveness or resistance to therapy.
- Therapeutic Targeting of the TME: The prominent desmoplastic stroma and immune cell infiltration in PDAC suggest potential therapeutic targets. Strategies aimed at depleting PSCs, inhibiting fibrosis, or reprogramming TAMs could enhance drug delivery and improve anti-tumor immune responses [4].
- Immunotherapy Response: The composition of immune cells, particularly the balance between anti-tumor effector cells (e.g., CD8+ T cells, NK cells) and immunosuppressive cells (e.g., M2 Macrophages, Tregs), is crucial for predicting response to immunotherapies. Analysis of these populations can help identify patients likely to benefit from immune checkpoint inhibitors or other immunomodulatory agents.
- Personalized Medicine: The observed heterogeneity emphasizes the need for patient-specific characterization of the TME. A detailed cellular census, as provided by this plot, could guide personalized treatment strategies, including combination therapies that target both tumor cells and key stromal or immune components.
---
References:
- Ductal Cell Origin of PDAC: Hruban, R. H., et al. (2007). *Cancer Research*, 67(8), 3469-3473. PubMed Search: "pancreatic cancer ductal origin"
- Pancreatic Desmoplasia: Erkan, M., et al. (2012). *Cancer Cell*, 21(5), 594-608. PubMed Search: "pancreatic cancer desmoplasia stellate cells"
- Tumor-Associated Macrophages in PDAC: Zhu, Y., et al. (2017). *Cell Death & Disease*, 8(3), e2611. PubMed Search: "tumor associated macrophages pancreatic cancer"
- Targeting PDAC Stroma: Neesse, A., et al. (2014). *Gastroenterology*, 146(4), 1121-1131. PubMed Search: "pancreatic cancer stromal targeting therapy"
7. T cell Subpopulation Shifts in Pancreatic Ductal Adenocarcinoma (PDAC)
[Analysis Visualization Results]...
Analysis Overview
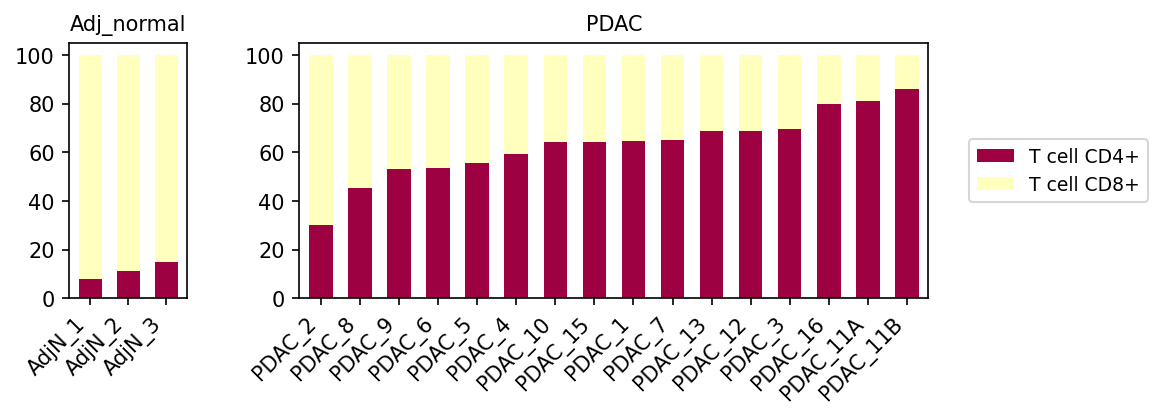
This analysis investigates the relative proportions of CD4+ T cells and CD8+ T cells within the overall T cell population across adjacent normal pancreas and pancreatic ductal adenocarcinoma (PDAC) samples. The barplot displays the percentage contribution of each T cell subset for individual samples, providing insight into the immune landscape changes associated with PDAC.
Visual Summary
The stacked bar plot clearly illustrates a distinct difference in the T cell CD4+ and CD8+ subpopulation proportions between adjacent normal (Adj_normal) and PDAC samples.
- Adjacent Normal Samples: In the three 'Adj_normal' samples (AdjN_1, AdjN_2, AdjN_3), T cell CD8+ populations (light yellow) are predominantly observed, constituting over 85-90% of the total T cells. T cell CD4+ populations (burgundy) represent a minor component, typically less than 15%.
- PDAC Samples: In contrast, PDAC samples exhibit a substantial shift in the T cell ratio. The proportion of T cell CD4+ cells is markedly increased across all PDAC samples compared to the adjacent normal tissue. This increase varies among individual PDAC samples, ranging from approximately 30% to over 85% of the T cell compartment. Consequently, the proportion of T cell CD8+ cells is relatively reduced in PDAC, becoming a minority population in many tumor samples (e.g., PDAC_11A, PDAC_11B). The PDAC samples appear to be arranged in increasing order of CD4+ T cell proportion.
Biological Interpretation
The observed shift towards a higher proportion of CD4+ T cells and a lower proportion of CD8+ T cells in PDAC compared to adjacent normal tissue suggests a significant alteration in the T cell-mediated immune response within the tumor microenvironment.
- CD8+ T cells are primarily cytotoxic T lymphocytes (CTLs) responsible for directly killing cancer cells. Their reduced proportion in PDAC could indicate impaired anti-tumor immunity, potentially due to poor infiltration, exclusion from the tumor core, or functional exhaustion within the immunosuppressive tumor microenvironment GeneCards: CD8A.
- CD4+ T cells encompass a diverse range of helper and regulatory subsets. While some CD4+ T cell subsets (e.g., Th1) can promote anti-tumor immunity by supporting CD8+ T cell function, others, particularly regulatory T cells (Tregs), are potent immunosuppressors. An increase in the overall CD4+ T cell population in PDAC is often associated with an accumulation of Tregs, which can suppress the activity of cytotoxic T cells and other immune effector cells, thereby facilitating tumor immune evasion PubMed Search: "pancreatic cancer regulatory T cells immunosuppression". Given that PDAC is known for its highly immunosuppressive microenvironment, this shift strongly suggests an enrichment of immunosuppressive CD4+ T cell subsets.
Clinical or Translational Implications
The altered CD4+/CD8+ T cell ratio in PDAC has significant implications for understanding disease progression and developing effective immunotherapies.
- Immunosuppressive Microenvironment: The observed predominance of CD4+ T cells, likely including immunosuppressive Tregs, in PDAC contributes to the overall immunosuppressive nature of the tumor microenvironment. This makes PDAC notoriously resistant to many conventional immunotherapies that rely on robust CD8+ T cell responses.
- Biomarker Potential: The CD4+/CD8+ ratio could serve as a prognostic biomarker, with a higher ratio potentially correlating with poorer outcomes due to suppressed anti-tumor immunity. Further subtyping of CD4+ populations (e.g., Tregs vs. effector CD4+ cells, which is available in celltype_subset) would provide more detailed insights.
- Therapeutic Strategies: Future therapeutic interventions for PDAC may need to focus on strategies that not only enhance CD8+ T cell infiltration and activity but also modulate the CD4+ T cell compartment, for instance, by depleting or reprogramming Tregs, or promoting beneficial CD4+ helper T cell responses. This could involve combination therapies targeting multiple immune checkpoints or pathways PubMed Search: "PDAC immunotherapy T cell modulation".
8. Changes in T Cell Subset Proportions in Pancreatic Ductal Adenocarcinoma (PDAC) Tumor Microenvironment
[Analysis Visualization Results]...
Analysis Overview
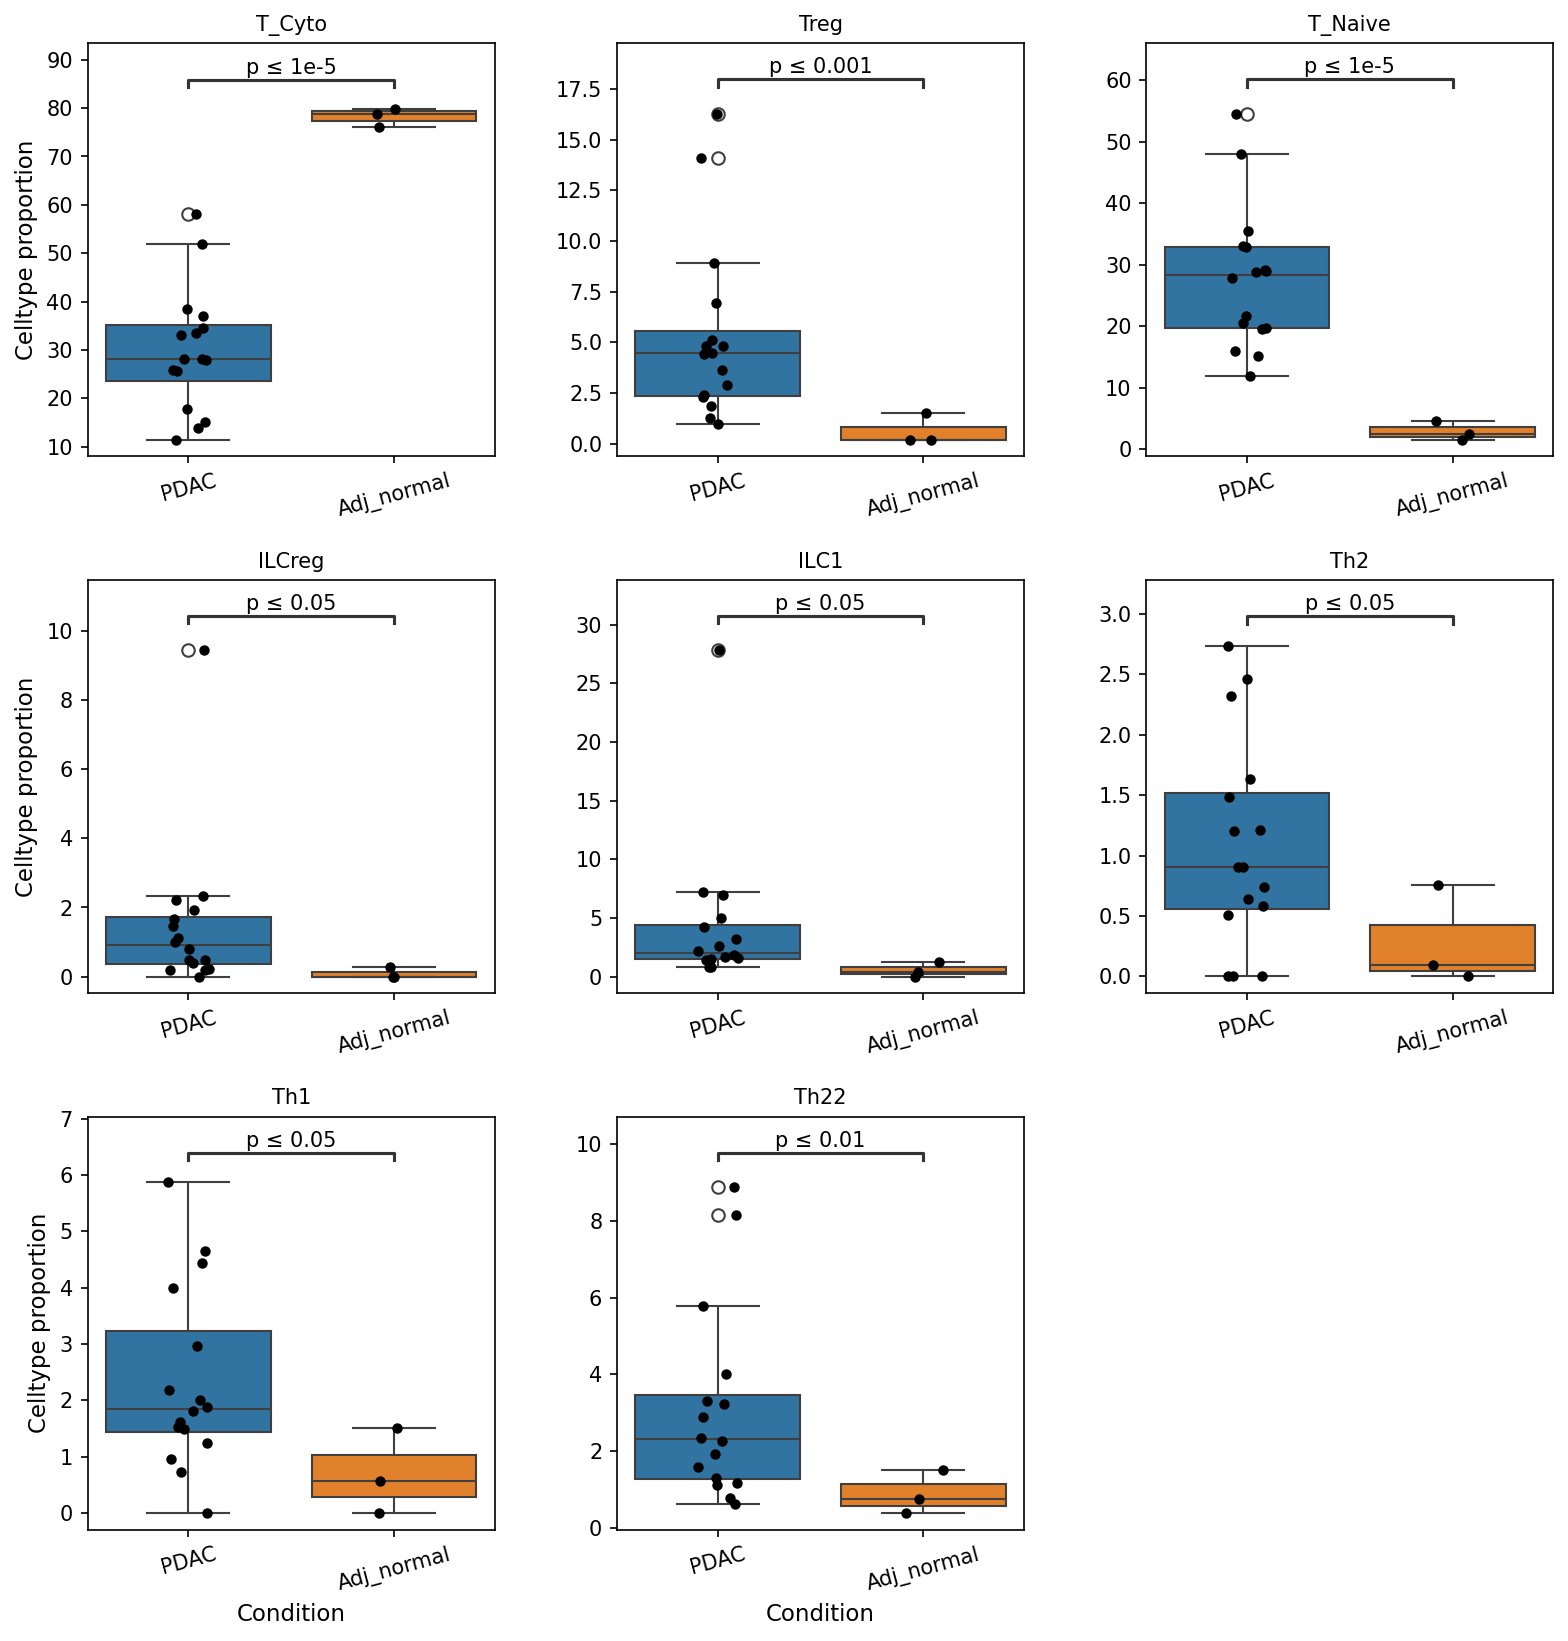
This analysis investigates the proportional changes of various T cell subsets (celltype_subset from celltype_major: T cell) between Pancreatic Ductal Adenocarcinoma (PDAC) tissue and adjacent normal pancreatic tissue (Adj_normal). Boxplots are used to visualize the distribution of celltype proportions, and statistical significance (p-value < 0.05) highlights subsets with notable differences between conditions. The reference group for comparison is 'Adj_normal'.
Visual Summary
The boxplots display the proportion of eight distinct T cell subsets—T cell (Cytotoxic), Treg, T cell (Naive), ILCreg, ILC1, T cell (Th2), T cell (Th1), and T cell (Th22)—comparing PDAC and Adj_normal conditions.
- T cell (Cytotoxic): This population shows a significantly lower proportion in PDAC samples compared to Adj_normal samples (p ≤ 1e-5). The median proportion in PDAC is approximately 30%, whereas in Adj_normal, it is around 78%.
- Treg: Regulatory T cells (Treg) exhibit a significantly higher proportion in PDAC samples (median ~4%) compared to Adj_normal (median ~0.5-1%) (p ≤ 0.001).
- T cell (Naive): Naive T cells are also significantly elevated in PDAC samples (median ~25%) relative to Adj_normal (median ~2.5%) (p ≤ 1e-5).
- ILCreg, ILC1, T cell (Th2), T cell (Th1), and T cell (Th22): All these subsets demonstrate significantly higher proportions in PDAC samples compared to Adj_normal, with p-values ranging from p ≤ 0.05 to p ≤ 0.01. The increases are evident across their respective median values and overall distributions.
Overall, with the exception of T cell (Cytotoxic), all other T cell and ILC subsets examined here show an increased proportion in the PDAC tumor microenvironment compared to adjacent normal tissue.
Biological Interpretation
The observed shifts in T cell subset proportions between PDAC and adjacent normal tissue provide critical insights into the immune landscape of pancreatic cancer, which is known for its highly immunosuppressive tumor microenvironment (TME).
- Reduced Anti-Tumor Immunity: The striking decrease in T cell (Cytotoxic) proportions in PDAC is a major finding. Cytotoxic T cells (CTLs) are crucial for recognizing and eliminating cancer cells. Their depletion in the PDAC TME strongly suggests a compromised anti-tumor immune response, allowing tumor cells to evade immune surveillance and progress PMID: 29285093.
- Enhanced Immunosuppression: The significant increase in Treg proportions within PDAC is a canonical feature of an immunosuppressive TME in many cancers, including PDAC. Tregs actively suppress the function of effector T cells and other immune cells, thereby promoting immune tolerance towards tumor cells and hindering effective anti-tumor immunity PMID: 27173595.
- Accumulation of Inactive or Dysfunctional T Cells: The elevation of T cell (Naive) proportions in PDAC could indicate several phenomena:
- Impaired T cell priming and activation within the tumor, leading to an accumulation of T cells that have not encountered their specific antigen or failed to differentiate into effector cells.
- Active recruitment of naive T cells into the TME that subsequently become anergic or functionally exhausted due to the suppressive environment.
- Complex Roles of Helper T Cell and ILC Subsets: The increased proportions of Th1, Th2, Th22, ILC1, and ILCreg in PDAC suggest a complex interplay within the TME:
- Th1 cells are generally associated with anti-tumor immunity through their production of pro-inflammatory cytokines like IFN-gamma PMID: 25112521. Their increase alongside decreased cytotoxic T cells might reflect an attempt by the immune system to respond, which is ultimately overcome by immunosuppressive mechanisms, or they could be dysfunctional/exhausted.
- Th2 and Th22 cells can have context-dependent roles in cancer, sometimes promoting fibrosis and immunosuppression, contributing to tumor progression PMID: 26034031, PMID: 35431671. Their increase might contribute to the distinct desmoplastic and immunosuppressive nature of PDAC.
- ILC1 cells are often linked to Th1-like responses and anti-tumor immunity PMID: 28882672. Similar to Th1 cells, their increased presence requires further investigation into their functional state within the PDAC TME.
- ILCreg (likely regulatory ILCs) are less well-characterized, but their increase could further contribute to immune modulation and tolerance within the tumor.
Collectively, these findings paint a picture of a PDAC TME where critical anti-tumor immune cells (cytotoxic T cells) are reduced, while populations associated with immune suppression (Tregs) or potentially ineffective/dysfunctional responses (Naive T cells, certain helper T cells, ILCs) are enriched.
Clinical or Translational Implications
These findings have significant implications for understanding and treating PDAC:
- Immunotherapy Resistance: The substantial reduction in cytotoxic T cells and expansion of Tregs in PDAC directly contributes to the observed poor response rates to current immunotherapies, such as checkpoint inhibitors. This highlights the need to overcome profound immunosuppression in PDAC.
- Biomarker Potential: The proportions of these T cell subsets could serve as prognostic biomarkers, indicating disease progression or response to therapy. For example, a lower T cell (Cytotoxic) to Treg ratio might predict a worse prognosis or resistance to immune checkpoint blockade.
Therapeutic Targets:
- Strategies aimed at restoring cytotoxic T cell infiltration and function (e.g., through adoptive cell therapies, oncolytic viruses, or vaccination strategies) are crucial.
- Targeting Treg depletion or functional inhibition could unleash anti-tumor immunity.
- Understanding the functional state of the increased Th1, Th2, Th22, ILC1, and ILCreg populations might reveal novel targets to re-educate these cells towards an anti-tumor phenotype or block their pro-tumorigenic effects.
- Combination Therapies: The complex immune landscape observed strongly suggests that single-agent immunotherapies are unlikely to be sufficient for PDAC. Combination therapies, potentially involving chemotherapy, radiation, targeted agents, and novel immunomodulatory strategies (e.g., targeting the fibrotic stroma or myeloid-derived suppressor cells) that can reshape the TME, are likely required to improve patient outcomes.
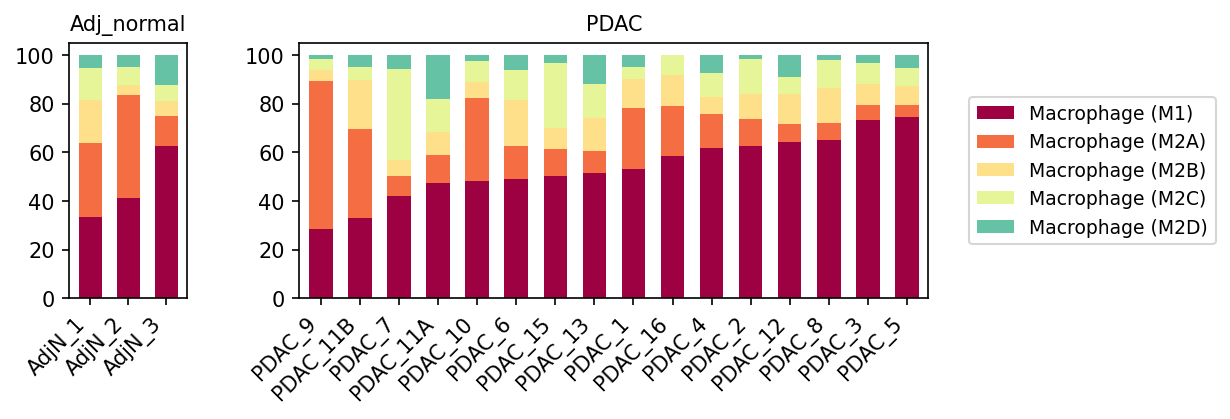
9. Macrophage Subset Population Analysis in Pancreatic Ductal Adenocarcinoma (PDAC)
[Analysis Visualization Results]...
Analysis Overview
This analysis presents a stacked bar plot showing the proportional distribution of various macrophage subsets (M1, M2A, M2B, M2C, M2D) across individual samples, grouped by condition: adjacent normal pancreas (Adj_normal) and pancreatic ductal adenocarcinoma (PDAC). The primary objective is to identify shifts in macrophage polarization states between normal and tumor microenvironments.
Visual Summary
The stacked bar plot vividly illustrates the relative abundance of different macrophage subsets within each sample.
- Adjacent Normal Samples (Adj_normal): In the three adjacent normal pancreas samples (AdjN_1, AdjN_2, AdjN_3), macrophages display a more heterogeneous composition. While M1 macrophages (dark red) are present, M2A macrophages (orange) constitute a substantial and often dominant fraction, particularly in AdjN_1 and AdjN_2. M2B (light yellow), M2C (light green), and M2D (teal) macrophages are present in smaller, albeit consistent, proportions.
- PDAC Samples: In contrast, the PDAC samples exhibit a striking and consistent dominance of M1 macrophages (dark red). Across nearly all PDAC samples, M1 macrophages make up the largest proportion, frequently exceeding 60-70% of the total macrophage population, and sometimes even reaching 80-90% (e.g., PDAC_7, PDAC_10, PDAC_16, PDAC_4, PDAC_8, PDAC_3). Concomitantly, the proportions of M2 subtypes (M2A, M2B, M2C, M2D) are generally reduced in PDAC samples compared to adjacent normal tissue. While M2A is still detectable, its relative contribution is notably lower in most PDAC samples where M1 is highly predominant. Some PDAC samples (e.g., PDAC_9, PDAC_11B) show a somewhat lower M1 proportion and higher M2A/M2B compared to the highly M1-dominant PDAC samples, indicating some heterogeneity within the tumor group.
Biological Interpretation
The observed data reveals a significant shift in macrophage polarization from adjacent normal pancreatic tissue to PDAC.
- M1 Macrophage Dominance in PDAC: The most striking finding is the strong and widespread predominance of M1 macrophages in the PDAC tumor microenvironment. M1 macrophages are classically activated, pro-inflammatory, and typically associated with anti-tumor immunity through the production of pro-inflammatory cytokines (e.g., TNF-α, IL-1β, IL-12) and reactive nitrogen and oxygen species. They are generally considered to be tumoricidal or tumor-suppressive [1].
- Implications for PDAC Tumor Microenvironment: This observation challenges the conventional understanding of pancreatic cancer, where tumor-associated macrophages (TAMs) are frequently polarized towards an M2-like phenotype, which is known to promote immune suppression, angiogenesis, and tumor growth [2]. The high prevalence of M1 macrophages in these PDAC samples could suggest several possibilities:
- Anti-tumorigenic response: These M1 macrophages might represent an active, but potentially ineffective, host anti-tumor immune response within these specific PDAC tumors.
- Specific PDAC subtypes: It is possible that this dataset primarily includes PDAC samples characterized by an M1-dominant immune infiltrate, potentially representing a subset of PDAC with different immunological characteristics or clinical behavior.
- Context-dependent polarization: Macrophage polarization is highly plastic and context-dependent. The tumor microenvironment can induce various macrophage phenotypes, and the M1 designation in this dataset might capture specific pro-inflammatory states that are distinct from those mediating tumor progression [3].
- Dynamic shifts: It's also possible that these M1 macrophages represent an initial response that later shifts towards M2 as the tumor progresses, or that there are spatial differences in macrophage polarization within the tumor.
- Reduced M2 Subtypes: The overall reduction in M2-like macrophages (M2A, M2B, M2C, M2D) in PDAC compared to adjacent normal tissue further emphasizes the M1 shift. M2 macrophages are generally associated with tissue repair, immune regulation, and promotion of tumor growth and metastasis [2]. Their lower relative abundance suggests that the immune landscape in these PDAC samples might not be universally skewed towards pro-tumorigenic M2 polarization, at least at the bulk macrophage level.
Clinical or Translational Implications
The unexpected M1 macrophage dominance in PDAC has several potential clinical and translational implications:
- Biomarker for prognosis: The proportion of M1 vs. M2 macrophages could potentially serve as a prognostic biomarker for PDAC, where a higher M1-like signature might correlate with a better response to certain therapies or improved outcomes, or conversely, a particular subset of PDAC that can mount an M1 response.
- Therapeutic targeting: If these M1 macrophages are indeed anti-tumorigenic, strategies to enhance or sustain this M1 phenotype, or prevent their conversion to M2, could be explored as a therapeutic avenue. This could involve direct M1 activation or targeting pathways that drive M2 polarization. Conversely, if these M1 macrophages are present but ineffective, understanding the mechanisms of their functional suppression would be critical.
- Immune checkpoint blockade response: The presence of an M1-dominant inflammatory environment might suggest a potential for response to immune checkpoint inhibitors, though PDAC is typically considered poorly responsive to such therapies, which might imply the M1 macrophages are functionally exhausted or suppressed [4]. Further investigation into the functional state of these M1 macrophages in PDAC is warranted.
References
- M1 Macrophage Function: Murray, P. J., & Wynn, T. A. (2011). Protective and pathogenic functions of macrophage subsets. *Nature Immunology*, 12(12), 1150–1156. PubMed Search: "M1 macrophage cancer"
- M2 Macrophage Function in Cancer: Sica, A., & Mantovani, A. (2012). Macrophage plasticity and polarization: in vivo experience with tumors. *Seminars in Immunopathology*, 34(3), 329–341. PubMed Search: "M2 macrophage tumor microenvironment"
- Macrophage Plasticity: Orecchioni, S., et al. (2019). Macrophage Polarization: A Myriad of Metabolic Paths. *Frontiers in Immunology*, 10, 705. PubMed Search: "macrophage polarization plasticity tumor"
- PDAC Immunotherapy: Bear, A. S., et al. (2020). Pancreatic cancer: a landscape of resistance. *Nature Reviews Cancer*, 20(2), 103–116. PubMed Search: "PDAC immunotherapy resistance macrophages"
10. Macrophage Gene Expression Shifts in Pancreatic Ductal Adenocarcinoma (PDAC)
[Analysis Visualization Results]...
Analysis Overview
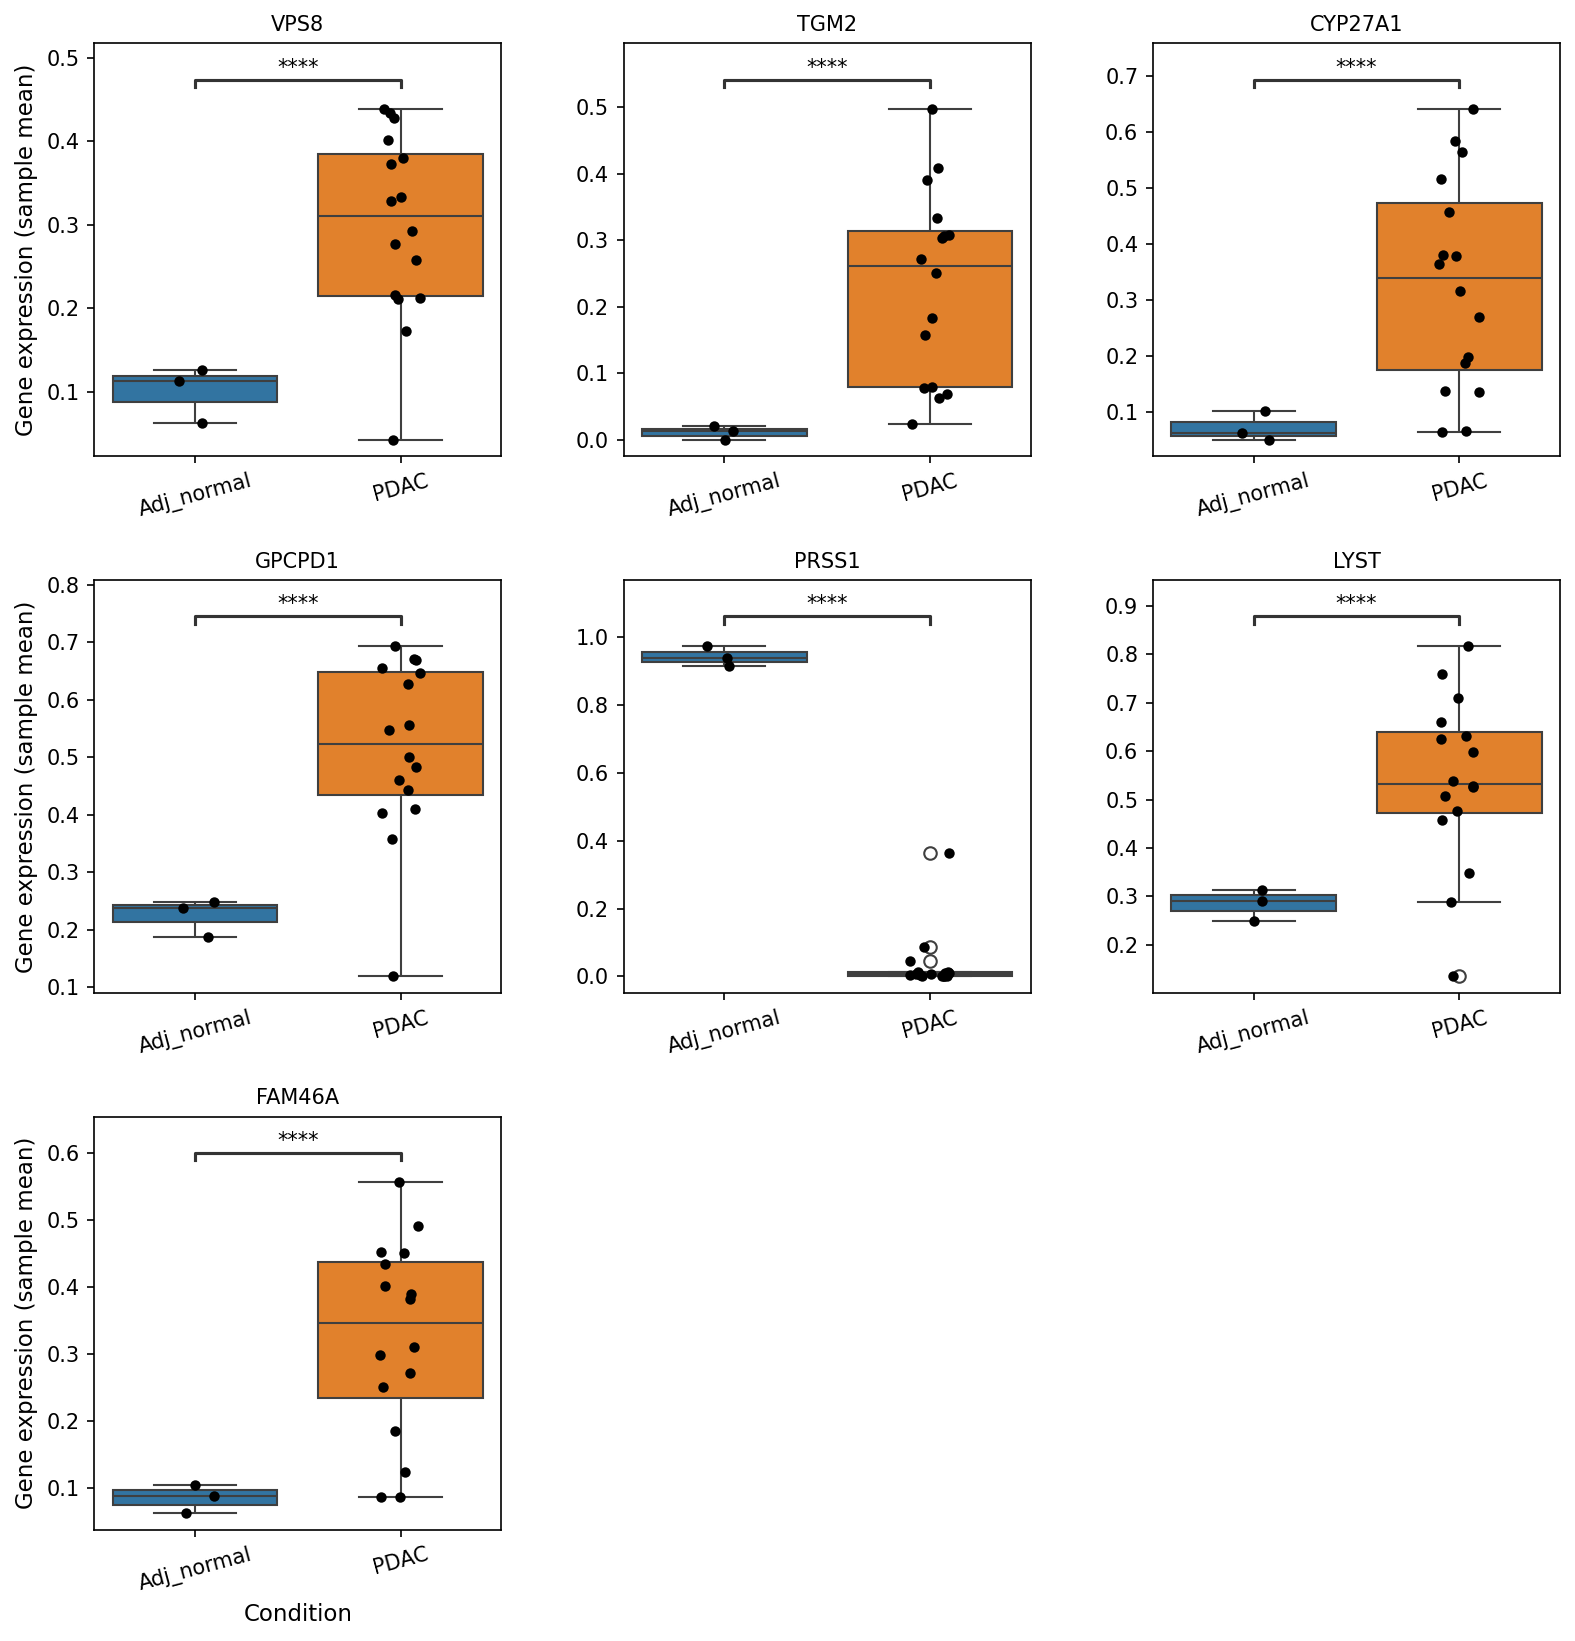
This analysis identifies genes significantly differentially expressed in the Macrophage cell population when comparing pancreatic tissues from Pancreatic Ductal Adenocarcinoma (PDAC) patients to adjacent normal (Adj_normal) pancreatic tissues. Boxplots illustrate the expression levels of these genes across individual samples within each condition, providing insights into potential macrophage reprogramming in the tumor microenvironment.
Visual Summary
The boxplots display the expression distribution (sample mean) for seven genes (VPS8, TGM2, CYP27A1, GPCPD1, PRSS1, LYST, FAM46A) in Macrophages, comparing Adj_normal and PDAC conditions.
Upregulated Genes in PDAC Macrophages:
- VPS8, TGM2, CYP27A1, GPCPD1, LYST, and FAM46A all show significantly higher expression in macrophages from PDAC tissue compared to Adj_normal tissue (p < 0.0001 for all, indicated by ). The median expression levels are markedly elevated in PDAC, with a clear separation of the interquartile ranges between the two conditions for these genes. The spread of expression in PDAC is generally wider, suggesting heterogeneity among PDAC samples.
Downregulated Genes in PDAC Macrophages:
- PRSS1 exhibits a distinct pattern, with significantly lower expression in macrophages from PDAC tissue compared to Adj_normal tissue (p < 0.0001). In Adj_normal samples, PRSS1 is highly expressed and tightly distributed. In contrast, its expression is near zero in most PDAC samples, although a few outliers show slightly higher, but still low, expression.
Biological Interpretation
The observed differential gene expression in macrophages between Adj_normal and PDAC conditions strongly suggests a significant reprogramming of macrophage phenotype within the pancreatic tumor microenvironment. Macrophages are key components of the tumor microenvironment, often differentiating into tumor-associated macrophages (TAMs) that can promote tumor growth, metastasis, and immunosuppression.
Genes Upregulated in PDAC Macrophages:
- The increased expression of TGM2 (Transglutaminase 2) in PDAC macrophages is particularly notable. TGM2 is a multifunctional enzyme implicated in extracellular matrix remodeling, cell adhesion, apoptosis, and inflammation. In cancer, including PDAC, TGM2 often promotes tumor progression, metastasis, and drug resistance, and its expression in TAMs can contribute to fibrosis and immune modulation, fostering a pro-tumorigenic niche. https://www.genecards.org/cgi-bin/carddisp.pl?gene=TGM2
- CYP27A1 (Cytochrome P450 Family 27 Subfamily A Member 1) upregulation suggests alterations in cholesterol metabolism. CYP27A1 produces 27-hydroxycholesterol (27-OHC), which can act as an immunomodulator and has been linked to cancer progression, potentially by influencing immune cell function and inflammation. https://www.genecards.org/cgi-bin/carddisp.pl?gene=CYP27A1
- LYST (Lysosomal Trafficking Regulator) upregulation might indicate altered lysosomal function and protein trafficking, critical processes for macrophage phagocytosis, antigen presentation, and secretion. Dysregulated lysosomal activity in TAMs can contribute to their pro-tumorigenic functions. https://www.genecards.org/cgi-bin/carddisp.pl?gene=LYST
- VPS8 (Vacuolar Protein Sorting 8 homolog), GPCPD1 (Glycerophosphocholine Phosphodiesterase 1), and FAM46A (Family With Sequence Similarity 46 Member A) also show significant upregulation. While their specific roles in TAMs in PDAC require further investigation, their altered expression points towards broad changes in cellular metabolism, membrane trafficking, and RNA processing within these macrophages, all of which can contribute to a tumor-supportive phenotype.
Genes Downregulated in PDAC Macrophages:
- The dramatic decrease in PRSS1 (Protease, Serine 1) expression in PDAC macrophages is intriguing. PRSS1, commonly known as Trypsin 1, is primarily an acinar cell-derived protease crucial for digestion. Its high expression in Adj_normal macrophages could reflect their involvement in tissue homeostasis, clearing cellular debris, or a specific functional subtype. Its near absence in PDAC macrophages suggests a significant phenotypic shift away from these 'normal tissue' associated functions, potentially indicating that tumor-infiltrating macrophages adopt a different identity that no longer expresses PRSS1, or that specific PRSS1-expressing macrophage subtypes are absent or diminished in the PDAC microenvironment. https://www.genecards.org/cgi-bin/carddisp.pl?gene=PRSS1
Collectively, these findings highlight a profound reprogramming of macrophage function in PDAC, characterized by the upregulation of genes associated with pro-tumorigenic processes, altered metabolism, and lysosomal activity, coupled with the downregulation of genes potentially involved in normal pancreatic tissue interactions or specific homeostatic functions.
Clinical or Translational Implications
These differentially expressed genes in macrophages represent potential biomarkers and therapeutic targets for PDAC.
- Biomarkers: Genes like TGM2 and CYP27A1, highly upregulated in PDAC macrophages, could serve as markers for identifying pro-tumorigenic TAMs, potentially aiding in prognosis or monitoring treatment response.
- Therapeutic Targets: Targeting the activity of highly upregulated genes such as TGM2 in TAMs could be a strategy to modulate the tumor microenvironment, inhibit tumor progression, and overcome resistance to conventional therapies. For example, TGM2 inhibitors are being explored in cancer contexts. Modulating lipid metabolism through CYP27A1 could also influence the immune landscape.
- Understanding Macrophage Plasticity: The distinct expression profiles offer insights into the plasticity of macrophages in PDAC, suggesting that macrophages in the tumor acquire specific pro-tumorigenic functions while losing others. Understanding these shifts could guide strategies to re-educate TAMs towards an anti-tumorigenic phenotype.
11. Ploidy Analysis of Tumor-Origin (Ductal) and Unassigned Cells in Pancreatic Cancer
[Analysis Visualization Results]...
Analysis Overview
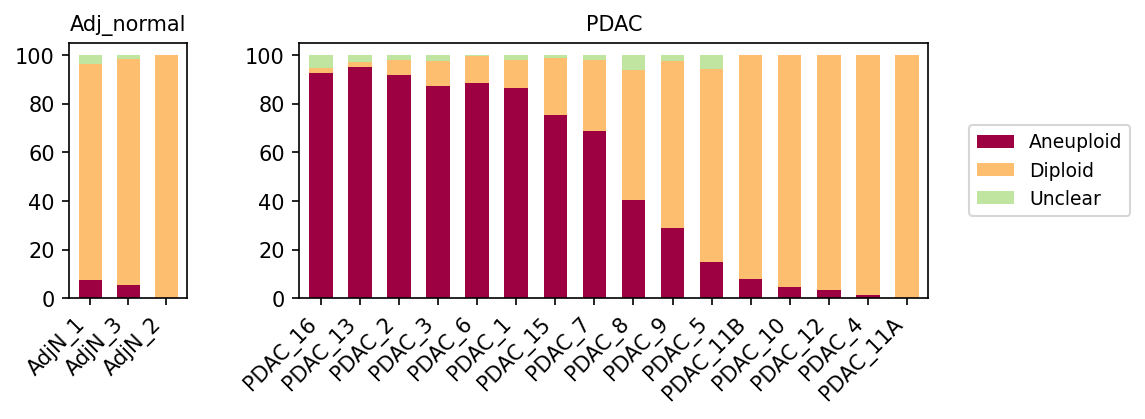
This analysis investigates the ploidy status (Aneuploid, Diploid, or Unclear) of two specific cell populations: 'Ductal cells' (identified as the tumor origin cell type) and 'unassigned' cells. The comparison is made between Adj_normal (adjacent normal pancreatic tissue) and PDAC (Pancreatic Ductal Adenocarcinoma) samples, with a focus on sample-level variations. The goal is to understand the genomic stability/instability within these populations in healthy versus cancerous contexts.
Visual Summary
The bar plot displays the percentage distribution of ploidy states (Aneuploid, Diploid, Unclear) for 'Ductal cell' and 'unassigned' populations across individual samples, grouped by condition (Adj_normal and PDAC).
- Adj_normal Samples: In all three Adj_normal samples (AdjN_1, AdjN_3, AdjN_2), the combined 'Ductal cell' and 'unassigned' population is overwhelmingly diploid (light orange bars), constituting over 90% of cells. A very small fraction of aneuploid (maroon) and unclear (light green) cells is observed. This is consistent with the expectation for normal, healthy tissue where cells maintain a stable diploid genome.
- PDAC Samples: A stark contrast is observed in PDAC samples, exhibiting significant heterogeneity:
- High Aneuploidy: A substantial proportion of PDAC samples (e.g., PDAC_16, PDAC_13, PDAC_2, PDAC_3, PDAC_6, PDAC_1, PDAC_15) show a dominant aneuploid population, ranging from approximately 75% to over 90%. This indicates a high degree of genomic instability within the 'Ductal cell' and 'unassigned' populations in these tumors.
- Mixed Ploidy: Several PDAC samples (e.g., PDAC_7, PDAC_8, PDAC_9, PDAC_5) display a more mixed ploidy profile, with both aneuploid and diploid cells present in varying proportions. For instance, PDAC_7 has around 70% aneuploid cells, while PDAC_5 has less than 20% aneuploid cells.
- Predominantly Diploid: A subset of PDAC samples (e.g., PDAC_11B, PDAC_10, PDAC_12, PDAC_4, PDAC_11A) show a ploidy distribution largely similar to the Adj_normal samples, with diploid cells being the dominant population and very low percentages of aneuploid cells.
Biological Interpretation
The observed ploidy patterns align strongly with the known characteristics of Pancreatic Ductal Adenocarcinoma (PDAC) and provide insights into cellular transformation and tumor heterogeneity.
- Aneuploidy as a Hallmark of PDAC Malignancy: The dramatic increase in aneuploidy in many PDAC samples, particularly within the 'Ductal cell' and 'unassigned' populations, is a direct reflection of genomic instability, a fundamental hallmark of cancer. Ductal cells are the designated tumor origin cell type for PDAC, and their transformation often involves widespread chromosomal abnormalities, including aneuploidy [1]. The high aneuploidy in most PDAC samples strongly suggests that the targeted 'Ductal cell' population largely consists of malignant cells in these samples.
- Heterogeneity in Tumor Purity and Genomic Instability: The variability in aneuploidy percentages across different PDAC samples highlights the profound inter-patient heterogeneity of PDAC.
- Samples with high aneuploidy likely represent tumors with a high proportion of malignant ductal cells exhibiting significant genomic instability.
- Samples with mixed ploidy could indicate varying tumor purity (i.e., presence of more non-malignant stromal or immune cells mixed with tumor cells), or possibly intra-tumor heterogeneity where different clonal populations within the same tumor have varying degrees of aneuploidy [2].
- The PDAC samples that are predominantly diploid (e.g., PDAC_11B, PDAC_10) warrant closer investigation. Given that 'Ductal cell' is the tumor origin, these samples might contain a high proportion of non-malignant bystander cells (e.g., reactive ductal cells, other stromal components) that were inadvertently captured, or potentially represent early-stage lesions with less pronounced genomic alterations, or even tumors with specific genetic alterations that do not result in widespread aneuploidy. It's also possible that the 'unassigned' cells in these samples are predominantly non-malignant, contributing to the overall diploid signal.
- Implications for 'unassigned' Cells: The inclusion of 'unassigned' cells is critical. If 'unassigned' cells in PDAC samples show a similar aneuploid profile to the malignant 'Ductal cells', it suggests these 'unassigned' cells might indeed be malignant ductal cells that were difficult to classify precisely based on their transcriptional profiles alone. Conversely, if 'unassigned' cells are mostly diploid in a highly aneuploid PDAC sample, it suggests they are more likely non-malignant cells whose identity could not be confidently determined by the cell type annotation pipeline.
Clinical or Translational Implications
- Diagnostic and Prognostic Biomarker: A high degree of aneuploidy, particularly in 'Ductal cells' from pancreatic tissue biopsies, could serve as a valuable diagnostic marker for PDAC. Furthermore, the extent of aneuploidy is often associated with tumor aggressiveness and prognosis in various cancers, including PDAC [3, 4]. Patients with tumors exhibiting higher aneuploidy might have a more aggressive disease course.
- Targeting Genomic Instability: Understanding the prevalence and degree of aneuploidy in individual tumors could inform treatment strategies. Tumors with significant genomic instability, reflected by high aneuploidy, might be more responsive to therapies that exploit DNA damage response pathways or cell cycle checkpoints.
- Monitoring Tumor Evolution: Single-cell ploidy analysis can contribute to understanding tumor clonal evolution and heterogeneity, which are critical for predicting therapy resistance and relapse. The diverse ploidy profiles across PDAC samples underscore the need for personalized approaches in PDAC management.
---
References:
[1] Hanahan, D., & Weinberg, R. A. (2011). Hallmarks of cancer: the next generation. *Cell*, 144(5), 646-674. PubMed Search: "Hallmarks of cancer" "genomic instability"
[2] Knupp, D., & Polak, P. (2022). Unraveling intratumor heterogeneity with single-cell genomics. *Current Opinion in Systems Biology*, 33, 100438. PubMed Search: "intratumor heterogeneity" "single-cell genomics"
[3] Sanson, M., et al. (2018). Ploidy and chromosomal instability in brain tumours. *Nature Reviews Cancer*, 18(1), 17-29. PubMed Search: "aneuploidy" "cancer" "prognosis"
[4] Yachida, S., et al. (2010). Genomic sequencing identifies key mutations in pancreatic ductal adenocarcinoma. *Nature*, 467(7314), 606-610. PubMed Search: "PDAC" "aneuploidy" "genomic instability"
12. Cell-Cell Interaction Patterns in Pancreatic Ductal Adenocarcinoma (PDAC) vs. Adjacent Normal Tissue
[Analysis Visualization Results]...
Analysis Overview
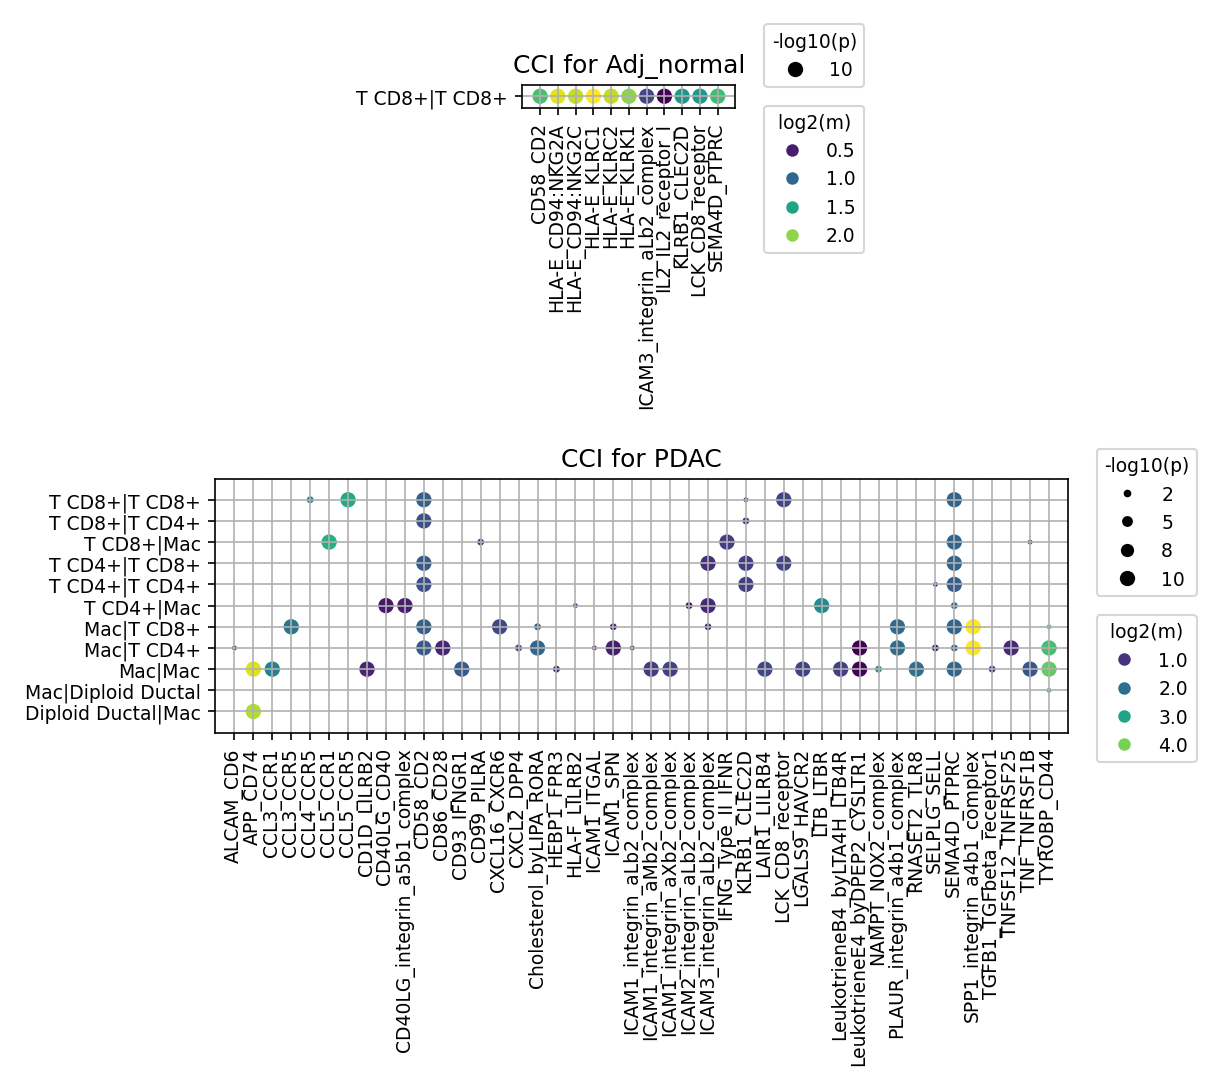
This analysis investigates the cell-cell interaction (CCI) patterns between key cell types—Ductal cells (tumor-origin), Fibroblasts, Macrophages, and T cells (CD4+, CD8+)—in pancreatic tissue under adjacent normal (Adj_normal) and PDAC conditions. The CellPhoneDB tool was used to identify ligand-receptor interactions, and the results are visualized as dot plots, showing the significance (-log10(p-value) as dot size) and strength (log2(mean expression) as color intensity) of interactions. Up to 80 cell-cell interaction pairs per condition were selected based on significance and mean expression.
Visual Summary
- Adj_normal Condition:
- The dot plot for the Adj_normal condition displays a very limited set of interactions. Only self-interactions of T CD8+ cells (T CD8+|T CD8+) are observed among the top 80 interactions.
- These interactions predominantly involve MHC class I-related molecules (e.g., HLA-E with NKG2A, NKG2C, NKG2D, KLRK1, KLRC1, KLRC2), adhesion molecules (CD58-CD2, ICAM3-integrin_aLb2_complex), and signaling components (IL2-IL2 receptor, LCK CD8 Receptor, SEMA4D-PTPRC).
- The overall interaction landscape in adjacent normal tissue appears relatively quiescent or highly specific to T cell self-regulation compared to the disease state. Other target cell types (Ductal, Fibroblast, Macrophage, T CD4+) do not show significant interactions passing the filters for inclusion in this plot.
- PDAC Condition:
- In stark contrast to the Adj_normal condition, the PDAC condition exhibits a highly complex and expanded network of cell-cell interactions.
- Numerous cell-cell pairs are involved, including self-interactions of T CD8+, T CD4+, and Macrophages, as well as heterotypic interactions between T cells, Macrophages, and "Diploid Ductal" cells. "Diploid Ductal" cells are identified in the data context as the tumor-origin cell type.
- The plot reveals a significantly higher number of significant interactions (larger dots) and often stronger interaction strengths (brighter colors) compared to Adj_normal.
- Notably, strong and numerous interactions are observed between Mac|Diploid Ductal and Diploid Ductal|Mac, highlighting the critical role of tumor-macrophage crosstalk.
- Fibroblast interactions are not explicitly shown in either plot, suggesting they either did not meet the statistical thresholds or were not among the top 80 most significant interactions.
Biological Interpretation
The dramatic increase in cell-cell interactions in the PDAC microenvironment points to a highly active and dysregulated cellular crosstalk network, which is characteristic of solid tumors.
Key Observations in PDAC:
Tumor-Immune Crosstalk (Ductal cells & Macrophages):
- Chemokine Signaling: High activity of chemokine-chemokine receptor pairs such as CCL3/4/5-CCR1/5 and CXCL12-CXCR4 between Macrophages and Ductal cells. This indicates robust recruitment of immune cells, particularly myeloid cells, into the tumor microenvironment (TME) [PubMed Search: chemokines tumor microenvironment]. The CXCL12-CXCR4 axis is well-known for its roles in tumor growth, metastasis, and immunosuppression in PDAC [GeneCards: CXCR4].
- Adhesion and Migration: Multiple ICAM-integrin pairs (e.g., ICAM1-integrin_aMb2_complex), CD58-CD2, and CD99-FNRA are highly active. These facilitate cell adhesion, extravasation of immune cells, and cell migration within the TME, crucial for immune surveillance but also for tumor cell invasion [UniProt: ICAM1].
- Growth Factors and Signaling: Strong interactions like HGF-MET and SPP1-integrin are observed. HGF-MET signaling promotes cell proliferation, survival, migration, and angiogenesis, and is frequently dysregulated in cancer [GeneCards: MET]. SPP1 (Osteopontin) interacts with integrins to facilitate tumor progression, immune evasion, and fibrosis [UniProt: SPP1].
- Immunosuppressive Pathways: The presence of LGALS9-HAVCR2 (Galectin-9-TIM-3) and TGFB1-TGFBR1/2/3 signaling is highly significant. Galectin-9/TIM-3 interaction leads to T cell exhaustion [PubMed Search: galectin-9 TIM-3 cancer], while TGF-β is a potent immunosuppressive cytokine promoting fibrosis, immune evasion, and tumor growth in PDAC [GeneCards: TGFB1].
- Pro-inflammatory and Immune Regulatory Signals: IFNG-IFNGR1/2 and TNF-TNFRSF1B signaling pathways are active. While IFN-γ can be anti-tumorigenic, chronic exposure in the TME can lead to immune evasion. TNF has a complex role, often contributing to inflammation and tumor progression [GeneCards: TNF].
Immune Cell Crosstalk (T cells & Macrophages):
- Many of the chemokine, adhesion, and immune regulatory interactions (e.g., CCLs/CCRs, CD40LG-CD40, ICAMs, IFNGR, LGALS9-HAVCR2, TGFB1, TNF) are also highly active among T cells and Macrophages. This reflects the dynamic and often dysregulated immune response within the PDAC TME, where T cells and Macrophages are constantly interacting.
- The T CD8+|T CD8+ and T CD4+|T CD4+ self-interactions, similar to Adj_normal, involve HLA-E and other immune regulatory molecules, but in PDAC, these interactions are alongside a much broader range of signals.
- Absence of Fibroblast Interactions: The lack of detectable fibroblast interactions in these top 80 pairs, despite being a crucial component of the PDAC TME, suggests that either their primary interaction partners are not among the selected target cells, or their interactions with the chosen cell types are less prominent compared to the highly active tumor-macrophage/T cell axis under the applied filtering criteria.
Clinical or Translational Implications
The observed cell-cell interaction patterns offer crucial insights for therapeutic targeting and understanding PDAC pathogenesis:
- Immune Checkpoint & Immunosuppression Targets: The strong LGALS9-HAVCR2 (Galectin-9-TIM-3) interaction highlights a potential immune checkpoint pathway contributing to T cell exhaustion in PDAC. Targeting this axis could reinvigorate anti-tumor immunity. Similarly, the ubiquitous TGFB1-TGFBR signaling underscores TGF-β as a central orchestrator of immunosuppression and fibrosis, making it a highly relevant therapeutic target for overcoming resistance to immunotherapy [PubMed Search: TGFbeta blockade pancreatic cancer].
- Tumor-Promoting Pathways: The active HGF-MET and SPP1-integrin interactions between tumor cells and macrophages are known drivers of tumor growth, invasion, and metastasis. Inhibiting these pathways could impede tumor progression and reduce metastatic potential [GeneCards: MET cancer drug].
- Chemotaxis and Recruitment Inhibition: The prominent chemokine signaling (CCL-CCR, CXCL12-CXCR4, CXCL16-CXCR6) represents attractive targets to block the recruitment of pro-tumorigenic immune cells, particularly macrophages, into the TME. Disrupting this recruitment could reduce tumor-promoting inflammation and immunosuppression [PubMed Search: CXCR4 inhibitor pancreatic cancer].
- Complex TME Modulation: The intricate network of interactions suggests that single-target therapies might be insufficient. Combination therapies targeting multiple pathways (e.g., an immune checkpoint blockade combined with a TGF-β inhibitor or a chemokine receptor antagonist) might be more effective in remodeling the immunosuppressive PDAC TME and enhancing anti-tumor responses.
The detailed analysis of these CCI patterns provides a valuable framework for prioritizing specific ligand-receptor pairs for further experimental validation and for developing novel therapeutic strategies aimed at disrupting pro-tumorigenic crosstalk and re-educating the immune microenvironment in PDAC.
13. Condition-Specific Cell-Cell Interaction Patterns in Pancreatic Ductal Adenocarcinoma (PDAC)
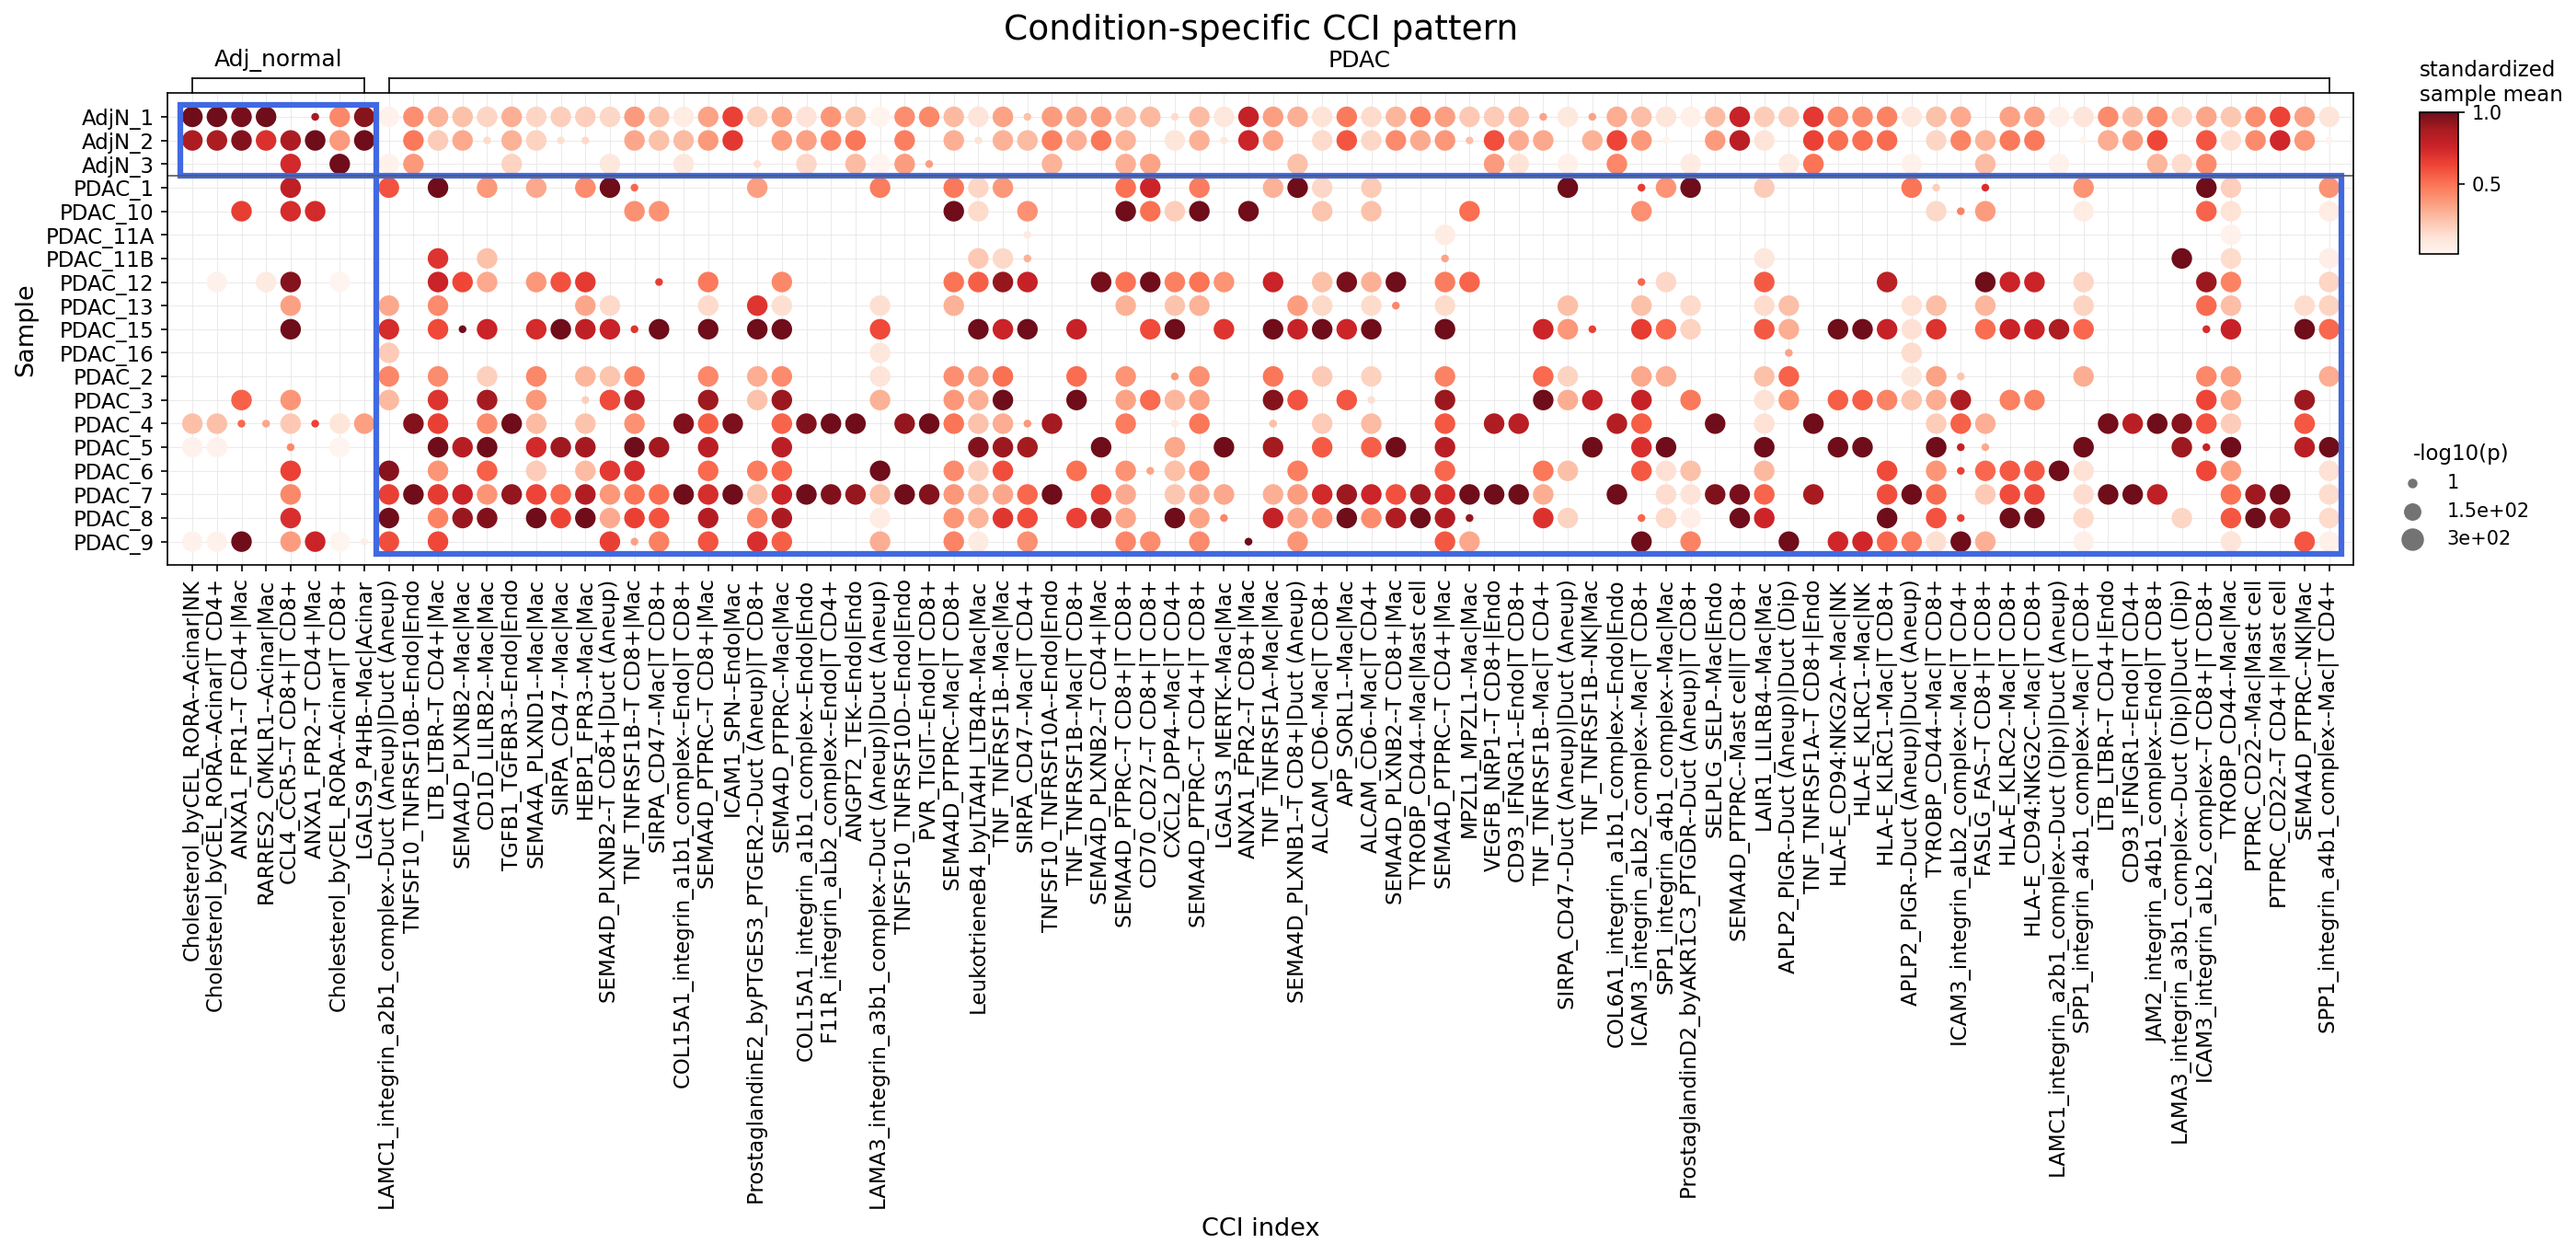
[Analysis Visualization Results]...
Analysis Overview
This analysis utilizes CellPhoneDB to investigate cell-cell interaction (CCI) patterns, comparing samples from adjacent normal pancreatic tissue (Adj_normal) with those from Pancreatic Ductal Adenocarcinoma (PDAC) patients. The dot plot visualizes the standardized mean expression of ligand-receptor pairs for specific cell type interactions (represented by dot color intensity) and their statistical significance (-log10(p-value), represented by dot size) across individual samples, grouped by condition. The primary objective is to identify CCIs that are differentially active between normal and cancerous pancreatic tissues, thereby elucidating alterations in the intercellular communication landscape within the PDAC tumor microenvironment.
Visual Summary
- The plot effectively highlights distinct cell-cell interaction patterns between Adj_normal and PDAC conditions.
- Adj_normal Samples: These samples (AdjN_1, AdjN_2, AdjN_3) show strong and significant interactions for a relatively limited subset of CCI pairs, primarily concentrated on the left side of the plot. These interactions frequently involve Acinar cells, T cells, and Macrophages, likely reflecting normal pancreatic tissue homeostasis and immune surveillance.
- PDAC Samples: In stark contrast, PDAC samples exhibit a significantly expanded and often intensified network of CCIs across a much broader range of ligand-receptor pairs and cell types. This widespread activation suggests a profound remodeling of cell communication in the tumor microenvironment, indicative of complex disease pathology.
- PDAC-Enriched Interactions: Numerous CCI groups show striking enrichment and higher statistical significance in PDAC compared to Adj_normal. Key cell types frequently involved in these differential interactions include:
- Aneuploid Ductal Cells: A significant number of prominent PDAC-specific interactions involve "Duct (Aneuploid)" cells (representing the tumor cells) as one of the interacting partners. Examples include LAMC1_integrin_a2b1_complex--Duct (Aneuploid), LAMA3_integrin_a3b1_complex--Duct (Aneuploid), and ICAM3_integrin_aL2_complex--Duct (Aneuploid). This underscores the direct involvement of malignant cells in orchestrating aberrant communication.
- Macrophages (Mac): Macrophages emerge as central players, displaying extensive interactions with T cells (CD4+, CD8+), Endothelial cells, and Ductal cells. Notable examples include SIRPA_CD47--Mac|Mac, SPP1_integrin_a4b1_complex--Mac|Mac, and various SEMA4D_PLXNB2--Mac|Mac or SEMA4D_PTPRC--Mac|Mac interactions.
- T Cells (CD4+, CD8+): While present in normal tissue, T cell interactions with Macrophages, Endothelial cells, and Ductal cells (e.g., PVR_TIGIT--Duct (Aneuploid)|Mac, CD93_IFNGR1--Endo|T CD4+) appear more widespread and often stronger in PDAC, suggesting altered immune cell function and regulation.
- Endothelial Cells (Endo): Interactions such as TNFSF10_TNFRSF10B--Endo|Endo and ANGPT2_TEK--Endo|Endo are notably active in PDAC, pointing towards dynamic processes like angiogenesis and vascular remodeling.
- Specific ligand-receptor families like Integrins (e.g., LAMC1, LAMA3, SPP1 interacting with their respective integrin partners), SEMA4D-Plexin/PTPRC, and TNF/TNFRSF family members are frequently observed in these highly active, PDAC-associated interactions.
Biological Interpretation
- Extensive Remodeling of the PDAC Microenvironment: The dramatic shift from a limited, regulated communication network in normal pancreas to a broad, intense, and diversified network in PDAC signifies a fundamental reorganization of the tumor microenvironment (TME). This complex intercellular crosstalk is crucial for driving tumor growth, metastasis, immune evasion, and therapeutic resistance in PDAC.
- Tumor Cell-Stromal Interactions Driving Progression: The prominent involvement of aneuploid ductal (tumor) cells in numerous interactions, especially with integrin complexes (e.g., LAMC1-integrin, LAMA3-integrin, ICAM3-integrin), highlights direct communication between malignant epithelial cells and their surrounding stroma and immune cells. Integrin signaling is critical for mediating cell adhesion, migration, invasion, and extracellular matrix (ECM) remodeling, which are all hallmarks of cancer progression and metastasis in PDAC [GeneCards: ITGA3].
- Pro-tumorigenic Macrophage Polarization: Macrophages demonstrate a high degree of interactive activity in PDAC, often with other immune cells and tumor cells. Interactions involving SIRPA_CD47 may suggest autocrine or paracrine signaling that helps maintain macrophage identity or inhibits phagocytosis (CD47 acts as a "don't eat me" signal) [PubMed Search: CD47 macrophage cancer]. The strong SPP1_integrin interactions are particularly significant, as Secreted Phosphoprotein 1 (SPP1, or Osteopontin) is a known pro-tumorigenic cytokine that can promote macrophage recruitment and polarization towards an immunosuppressive, pro-cancer phenotype (M2-like) within the TME [UniProt: SPP1].
Immune Suppression and Evasion Mechanisms
- Interactions such as PVR_TIGIT--Duct (Aneuploid)|Mac suggest the activation of immune checkpoint mechanisms. Tumor cells or associated macrophages interacting with TIGIT-expressing immune cells can contribute to T cell exhaustion and immunosuppression, thereby aiding tumor escape from immune surveillance [PubMed Search: TIGIT cancer immunotherapy].
- The heightened HLA-E_KLRC1 and HLA-E_NKG2A interactions, especially involving macrophages and NK cells, point towards potential immune evasion strategies. HLA-E expression on tumor or stromal cells can bind to NKG2A on NK cells and certain T cells, leading to their inhibition and compromised anti-tumor activity [PubMed Search: HLA-E NK cell immune evasion].
- Angiogenesis and Fibrosis: Enhanced ANGPT2_TEK--Endo|Endo interactions indicate active angiogenesis, a crucial process for supplying nutrients to the growing tumor and facilitating metastasis [GeneCards: ANGPT2]. Various integrin-ECM interactions further support ongoing tissue remodeling and the intense desmoplastic reaction (fibrosis) characteristic of the PDAC TME.
- Inflammatory Signaling: The prevalence of ProstaglandinE2 and TNF/TNFRSF family interactions indicates an active inflammatory milieu. Chronic inflammation can both promote and inhibit tumor progression, but in PDAC, it often contributes to an immunosuppressive and pro-tumorigenic environment.
Clinical or Translational Implications
- Identification of Novel Therapeutic Targets: The numerous highly active and PDAC-specific CCI pairs represent promising targets for therapeutic intervention. Strategies aimed at disrupting key ligand-receptor axes, such as the SPP1-integrin pathway, SEMA4D-Plexin/PTPRC signaling, or immune checkpoints like TIGIT, could potentially inhibit critical pro-tumorigenic communication pathways.
- Biomarker Discovery for PDAC: The distinct CCI signatures observed in PDAC could serve as valuable diagnostic or prognostic biomarkers. Measuring the expression levels of key interacting partners or the overall strength of specific CCI networks might aid in earlier detection, patient stratification, or monitoring therapeutic response, particularly in a disease with late diagnosis and poor prognosis.
- Overcoming Immunosuppression in PDAC: Understanding the specific interactions contributing to immune evasion (e.g., PVR-TIGIT, HLA-E-NKG2A) is crucial for developing more effective immunotherapies. Modulating these interactions could help reactivate anti-tumor immune responses in PDAC, which has shown limited success with current immunotherapeutic approaches.
- Targeting the Tumor Microenvironment: Given the central role of stromal and immune cells (especially macrophages and aneuploid tumor cells) in PDAC progression, therapeutic strategies that modulate these aberrant cell-cell communications, rather than solely targeting malignant cells, hold significant potential for improving treatment outcomes in this challenging cancer.
14. Immune Checkpoint Pathway Interactions in Pancreatic Tissue
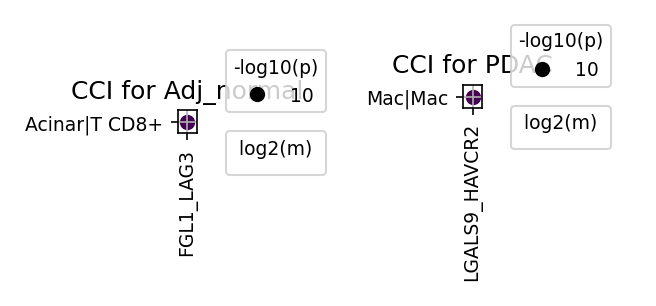
[Analysis Visualization Results]...
Analysis Overview
This analysis aimed to identify cell-cell interactions (CCI) involving a predefined set of immune checkpoint and cell cycle-related genes across different cell types and conditions (Adj_normal vs. PDAC) in pancreatic single-cell RNA-seq data. The CellPhoneDB method was used to infer ligand-receptor interactions, and the results were visualized using dot plots to show interaction strength (mean expression) and significance (-log10(p-value)). The plot_cci_dots tool was configured to examine interactions at the 'condition' level, with a focus on specific target genes including key immune checkpoints (PDCD1, CD274, CTLA4, LAG3, TIGIT, HAVCR2, BTLA, CD47) and cell cycle regulators (CCNA2, CCNB1, CCND1, CDK1, CDK2, MKI67, CDKN1A, CDKN2A). The displayed visualizations highlight particularly significant interactions.
Visual Summary
The provided dot plots showcase two distinct, highly significant cell-cell interactions, one in the Adj_normal condition and one in the PDAC condition:
- Adj_normal Condition:
- A prominent interaction between Acinar cells and CD8+ T cells was observed via the FGL1-LAG3 ligand-receptor pair.
- Both the interaction strength (indicated by dark purple color, representing high log2(m)) and statistical significance (indicated by a large dot size, representing a high -log10(p) value, near 10) are very strong, suggesting a robust interaction in the adjacent normal pancreatic tissue.
- PDAC Condition:
- A strong autocrine/paracrine interaction within Macrophages (Mac|Mac) was identified through the LGALS9-HAVCR2 (Galectin-9-TIM-3) pathway.
- Similar to the Adj_normal observation, this interaction shows high statistical significance (large dot size, high -log10(p) value, near 10) and considerable interaction strength (dark purple color, high log2(m)), indicating its strong presence in the pancreatic ductal adenocarcinoma (PDAC) microenvironment.
Biological Interpretation
The identified interactions shed light on potential immunomodulatory mechanisms in both healthy and diseased pancreatic tissue.
- FGL1-LAG3 Interaction in Adj_normal Pancreas:
- LAG3 (Lymphocyte-activation gene 3) is an immune checkpoint receptor primarily expressed on activated T cells, including CD8+ T cells. Its binding to ligands leads to T cell anergy or exhaustion [1].
- FGL1 (Fibrinogen-like protein 1) has recently been identified as a major ligand for LAG3. The FGL1-LAG3 axis plays a critical role in immune suppression in various contexts, including cancer [2].
- The detection of a strong FGL1-LAG3 interaction between Acinar cells and CD8+ T cells in Adj_normal tissue suggests that this pathway may be involved in maintaining immune homeostasis and preventing excessive inflammation or autoimmunity in the healthy pancreas. Acinar cells, the predominant cell type in the exocrine pancreas, might actively participate in regulating local immune responses by expressing FGL1 and interacting with resident T cells.
- LGALS9-HAVCR2 (Galectin-9-TIM-3) Interaction in PDAC Macrophages:
- HAVCR2 (Hepatitis A virus cellular receptor 2), also known as TIM-3 (T-cell immunoglobulin and mucin domain-containing protein 3), is another crucial immune checkpoint receptor found on various immune cells, including T cells, NK cells, and myeloid cells such as macrophages [3].
- LGALS9 (Galectin-9) is a known ligand for TIM-3. The Galectin-9-TIM-3 pathway is recognized for its immunosuppressive functions, often leading to T cell exhaustion and promoting the development of an immune-tolerogenic microenvironment [4].
- The finding of a significant Mac|Mac interaction via LGALS9-HAVCR2 in PDAC is particularly notable. Macrophages are abundant in the PDAC tumor microenvironment (TME) and are often polarized towards an immunosuppressive, tumor-promoting (M2-like) phenotype [5]. This autocrine/paracrine signaling loop among macrophages suggests that Galectin-9-TIM-3 interactions might be critical for sustaining or amplifying the immunosuppressive functions of tumor-associated macrophages (TAMs). This could lead to a feedback mechanism where macrophages promote their own immunosuppressive state, thereby fostering tumor progression and resistance to anti-tumor immunity.
Clinical or Translational Implications
The identified immune checkpoint interactions offer valuable insights for therapeutic development and understanding disease mechanisms in pancreatic cancer.
- Therapeutic Targeting of Immune Checkpoints: Both LAG3 and TIM-3 are validated immune checkpoint targets in oncology.
- The robust LGALS9-HAVCR2 interaction in PDAC macrophages highlights TIM-3 as a potential therapeutic target for modulating the immunosuppressive TME in pancreatic cancer. Blocking this interaction could re-program TAMs from a pro-tumorigenic to an anti-tumorigenic state, enhancing anti-tumor immune responses [6].
- While the FGL1-LAG3 interaction was observed in Adj_normal tissue, understanding its baseline role is important. In the context of PDAC, if this pathway also becomes dysregulated or upregulated, targeting LAG3 could be beneficial, potentially in combination with other immunotherapies.
- Addressing Macrophage-Mediated Immunosuppression: The Mac|Mac LGALS9-HAVCR2 interaction suggests that strategies aimed at disrupting macrophage-macrophage communication or intrinsic macrophage signaling through this pathway could be highly effective in PDAC. This could involve direct TIM-3 inhibitors or approaches to reduce Galectin-9 expression in the TME.
- Biomarker Potential: High expression of LGALS9 or HAVCR2 on macrophages within the PDAC TME could serve as a predictive biomarker for patient response to specific immunotherapies or as a prognostic indicator for disease progression. Further research could investigate if the strength of these interactions correlates with clinical outcomes.
- Combination Immunotherapy Strategies: Given the complex and highly immunosuppressive nature of the PDAC TME, single-agent immune checkpoint blockade has shown limited success. The data suggests that combining therapies targeting different immune checkpoints (e.g., anti-TIM-3 with anti-PD-1/PD-L1 or anti-LAG3) may offer a more comprehensive approach to overcome immune evasion and improve patient outcomes [7].
---
References:
- LAG3 (Lymphocyte-activation gene 3) Function: GeneCards entry for LAG3: https://www.genecards.org/cgi-bin/carddisp.pl?gene=LAG3
- FGL1-LAG3 Axis: Review on FGL1-LAG3 in cancer: https://pubmed.ncbi.nlm.nih.gov/?term=FGL1+LAG3+immune+checkpoint
- HAVCR2 (TIM-3) Function: GeneCards entry for HAVCR2: https://www.genecards.org/cgi-bin/carddisp.pl?gene=HAVCR2
- Galectin-9-TIM-3 Pathway: Review on Galectin-9-TIM-3 axis: https://pubmed.ncbi.nlm.nih.gov/?term=Galectin-9+TIM-3+immunosuppression
- Macrophages in PDAC TME: Review on tumor-associated macrophages in pancreatic cancer: https://pubmed.ncbi.nlm.nih.gov/?term=macrophages+pancreatic+cancer+microenvironment
- Therapeutic targeting of TIM-3: Clinical trials and preclinical studies on TIM-3 blockade: https://pubmed.ncbi.nlm.nih.gov/?term=TIM-3+blockade+cancer+therapy
- Combination Immunotherapy in PDAC: Review on combination strategies in pancreatic cancer immunotherapy: https://pubmed.ncbi.nlm.nih.gov/?term=pancreatic+cancer+combination+immunotherapy
15. Condition-Specific Cell-Cell Interaction Patterns in Pancreatic Cancer
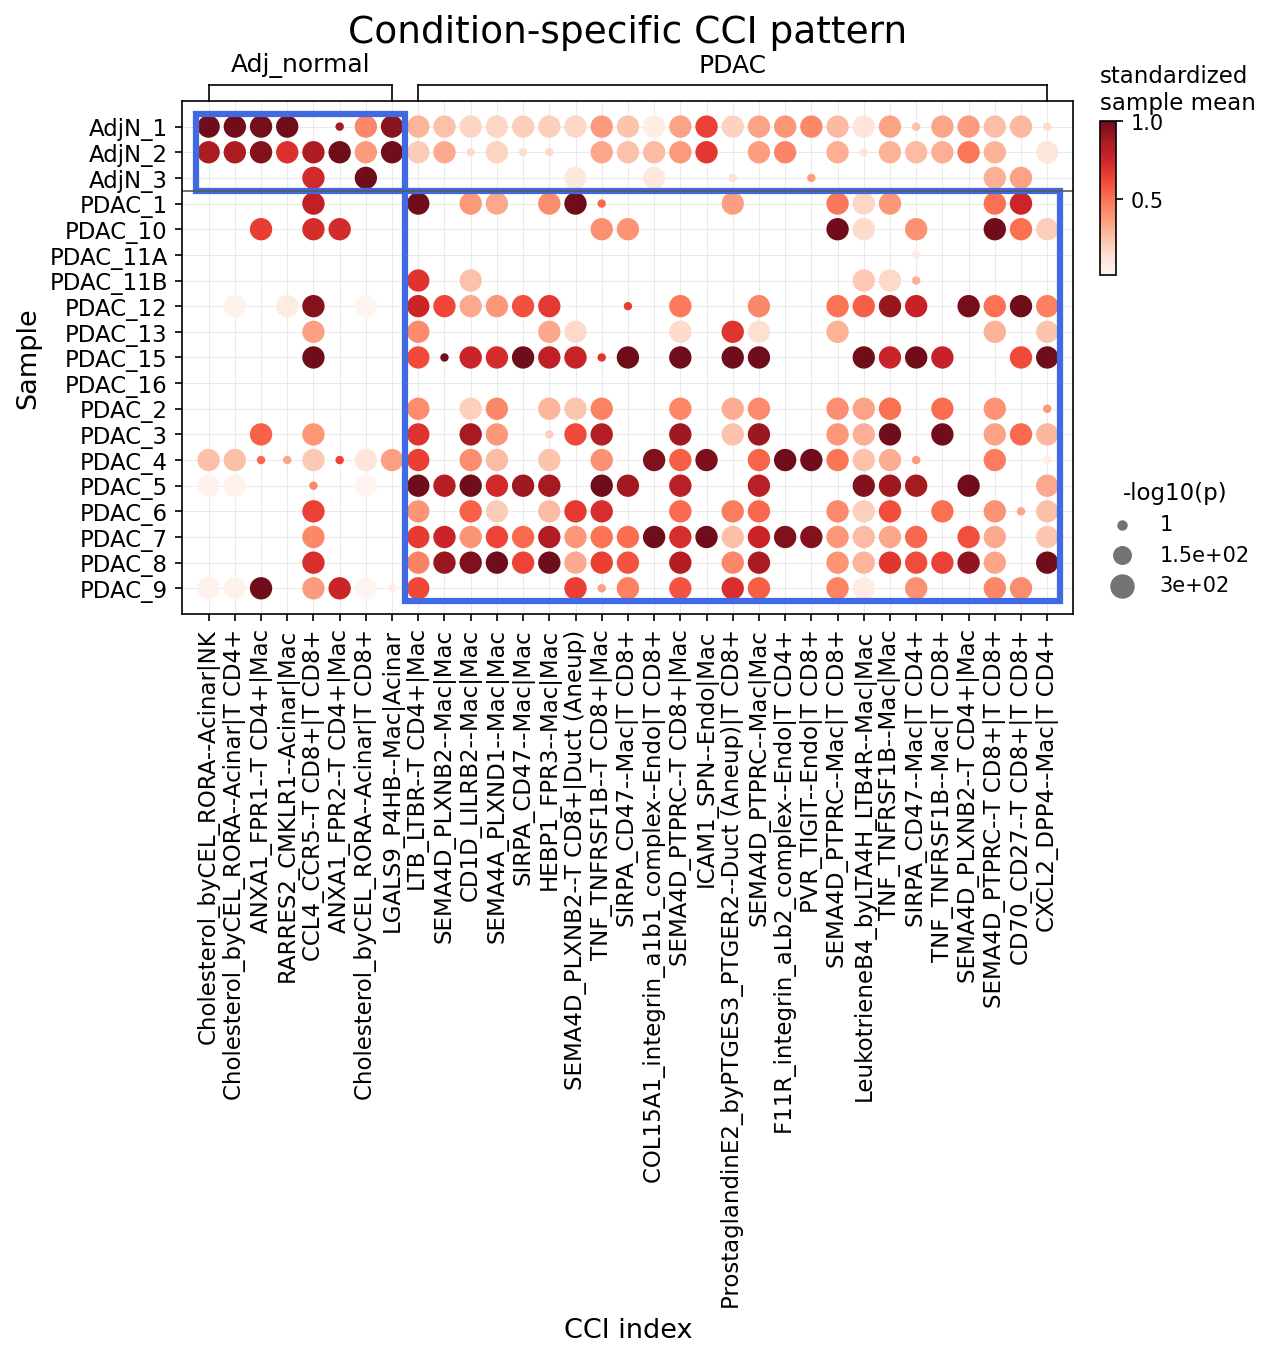
[Analysis Visualization Results]...
Analysis Overview
This analysis identifies and visualizes statistically significant differences in cell-cell interactions (CCIs) between 'Adj_normal' (adjacent normal pancreatic tissue) and 'PDAC' (Pancreatic Ductal Adenocarcinoma) conditions. The focus is on interactions involving major immune cells (T cell, Myeloid cell, Mast cell, B cell) and stromal cells. The dot plot displays the standardized mean interaction strength (color intensity) and the statistical significance (-log10(p-value), represented by dot size) for selected CCI pairs across individual samples. The analysis utilized a t-test with an 'alternative' of 'greater' and a p-value cutoff of 0.1 to identify interactions significantly enriched in one condition over the other. Only the top 25 most significant interactions per group are shown.
Visual Summary
The dot plot clearly delineates two major groups of cell-cell interactions, each predominantly active in either the 'Adj_normal' or the 'PDAC' condition, highlighted by the blue boxes:
- Adj_normal Condition-Specific Interactions (Left Blue Box):
- This region shows a cluster of interactions that are strongly active (dark red, large dots) in the 'Adj_normal' samples (AdjN_1, AdjN_2, AdjN_3).
- These interactions are primarily characterized by the involvement of Acinar cells interacting with immune cells such as NK cells, Macrophages (Mac), and CD4+ T cells. Examples include Cholesterol_byCEL_RORA-Acinar|NK, ANXA1_FPR1-Acinar|Mac, and CCL4_CCR5-Acinar|T CD4+.
- These interactions are largely absent or show very low activity in the 'PDAC' samples.
- PDAC Condition-Specific Interactions (Right Blue Box):
- This much larger cluster reveals a diverse array of CCIs that are highly active (dark red, large dots) across most 'PDAC' samples, with minimal to no activity in 'Adj_normal' samples.
- Key interacting cell types prominently featured are Macrophages (Mac), CD4+ and CD8+ T cells, Endothelial cells (Endo), and critically, Ductal cells identified as Aneuploid (Duct(Aneup)) – indicative of malignant epithelial cells.
- Examples include numerous Macrophage-Macrophage interactions (e.g., SEMA4D_PLXNB2-Mac|Mac, SIRPA_CD47-Mac|Mac, TNF_TNFRSF1B-Mac|Mac), interactions between Endothelial cells and T cells (e.g., COL15A1_integrin_a1b1_complex-Endo|T CD8+, PVR_TIGIT-Endo|T CD8+), and direct interactions between Aneuploid Ductal cells and Macrophages (e.g., HEBP1_FPR3-Duct(Aneup)|Mac, ProstaglandinE2_byPTGES3_PTGER2-Duct(Aneup)|Mac).
Biological Interpretation
The observed shifts in cell-cell interaction patterns between adjacent normal pancreas and PDAC tissue underscore a profound remodeling of the tissue microenvironment during tumor development and progression.
- Disruption of Normal Pancreatic Homeostasis:
- The robust Acinar cell-centric interactions in 'Adj_normal' likely represent signals crucial for the maintenance of healthy pancreatic function and immune surveillance. For instance, ANXA1_FPR1-Acinar|Mac suggests anti-inflammatory or tissue repair mechanisms involving Annexin A1 and macrophages, typical of a healthy state. The dramatic reduction of these interactions in PDAC indicates a severe disruption of normal acinar architecture and function, possibly due to acinar-to-ductal metaplasia and subsequent tumor infiltration.
- Emergence of a Pro-Tumorigenic and Immunosuppressive Tumor Microenvironment (TME) in PDAC:
- Macrophage Dominance: The prevalence of Macrophage-Macrophage (e.g., SEMA4D_PLXNB2-Mac|Mac) and Macrophage-T cell interactions highlights the central role of macrophages, likely tumor-associated macrophages (TAMs), in the PDAC TME. SEMA4D-Plexin B2 signaling is implicated in immune cell migration and activation, suggesting active recruitment and communication among TAMs.
- Immune Evasion Mechanisms: Interactions like SIRPA_CD47-Mac|Mac and potentially SIRPA_CD47-Duct(Aneup)|Mac point to the prominent "don't eat me" signaling axis. This pathway allows cancer cells and potentially TAMs to evade phagocytosis by other immune cells, facilitating tumor progression Ref: [UniProt: CD47, UniProt: SIRPA]. Another critical immune checkpoint, PVR_TIGIT-Endo|T CD8+, is also highly active. TIGIT binding to PVR (CD155) on endothelial cells can inhibit T cell activation and promote immune exhaustion, contributing to the immunosuppressive nature of the PDAC TME Ref: [UniProt: TIGIT, UniProt: PVR].
- Malignant Cell-Driven Interactions: The specific identification of Aneuploid Ductal cells (malignant cells, based on obs['ploidy_dec']) engaging in CCIs is crucial. For example, ProstaglandinE2_byPTGES3_PTGER2-Duct(Aneup)|Mac suggests that malignant ductal cells communicate with macrophages via Prostaglandin E2 (PGE2) signaling. PGE2 is a well-known mediator of inflammation, angiogenesis, and immunosuppression, promoting tumor growth and survival in various cancers, including PDAC Ref: [PubMed search: PGE2 PDAC immunosuppression].
- Vascular and Inflammatory Support: Interactions involving Endothelial cells (e.g., COL15A1_integrin_a1b1_complex-Endo|T CD8+, ICAM1_SPN-Endo|Mac) indicate active angiogenesis and immune cell extravasation, critical processes for tumor growth and metastatic potential. TNF_TNFRSF1B-Mac|Mac points to active TNF signaling, often associated with chronic inflammation that fuels tumor progression.
Clinical or Translational Implications
- Diagnostic and Prognostic Biomarkers: The distinct CCI profiles could serve as valuable biomarkers for differentiating healthy pancreatic tissue from PDAC. A high prevalence of acinar-immune interactions might indicate normal tissue, while the presence and strength of PDAC-specific macrophage, T cell, and malignant ductal cell interactions could signal the presence of malignancy and potentially its stage or aggressiveness.
- Novel Therapeutic Targets:
- Immunosuppressive Checkpoints: The significant activation of immune checkpoint axes such as SIRPα-CD47 and PVR-TIGIT presents actionable therapeutic targets. Inhibiting these pathways, for instance with anti-CD47 or anti-TIGIT antibodies, could potentially unleash anti-tumor immune responses, offering new avenues for immunotherapy in PDAC, which is notoriously resistant to current treatments.
- Pro-Tumorigenic Signaling Pathways: The central role of PGE2 signaling (via PTGES3_PTGER2-Duct(Aneup)|Mac) indicates that targeting the PGE2 pathway, perhaps with COX inhibitors or EP2 receptor antagonists, could disrupt crucial pro-tumorigenic communication between malignant cells and TAMs, reducing tumor growth and improving the efficacy of existing therapies.
- Macrophage Reprogramming: Given the extensive involvement of macrophages, strategies aimed at depleting TAMs or reprogramming their pro-tumorigenic phenotypes could disrupt multiple key interactions and reshape the TME towards an anti-tumor state.
- Understanding Treatment Resistance: The complex and multifaceted CCI network identified in PDAC highlights the intricate communication sustaining tumor growth and immune evasion. A comprehensive understanding of these interactions is crucial for developing rational combination therapies that can overcome the inherent resistance of PDAC to current therapeutic modalities by simultaneously targeting multiple pro-tumorigenic and immunosuppressive pathways.
16. Ductal Cell Condition-Specific Surfaceome Markers in Pancreatic Cancer
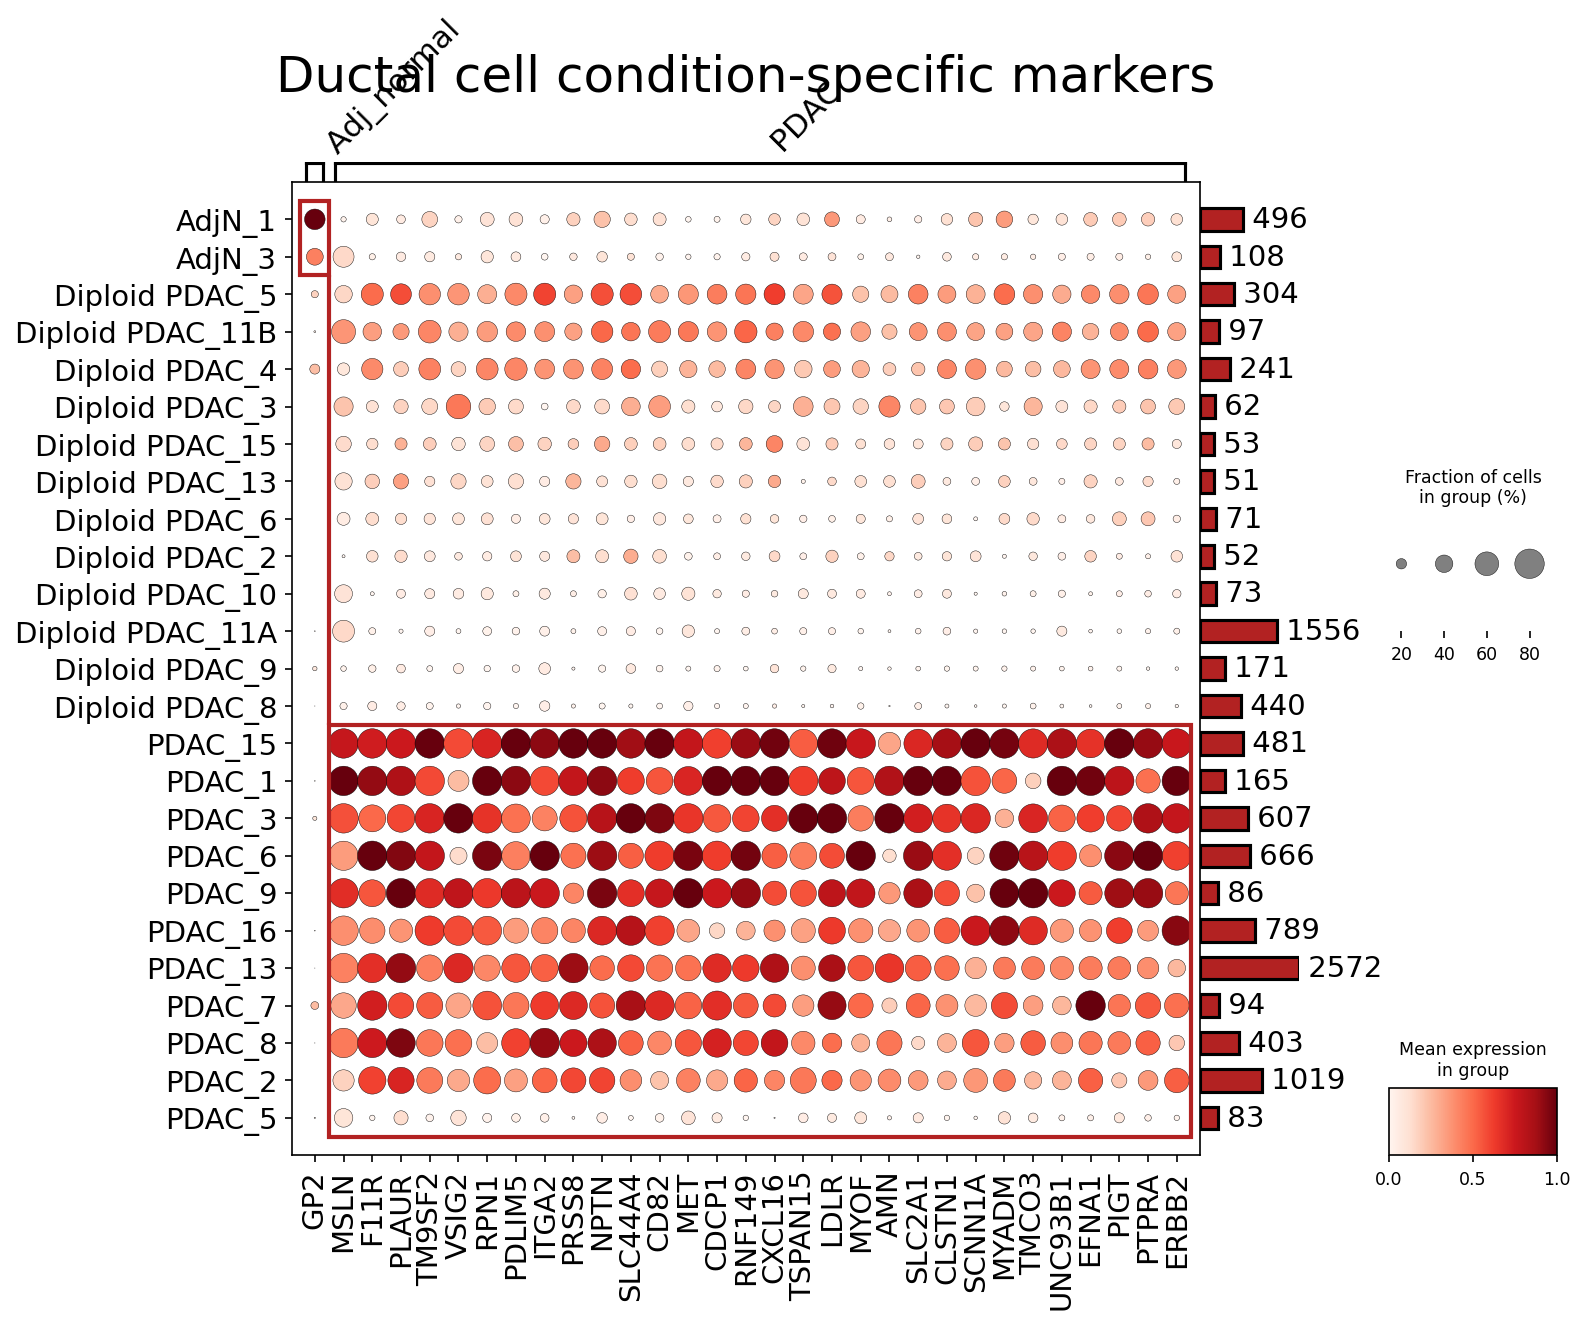
[Analysis Visualization Results]...
Analysis Overview
This analysis identifies and visualizes condition-specific surfaceome markers in Ductal cells, the presumed cell type of origin for Pancreatic Ductal Adenocarcinoma (PDAC). The dot plot displays the mean expression level (color intensity) and the fraction of cells expressing (dot size) for selected surfaceome genes across different Adj_normal, Diploid PDAC, and PDAC samples. The goal is to highlight differential gene expression patterns between healthy and cancerous ductal cells, focusing on cell surface proteins which are often important for cell function and potential therapeutic targeting.
Visual Summary
The dot plot effectively delineates distinct expression patterns for a panel of surfaceome markers in Ductal cells across different samples.
- Sample Clustering: Samples are hierarchically clustered on the y-axis, clearly segregating Adj_normal and some Diploid PDAC samples (top cluster) from the majority of PDAC samples (bottom cluster).
- Differential Expression: The most prominent observation is the marked upregulation of a substantial set of surfaceome genes in the PDAC samples compared to Adj_normal and Diploid PDAC samples. For genes such as GP2, MSLN, PLAUR, PRSS8, CD82, MET, CDCP1, and ERBB2, there is a distinct increase in both the mean expression level (darker red color) and the fraction of cells expressing these genes (larger dot size) within the PDAC sample cluster.
- Key Upregulated Markers in PDAC: Genes like GP2, MSLN, PLAUR, PRSS8, CD82, MET, CDCP1, RNF149, CXCL16, TSPAN15, LDLR, MYOF, AMN, SLC2A1, CLSTN1, SCNN1A, MYADM, TMCO3, UNC93B1, EFNA1, PIGT, PTPRA, and ERBB2 show particularly strong and widespread expression in the PDAC samples.
- Homogeneity within Groups: Within the PDAC cluster, many markers show consistently high expression across multiple samples (e.g., PDAC_15, PDAC_1, PDAC_3, PDAC_6), indicating a general characteristic of PDAC ductal cells. Some variability exists, with certain PDAC samples showing slightly lower expression for specific markers (e.g., PDAC_5).
- Lower Expression in Normal/Diploid PDAC: In contrast, Adj_normal samples and Diploid PDAC samples generally exhibit low or no expression for most of these markers, or significantly reduced expression compared to the main PDAC group. For example, GP2 and MSLN show minimal expression in Adj_normal and many Diploid PDAC samples.
Biological Interpretation
The observed upregulation of numerous surfaceome genes in Ductal cells from PDAC samples reflects significant alterations in cellular identity, signaling, and interactions characteristic of pancreatic cancer progression.
- Tumor-Associated Antigens: Several identified genes are well-known or emerging tumor-associated antigens in PDAC and other cancers:
- MSLN (Mesothelin): A cell surface glycoprotein highly expressed in various cancers, including PDAC. It is implicated in cell adhesion and is a target for several investigational cancer therapies. GeneCards: MSLN
- MET: A receptor tyrosine kinase whose activation promotes cell proliferation, survival, and motility. Its overexpression or activation is frequently observed in PDAC and contributes to aggressive tumor behavior. GeneCards: MET
- ERBB2 (HER2): Another receptor tyrosine kinase, often associated with aggressive growth in several cancers. While most studied in breast and gastric cancers, its role and potential as a target in PDAC are under investigation. GeneCards: ERBB2
- CDCP1 (CUB Domain Containing Protein 1): A transmembrane protein that is often overexpressed in various cancers and has been linked to increased invasiveness, metastasis, and therapy resistance. GeneCards: CDCP1
- PLAUR (Urokinase Plasminogen Activator Receptor): Involved in extracellular matrix degradation and cell migration, its upregulation is commonly seen in invasive cancers, facilitating tumor spread. GeneCards: PLAUR
- GP2 (Glycoprotein 2): Expressed on pancreatic acinar and ductal cells, its role in PDAC is gaining attention, with studies suggesting it may be a marker for progenitor-like cells or play a role in tumor immunity. GeneCards: GP2
- Altered Cellular Function: The upregulation of surface proteins implies significant changes in how these Ductal cells interact with their microenvironment, other cells, and growth factors. This could contribute to sustained proliferative signaling, evasion of growth suppressors, resistance to cell death, induction of angiogenesis, and activation of invasion and metastasis—hallmarks of cancer.
- Metabolic Reprogramming: The increased expression of LDLR (Low-Density Lipoprotein Receptor) suggests altered lipid metabolism in PDAC Ductal cells, consistent with the high metabolic demands of rapidly proliferating cancer cells that often upregulate cholesterol uptake. GeneCards: LDLR
- Immune Modulation: The expression of certain chemokines or immune-related surface proteins like CXCL16 could indicate changes in the tumor microenvironment and immune cell recruitment, which are critical aspects of PDAC biology. GeneCards: CXCL16
Clinical or Translational Implications
The identification of these Ductal cell surfaceome markers holds significant clinical and translational potential for PDAC.
- Diagnostic and Prognostic Biomarkers: The identified highly upregulated surface markers, such as MSLN, MET, CDCP1, and ERBB2, could serve as robust diagnostic or prognostic biomarkers for PDAC. Their detectability in tumor tissue via immunohistochemistry or potentially in liquid biopsies (e.g., circulating tumor cells, exosomes, or cell-free DNA) could aid in early detection, monitoring disease progression, and predicting patient outcomes.
- Therapeutic Targets: Given their cell surface localization, these proteins are highly accessible for targeted therapeutic interventions.
- Antibody-Drug Conjugates (ADCs): Many of these markers are prime candidates for ADCs, which deliver cytotoxic agents directly to cancer cells. MSLN-targeted ADCs are already in clinical trials for PDAC.
- Monoclonal Antibodies: Neutralizing or blocking antibodies against these receptors (e.g., MET, ERBB2) could inhibit oncogenic signaling pathways.
- CAR-T Cell Therapy: These surface proteins could be utilized as targets for Chimeric Antigen Receptor (CAR) T-cell therapies, redirecting immune cells to specifically recognize and eliminate PDAC cells.
- Patient Stratification: Differential expression profiles of these markers might enable the stratification of PDAC patients into subgroups that could benefit from specific targeted therapies, moving towards more personalized medicine approaches.
- Experimental Validation: Further experimental work, including functional studies, validation of protein expression using techniques like immunohistochemistry or flow cytometry on patient samples, and in vivo efficacy studies, would be crucial to confirm their utility as bona fide biomarkers and therapeutic targets.
17. Macrophage Condition-Specific Surfaceome Markers in Pancreatic Cancer
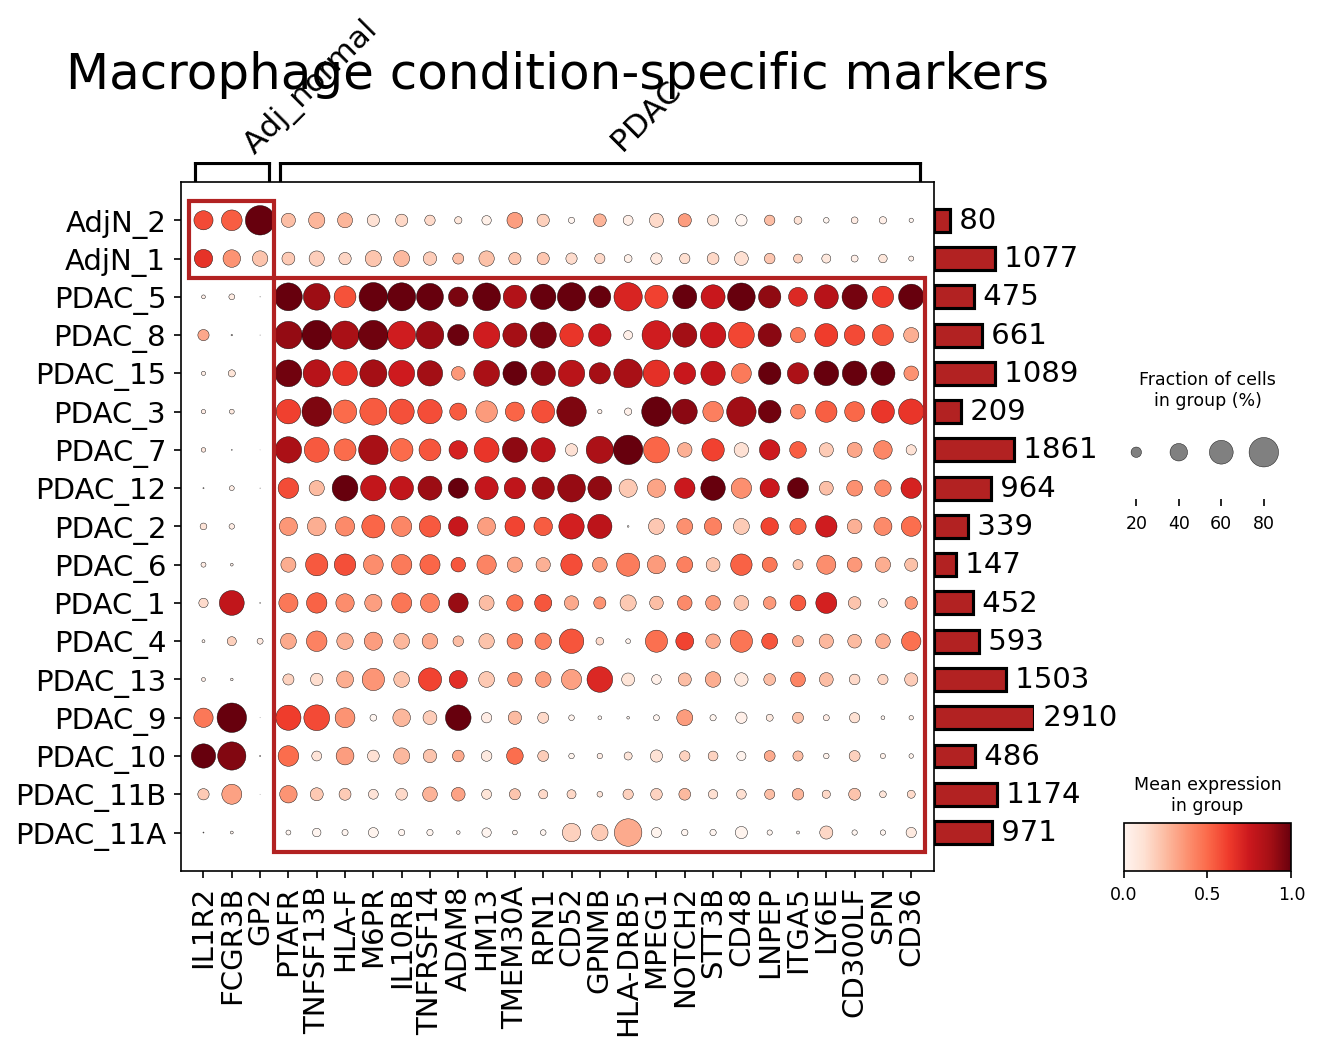
[Analysis Visualization Results]...
Analysis Overview
This analysis aimed to identify surfaceome markers that distinguish macrophages in pancreatic ductal adenocarcinoma (PDAC) from those in adjacent normal pancreatic tissue (Adj_normal). Using single-cell RNA-seq data, a differential gene expression analysis was performed specifically for Macrophage cells, comparing PDAC conditions against Adj_normal. The results were then filtered to include only surfaceome-associated genes, and a dot plot visualizes the expression of the top 30 most significant markers across individual samples, grouped by condition. The dot size represents the fraction of cells expressing the gene, while the color intensity indicates the mean expression level within the group.
Visual Summary
The dot plot clearly delineates distinct macrophage phenotypes between Adj_normal and PDAC samples based on their surface marker expression profiles.
- Adj_normal Specific Markers: The markers IL1R2 (Interleukin 1 Receptor Type 2) and FCGR3B (Fc Gamma Receptor IIIB, CD16b) show high expression and prevalence almost exclusively in the two Adj_normal samples (AdjN_2, AdjN_1). GP2 (Glycoprotein 2, Zymogen Granule Membrane Protein GP2) also appears enriched in normal macrophages, although it shows some sporadic expression in a few PDAC samples. This suggests a unique quiescent or homeostatic macrophage state in healthy pancreatic tissue.
- PDAC Specific Markers: A large cluster of genes, beginning with PTAFR (Platelet Activating Factor Receptor) and extending to CD36 (FAT/CD36), are highly expressed and prevalent across the majority of PDAC samples, while being largely absent or very lowly expressed in Adj_normal samples.
- Heterogeneity within PDAC: While most PDAC samples exhibit strong expression of these tumor-associated markers, there is notable heterogeneity. Samples like PDAC_5, PDAC_8, PDAC_15, PDAC_3, PDAC_7, and PDAC_12 display particularly robust and widespread expression of the PDAC-associated marker panel. In contrast, some PDAC samples (e.g., PDAC_2, PDAC_6, PDAC_1, PDAC_4, PDAC_13) show more variable or attenuated expression for certain markers within this group, indicating diverse macrophage states or infiltration levels across individual tumors.
- Sample Clustering: The hierarchical clustering on the y-axis effectively separates Adj_normal samples from PDAC samples, reinforcing the condition-specific nature of these macrophage populations. The clustering within the PDAC group further highlights inter-patient variability.
Biological Interpretation
The identified condition-specific surfaceome markers provide crucial insights into the functional roles and activation states of macrophages in the pancreatic tumor microenvironment compared to normal pancreas.
- Normal Pancreatic Macrophage Phenotype: The presence of IL1R2 and FCGR3B in Adj_normal macrophages suggests a state of balanced immune regulation. IL1R2 acts as a decoy receptor for IL-1, potentially dampening inflammatory responses, while FCGR3B (a low-affinity Fc receptor) is involved in immune complex clearance and cytokine release, consistent with homeostatic immune surveillance.
- Tumor-Associated Macrophage (TAM) Phenotype in PDAC: The significant upregulation of a broad panel of surface markers in PDAC macrophages strongly indicates a profound shift towards a tumor-associated macrophage (TAM) phenotype. Key markers and their potential implications include:
- Immunosuppressive and Pro-tumorigenic Signals: Genes like GPNMB (Glycoprotein Non-Melanoma B) GeneCards: GPNMB and CD36 (FAT/CD36) GeneCards: CD36 are frequently associated with M2-like, pro-tumorigenic macrophages that promote tumor growth, angiogenesis, and immunosuppression. IL10RB (IL-10 Receptor Subunit Beta) expression further supports an immunosuppressive role, as IL-10 signaling is a hallmark of M2 polarization and dampens anti-tumor immunity.
- Antigen Presentation and Immune Evasion: Upregulation of HLA-F (Nonclassical MHC Class I) and HLA-DRB5 (MHC Class II) indicates active antigen presentation processes, but in the tumor context, these can be manipulated by cancer cells for immune evasion.
- Inflammation and Stromal Interaction: PTAFR (Platelet-Activating Factor Receptor) plays roles in inflammation and leukocyte activation, while ITGA5 (Integrin Alpha 5) is involved in cell adhesion to the extracellular matrix, suggesting active interaction with the dense stromal compartment characteristic of PDAC. ADAM8 (ADAM Metallopeptidase Domain 8) is a protease implicated in immune cell migration and tumor invasion.
- Notch Signaling: NOTCH2 is a critical developmental pathway involved in cell fate determination and immune cell differentiation. Its upregulation suggests altered differentiation or activation pathways in TAMs.
- Other notable markers: TNFSF13B (BAFF) could indicate macrophage interaction with B cells within the tumor microenvironment. TNFRSF14 (HVEM) is a co-stimulatory/inhibitory receptor influencing T cell activity.
The collective profile of these upregulated surface markers strongly points towards a population of macrophages in PDAC that are highly active, immunosuppressive, and likely contribute to tumor progression, resistance to therapy, and remodeling of the tumor microenvironment.
Clinical or Translational Implications
The identification of these macrophage surface markers offers significant clinical and translational potential for PDAC.
- Biomarker Discovery: The distinct expression patterns of genes like GPNMB, CD36, PTAFR, and IL10RB could serve as diagnostic or prognostic biomarkers for PDAC. High expression of these markers on macrophages in patient biopsies could indicate a more aggressive tumor phenotype or predict treatment response.
- Therapeutic Targets: As these are surfaceome markers, they represent excellent candidates for targeted therapies.
- Immunomodulation: Targeting GPNMB or CD36 on TAMs could repolarize these cells from a pro-tumorigenic M2-like state to an anti-tumorigenic M1-like state, thereby enhancing anti-cancer immune responses. Antibodies against GPNMB (e.g., glembatumumab vedotin in clinical trials for other cancers) could be explored.
- Interference with Stromal Interactions: Modulating PTAFR or ITGA5 could disrupt macrophage recruitment and their interactions within the desmoplastic PDAC stroma, potentially impeding tumor growth and metastasis.
- Blockade of Immunosuppression: Targeting IL10RB could block immunosuppressive IL-10 signaling, thereby unleashing anti-tumor immunity.
- Drug Development: The identified markers provide a roadmap for developing novel macrophage-centric therapies, including antibody-drug conjugates, CAR-macrophage approaches, or small molecule inhibitors specifically designed to target these surface proteins on TAMs in PDAC.
- Patient Stratification: Characterizing the specific surface marker profiles of TAMs in individual PDAC patients could enable more precise patient stratification for clinical trials and personalized treatment strategies.
18. CD4+ T Cell Condition-Specific Surfaceome Markers in Pancreatic Adenocarcinoma
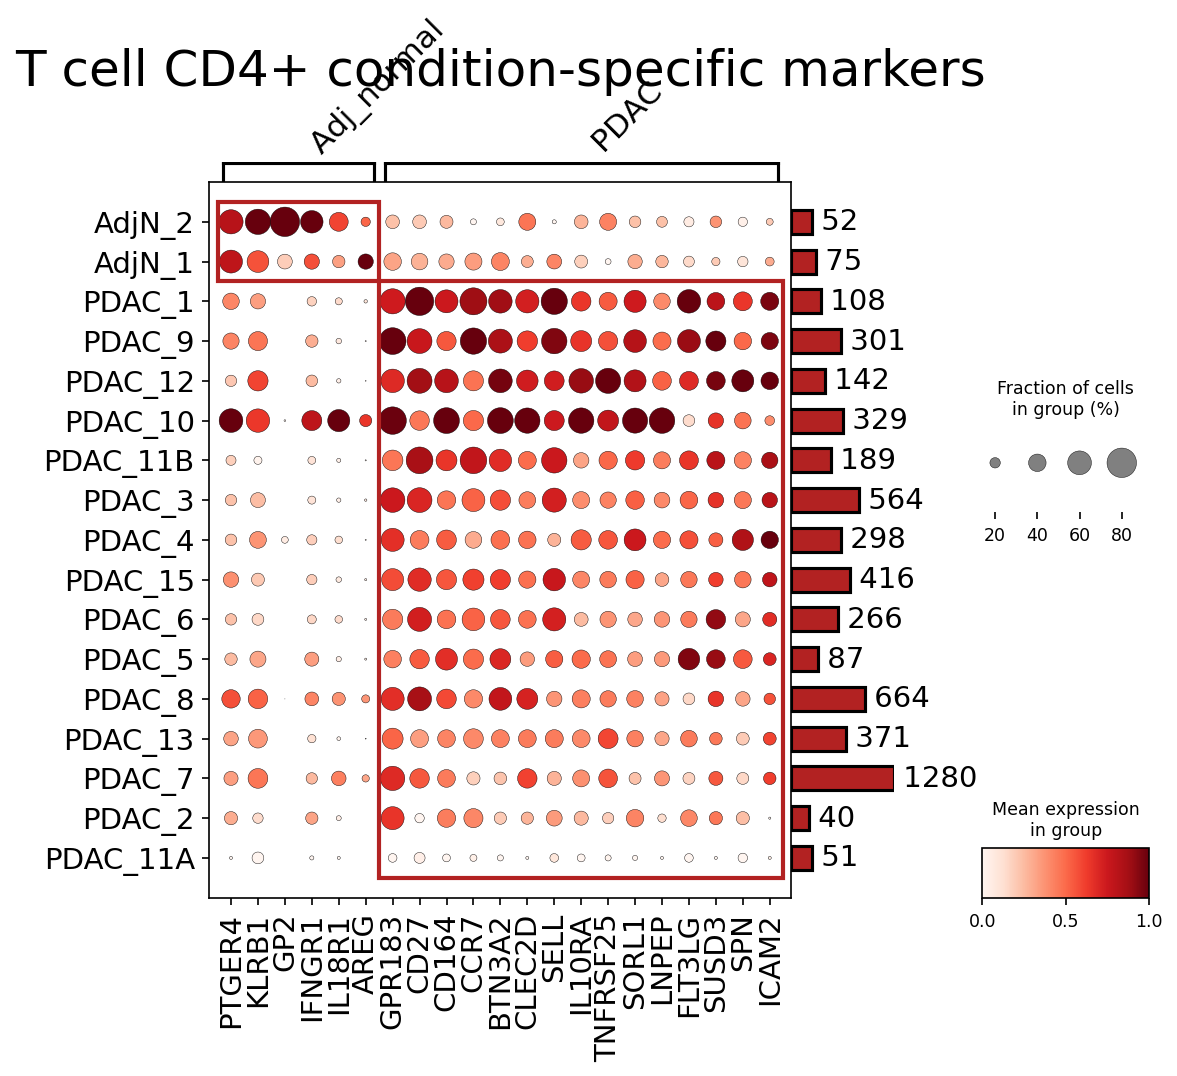
[Analysis Visualization Results]...
Analysis Overview
This analysis aimed to identify surfaceome markers that are specifically enriched in CD4+ T cells from either adjacent normal pancreatic tissue (Adj_normal) or Pancreatic Ductal Adenocarcinoma (PDAC) samples. By focusing on surfaceome markers, we identify potential targets for cell-surface-based therapies, diagnostic tools, or agents for cell isolation and phenotyping. The dot plot visualizes the expression patterns of these condition-specific markers across individual samples, grouped by condition.
Visual Summary
The dot plot displays the expression of 22 surfaceome genes across CD4+ T cells from 18 individual samples (2 Adj_normal, 16 PDAC). Each row represents a sample, and each column represents a gene.
- Dot Size: Corresponds to the fraction of cells within that sample group expressing the gene (ranging from 0% to 80%+).
- Dot Color Intensity: Represents the mean expression level of the gene within the expressing cells of that group (ranging from 0.0 to 1.0, with darker red indicating higher expression).
- Sample Grouping: Samples are clearly separated into 'Adj_normal' and 'PDAC' conditions, highlighted by the red bounding boxes.
Key observations:
- Adj_normal Specific Markers: The genes PTGER4, KLRB1, GP2, IFNGR1, IL18R1, and AREG show markedly higher expression and prevalence in CD4+ T cells from the Adj_normal samples (AdjN_1, AdjN_2) compared to PDAC samples. These genes are virtually absent or very lowly expressed in most PDAC samples.
- PDAC Specific Markers: A distinct cluster of genes, including GPR183, CD27, CD164, CCR7, BTN3A2, CLEC2D, SELL, IL10RA, TNFRSF25, SORL1, LNPEP, FLT3LG, SUSD3, SPN, and ICAM2, are predominantly expressed and upregulated in CD4+ T cells within the PDAC samples. These markers show very low or no expression in Adj_normal samples.
- Heterogeneity within PDAC: While many PDAC-specific markers are broadly expressed across most PDAC samples, there is some variability. For example, genes like FLT3LG, SUSD3, SPN, and ICAM2 show high expression in several PDAC samples but are less uniformly prevalent compared to CD27, CCR7, SELL, or IL10RA. This suggests potential subtype differences or varying immune environments within PDAC tumors.
- Number of Cells: The bar graph on the right indicates the number of CD4+ T cells identified in each sample, ranging from 40 (PDAC_2) to 1280 (PDAC_7). The markers shown are robust across samples with varying cell numbers, suggesting they are not artifacts of low cell counts.
Biological Interpretation
The distinct sets of surfaceome markers observed between Adj_normal and PDAC CD4+ T cells provide crucial insights into the altered immunological landscape in pancreatic cancer.
Markers Enriched in Adj_normal CD4+ T cells:
- KLRB1 (CD161): Often expressed on innate-like T cells (e.g., MAIT cells) and some regulatory T cells, KLRB1 can modulate T cell activation and cytokine production [GeneCards]. Its higher presence in normal tissue might reflect a quiescent or homeostatic T cell population with distinct immunoregulatory roles compared to tumor-infiltrating T cells.
- PTGER4 (EP4): A receptor for prostaglandin E2 (PGE2), which is generally immunosuppressive in tumor contexts [PubMed Search]. Its elevated expression in Adj_normal CD4+ T cells could indicate their responsiveness to PGE2 for maintaining tissue homeostasis or a distinct differentiation state.
- IFNGR1 (IFN-$\gamma$ Receptor 1) and IL18R1 (IL-18 Receptor 1): These receptors are crucial for signaling by IFN-$\gamma$ and IL-18, respectively. Both cytokines are associated with potent anti-tumor immunity and Th1 responses [GeneCards]. Their higher expression in Adj_normal T cells suggests these cells might be more poised for inflammatory, anti-pathogen, or homeostatic immune responses, which are potentially suppressed or altered in the PDAC microenvironment.
- AREG (Amphiregulin): An EGFR ligand involved in cell proliferation and tissue repair. Its role in T cells is less defined as a direct marker, but it can be produced by various immune cells and modulate the local microenvironment.
Markers Enriched in PDAC CD4+ T cells:
This cluster of markers suggests a distinct phenotype of CD4+ T cells within the PDAC tumor microenvironment, likely reflecting activation, migration, exhaustion, or immunosuppressive functions.
- CD27: A costimulatory receptor expressed on activated and memory T cells [GeneCards]. Its upregulation suggests T cell activation or memory formation within the tumor. However, sustained activation can also lead to exhaustion.
- CCR7 and SELL (CD62L): These are classical markers for naive and central memory T cells, critical for homing to secondary lymphoid organs [GeneCards]. Their strong expression in PDAC CD4+ T cells could indicate ongoing recruitment of naive/central memory cells into the tumor microenvironment or the presence of a specific migratory T cell subset within the tumor that retains these homing properties.
- IL10RA (IL-10 Receptor Subunit Alpha): The receptor for the immunosuppressive cytokine IL-10 [GeneCards]. Its high expression on PDAC CD4+ T cells implies that these cells are highly susceptible to IL-10-mediated suppression, contributing to the immune evasion characteristic of PDAC. This is a critical observation for understanding tumor-induced immunosuppression.
- TNFRSF25 (Death Receptor 3, DR3): Part of the TNF receptor superfamily, involved in T cell activation and survival [GeneCards]. Its role in cancer is complex, potentially contributing to both anti-tumor and pro-tumor immunity depending on the context.
- ICAM2 (CD102): An adhesion molecule involved in leukocyte adhesion and transmigration [GeneCards]. Its upregulation could facilitate the interaction of CD4+ T cells with other cells (e.g., endothelial cells, tumor cells, antigen-presenting cells) within the tumor microenvironment.
- GPR183 (EBI2): A chemokine-like receptor involved in guiding B and T cells to specific lymphoid niches [GeneCards]. Its expression could indicate specific migratory patterns or localization of CD4+ T cells within the PDAC TME, potentially towards tertiary lymphoid structures.
- CD164 (Endolyn): A sialomucin involved in cell adhesion and migration [GeneCards]. Its role in T cells is less characterized but suggests altered adhesive properties in the tumor context.
- CLEC2D (LLT1): A C-type lectin that can inhibit NK cell function by binding to NKR-P1A [GeneCards]. Its expression on CD4+ T cells, if functional, could imply an additional mechanism for immune modulation within the tumor.
Collectively, the PDAC-specific markers suggest a population of CD4+ T cells that are actively recruited, potentially activated, but also prone to immunosuppression (e.g., via IL10RA) and engaged in complex adhesive and migratory processes within the tumor. The low expression of IFNGR1 and IL18R1 in PDAC CD4+ T cells further supports a shift away from a robust inflammatory Th1 response.
Clinical or Translational Implications
The identified condition-specific surfaceome markers for CD4+ T cells hold significant clinical and translational potential in the context of PDAC:
- Diagnostic and Prognostic Biomarkers: The distinct expression profiles could serve as biomarkers for distinguishing between normal and malignant pancreatic tissue. For instance, assessing the relative abundance of KLRB1+/IL18R1+ CD4+ T cells versus IL10RA+/CCR7+ CD4+ T cells could provide diagnostic or prognostic information from liquid biopsies or tissue samples.
- Therapeutic Targets:
- Immunosuppression Reversal: The high expression of IL10RA on PDAC CD4+ T cells makes it a compelling therapeutic target. Blocking IL-10 signaling could potentially reverse T cell anergy or exhaustion and unleash anti-tumor immunity in PDAC.
- T Cell Modulation: Other markers like CD27, CCR7, SELL, and TNFRSF25 represent potential targets to modulate the activation, migration, or survival of tumor-infiltrating CD4+ T cells. For example, strategies to enhance activation via CD27 or redirect T cell trafficking could be explored.
- Cell-Cell Interaction Modulation: Genes like ICAM2 and CD164 are involved in cell adhesion. Modulating these interactions could affect T cell infiltration, retention, or interaction with tumor cells and other immune cells, which is highly relevant given the uns['CCI'] data indicating altered cell-cell interactions in PDAC.
- Phenotyping and Isolation: These markers can be used to precisely phenotype and isolate distinct CD4+ T cell subsets from PDAC patients, enabling deeper functional studies and identification of specific cellular states associated with disease progression or response to therapy.
- Experimental Validation: Further studies could validate the functional roles of these markers. For example, in vitro experiments could investigate the impact of IL-10 on IL10RA-expressing PDAC CD4+ T cells, or in vivo models could test the efficacy of blocking antibodies against specific PDAC-enriched surface markers to enhance anti-tumor immunity.
19. Ductal Cell Cycle Gene Dysregulation in Pancreatic Ductal Adenocarcinoma (PDAC)
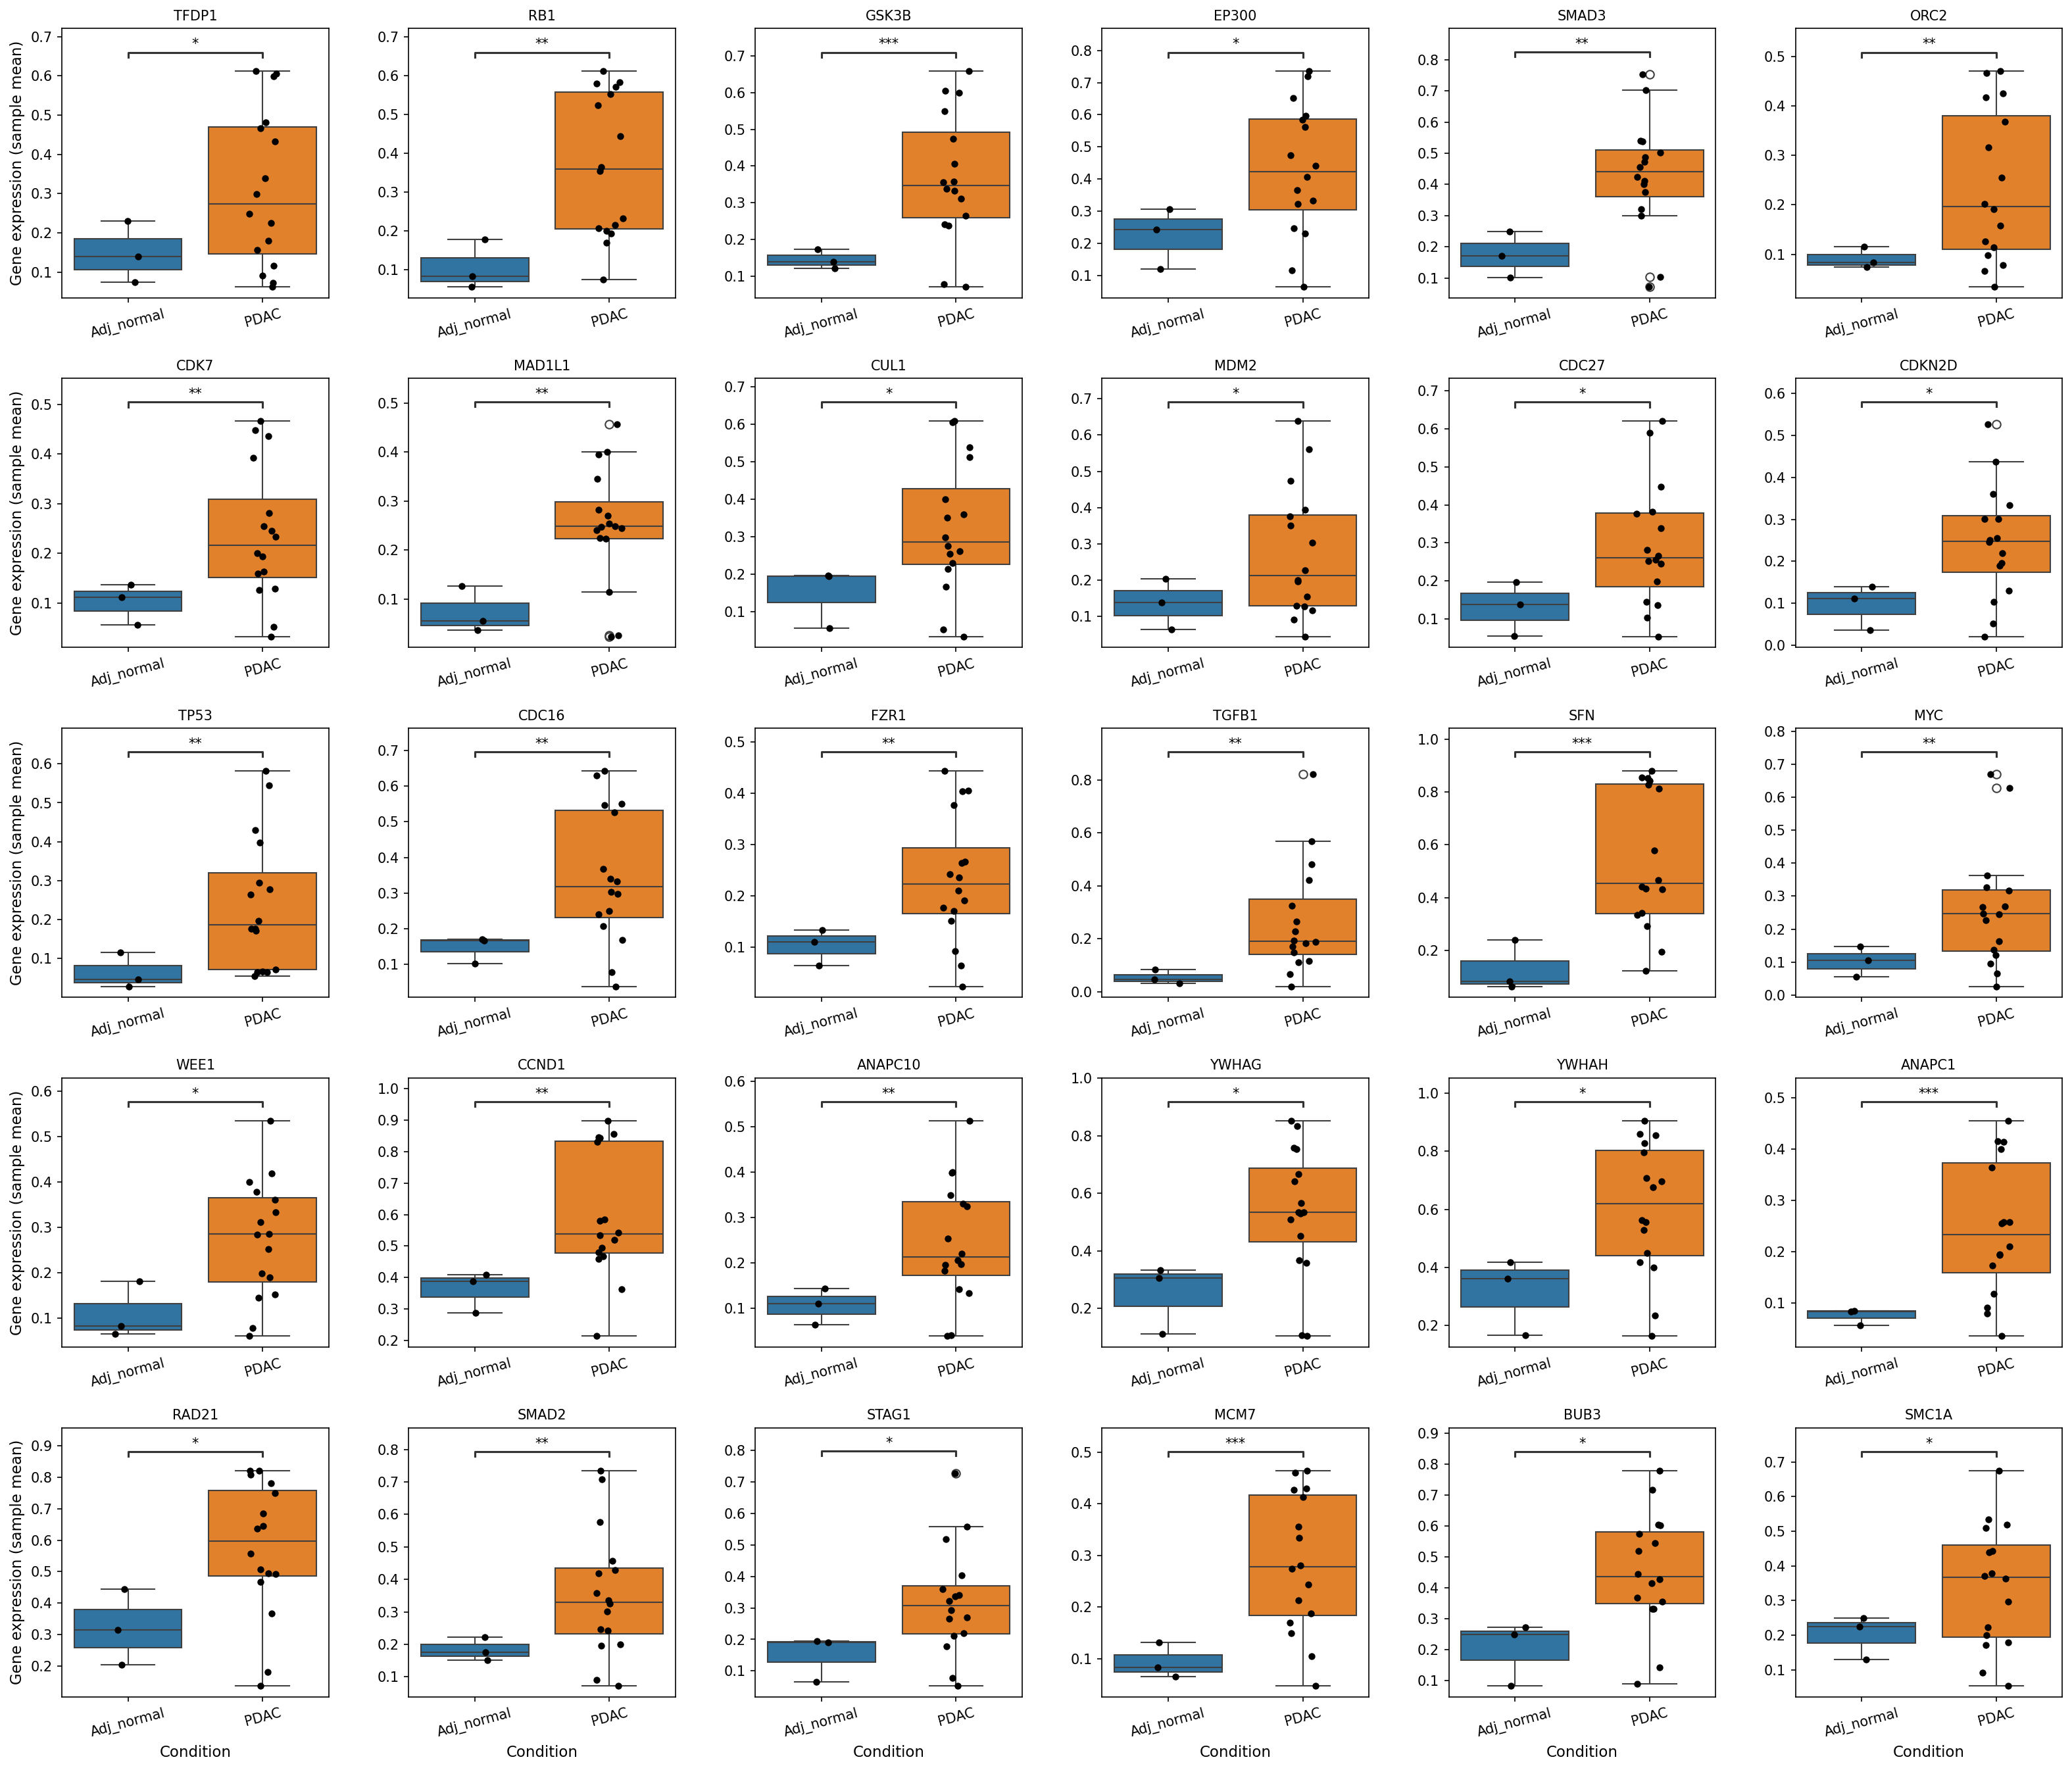
[Analysis Visualization Results]...
Analysis Overview
This analysis investigates the differential expression of a panel of cell cycle pathway-related genes in Ductal cells from Pancreatic Ductal Adenocarcinoma (PDAC) tissue compared to adjacent normal pancreas (Adj_normal) tissue. Ductal cells are the identified tumor origin cell type in this dataset. The plot_box_for_gene_expression_with_signif_difference tool was used to visualize gene expression distributions and statistical significance, focusing on genes with a p-value less than 0.1 and a log2 fold change greater than 0.1. A total of 24 statistically significant genes are presented.
Visual Summary
The boxplots clearly illustrate significant differences in gene expression for all 24 selected cell cycle-related genes between the Adj_normal and PDAC conditions within Ductal cells.
- Consistent Upregulation in PDAC: Across all plotted genes, Ductal cells from PDAC samples (orange boxes) exhibit markedly higher gene expression levels compared to Ductal cells from Adj_normal samples (blue boxes). This consistent pattern strongly indicates an activated proliferative state in PDAC Ductal cells.
- Statistical Significance: Each gene displayed a statistically significant difference, with p-values ranging from * (p < 0.1) to *** (p < 0.001), underscoring the robustness of these observed changes.
- Expression Distribution: While the median expression is consistently higher in PDAC, the spread of expression values (interquartile range and whiskers) also tends to be wider in PDAC samples for many genes, suggesting greater heterogeneity in cell cycle activity or cell states within the tumor microenvironment compared to the more quiescent adjacent normal tissue.
- Individual Data Points (Stripplot): The individual data points overlaid on the boxplots, representing sample mean expression, visually confirm the higher values in PDAC and contribute to understanding the variability across samples.
Biological Interpretation
The observed widespread upregulation of cell cycle pathway genes in Ductal cells from PDAC tissue provides compelling evidence for enhanced cellular proliferation, a hallmark of cancer. This finding is highly consistent with the malignant nature of PDAC, which is characterized by uncontrolled cell division and growth.
Key biological insights derived from the specific genes include:
- Accelerated Cell Cycle Progression: The upregulation of genes like CDK7 (a cell cycle-regulating kinase), CCND1 (Cyclin D1, crucial for G1-S phase transition) [UniProt: P24386], ORC2 and MCM7 (components of the origin recognition complex and minichromosome maintenance complex, essential for DNA replication initiation) [GeneCards: ORC2, MCM7], directly points to a hyperactive cell cycle. These genes collectively drive cells through the G1, S, and G2/M phases more rapidly.
- Dysregulation of Cell Cycle Checkpoints and DNA Damage Response: Genes such as WEE1 (a kinase that inhibits CDK1 to prevent premature mitosis) [UniProt: P30291], MAD1L1, and BUB3 (components of the spindle assembly checkpoint, ensuring proper chromosome segregation) [GeneCards: MAD1L1, BUB3], are also significantly upregulated. While these genes typically act as brakes to ensure genomic integrity, their increased expression in rapidly dividing cancer cells can represent a compensatory mechanism to cope with replication stress and genomic instability, or an overdriven regulatory circuit within the proliferative context. The upregulation of TP53 and MDM2 suggests a perturbed TP53 pathway; while TP53 is a tumor suppressor, its expression can increase in response to oncogenic stress or be stabilized if mutated, and MDM2 often acts to degrade TP53, implying an active, albeit possibly dysfunctional, regulation.
- Transcriptional Activation of Proliferation Programs: The upregulation of TFDP1 (a dimerization partner for E2F transcription factors, which activate genes required for cell cycle progression) [GeneCards: TFDP1], EP300 (a histone acetyltransferase that functions as a transcriptional coactivator) [UniProt: Q09472], and MYC (a potent proto-oncogene driving cell growth and division) [PubMed search: MYC oncogene cancer], signifies an enhanced transcriptional program geared towards sustaining rapid proliferation.
- Altered TGF-beta Signaling: Upregulation of TGFB1 and SMAD2 (components of the TGF-beta signaling pathway) [GeneCards: TGFB1, SMAD2] in PDAC Ductal cells is noteworthy. TGF-beta typically acts as a tumor suppressor in early stages, but in advanced cancers like PDAC, it often switches roles to promote tumor progression, metastasis, and immune evasion. The increased expression here could reflect its pro-tumorigenic functions.
- Chromosome Dynamics and Integrity: Genes like RAD21, SMC1A, and STAG1 are core components of the cohesin complex, essential for sister chromatid cohesion during cell division and DNA repair. Their upregulation indicates active chromosome dynamics associated with high proliferative rates, which aligns with the known prevalence of aneuploidy in PDAC (as indicated by the ploidy_dec annotation in the AnnData).
- Ubiquitin-Proteasome System in Cell Cycle Control: Upregulation of CUL1 (a scaffold protein for E3 ubiquitin ligases) [UniProt: Q13616], FZR1 (CDH1, an activator of the anaphase-promoting complex/cyclosome, APC/C), and components of the APC/C itself (ANAPC1, ANAPC10, CDC16, CDC27) points to active protein degradation machinery involved in regulating cell cycle transitions, particularly mitotic exit and G1 entry. This machinery is often exploited or overactivated in cancer to facilitate rapid and uncontrolled cell division.
Clinical or Translational Implications
The pervasive upregulation of cell cycle genes in PDAC Ductal cells has several important clinical and translational implications:
- Biomarker Potential: The consistently elevated expression of these cell cycle genes in Ductal cells could serve as diagnostic or prognostic biomarkers for PDAC. Detecting high levels of these specific transcripts in patient samples (e.g., liquid biopsies, tissue biopsies) could help identify malignancy, track disease progression, or predict patient outcomes.
- Therapeutic Targets: The identified genes represent a rich set of potential therapeutic targets. Inhibitors against key cell cycle drivers such as CDKs (e.g., CDK7 inhibitors), DNA replication machinery (e.g., MCM7 inhibitors), or proteins involved in cell cycle checkpoints (e.g., WEE1 inhibitors) could be effective in halting the uncontrolled proliferation of PDAC cells. Targeting the ubiquitin-proteasome system components (e.g., CUL1, FZR1, ANAPC subunits) could also disrupt the delicate balance of protein degradation essential for rapid cancer cell division.
- Understanding Disease Progression: The comprehensive activation of the cell cycle machinery in the tumor-originating Ductal cells underscores the fundamental role of unchecked proliferation in PDAC pathogenesis. This deepens our understanding of the molecular mechanisms driving this aggressive cancer, particularly in the context of ploidy_dec which shows a presence of aneuploid cells. The high expression of cohesin complex components (RAD21, SMC1A, STAG1) further supports active genome duplication and division, which, if error-prone, contributes to the observed aneuploidy in PDAC.
- Personalized Medicine: Identifying the specific cell cycle genes that are most highly dysregulated in an individual patient's tumor could guide personalized therapeutic strategies, ensuring treatments are tailored to the unique molecular landscape of their cancer.
20. Gene Ontology (GSA) Analysis of Ductal Cells in Pancreatic Conditions
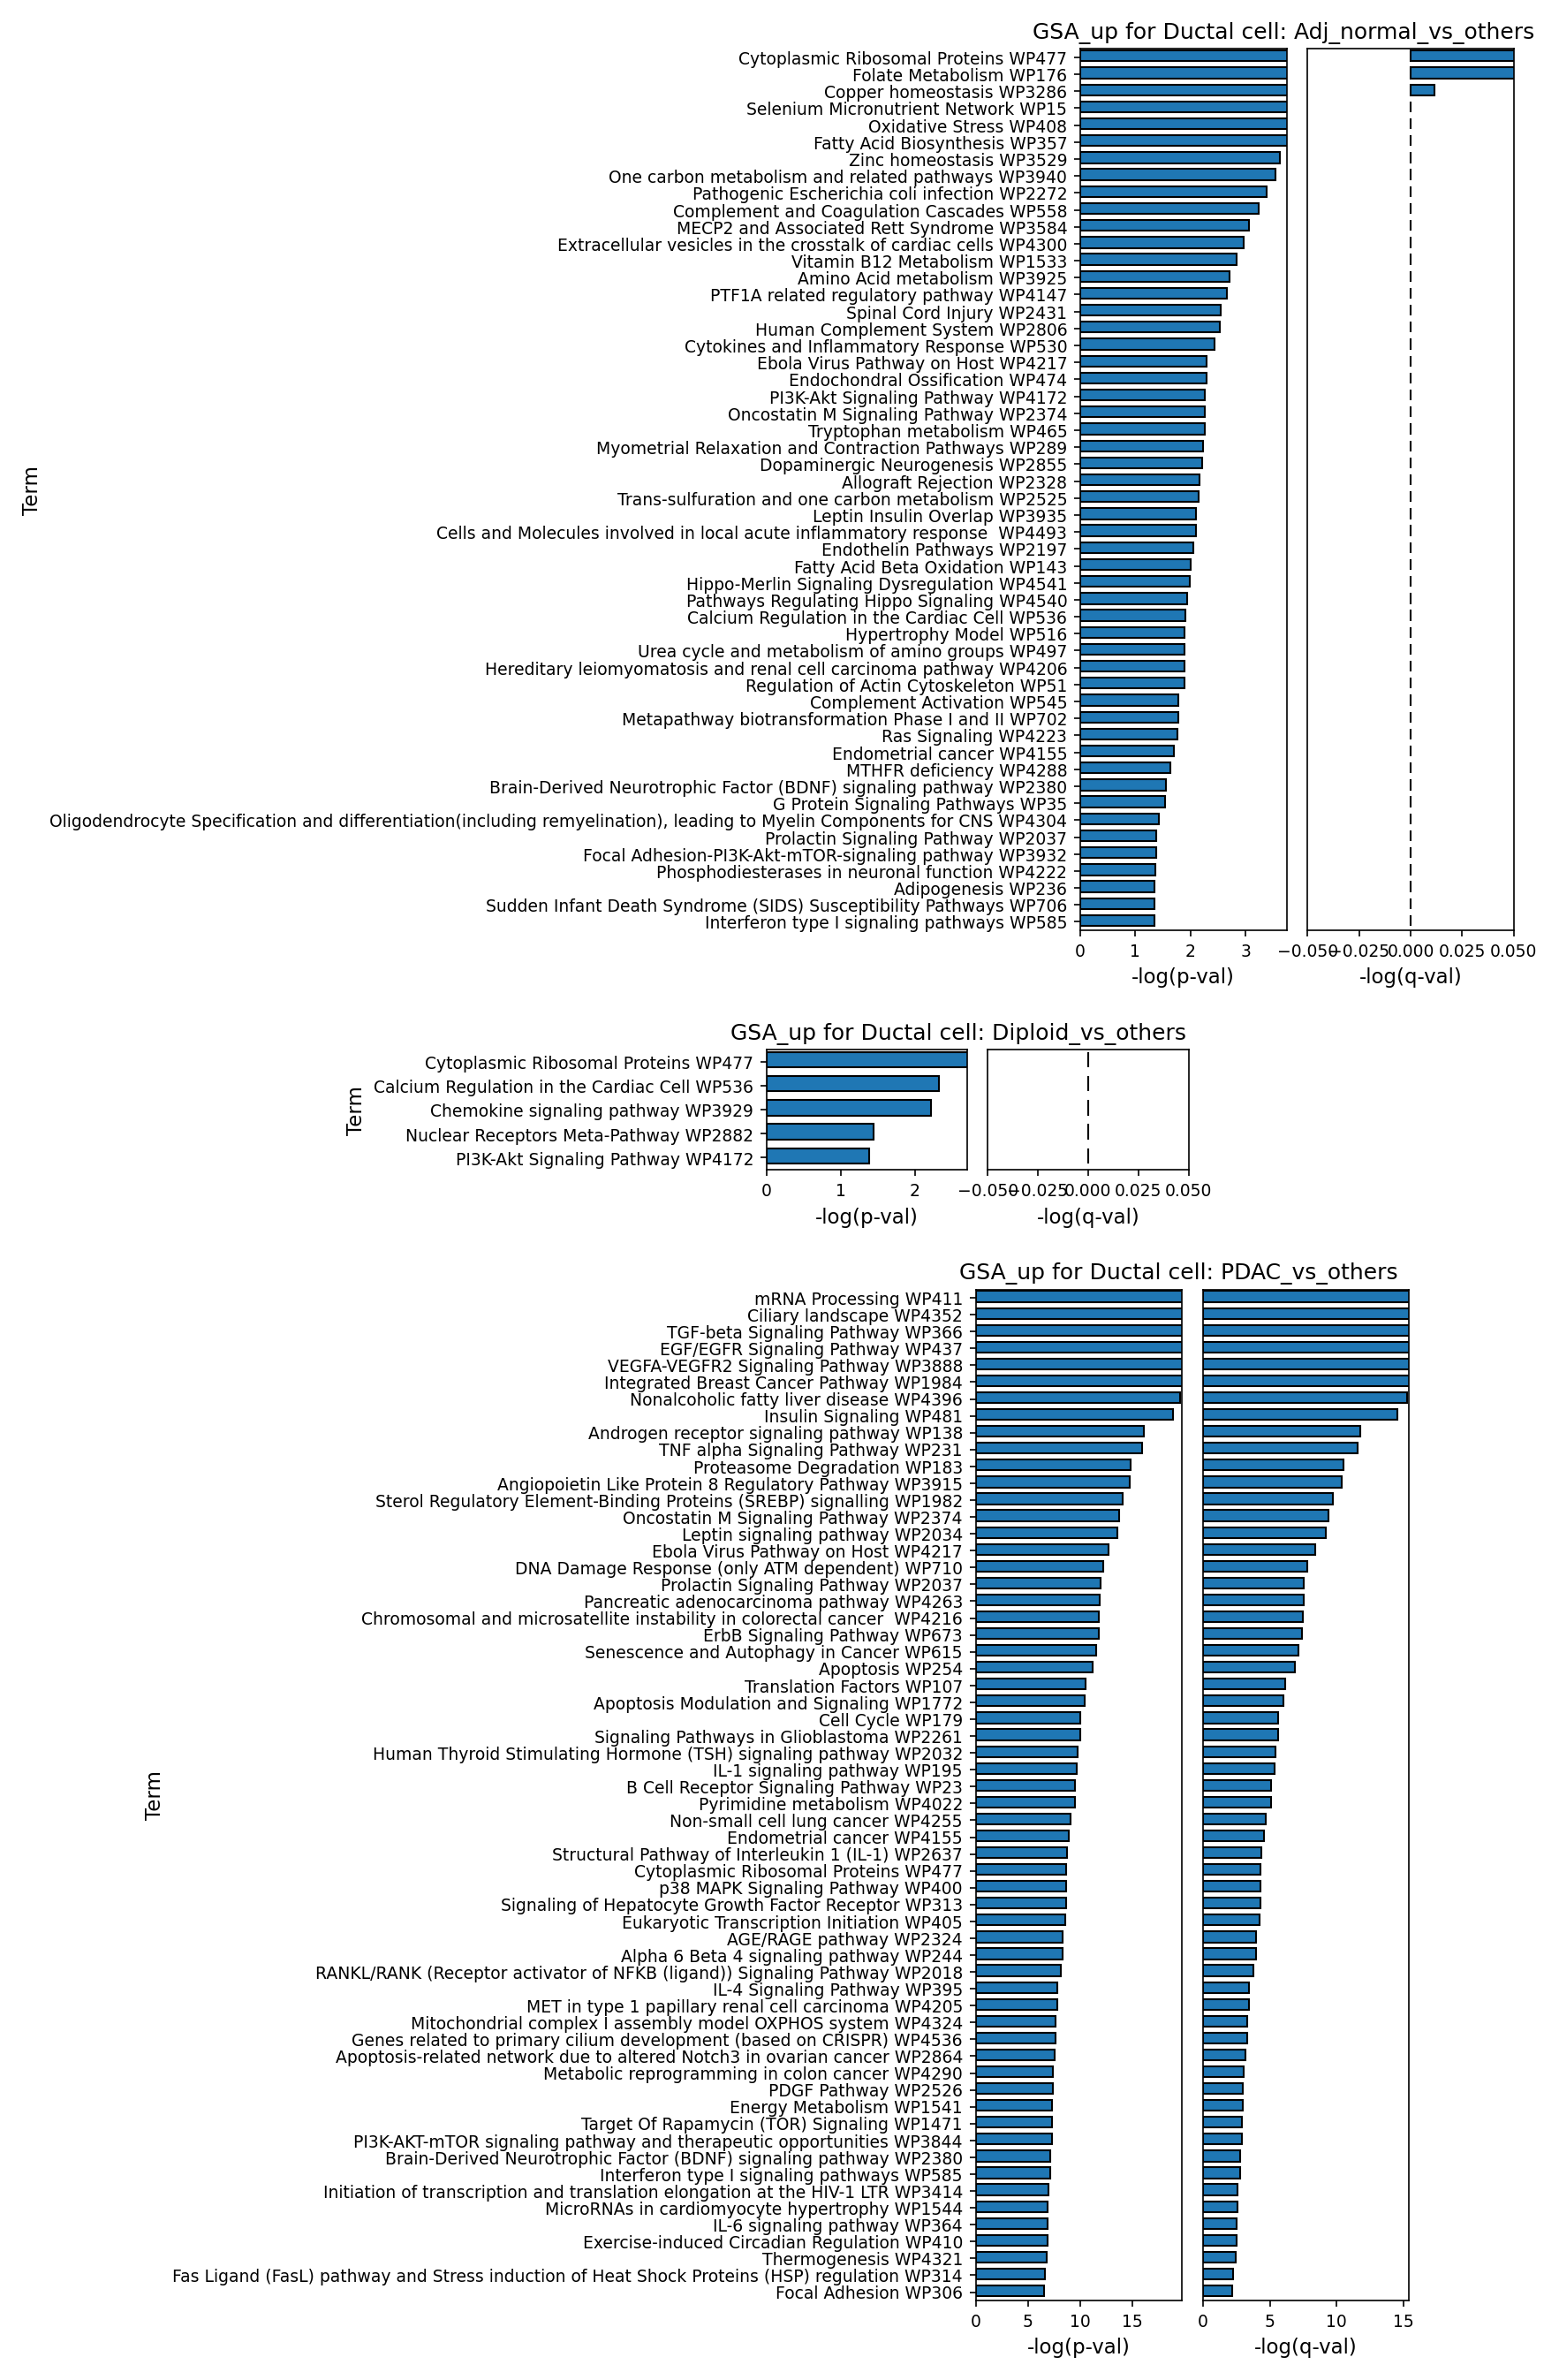
[Analysis Visualization Results]...
Analysis Overview
This analysis presents Gene Ontology (GO) pathway enrichment results (Gene Set Analysis, GSA) for Ductal cells, which are identified as the tumor-origin cell type in pancreatic ductal adenocarcinoma (PDAC). The GSA was performed to identify pathways significantly upregulated ("GSA_up") in Ductal cells under three distinct comparisons:
- Adj_normal_vs_others: Ductal cells from adjacent normal pancreatic tissue compared to Ductal cells from PDAC tissue. This highlights pathways enriched in normal Ductal cells.
- Diploid_vs_others: Diploid Ductal cells compared to Aneuploid Ductal cells. This focuses on differences related to chromosomal stability.
- PDAC_vs_others: Ductal cells from PDAC tissue compared to Ductal cells from adjacent normal pancreatic tissue. This reveals pathways significantly activated in PDAC Ductal cells, providing insights into tumor biology.
The results are displayed as bar plots, where each bar represents an enriched GO term (pathway), ordered by -log(p-val), and -log(q-val) (FDR-adjusted p-value) is also shown to indicate the statistical significance of the enrichment.
Visual Summary
The three bar plots effectively visualize the most significantly enriched "up" pathways in Ductal cells for each comparison.
- Adj_normal_vs_others: This plot displays a substantial number of significantly upregulated pathways (over 50 terms shown), many with -log(p-val) exceeding 2.5 and -log(q-val) typically below 0.01. The enriched terms reflect a variety of fundamental cellular processes.
- Diploid_vs_others: This comparison shows far fewer significantly enriched pathways (only 5 terms displayed), with lower -log(p-val) values compared to the other two plots. This suggests that the transcriptional differences primarily driven by ploidy status (Diploid vs. Aneuploid) within Ductal cells are less extensive or less statistically robust at the pathway level than those driven by disease condition.
- PDAC_vs_others: This plot demonstrates the most striking enrichment, with numerous pathways showing very high -log(p-val) and -log(q-val) values (many exceeding 15). This indicates a profound and widespread transcriptional reprogramming in Ductal cells from PDAC tissue, reflecting the complex biology of pancreatic cancer.
Biological Interpretation
Pathways Enriched in Normal Ductal Cells (Adj_normal_vs_others)
Ductal cells from adjacent normal tissue primarily show enrichment for pathways associated with basic cellular maintenance, metabolism, and homeostatic processes. Key enriched terms include:
- Cytoplasmic Ribosomal Proteins (WP477): Indicating active protein synthesis, essential for normal cell growth and function.
- Folate Metabolism (WP176) & One Carbon Metabolism (WP3940): Crucial for nucleotide synthesis, amino acid metabolism, and methylation, supporting cell division and repair.
- Selenium Micronutrient Network (WP818) and Oxidative Stress Pathway (WP3904): Reflecting active antioxidant defense mechanisms, vital for protecting cells from damage.
- Fatty Acid Biosynthesis (WP3529): Important for membrane synthesis and energy storage.
- PI3K-Akt Signaling Pathway (WP4172): While often deregulated in cancer, this pathway is fundamental for normal cell growth, survival, and metabolism.
- Regulation of Actin Cytoskeleton (WP51): Essential for cell shape, migration, and adhesion in healthy tissues.
Many other general metabolic and signaling pathways are also active, reflecting the diverse functions of healthy pancreatic ductal cells.
Pathways Enriched in Diploid Ductal Cells (Diploid_vs_others)
The limited number of significantly enriched pathways in Diploid Ductal cells compared to Aneuploid Ductal cells suggests that while ploidy is a critical genomic feature, its direct and generalizable impact on *upregulated* GO pathways across all Ductal cells may be subtler or more context-dependent. The few enriched pathways are:
- Cytoplasmic Ribosomal Proteins (WP477): Again, emphasizing active protein synthesis in these presumably less transformed cells.
- Calcium Regulation in the Cardiac Cell (WP536): Calcium signaling is a universal regulator of various cell processes.
- Chemokine Signaling Pathway (WP3929): Involved in cell migration and immune responses, which might be critical for maintaining tissue homeostasis or responding to local cues.
- Nuclear Receptors Meta-Pathway (WP2882): Implies active regulation of gene expression, metabolism, and development by nuclear receptors.
- PI3K-Akt Signaling Pathway (WP4172): As seen in normal cells, this pathway maintains baseline cellular functions.
Pathways Enriched in PDAC Ductal Cells (PDAC_vs_others)
The GSA results for PDAC Ductal cells reveal a comprehensive landscape of pathways associated with cancer development and progression, characterized by high significance and a broad range of biological functions. Key categories of enriched pathways include:
Proliferation and Survival Signaling
- TGF-beta Signaling Pathway (WP366): A potent mediator of tumor progression in PDAC, promoting epithelial-mesenchymal transition (EMT), fibrosis, and immune suppression PubMed search: TGF-beta signaling pancreatic cancer progression.
- VEGF/VEGFR Signaling Pathway (WP3968): Crucial for angiogenesis, supporting tumor growth and metastasis PubMed search: VEGF VEGFR signaling pancreatic cancer angiogenesis.
- ErbB Signaling Pathway (WP463): Includes EGFR signaling, a major driver of cell proliferation and survival in many cancers, including PDAC PubMed search: ErbB EGFR signaling pancreatic cancer.
- PI3K-Akt-mTOR Signaling Pathways (WP4172, WP3868): Central to cell growth, proliferation, metabolism, and survival, frequently hyperactivated in PDAC PubMed search: PI3K AKT mTOR pancreatic cancer.
- Ras Signaling Pathway (WP2490): A fundamental oncogenic pathway, often mutated in PDAC (e.g., KRAS) and driving many downstream effects UniProt: P01116 (KRAS).
- Cell Cycle (WP772): Reflecting uncontrolled cell division and proliferation, a hallmark of cancer.
Metabolic Reprogramming
- Nonalcoholic Fatty Liver Disease (WP1984), Insulin Signaling (WP381), Sterol Regulatory Element-Binding Protein (SREBP) Pathway (WP144): These point to altered lipid and glucose metabolism, characteristic of the Warburg effect and other metabolic adaptations in cancer cells to fuel rapid growth PubMed search: pancreatic cancer metabolism Warburg effect.
Inflammation and Immune Modulation
- TNF Alpha Signaling Pathway (WP231), IL-1 Signaling Pathway (WP3922), NF-κB Signaling Pathway (WP405): Indicate chronic inflammation, which can promote tumor growth, survival, and immunosuppression within the tumor microenvironment PubMed search: NF-kB signaling pancreatic cancer inflammation.
- B Cell Receptor Signaling Pathway (WP1955): Suggests potential interactions with B cells in the tumor microenvironment, which can play complex pro- or anti-tumor roles.
- Interferon Type I Signaling Pathways (WP585): Can be activated in response to viral infection or cellular stress, potentially modulating anti-tumor immunity.
DNA Damage, Apoptosis, and Stress Response
- DNA Damage Response (WP710), Apoptosis (WP27), Senescence and Autophagy (WP63): These pathways are often dysregulated in cancer, enabling cells to evade programmed cell death and survive genotoxic stress.
Other Cancer-Associated Pathways
- Several pathways named after other cancers (e.g., Integrated Breast Cancer, Endometrial Cancer, Non-small Cell Lung Cancer) appear, indicating shared oncogenic mechanisms across different tumor types.
- Focal Adhesion (WP306): Crucial for cell adhesion, migration, and invasion, processes essential for metastasis.
Clinical or Translational Implications
The robust enrichment of multiple well-established oncogenic pathways in PDAC Ductal cells provides strong biological rationale for targeted therapeutic strategies.
- Targeting Growth and Survival: The prominent activation of TGF-beta, VEGF/VEGFR, ErbB (EGFR), PI3K-Akt-mTOR, and Ras signaling pathways suggests that inhibitors against these pathways could be highly relevant for treating PDAC. Many such inhibitors are already in clinical development or approved for other cancers, and their efficacy in PDAC warrants continued investigation or repositioning PubMed search: targeted therapy pancreatic cancer.
- Metabolic Intervention: The dysregulation of insulin signaling and lipid metabolism pathways highlights the potential for metabolic inhibitors to starve tumor cells or alter their microenvironment, complementing conventional chemotherapy.
- Modulating Inflammation: The strong activation of TNF alpha, IL-1, and NF-κB signaling pathways indicates that anti-inflammatory strategies or immunomodulatory approaches could reduce tumor-promoting inflammation and enhance anti-tumor immunity.
- Monitoring Genomic Instability: While not directly shown in these "up" pathways, the comparison with Diploid cells and the presence of DNA Damage Response pathways highlight the importance of understanding genomic instability in PDAC.
- Biomarker Discovery: The identified highly enriched pathways and their constituent genes could serve as potential biomarkers for diagnosis, prognosis, or prediction of therapeutic response in PDAC patients.
These findings underscore the complex molecular reprogramming of Ductal cells during PDAC development, offering multiple avenues for therapeutic intervention aimed at key drivers of the disease.
21. Gene Set Enrichment Analysis (GSEA) of Ductal Cells, Macrophages, and CD4+ T Cells in Pancreatic Tissue
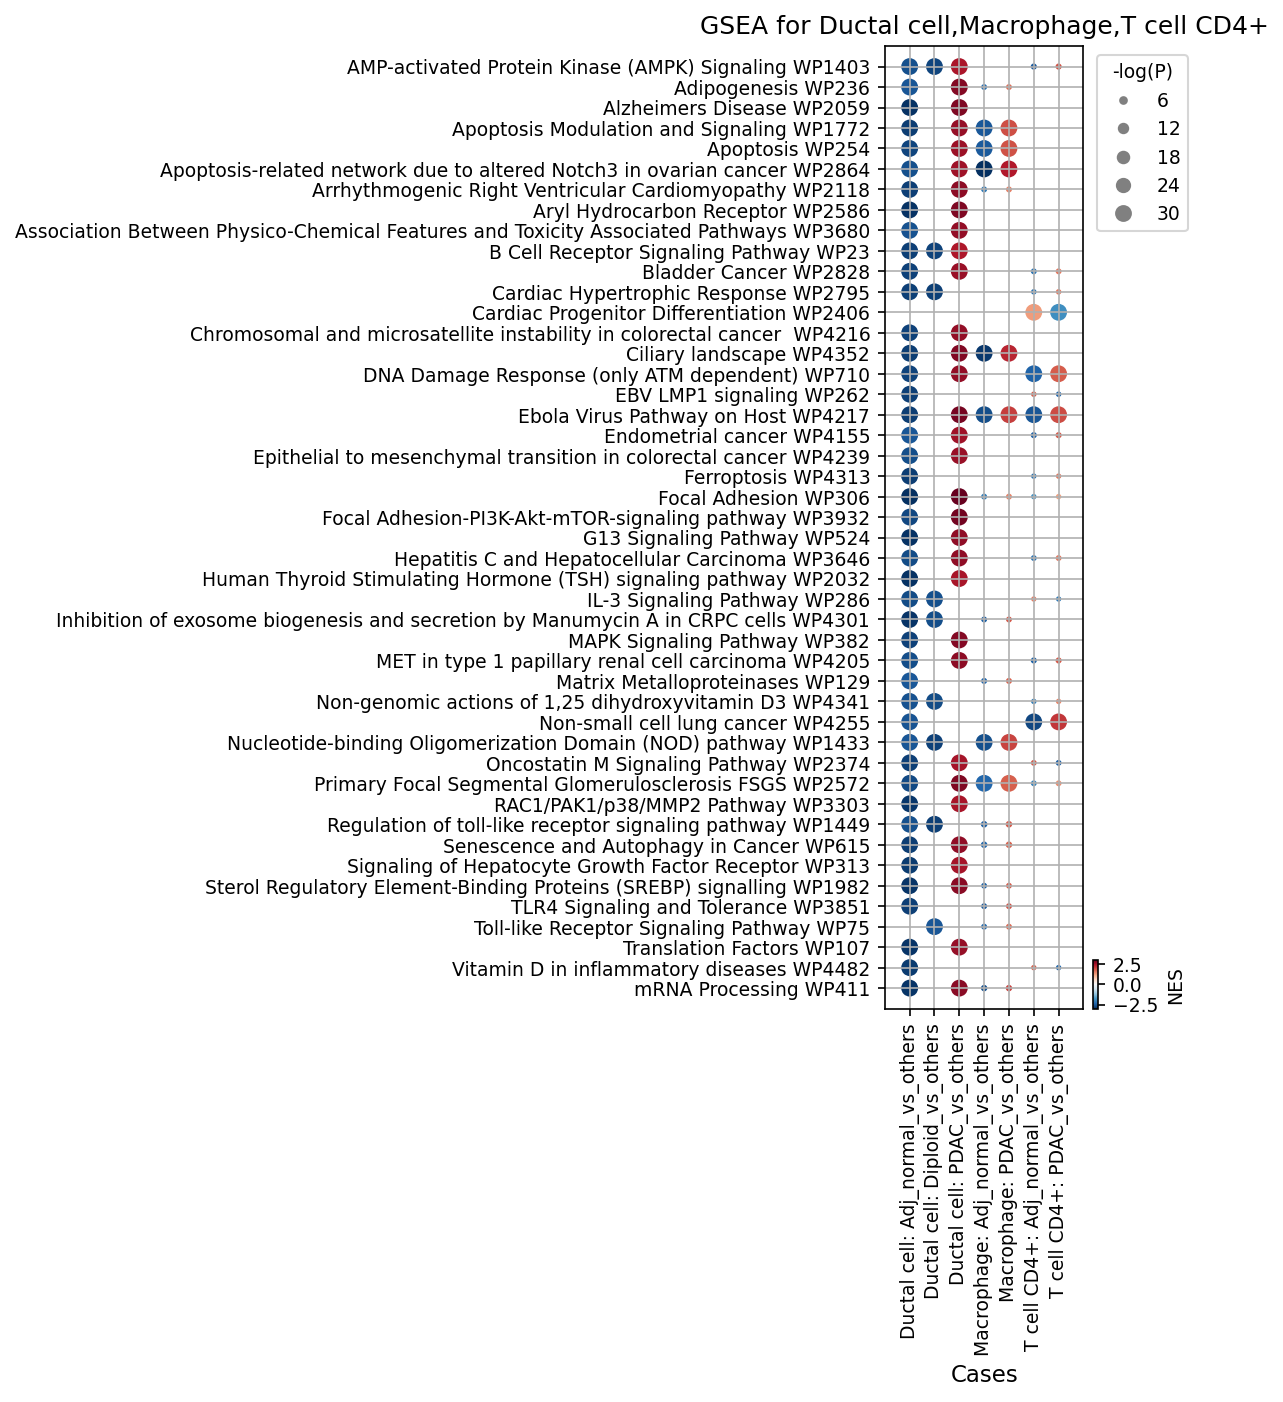
[Analysis Visualization Results]...
Analysis Overview
This analysis presents Gene Set Enrichment Analysis (GSEA) results for three key cell types—Ductal cells (the presumed origin of PDAC), Macrophages (innate immune cells), and CD4+ T cells (adaptive immune cells)—within the pancreas. The results compare these cell types under different conditions: Adj_normal (adjacent normal tissue), PDAC (pancreatic ductal adenocarcinoma tissue), and Diploid (specifically for ductal cells, comparing diploid cells against other ductal cells, likely aneuploid). The dot plot visualizes the Normalized Enrichment Score (NES) using color (red for positive enrichment, blue for negative enrichment) and the significance (-log(p-value)) using dot size. These comparisons help elucidate pathway activities distinguishing healthy tissue from tumor, and how different cell populations within the tumor microenvironment are transcriptionally reprogrammed.
Visual Summary
The dot plot effectively displays the enrichment patterns of 80 selected gene sets (pathways) across seven different comparisons. Each row represents a pathway, and each column represents a specific cell type and comparison (e.g., "Ductal cell: Adj_normal vs_others").
- Dot Color: Varies along a RdBu_r color map. Red dots indicate pathways that are positively enriched (upregulated) in the *test* condition compared to the *reference/other* condition. Blue dots indicate pathways that are negatively enriched (downregulated) in the test condition (meaning they are upregulated in the reference/other condition).
- Dot Size: Corresponds to the -log(p-value) of enrichment. Larger dots represent more statistically significant enrichments.
- Overall Pattern: Distinct clusters of red and blue dots are visible, indicating significant and differential pathway activities across the various cell types and conditions, particularly between Adj_normal and PDAC contexts. There's a notable mirror-like pattern between 'Adj_normal vs_others' and 'PDAC vs_others' comparisons for each cell type, as expected.
Biological Interpretation
Ductal Cell Changes in PDAC and Ploidy Status
Ductal cells are the tumor-originating cell type in PDAC.
PDAC vs. Adjacent Normal Ductal Cells:
- Upregulated in PDAC Ductal Cells (red dots in 'Ductal cell: PDAC vs_others' / blue dots in 'Ductal cell: Adj_normal vs_others'): Pathways associated with cancer hallmarks are highly enriched. These include "Apoptosis Modulation and Signaling" (suggesting dysregulation leading to cell survival), "Epithelial to mesenchymal transition (EMT)" (linked to invasion and metastasis), "Chromosomal and microsatellite instability" (genomic instability), "Ferroptosis" (a form of regulated cell death, often manipulated in cancer), "Oncostatin M Signaling Pathway" (involved in inflammation and fibrosis), "IL-3 Signaling Pathway", "G13 Signaling Pathway", "MET in type 1 papillary renal cell carcinoma", "Nucleotide-binding Oligomerization Domain (NOD) pathway", and "RAC1/PAK1/p38/MMP2 Pathway". These pathways collectively indicate increased proliferation, survival advantage, metastatic potential, and altered immune signaling in cancerous ductal cells.
- Downregulated in PDAC Ductal Cells (blue dots in 'Ductal cell: PDAC vs_others' / red dots in 'Ductal cell: Adj_normal vs_others'): Pathways such as "AMP-activated Protein Kinase (AMPK) Signaling Pathway" (a key energy sensor often associated with tumor suppression), "DNA Damage Response (only ATM dependent)", "Focal Adhesion" and "Focal Adhesion-PI3K-Akt-mTOR-signaling pathway" (critical for cell-matrix interactions and growth), "Regulation of toll-like receptor signaling pathway", "TLR4 Signaling and Tolerance", "Vitamin D in inflammatory diseases", "mRNA Processing", and "Matrix Metalloproteinases" are less active. This suggests a loss of normal cellular control, altered metabolic regulation, and changes in the extracellular matrix (ECM) interactions in malignant ductal cells.
- Diploid vs. Other Ductal Cells: The pathway enrichment profile for "Ductal cell: Diploid vs_others" closely resembles "Ductal cell: Adj_normal vs_others". Pathways like AMPK Signaling, DNA Damage Response, Focal Adhesion, and TLR4 Signaling are enriched in Diploid Ductal cells, while cancer-associated pathways like Apoptosis Modulation, EMT, Chromosomal Instability, and Oncostatin M Signaling are depleted. This suggests that diploid ductal cells, even within the context of tumor samples, retain a molecular signature closer to normal ductal cells and may represent a less transformed or earlier-stage subpopulation, or cells that have not fully undergone the extensive genomic changes often associated with aneuploidy in cancer.
Macrophage Reprogramming in the PDAC Microenvironment
Macrophages are critical immune cells highly plastic in the tumor microenvironment (TAMs).
PDAC vs. Adjacent Normal Macrophages:
- Upregulated in PDAC Macrophages: Similar to PDAC ductal cells, PDAC-associated macrophages show enrichment for "Apoptosis Modulation and Signaling" (suggesting altered survival), "Oncostatin M Signaling Pathway", "Epithelial to mesenchymal transition", "Chromosomal and microsatellite instability" (these might reflect altered macrophage plasticity or response to tumor signals), "Ferroptosis", "G13 Signaling Pathway", "IL-3 Signaling Pathway", "MET in type 1 papillary renal cell carcinoma", "Nucleotide-binding Oligomerization Domain (NOD) pathway", "RAC1/PAK1/p38/MMP2 Pathway", and notably, "Sterol Regulatory Element-Binding Proteins (SREBP) signalling". The enrichment of SREBP signaling points to significant metabolic reprogramming, especially in lipid metabolism, which is a known characteristic of pro-tumorigenic TAMs [1]. The overlap with pathways enriched in tumor ductal cells suggests a coordinated pro-tumorigenic microenvironment.
- Downregulated in PDAC Macrophages: "Toll-like Receptor Signaling Pathway" and "TLR4 Signaling and Tolerance" are depleted, suggesting a suppression of innate immune responses typically mediated by TLRs in normal conditions.
CD4+ T Cell Dysfunction in PDAC
CD4+ T cells play diverse roles in adaptive immunity, including helper and regulatory functions.
PDAC vs. Adjacent Normal CD4+ T Cells:
- Upregulated in PDAC CD4+ T Cells: Similar to macrophages and PDAC ductal cells, PDAC-associated CD4+ T cells exhibit enrichment in "Apoptosis Modulation and Signaling", "Oncostatin M Signaling Pathway", "Epithelial to mesenchymal transition", "Chromosomal and microsatellite instability", "Ferroptosis", "G13 Signaling Pathway", "IL-3 Signaling Pathway", "MET in type 1 papillary renal cell carcinoma", "Nucleotide-binding Oligomerization Domain (NOD) pathway", "RAC1/PAK1/p38/MMP2 Pathway", and "Sterol Regulatory Element-Binding Proteins (SREBP) signalling". This broad enrichment of pro-survival, pro-inflammatory, and metabolic reprogramming pathways indicates a profoundly altered and potentially dysfunctional state of CD4+ T cells within the PDAC microenvironment, contributing to immune evasion and tumor progression.
- Downregulated in PDAC CD4+ T Cells: Similar to macrophages, "Toll-like Receptor Signaling Pathway" and "TLR4 Signaling and Tolerance" are suppressed, potentially hindering effective anti-tumor immune responses. Pathways related to cell adhesion (Focal Adhesion, Focal Adhesion-PI3K-Akt-mTOR) and RNA processing are also downregulated.
Common and Cell-Type Specific Insights
- Common PDAC Signature: A striking observation is the common upregulation of pathways related to apoptosis dysregulation, Oncostatin M signaling, G13, IL-3, MET, RAC1/PAK1/p38/MMP2 signaling, ferroptosis, and SREBP signaling across Ductal cells, Macrophages, and CD4+ T cells in the PDAC condition. This highlights a coordinated, multi-cellular reprogramming within the pancreatic tumor microenvironment that promotes tumor growth, survival, and immune evasion.
- Normal Homeostasis/Immune Function Loss: Conversely, pathways related to metabolic regulation (AMPK), DNA damage response, cell-matrix interactions (Focal Adhesion), and innate immune sensing (TLR Signaling) are generally more active in normal cells and significantly reduced in their PDAC counterparts.
- Ploidy as a Marker: The clear distinction between Diploid Ductal cells and other Ductal cells suggests that ploidy status might serve as an indicator of different stages of transformation or subsets within the tumor with distinct molecular profiles.
Clinical or Translational Implications
- Therapeutic Targeting of Shared Pathways: The identification of pathways like Oncostatin M Signaling, G13, IL-3, MET, and RAC1/PAK1/p38/MMP2 pathways, and SREBP signaling consistently upregulated across multiple cell types in PDAC, suggests these could be attractive therapeutic targets. Inhibiting these pathways might simultaneously impact tumor cells and reprogram the supportive immune microenvironment, potentially enhancing anti-tumor efficacy [2, 3].
- Metabolic Reprogramming: The strong enrichment of "Sterol Regulatory Element-Binding Proteins (SREBP) signalling" in PDAC-associated macrophages and CD4+ T cells highlights the importance of lipid metabolism in shaping the immunosuppressive tumor microenvironment. Targeting SREBP-mediated lipid synthesis could be a strategy to modulate TAM function and T cell anergy in PDAC [1, 4].
- Restoring Immune Function: The downregulation of Toll-like Receptor (TLR) signaling pathways in both macrophages and CD4+ T cells in PDAC indicates a suppressed immune state. Strategies to reactivate TLR signaling (e.g., TLR agonists) could potentially restore anti-tumor immune responses in the pancreatic tumor microenvironment.
- Ductal Cell Ploidy and Disease Progression: The distinct pathway profile of diploid ductal cells, resembling normal tissue, suggests they may represent a less aggressive or earlier stage of transformation. Understanding these differences could inform early detection strategies or patient stratification based on ploidy status, potentially guiding different therapeutic approaches for early-stage disease or for targeting these specific cellular subsets.
---
References
- SREBP and Lipid Metabolism in Cancer: PubMed Search: SREBP cancer lipid metabolism
- Oncostatin M in Cancer: GeneCards: OSM - Oncostatin M
- RAC1/PAK1/p38/MMP2 Pathway in Cancer: PubMed Search: RAC1 PAK1 p38 MMP2 cancer signaling
- Metabolic Reprogramming in Tumor Microenvironment: PubMed Search: tumor microenvironment metabolic reprogramming
22. Discussion
The comprehensive single-cell analysis of pancreatic tissue illuminates the profound molecular and cellular shifts distinguishing Pancreatic Ductal Adenocarcinoma (PDAC) from adjacent normal tissue. A central finding is the pervasive genomic instability in PDAC, with a high prevalence of aneuploidy specifically in the malignant Ductal cells, confirming their role as the tumor origin and driver of the disease. This genomic alteration is coupled with a hyperactive cell cycle and a broad activation of oncogenic pathways (e.g., TGF-beta, VEGF/VEGFR, ErbB, PI3K-Akt-mTOR, Ras signaling) within Ductal cells, underscoring the unchecked proliferation characteristic of PDAC.
The tumor microenvironment (TME) undergoes dramatic remodeling. There is a significant reduction in cytotoxic T cells alongside a notable increase in immunosuppressive CD4+ T cell subsets, particularly Tregs and naive T cells, suggesting a profoundly suppressed anti-tumor immune response. Macrophages, critical components of the TME, exhibit an unexpected M1-dominant phenotype, challenging the conventional understanding of an M2-skewed macrophage landscape in PDAC. While M1 macrophages are typically anti-tumorigenic, their persistence in PDAC implies either a functionally suppressed state or a unique pro-inflammatory context within this specific PDAC cohort. This M1 predominance, coupled with the upregulation of genes like TGM2 and CYP27A1, indicates complex metabolic and functional reprogramming of macrophages, which may still contribute to a pro-tumorigenic niche.
Cell-cell interaction (CCI) analyses unveil an intricate and dysregulated communication network in PDAC. Malignant Ductal cells engage in extensive crosstalk with stromal and immune cells via adhesion molecules (integrins), growth factors (HGF-MET, SPP1-integrin), and immunosuppressive pathways (TGFB1-TGFBR). Key immune checkpoint interactions, such as macrophage-macrophage LGALS9-HAVCR2 (Galectin-9-TIM-3) and endothelial-T cell PVR-TIGIT, are highly active in PDAC, contributing to T cell exhaustion and immune evasion. Moreover, malignant Ductal cells leverage PGE2 signaling to interact with macrophages, promoting inflammation and immunosuppression. The coordinated upregulation of pathways like Oncostatin M signaling, MET, RAC1/PAK1/p38/MMP2, and SREBP signaling across Ductal cells, Macrophages, and CD4+ T cells highlights a multi-cellular conspiracy driving tumor progression and resistance. The distinct surfaceome markers identified for Ductal cells (MSLN, MET, ERBB2, CDCP1), Macrophages (GPNMB, CD36, IL10RB), and CD4+ T cells (IL10RA, CCR7, SELL) further define their altered states and represent potential targets.
In contrast to PDAC, adjacent normal tissue maintains cellular homeostasis, characterized by diploid cells, a higher proportion of CD8+ T cells, M2A-skewed macrophages, and interactions primarily involved in tissue maintenance and basic immune surveillance. The striking divergence emphasizes the need for multi-faceted therapeutic approaches that not only target the malignant cells but also critically remodel the complex and immunosuppressive tumor microenvironment.
Hypotheses:
- The unexpected M1-dominant macrophage phenotype in PDAC samples represents a functionally suppressed or exhausted anti-tumor immune response, rather than an effective tumoricidal one, due to the profoundly immunosuppressive tumor microenvironment.
- The widespread aneuploidy and hyperactive cell cycle in Ductal cells are key drivers of their malignant transformation and contribute significantly to PDAC aggressiveness and heterogeneity.
- The intricate, dysregulated cell-cell interaction network, particularly involving malignant Ductal cells, macrophages, and T cells, is a primary mechanism for immune evasion and resistance to conventional therapies in PDAC.
- Metabolic reprogramming, reflected by upregulated SREBP signaling in both macrophages and CD4+ T cells, is a critical component of immune cell dysfunction and their pro-tumorigenic roles in the PDAC microenvironment.
Potential therapeutic targets:
- MSLN (Mesothelin): Highly upregulated surface marker on PDAC Ductal cells (tumor origin). Evidence: MSLN is identified as a condition-specific surfaceome marker, significantly upregulated in PDAC Ductal cells compared to adjacent normal tissue (Section 16). It is a well-known tumor-associated antigen in PDAC. Validation: Test efficacy of MSLN-targeted antibody-drug conjugates (ADCs) or Chimeric Antigen Receptor (CAR) T cell therapy in PDAC organoid models and patient-derived xenografts to confirm its therapeutic utility.
- MET (HGF Receptor): Upregulated surface marker on PDAC Ductal cells and part of active HGF-MET signaling, promoting tumor progression. Evidence: MET is significantly upregulated in PDAC Ductal cells (Section 16) and is involved in strong macrophage-Ductal cell interactions in PDAC (Section 12), driving cell proliferation, survival, and migration. GSEA also indicates MET pathway enrichment in PDAC Ductal cells (Section 21). Validation: Evaluate MET inhibitors (e.g., capmatinib, tepotinib) in preclinical PDAC models, potentially in combination with other therapies, to assess their impact on tumor growth and metastasis.
- LGALS9-HAVCR2 (Galectin-9-TIM-3 axis): Strong autocrine/paracrine interaction within PDAC Macrophages contributes to an immunosuppressive tumor microenvironment. Evidence: A significant macrophage-macrophage LGALS9-HAVCR2 interaction is identified in PDAC (Section 14). Macrophages in PDAC also show upregulation of immunosuppressive markers like IL10RA (Section 17) and enrichment of pathways related to apoptosis modulation and SREBP signaling (Section 21). Validation: Investigate the use of TIM-3 blocking antibodies to reprogram tumor-associated macrophages (TAMs) from a pro-tumorigenic to an anti-tumorigenic state, thereby enhancing anti-tumor immunity in PDAC models.
- SIRPα-CD47 axis: Identified in PDAC-specific macrophage interactions and potentially with malignant Ductal cells, mediating 'don't eat me' signaling, which allows cancer cells to evade phagocytosis. Evidence: Prominent SIRPA-CD47 interactions are observed within macrophages in PDAC (Sections 13, 15), suggesting a mechanism for immune evasion. This pathway is critical for inhibiting phagocytosis of tumor cells and potentially TAMs by other immune cells. Validation: Test CD47 blocking antibodies to promote phagocytosis of tumor cells and TAMs by host immune cells in PDAC models, aiming to unleash anti-tumor immune responses.
- Prostaglandin E2 (PGE2) pathway (via PTGER2): Malignant Ductal cells communicate with macrophages via PGE2 signaling, promoting inflammation and immunosuppression within the tumor microenvironment. Evidence: PGE2 signaling (ProstaglandinE2_byPTGES3_PTGER2-Duct(Aneup)|Mac) is identified in significant Aneuploid Ductal cell-Macrophage interactions in PDAC (Section 15). PGE2 is a known mediator of immunosuppression and tumor growth in various cancers. Validation: Assess the efficacy of COX inhibitors or EP2 receptor antagonists in preclinical PDAC models to disrupt this pro-tumorigenic crosstalk between malignant cells and TAMs, aiming to reduce tumor growth and improve therapeutic outcomes.
Follow-up validation ideas:
- Validate the spatial localization and co-localization of key interacting cell types (e.g., Aneuploid Ductal cells, M1 Macrophages, Tregs) and their surface markers (e.g., MSLN, GPNMB, IL10RA) within PDAC tissue sections using multiplexed immunofluorescence or spatial omics technologies.
- Quantify the proportions of T cell subsets (CD8+ Cytotoxic T cells vs. Tregs) and macrophage polarization states (M1 vs. M2 markers) in a larger cohort of PDAC and normal pancreatic samples using flow cytometry or immunohistochemistry.
- Investigate the functional state of isolated PDAC-associated M1 macrophages (e.g., cytokine production, phagocytic activity, T cell modulation capacity) and the impact of blocking LGALS9-HAVCR2 or SIRPA-CD47 interactions on their immunosuppressive properties using in vitro/ex vivo functional assays.
- Use in vitro co-culture models or in vivo PDX models to perturb specific cell-cell interaction pathways (e.g., targeting HGF-MET, SPP1-integrin, PVR-TIGIT, or PGE2 signaling) and assess their impact on tumor growth, invasion, and immune response.
- Functionally validate upregulated genes (e.g., MSLN, MET, TGM2, CYP27A1) in PDAC Ductal cells and Macrophages using CRISPR/shRNA knockdown/overexpression techniques, followed by assessment of proliferation, survival, and interaction capabilities.
- Replicate key population shifts, gene expression changes, and pathway enrichments in independent patient cohorts using bulk RNA-seq or additional single-cell datasets.
- Confirm recurrent CNV regions (e.g., EGFR, ERBB2) identified in Ductal cells using fluorescence in situ hybridization (FISH) on larger patient samples to correlate with clinical outcomes.
Limitations:
This analysis provides a snapshot of the PDAC microenvironment at the single-cell level, but it is limited by its cross-sectional nature, precluding direct inference of causality or disease progression over time. The macrophage M1/M2 classification is based on gene expression and may not fully capture the functional plasticity and continuous spectrum of macrophage activation states in vivo. Furthermore, while CNV analysis provides strong evidence for aneuploidy, its resolution is limited compared to whole-genome sequencing, and complex chromosomal rearrangements may not be fully resolved. The 'unassigned' cell population remains incompletely characterized, potentially containing rare or transitional cell states. Finally, the analysis relies on inferred cell-cell interactions and pathway enrichments, which require further experimental validation to confirm their functional significance in PDAC pathogenesis and therapeutic response.
23. Query List
- Show UMAPs including condition, sample, major celltype, minor celltype, ploidy_dec, and celltype_subset in 2 columns and save.
- Show major celltype scores on UMAP and save.
- Show the overall Celltype_subset marker expression dot plot and save it. Keep target_cell as None and keep the other arguments at their default values.
- Select tumor-origin cells and unassigned cells, group them by sample, show a CNV heatmap, and include a summary of significantly amplified copy number regions, and save.
- Show CNV patterns on UMAP. Include major celltype, minor celltype, ploidy results, condition, and sample in 2 columns and save.
- Show a population bar plot of minor cell types and save.
- Show a subset population barplot for T cells and save.
- From the T cell subset population, show boxplots for those with significant differences between conditions and save. Determine ncols appropriately based on the total number of panels.
- Show a subset population barplot for macrophages and save.
- From the macrophage subset population, show boxplots for those with significant differences between conditions and save. Determine ncols appropriately based on the total number of panels.
- Select tumor-origin cells and unassigned cells, show a barplot of their ploidy population, and save.
- Show cell-cell interaction patterns by condition, including tumor-origin cells (Ductal cell), fibroblasts, macrophages, and T cells, and save. Select up to 80 cell-cell interactions per condition.
- Show cell-cell interactions by condition and save the result. Select at most 80 cell-cell interactions for each condition.
- Select genes related to immune checkpoint pathways and cell cycle pathways, then show cell-cell interactions for these genes and save.
- Find statistically significant differences in cell-cell interactions between conditions for major immune cells and stromal cells, show them as a dot plot, and save. Set max_n_items_per_group to 25.
- Show the condition-specific markers for tumor-origin cells (Ductal cell) as a dot plot and save the result. Use only surfaceome markers, up to 50 markers per condition.
- Extract condition-specific markers for Macrophages, show them as a dotplot, and save. Filter for surfaceome markers only, up to 50 per condition.
- Extract condition-specific markers for CD4 T cells, show them as a dotplot, and save. Filter for surfaceome markers only, up to 50 per condition.
- From Cell cycle pathway-related genes, select those with statistically significant differences in expression between conditions in Ductal cells (major disease-related cells), show boxplots, and save. Set max_n_items_to_plot to 24, and ncols to achieve an aspect ratio of approximately 2x3 based on the total number of panels.
- Show Gene Ontology (GSA) analysis results as a bar-plot for Ductal cells (epithelial cells) and save.
- Show Gene Set Enrichment Analysis results as a dotplot for Ductal cells, Macrophages, and T cell CD4+ (major cell types) and save. Use 'RdBu_r' for the color map and set n_pws_to_show to 80.