Single-Cell Atlas Reveals Progressive Pancreatic Remodeling, Inflammation, and Cellular Crosstalk in Type 2 Diabetes Progression
This single-cell analysis of the human pancreas uncovers significant cellular compositional shifts and molecular alterations tied to the progression of type 2 diabetes (T2D). Key findings include a notable reduction in Beta cell proportion, a progressive increase in pro-inflammatory M1 macrophages, and a widespread upregulation of inflammatory and stress-related pathways in both endocrine and exocrine cells. Cell-cell interaction analyses further highlight active stromal remodeling and inflammatory crosstalk involving pancreatic stellate cells and immune cells, particularly intensifying in T2D. These integrated findings delineate a chronic inflammatory and metabolically stressed pancreatic microenvironment driving diabetes pathogenesis.
Contents
- Dataset overview
- Pancreatic Single-Cell UMAP Analysis: Cell Type and Condition Distribution
- Major Cell Type Score Visualization on UMAP
- Celltype_subset Marker Gene Expression Analysis in Pancreatic Single-Cell RNA-seq Data
- Pancreatic Minor Cell Type Population Analysis in Diabetes Progression
- Pancreatic Mast Cell Population Across Diabetes Conditions
- Pancreatic Macrophage Subtype Composition Changes Across Diabetes Progression
- Condition-Specific Cell-Cell Interaction Patterns in Pancreatic Disease Progression
- Condition-Specific Cell-Cell Interaction Patterns in Pancreatic Immune and Stromal Cells
- Surfaceome Marker Gene Expression Across Pancreatic Cell Subsets
- Pancreatic Mast Cell Condition-Specific Surfaceome Markers in Diabetes Progression
- Gene Ontology Analysis of Upregulated Pathways in Pancreatic Acinar and Ductal Cells Across Diabetes Conditions
- Gene Set Enrichment Analysis (GSEA) of Pancreatic Cell Types in Diabetes Progression
- Discussion
- Query List
0. Dataset overview
Dataset Summary
- Dimensions: This dataset contains single-cell RNA-seq data for 100,002 cells and 28,920 genes.
- Species & Tissue: The data is from human Pancreas tissue.
- Conditions: Three primary conditions are studied: type2_diabetes, non_diabetic, and prediabetes.
Cell Types: Cells are annotated at three hierarchical levels
- Major: Alpha cell, Gamma (PP) cell, Beta cell, Stromal cell, Ductal cell, Myeloid cell, Delta cell, Acinar cell, Endothelial cell, Mast cell, unassigned.
- Minor: Alpha cell, Gamma (PP) cell, Beta cell, Stellate cell, Ductal cell, Macrophage, Delta cell, Acinar cell, Endothelial cell, Smooth muscle cell, Mast cell, Fibroblast, unassigned.
- Subset: Further granular cell types like Macrophage (M1), Macrophage (M2C), Endothelial tip cell, etc.
Precomputed Results: The dataset includes various precomputed analyses
- Cell-Cell Interaction (CCI): Results are available per condition and per sample.
- Differential Expression Genes (DEG): Results are precomputed for each celltype_minor, comparing conditions versus the rest, and also versus a 'non_diabetic' reference condition.
- Gene Set Enrichment Analysis (GSEA) & Gene Set Analysis (GSA/GO): Enrichment results are available for each celltype_minor, comparing conditions versus the rest, and also versus a 'non_diabetic' reference condition.
1. Pancreatic Single-Cell UMAP Analysis: Cell Type and Condition Distribution
[Analysis Visualization Results]...
Analysis Overview
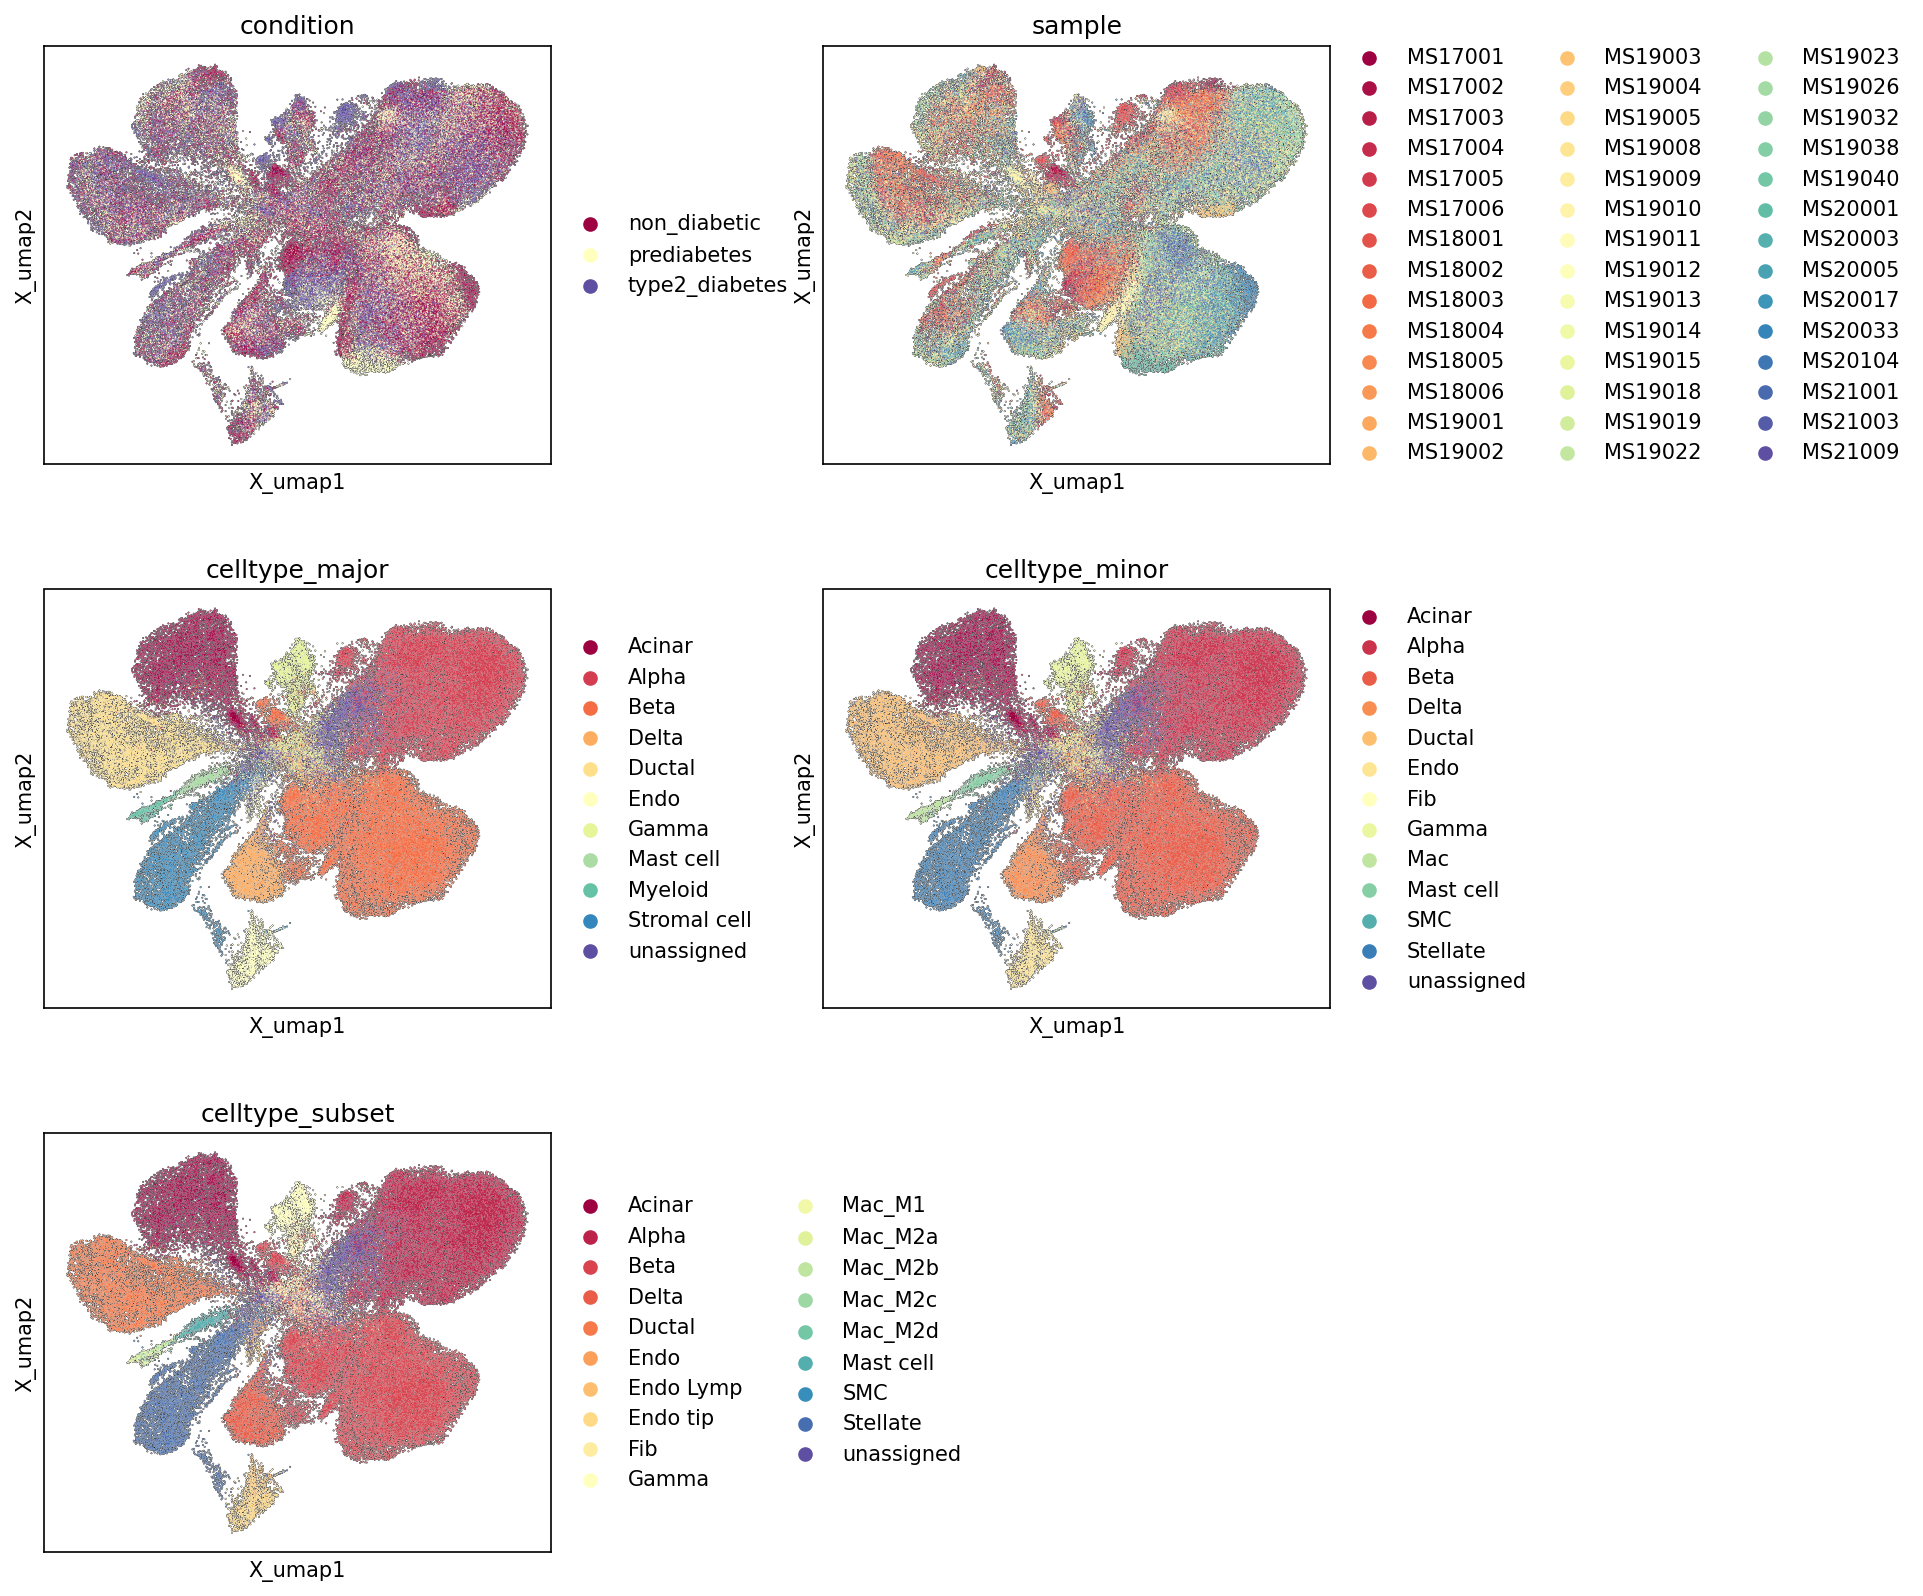
This analysis presents a series of Uniform Manifold Approximation and Projection (UMAP) plots, visualizing single-cell RNA sequencing data from human pancreas across various conditions (non_diabetic, prediabetes, type2_diabetes). The UMAPs are colored by condition, sample, celltype_major, celltype_minor, and celltype_subset to explore the overall structure of the dataset, assess data integration, and visualize the distribution of different cell populations and disease states within the pancreatic tissue. The primary goal is to evaluate the quality of cell type annotations and the global sample/condition distribution in the embedding space.
Visual Summary
The UMAP plots provide a comprehensive overview of the cellular landscape:
- Condition UMAP: Cells from non_diabetic, prediabetes, and type2_diabetes conditions are broadly distributed across the UMAP, with no extreme segregation by condition. While non_diabetic cells appear more prevalent in certain large clusters, and type2_diabetes cells show some localized densities, cells from all conditions are generally intermixed within the major cell type clusters. This suggests that the condition-specific differences might be subtle or manifest within specific cell types rather than causing wholesale shifts in the overall cell population structure.
- Sample UMAP: The UMAP colored by sample ID shows a high degree of intermixing of cells from different samples across the entire embedding space. Individual samples (e.g., MS17001, MS19003) do not form distinct, isolated clusters. This indicates successful integration of data from multiple samples, minimizing potential batch effects that could confound downstream analyses.
- Celltype_major UMAP: This plot clearly delineates distinct clusters corresponding to major cell types. Acinar, Alpha, Beta, Delta, and Ductal cells form large, well-separated clusters, which is expected given their roles and prevalence in the pancreas. Stromal, Endothelial, Myeloid, and Mast cells also form recognizable, smaller clusters. The unassigned cells are scattered rather than forming a cohesive cluster, suggesting that most cells have been confidently assigned to a major cell type.
- Celltype_minor UMAP: This plot offers a finer resolution of cell types, showing further sub-differentiation. For example, the Stromal cell major cluster resolves into Stellate cell, Fibroblast, and Smooth muscle cell (SMC) in the minor annotation. Myeloid cell refines to Macrophage. This hierarchical consistency between major and minor annotations is a positive indicator of robust cell type identification.
- Celltype_subset UMAP: The most granular level of annotation reveals even further heterogeneity, particularly within immune and endothelial populations. Macrophages are sub-classified into M1, M2A, M2B, M2C, and M2D subtypes, reflecting diverse polarization states. Endothelial cells are also refined into Endothelial tip cell and Lymphatic Endothelial cell subsets. This high-resolution annotation is crucial for exploring specific cellular functions and responses within the complex pancreatic microenvironment.
Biological Interpretation
The UMAP plots provide a robust initial view of the single-cell pancreatic dataset.
- Pancreatic Cell Type Diversity: The distinct clustering of exocrine (Acinar, Ductal) and endocrine (Alpha, Beta, Delta, Gamma (PP)) cells, along with various stromal, endothelial, and immune populations, accurately reflects the known cellular complexity of the human pancreas. The relatively large clusters of Acinar, Alpha, and Beta cells are consistent with their high abundance in the pancreatic tissue and islets, respectively.
- Cell Type Annotation Quality: The clear separation and hierarchical consistency across celltype_major, celltype_minor, and celltype_subset annotations suggest high confidence in the cell type assignments. The unassigned cells are not forming prominent, large clusters, which implies that the majority of cells have been successfully classified. The presence of detailed macrophage and endothelial subsets at the celltype_subset level highlights the potential to investigate immune responses and vascular changes in diabetes.
- Condition Distribution and Potential for Differential Analysis: While conditions are largely intermixed, the observation of some localized densities for type2_diabetes cells suggests that condition-specific changes might be occurring within particular cell types or states. For example, a thorough analysis of Beta cell composition and gene expression across conditions would be critical given their central role in diabetes pathogenesis PubMed: 22889240. The current visualization sets the stage for more focused differential expression and pathway analyses within these specific cell types.
- Data Integration Success: The absence of strong sample-specific clustering (batch effects) indicates that the single-cell data from different donors and experimental batches have been well-integrated. This is critical for drawing valid biological conclusions when comparing conditions, as any observed differences are less likely to be artifacts of sample processing or technical variation.
Annotation Notes
- The consistency and distinctness of cell type clusters across all levels of annotation (celltype_major, celltype_minor, celltype_subset) are excellent, supporting the quality of the cell identity assignments.
- The distribution of unassigned cells as scattered points, rather than a single large cluster, suggests that there are no major uncharacterized cell populations or substantial numbers of low-quality cells driving the embedding structure.
- The effective integration of samples, as evidenced by the sample UMAP, minimizes concerns about batch effects confounding downstream analyses, reinforcing the reliability of condition-specific comparisons.
2. Major Cell Type Score Visualization on UMAP
[Analysis Visualization Results]...
Analysis Overview
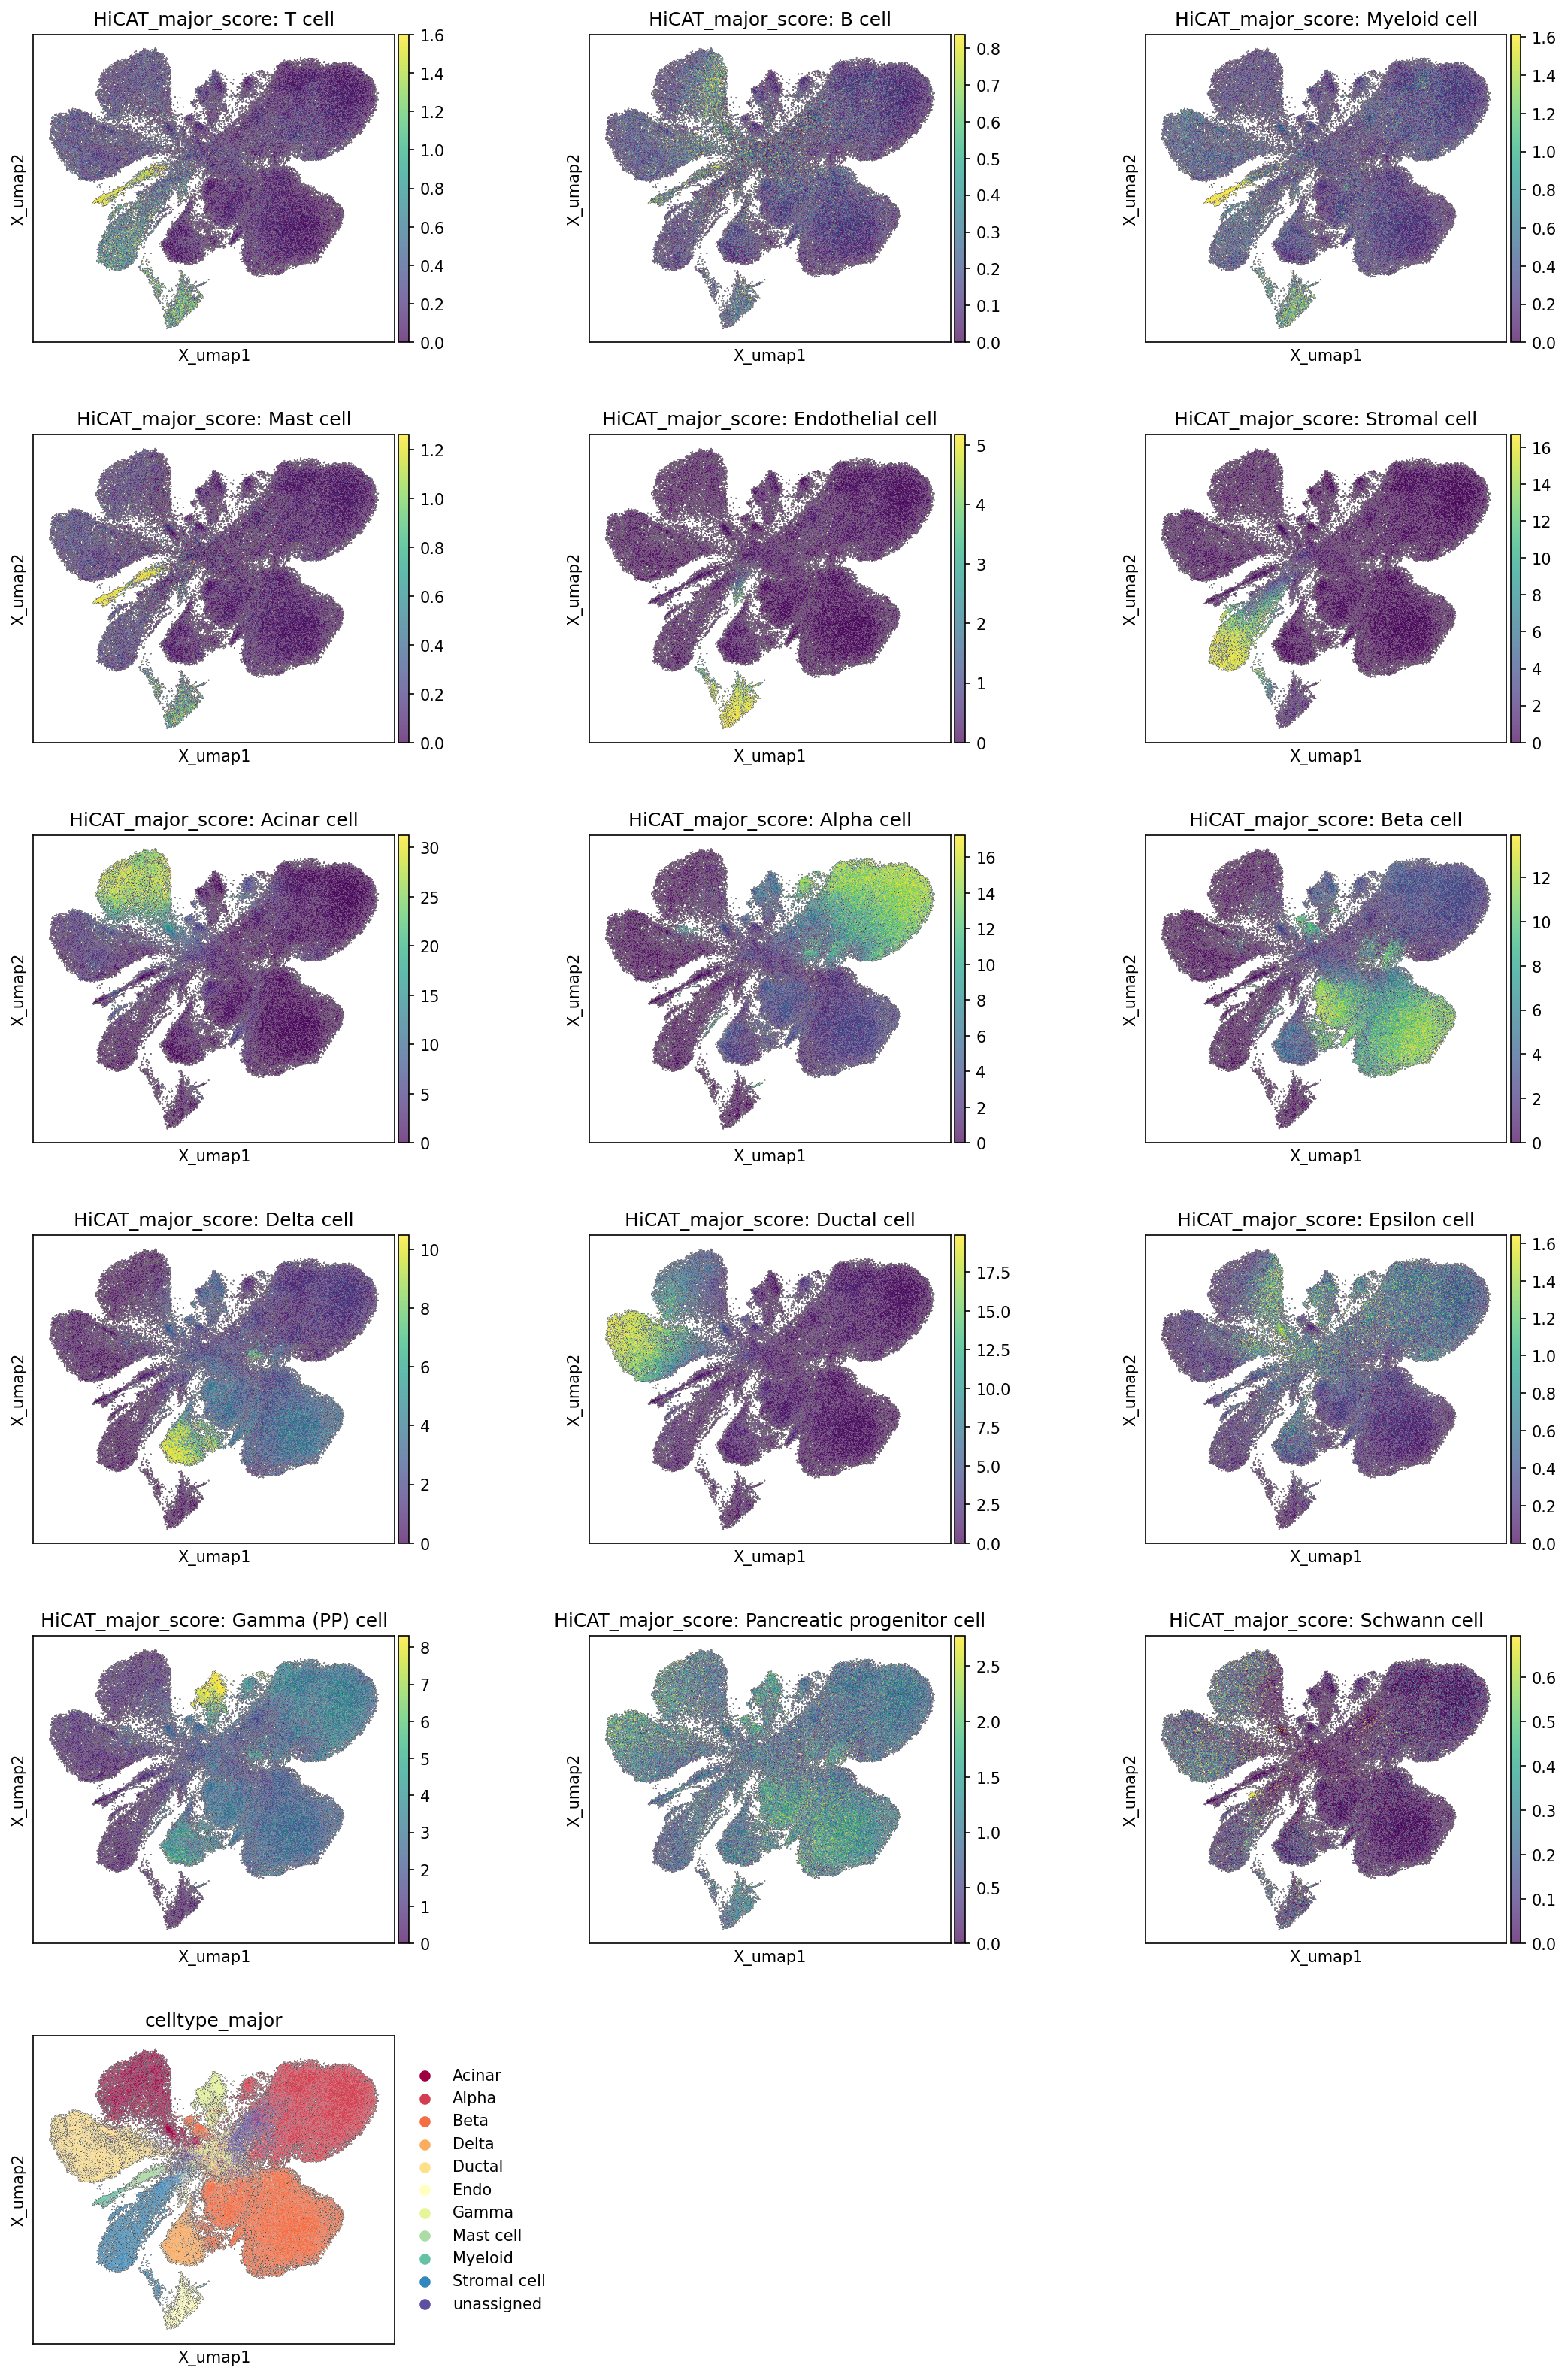
This analysis visualizes the distribution of major cell type scores across the UMAP embedding, providing a visual assessment of cell type identification and annotation quality. For each major cell type, a "HiCAT_major_score" is plotted, representing the likelihood or expression signature of that cell type. The final panel shows the assigned celltype_major annotation, allowing for direct comparison and validation of the automated scoring against the discrete cell type labels.
Visual Summary
The UMAP plots clearly demonstrate distinct spatial segregation for most major cell types based on their respective "HiCAT_major_score".
- Distinct Clustering: Cell types such as Acinar cells, Alpha cells, Beta cells, Delta cells, Ductal cells, Endothelial cells, and Stromal cells each show high scores concentrated in well-defined, non-overlapping regions of the UMAP. This indicates that these cell populations have unique and strong transcriptional signatures that allow for their clear separation.
- Islet Cell Segregation: Within the endocrine compartment, Alpha, Beta, Delta, and Gamma (PP) cells form distinct but adjacent clusters, reflecting their close anatomical and developmental relationship within the pancreatic islets while maintaining unique molecular profiles.
- Immune and Stromal Cells: Immune cells (T cell, B cell, Myeloid cell, Mast cell) and stromal cells (Endothelial cell, Stromal cell) also form their own distinct clusters, often peripheral to the main epithelial and endocrine populations.
- Less Prominent Populations: "Epsilon cell", "Pancreatic progenitor cell", and "Schwann cell" show less concentrated or more diffuse score distributions, suggesting they might be rarer populations, have less distinct gene signatures, or exist in intermediate states. Their scores are also generally lower in magnitude compared to the more abundant cell types.
- Consistency with celltype_major: The final celltype_major plot, which assigns discrete labels, largely mirrors the high-score regions observed in the individual "HiCAT_major_score" plots. This visual concordance supports the quality and reliability of the cell type annotation.
- "Unassigned" Cells: A cluster of "unassigned" cells is visible, primarily in a region with generally lower scores for the specific major cell types, indicating cells that do not strongly align with any predefined major cell type signature.
Biological Interpretation
The observed segregation of major cell types on the UMAP based on their scores underscores the power of single-cell RNA-seq in resolving cellular heterogeneity within the human pancreas.
- Robust Cell Identity: The high and localized scores for key pancreatic cell types (e.g., Alpha, Beta, Acinar, Ductal) confirm their robust and distinct transcriptional identities, which are fundamental for understanding pancreatic physiology and pathology. The clear separation of these cells is crucial for downstream differential gene expression and pathway analyses.
- Pancreatic Islet Architecture: The close proximity but clear distinction of Alpha, Beta, Delta, and Gamma cells on the UMAP reflects the intricate cellular organization of the pancreatic islets and their specialized functions in glucose homeostasis.
- Stromal and Immune Compartment: The identification of distinct stromal (e.g., Stellate, Fibroblast - inferred from "Stromal cell" major type score) and immune cell populations is vital, as these cells play critical roles in pancreatic development, inflammation, and disease progression, particularly in conditions like type 2 diabetes. Macrophages, as a component of Myeloid cells, are known to be involved in pancreatic inflammation in diabetes [PubMed Search: "pancreatic macrophage diabetes" - PubMed Search].
- Minor Cell Types and Heterogeneity: The presence of populations like "Epsilon cells" (known to produce ghrelin in the pancreas) and "Pancreatic progenitor cells" highlights the potential for uncovering rare or developmental cell states, although their less defined scores here suggest they may be less abundant or their signatures are less strong in this dataset at this level of resolution. Schwann cells, primarily associated with nerves, are also represented, indicating the inclusion of neural components in the tissue sample.
Annotation Notes
The strong agreement between the individual major cell type scores and the overall celltype_major assignments suggests a high quality of cell type annotation for this single-cell RNA-seq dataset.
- Validation of Annotation: The distinct high-score regions corresponding to each annotated cell type provide strong visual validation that the major cell type annotations are well-supported by the underlying gene expression data. This is a critical first step for any single-cell analysis, ensuring that subsequent analyses are performed on correctly identified cell populations.
- Areas for Further Scrutiny: The "unassigned" cluster or regions where multiple cell type scores show moderate values could represent:
- Cells with ambiguous or intermediate transcriptional states.
- Low-quality cells or doublets that do not fit a clear cell type profile.
- Rare cell types not explicitly defined in the major cell type scoring system.
These areas might warrant further investigation, potentially requiring more refined clustering, deeper marker gene analysis, or integration with additional reference datasets to resolve their identities.
- Utility for Quality Control: Visualizing cell type scores on UMAP is an effective quality control measure for cell annotation pipelines, allowing researchers to quickly identify well-defined populations versus those that require additional refinement.
3. Celltype_subset Marker Gene Expression Analysis in Pancreatic Single-Cell RNA-seq Data

[Analysis Visualization Results]...
Analysis Overview
This analysis presents a dot plot visualizing the expression patterns of key marker genes across different celltype_subset populations identified in the pancreatic single-cell RNA-seq dataset. The primary goal is to assess the quality of cell type annotations by examining the specificity and expression levels of known and identified marker genes. Each dot represents a gene-cell type pair, where the size of the dot indicates the fraction of cells within that group expressing the gene, and the color intensity reflects the mean expression level. Markers are selected based on differential expression, including non-zero percentage score, and are presented to validate the assigned cell identities.
Visual Summary
The dot plot displays a clear and distinct pattern of marker gene expression, with individual celltype_subset populations showing high and specific expression of their respective characteristic genes. Red boxes effectively highlight groups of genes predominantly expressed within a single cell type, indicating strong marker specificity.
Key observations include:
- High Specificity: Most marker genes exhibit highly restricted expression to their assigned celltype_subset, with dark red, large dots signifying high mean expression and high proportion of expressing cells.
- Distinct Cell Clusters: Each celltype_subset forms a distinct cluster based on its unique marker expression profile, supporting the robustness of the cell type annotations.
- Expected Pancreatic Cell Markers: The plot successfully identifies canonical markers for both endocrine (Alpha, Beta, Delta, Gamma PP cells), exocrine (Acinar cells), and stromal/immune populations.
- Cell Type Abundance: The bar chart on the right indicates the number of cells per celltype_subset, showing Beta cells (30603) and Alpha cells (28540) as the most abundant, followed by Ductal cells (9185) and Acinar cells (8124). Stromal and immune cells represent smaller but well-defined populations.
Biological Interpretation
The marker gene expression patterns observed in the dot plot strongly validate the assigned celltype_subset annotations, providing confidence in the biological identities of the cell populations within the pancreas.
- Acinar Cells: Show robust expression of digestive enzyme genes such as REG1A, PRSS2 (Trypsinogen 2), SPINK1 (Pancreatic secretory trypsin inhibitor), CTRB1/2 (Chymotrypsinogen B), CELA3A/B (Elastase 3A/B), and PNLIP (Pancreatic lipase) GeneCards: REG1A. This profile is highly characteristic of pancreatic exocrine cells responsible for digestive enzyme production.
- Alpha Cells: Unambiguously identified by high expression of GCG (Glucagon), a key hormone regulating blood glucose GeneCards: GCG. Other markers like ALDH1A1, IRX2, and GDF15 further support this identity.
- Beta Cells: Exhibit strong and specific expression of INS (Insulin) and IAPP (Islet Amyloid Polypeptide), the defining hormones of beta cells GeneCards: INS. Markers like PCSK1/2 (Proprotein convertases crucial for insulin maturation), and transcription factors NKX6-1 and MAFA, further confirm their identity and functional state. A minor presence of SST (Somatostatin) in some beta cells may indicate cellular plasticity or progenitor characteristics.
- Delta Cells: Are clearly marked by the expression of SST (Somatostatin), their signature hormone GeneCards: SST.
- Ductal Cells: Display characteristic expression of cytokeratins KRT7 and KRT19, MUC1 (mucin 1), and CFTR (Cystic Fibrosis Transmembrane Conductance Regulator), critical for ductal function and morphology GeneCards: KRT7.
- Endothelial Tip Cells: Are identified by markers such as ESM1 (Endothelial cell-specific molecule 1), ANGPT2 (Angiopoietin 2), and DLL4 (Delta-like canonical Notch ligand 4), which are crucial for angiogenesis and vascular development GeneCards: ESM1.
- Gamma (PP) Cells: Specifically express PPY (Pancreatic Polypeptide), their defining hormone GeneCards: PPY.
- Macrophage Subsets (M1, M2B, M2C): While distinct functional subsets, they share a core set of macrophage-associated markers like IFNGR1/2, STAT1, CD36, and MSR1, confirming their general immune cell identity. The specific markers plotted in this overview do not strongly delineate the M1/M2 subtypes, but rather confirm their overarching macrophage nature.
- Mast Cells: Are characterized by the expression of CPA3 (Carboxypeptidase A3), a known mast cell protease GeneCards: CPA3.
- Smooth Muscle Cells: Show expression of mesenchymal markers including collagens (COL6A1/3, COL4A1), PDGFRB (Platelet-derived growth factor receptor beta), TIMP3, and FN1 (Fibronectin 1), consistent with their structural and contractile roles GeneCards: PDGFRB.
- Stellate Cells: Activated pancreatic stellate cells express extracellular matrix components such as COL1A1/2 (Collagen type I), SPARC (Secreted protein acidic and cysteine rich), and CALD1 (Caldesmon 1) GeneCards: COL1A1. The overlap of some markers (e.g., collagens, PDGFRB, FN1) with smooth muscle cells is biologically expected due to their shared mesenchymal origin and roles in tissue remodeling and fibrosis.
Annotation Notes
The comprehensive and specific marker expression profiles observed across all celltype_subset populations provide strong evidence for the accuracy and reliability of the cell type annotations. The distinct expression patterns, even within closely related cell types or stromal populations, suggest a high-resolution and well-validated cell type assignment. The presence of some markers in minor populations (e.g., SST in Beta cells, PPY in Delta cells) may reflect biological heterogeneity, developmental intermediates, or low-level promiscuous expression, which is common in single-cell data and does not undermine the overall annotation quality given the strong primary markers. The smallest group, Smooth muscle cell (42 cells), meets the minimum cell count threshold for marker finding and plotting, ensuring its representation is robust.
4. Pancreatic Minor Cell Type Population Analysis in Diabetes Progression
[Analysis Visualization Results]...
Analysis Overview
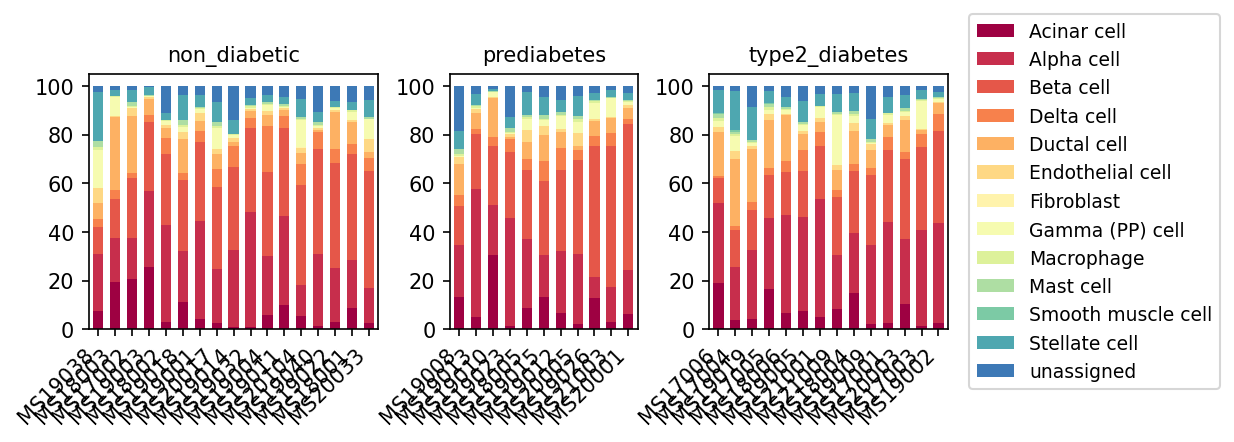
This analysis presents the population distribution of minor cell types within the human pancreas across three conditions: non_diabetic, prediabetes, and type2_diabetes. The stacked bar plots illustrate the relative proportion of each identified minor cell type within individual samples, providing insight into potential shifts in pancreatic cellular composition associated with diabetes progression. The data originates from single-cell RNA sequencing of pancreatic tissue.
Visual Summary
The visualization displays stacked bar plots for each individual sample, grouped by condition (non_diabetic, prediabetes, type2_diabetes). Each bar represents 100% of the cells within a sample, with different colors indicating the relative proportion of specific minor cell types.
Key observations from the plots are:
- Dominant Cell Types: Acinar cells (dark red) and Alpha cells (red) consistently represent the largest proportions across all conditions and samples. Beta cells (orange-red) and Ductal cells (orange) also constitute significant fractions.
- Beta Cell Reduction in Type 2 Diabetes: A notable decrease in the relative proportion of Beta cells (orange-red) is observed as the disease progresses from non_diabetic, through prediabetes, to type2_diabetes. This reduction appears consistent across most samples within the type2_diabetes group.
- Ductal Cell Proliferation/Increase: Conversely, there appears to be a slight increase in the proportion of Ductal cells (orange) in the type2_diabetes condition compared to the non_diabetic state.
- Acinar Cell Trend: Acinar cells, while dominant, show a subtle trend of decreasing proportions in type2_diabetes compared to non_diabetic samples.
- Stromal and Immune Cell Trends: Minor populations like Stellate cells (teal) and Fibroblasts (yellow) appear to be slightly more prominent in some type2_diabetes samples, potentially indicative of stromal changes. Macrophages (light green-yellow), while a very small fraction, are also present, suggesting a potential immune component.
- "Unassigned" Cells: A fraction of cells remains "unassigned" (dark blue) in many samples, particularly in non_diabetic and prediabetes conditions, indicating some cells could not be definitively classified into the defined minor cell types. The proportion of "unassigned" cells seems generally lower in type2_diabetes samples.
Biological Interpretation
The observed shifts in pancreatic cell type proportions offer critical biological insights into the pathogenesis of Type 2 Diabetes (T2D):
- Beta Cell Loss/Dysfunction: The most significant finding is the apparent reduction in Beta cell proportion in type2_diabetes. This aligns with the well-established understanding that T2D is characterized by progressive pancreatic Beta cell dysfunction and mass reduction, leading to insufficient insulin production PubMed search: Beta cell mass type 2 diabetes. This reduction could be due to increased apoptosis, impaired regeneration, or dedifferentiation of Beta cells under chronic metabolic stress.
- Compensatory or Reactive Ductal Cell Changes: The slight increase in Ductal cell proportion in T2D could be a reactive mechanism, as ductal cells have been implicated in islet regeneration and plasticity. Alternatively, it might reflect changes in pancreatic architecture or be part of a fibrotic response.
- Acinar Cell Homeostasis: The subtle decrease in acinar cell proportion might suggest broader changes in pancreatic tissue health or exocrine function in T2D, although these cells are primarily involved in digestive enzyme production.
- Stromal Remodeling and Inflammation: The potential increase in Stellate cells and Fibroblasts, though minor, could indicate increased pancreatic fibrosis, a known feature in advanced T2D which contributes to islet dysfunction GeneCards: ACTA2 (Alpha-smooth muscle actin) as a marker for stellate cells/fibrosis. The presence of Macrophages further supports an inflammatory component, where insulitis (inflammation of pancreatic islets) contributes to Beta cell damage PubMed search: pancreatic macrophage type 2 diabetes inflammation.
- Prediabetes as an Intermediate State: The cell population profiles in prediabetes generally appear intermediate between non_diabetic and type2_diabetes, supporting the concept of a gradual progression of cellular changes as glucose dysregulation worsens.
Clinical or Translational Implications
- Biomarker Potential: Changes in the proportion of specific pancreatic cell types, particularly Beta cells, could serve as quantitative biomarkers for disease progression in diabetes or indicators of therapeutic efficacy for interventions aimed at preserving Beta cell mass.
- Therapeutic Targets: Understanding the cellular shifts (e.g., Beta cell decline, stromal cell increase, immune cell presence) can help identify critical cellular processes and specific cell populations for targeted therapeutic development to halt or reverse disease progression. For instance, strategies to protect Beta cells from apoptosis or dedifferentiation, or to modulate the pancreatic immune and fibrotic microenvironment, could be explored.
- Refining Disease Staging: The observed distinct cellular profiles across non_diabetic, prediabetes, and type2_diabetes conditions could contribute to a more refined molecular staging of diabetes, potentially guiding personalized treatment approaches.
5. Pancreatic Mast Cell Population Across Diabetes Conditions
[Analysis Visualization Results]...
Analysis Overview
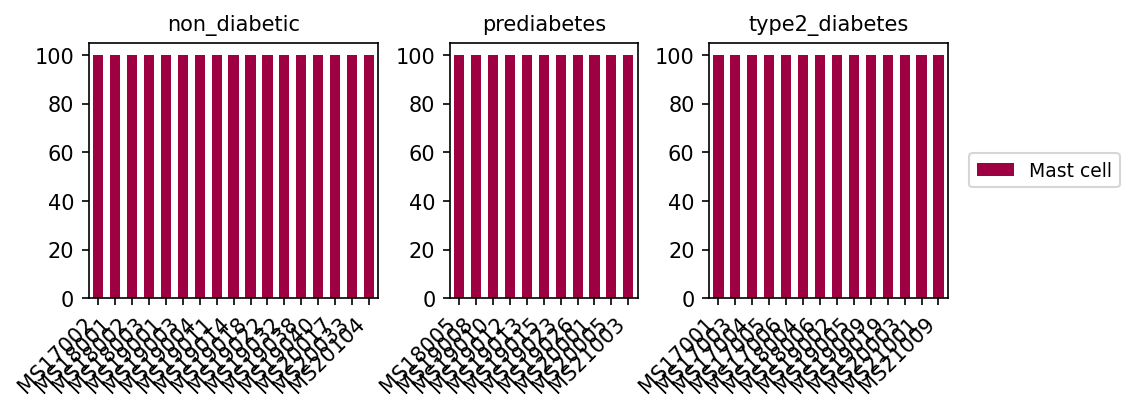
This analysis visualizes the population distribution of "Mast cell" (from the celltype_subset annotation) across individual samples, grouped by diabetes conditions (non_diabetic, prediabetes, type2_diabetes). The plot utilizes the plot_celltype_population tool to specifically highlight the presence of Mast cells.
Visual Summary
The visualization consists of three bar plots, each representing a different condition: non_diabetic, prediabetes, and type2_diabetes. Within each plot, individual bars correspond to distinct samples. A single color (maroon) represents "Mast cell" according to the legend. Crucially, all bars in all three condition panels show a value of 100% on the y-axis.
Biological Interpretation
The plot demonstrates the consistent presence of cells annotated as "Mast cell" within the celltype_subset category across all individual samples examined, spanning non-diabetic, prediabetic, and type 2 diabetic states of the human pancreas.
Given that the plot was generated specifically to target Mast cell within the celltype_subset column, the 100% value for each bar indicates that for every sample where Mast cell was identified, the proportion of cells matching the "Mast cell" label *within the subset of cells designated as 'Mast cell' for plotting* is, by definition, 100%. This plot thus confirms the successful identification and inclusion of Mast cells in all samples across the different conditions.
It is important to note what this plot does *not* show:
- It does not represent the *relative abundance* or *proportion* of Mast cells compared to other cell types (e.g., Alpha cells, Beta cells, Ductal cells) within each sample or condition. To assess such changes, a broader population analysis showing all cell types would be required.
- It does not indicate any shifts in the absolute or relative numbers of Mast cells across the non-diabetic, prediabetes, or type2_diabetes conditions.
Clinical or Translational Implications
While this specific visualization does not reveal differential changes in Mast cell proportions related to diabetes progression, it serves as a foundational quality control step. It confirms that Mast cells, which are known to play roles in inflammation, immunity, and tissue remodeling, are consistently present and detectable in the single-cell dataset across all disease states. This baseline understanding is essential for any subsequent differential expression (DEG), gene set enrichment (GSEA), or cell-cell interaction (CCI) analyses focused on Mast cell function in pancreatic diabetes. Their consistent presence suggests that these cells are integral components of the pancreatic microenvironment in health and disease, warranting further investigation into their specific molecular states and interactions.
6. Pancreatic Macrophage Subtype Composition Changes Across Diabetes Progression
[Analysis Visualization Results]...
Analysis Overview
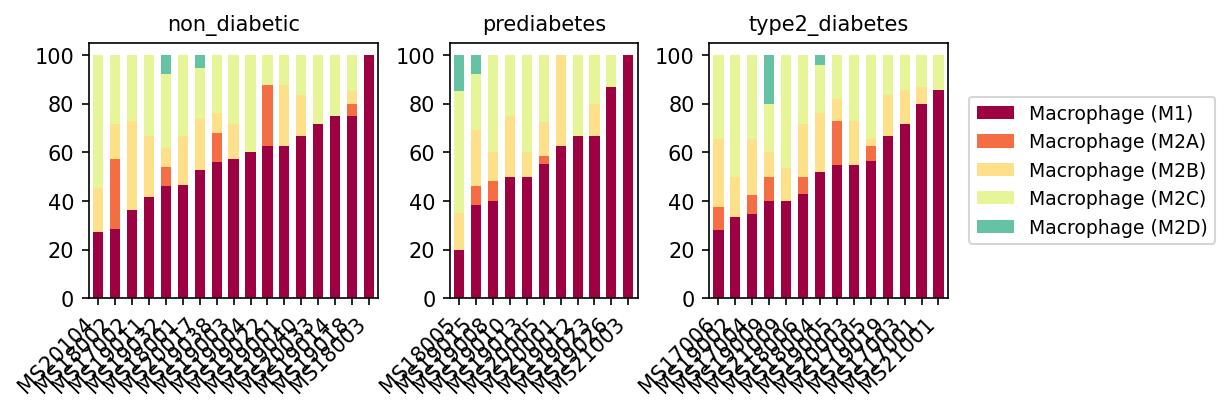
This analysis visualizes the proportional distribution of different macrophage subsets (M1, M2A, M2B, M2C, M2D) within the total macrophage population across individual samples from the pancreas, grouped by disease condition: non_diabetic, prediabetes, and type2_diabetes. The goal is to identify shifts in macrophage polarization that may be associated with diabetes development and progression.
Visual Summary
The visualization consists of three stacked bar plots, one for each condition (non_diabetic, prediabetes, type2_diabetes), with individual samples displayed along the x-axis and the proportion of each macrophage subset on the y-axis (0-100%).
Key observations from the plots are:
- Dominance of M1 Macrophages: Macrophage (M1) (dark red) is the most abundant subtype across all conditions and nearly all samples, consistently comprising a significant portion of the total macrophage population.
- Trend towards increased M1 in Diabetes: There is a notable trend of increasing M1 macrophage proportion from non_diabetic individuals through prediabetes, becoming most pronounced in type2_diabetes samples. In non_diabetic samples, M1 typically ranges from approximately 25% to 65% of the total macrophages. In prediabetes, M1 proportions often reach 40% to 70%. In type2_diabetes, M1 macrophages frequently exceed 60-70%, reaching up to 90% in some samples.
- Decreased M2 Subtypes: Concomitant with the increase in M1 macrophages, there appears to be a relative decrease in the proportions of other M2 subtypes, particularly Macrophage (M2C) (light green) and Macrophage (M2B) (light yellow), as the disease progresses from non_diabetic to type2_diabetes. Macrophage (M2A) (orange) shows variable proportions but also appears relatively diminished in some diabetic samples compared to non-diabetic ones.
- Minimal M2D Presence: Macrophage (M2D) (teal) is present in very small proportions, or is entirely absent, in most samples across all conditions.
Biological Interpretation
Macrophages are critical immune cells involved in both initiation and resolution of inflammation, and their polarization into distinct functional subsets (M1 and various M2 types) dictates their role in tissue homeostasis and disease.
- M1 Macrophages and Inflammation: M1 macrophages are characterized by a pro-inflammatory phenotype, promoting immune responses and tissue damage through the production of inflammatory cytokines. The observed progressive increase in M1 macrophage proportion from non_diabetic to prediabetes and full-blown type2_diabetes strongly suggests an escalating pro-inflammatory environment within the pancreas during the course of diabetes. Chronic low-grade inflammation in the pancreatic islets is a well-established factor contributing to beta-cell dysfunction and death, which underlies the development and progression of type 2 diabetes [1].
- M2 Macrophages and Resolution/Repair: M2 macrophages are a heterogeneous group generally associated with anti-inflammatory responses, tissue repair, and immune regulation.
- M2A macrophages are involved in Th2 responses, allergic inflammation, and parasite clearance, and tissue repair.
- M2B macrophages are linked to immune regulation and can produce both pro- and anti-inflammatory mediators.
- M2C macrophages typically exhibit immune suppressive properties, promoting efferocytosis and tissue remodeling.
The relative decrease in these M2 subsets, particularly M2C, implies a diminished capacity for resolving inflammation and repairing tissue damage in the diabetic pancreas, further exacerbating the inflammatory burden.
This shift in macrophage polarization towards an M1-dominant, pro-inflammatory state aligns with the understanding of type 2 diabetes as a chronic inflammatory metabolic disease. The increasing M1 presence likely contributes to insulitis (inflammation of pancreatic islets), beta-cell stress, and impaired insulin secretion and sensitivity.
Clinical or Translational Implications
The distinct shift in macrophage populations identified in this analysis has several potential clinical implications:
- Biomarker for Disease Progression: The ratio or absolute proportion of M1 macrophages relative to M2 subtypes could serve as a valuable biomarker for monitoring the inflammatory status and progression of type 2 diabetes. While direct pancreatic sampling is invasive, exploring these shifts in accessible peripheral tissues or through advanced imaging techniques could provide diagnostic or prognostic insights.
- Therapeutic Targets: Modulating macrophage polarization represents a promising therapeutic strategy for type 2 diabetes. Interventions aimed at suppressing M1 polarization or promoting M2 polarization (especially M2C for resolution and repair) could help to mitigate pancreatic inflammation, protect beta cells, and potentially slow or reverse disease progression [2]. This could involve novel pharmacological agents or immunomodulatory therapies.
- Understanding Pathogenesis: These findings reinforce the central role of immune cell dysfunction, specifically macrophage dysregulation, in the pathogenesis of type 2 diabetes, offering a single-cell resolution perspective on the inflammatory landscape of the human diabetic pancreas.
---
References
- Macrophage polarization and diabetes:
PubMed search: Macrophage polarization diabetes pancreas inflammation
https://pubmed.ncbi.nlm.nih.gov/?term=macrophage+polarization+diabetes+pancreas+inflammation
- Macrophage polarization as a therapeutic strategy:
PubMed search: macrophage polarization therapy diabetes
https://pubmed.ncbi.nlm.nih.gov/?term=macrophage+polarization+therapy+diabetes
7. Condition-Specific Cell-Cell Interaction Patterns in Pancreatic Disease Progression
[Analysis Visualization Results]...
Analysis Overview
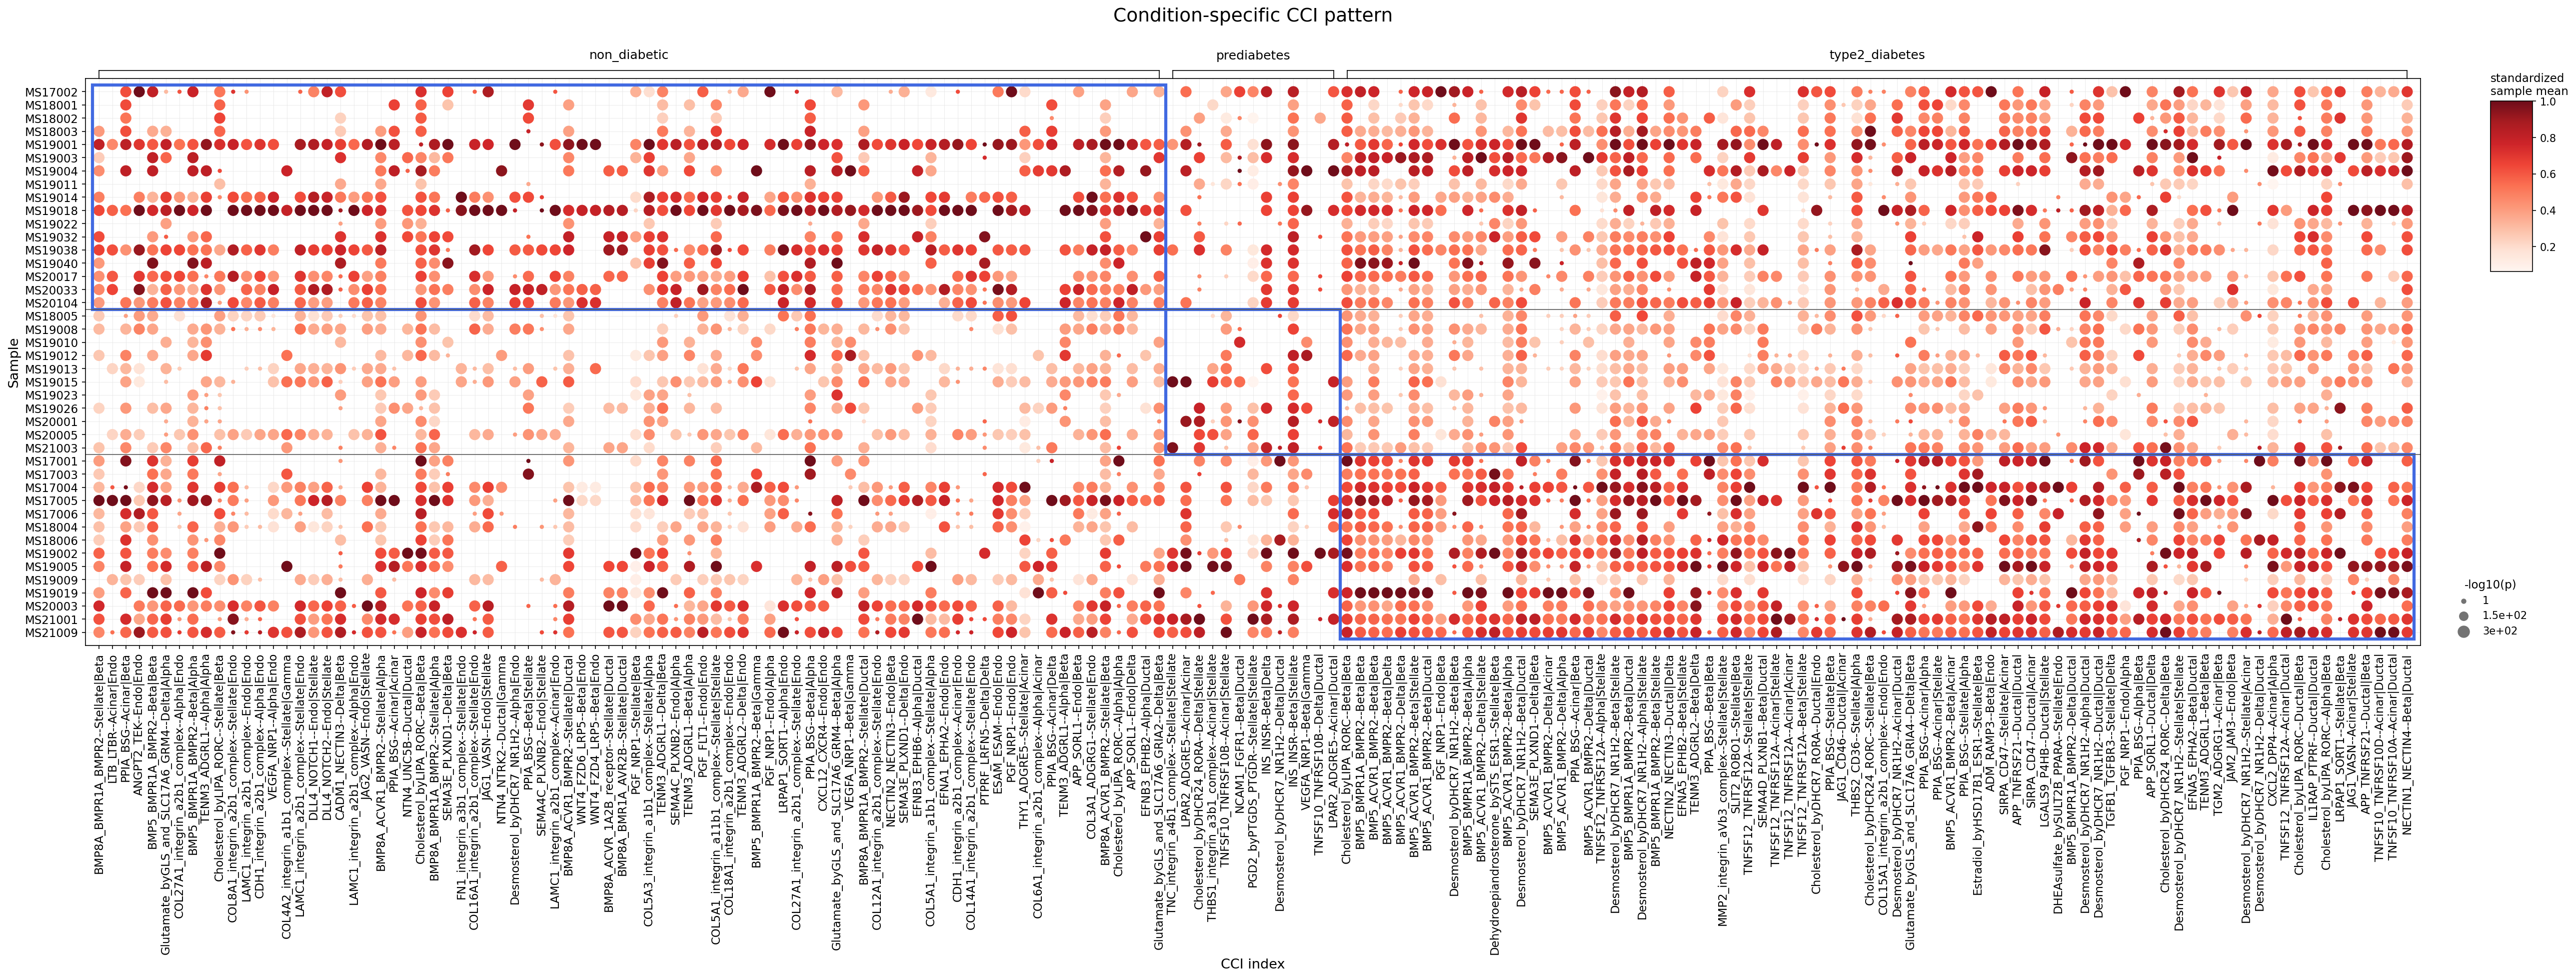
This analysis investigates condition-specific cell-cell interaction (CCI) patterns within the human pancreas, derived from single-cell RNA-sequencing data. Using the CellPhoneDB algorithm, ligand-receptor interactions were quantified across individual samples from three conditions: non_diabetic, prediabetes, and type2_diabetes. The visualization displays the activity of up to 80 statistically significant CCIs, selected to highlight differences across conditions, showing the standardized mean interaction strength (dot color) and significance (-log10(p-value), dot size) for each interaction in every sample.
Visual Summary
The dot plot effectively illustrates the complex and dynamic nature of intercellular communication in the pancreas during the progression from a non-diabetic state through prediabetes to overt type 2 diabetes.
- Distinct Condition-Specific Signatures: Each condition exhibits a unique landscape of active CCIs. The overall intensity and pattern of interactions vary markedly across non_diabetic, prediabetes, and type2_diabetes groups.
- Heterogeneity within Conditions: Significant variability in CCI strength and significance is apparent among individual samples within each condition, suggesting patient-specific differences or sub-phenotypes.
- Attenuation in Prediabetes: Many CCIs that are prominent and robustly active in non_diabetic samples appear to be attenuated or show reduced strength (lighter red color, smaller dot size) in the prediabetes condition. This suggests a potential disruption or weakening of communication networks during the early stages of metabolic dysfunction.
- Intensification and Rewiring in Type 2 Diabetes: In stark contrast to prediabetes, the type2_diabetes condition demonstrates a widespread intensification of many CCIs. Numerous interactions that were strong in the non-diabetic state and diminished in prediabetes show a resurgence or even heightened activity in type 2 diabetes. Furthermore, distinct sets of CCIs become highly active in type 2 diabetes, indicating a significant pathological rewiring of the pancreatic microenvironment. For instance, the cluster of CCIs on the far right of the plot shows consistently strong signals across many type2_diabetes samples.
Biological Interpretation
The observed shifts in CCI patterns highlight critical biological processes underlying the development and progression of Type 2 Diabetes (T2D) in the pancreas.
- Disruption of Pancreatic Homeostasis in Prediabetes: The general reduction in many CCIs during prediabetes suggests an early breakdown in the coordinated communication essential for maintaining normal islet function and pancreatic integrity. This could involve diminished paracrine signaling between islet cells (Alpha, Beta, Delta) or impaired cross-talk between islet cells and their supporting microenvironment (e.g., endothelial, stromal cells). Such disruptions may contribute to progressive β-cell dysfunction and reduced insulin secretion characteristic of prediabetes.
- Inflammation and Fibrosis in Type 2 Diabetes: The pervasive increase and rewiring of CCIs in type2_diabetes point towards active pathological processes.
- Extracellular Matrix (ECM) Remodeling and Fibrosis: Interactions involving Stellate cells and ECM components (e.g., COL12A1, FN1, LAMC1 interacting with integrin_a2b1_complex on Endothelial cells) show increased activity in type2_diabetes. Pancreatic stellate cells are key drivers of fibrosis, and excessive ECM deposition can compromise islet function, vascularization, and overall pancreatic architecture in diabetes [1].
- Inflammatory Signaling: Specific pathways such as TNFSF12_TNFRSF12A (TWEAK-Fn14) between Stellate and Beta cells appear to be dynamically regulated. This axis is known to mediate inflammatory responses, contributing to β-cell dysfunction and apoptosis, a critical factor in T2D progression [2].
- Dysregulated Metabolic Pathways: Interactions involving Desmosterol_byDHCR7_NR1H2 (cholesterol-related lipid signaling through nuclear receptors like LXRs) between various cell types (e.g., Stellate|Beta, Acinar|Beta, Ductal|Delta) indicate altered lipid metabolism. LXRs play a role in lipid homeostasis and inflammation, and their dysregulation is implicated in the metabolic derangements of T2D [3].
- Compromised Islet-Microenvironment Axis: Changes in interactions involving BMP signaling (e.g., BMP8A_BMPR1A_BMPR2 between Stellate or Ductal cells and Beta cells) reflect alterations in crucial regulatory pathways. BMPs are vital for pancreatic development, β-cell differentiation, proliferation, and survival [4]. Their altered signaling suggests a disruption in the paracrine support necessary for islet health. Interactions involving APP (Amyloid Precursor Protein) and ADGRL1 between Alpha and Beta cells or Endothelial cells may also be relevant to islet amyloidosis, a pathological hallmark of T2D characterized by IAPP deposition and β-cell damage [5].
Clinical or Translational Implications
The comprehensive mapping of condition-specific CCI patterns offers valuable clinical and translational avenues:
- Novel Biomarkers for Disease Progression: The distinct CCI signatures observed in prediabetes and type2_diabetes could serve as promising diagnostic or prognostic biomarkers. Specific ligand-receptor pairs or cell-cell interaction modules that show significant shifts could be further investigated as non-invasive indicators of disease status or risk of progression.
- Identification of Therapeutic Targets: The dysregulated CCIs represent potential targets for therapeutic intervention.
- Blocking pro-fibrotic Stellate-Endothelial ECM-integrin interactions could reduce pancreatic fibrosis, thereby improving islet function and preventing β-cell loss.
- Modulating inflammatory pathways like the TNFSF12-TNFRSF12A axis could alleviate β-cell stress and preserve their function.
- Interventions targeting altered metabolic signaling, such as those involving cholesterol-related pathways, might help restore metabolic homeostasis in the pancreas.
- Enhanced Understanding of Pathogenesis: This systems-level analysis moves beyond single-cell dysfunction to reveal the complex interplay within the pancreatic microenvironment. These findings provide a framework for deeper mechanistic studies into how altered cellular communication contributes to the initiation and progression of T2D.
---
References
- For general information on pancreatic stellate cells and fibrosis in diabetes: PubMed Search: pancreatic stellate cells diabetes fibrosis
- For TWEAK-Fn14 signaling in pancreatic β-cell dysfunction: PubMed Search: TWEAK Fn14 beta cell diabetes
- For LXR (NR1H2) and metabolism in diabetes: PubMed Search: LXR diabetes metabolism
- For BMP signaling in pancreatic development and islet function: PubMed Search: BMP signaling pancreas islet
- For APP and islet amyloidosis in diabetes: PubMed Search: APP islet amyloid diabetes
8. Condition-Specific Cell-Cell Interaction Patterns in Pancreatic Immune and Stromal Cells
[Analysis Visualization Results]...
Analysis Overview
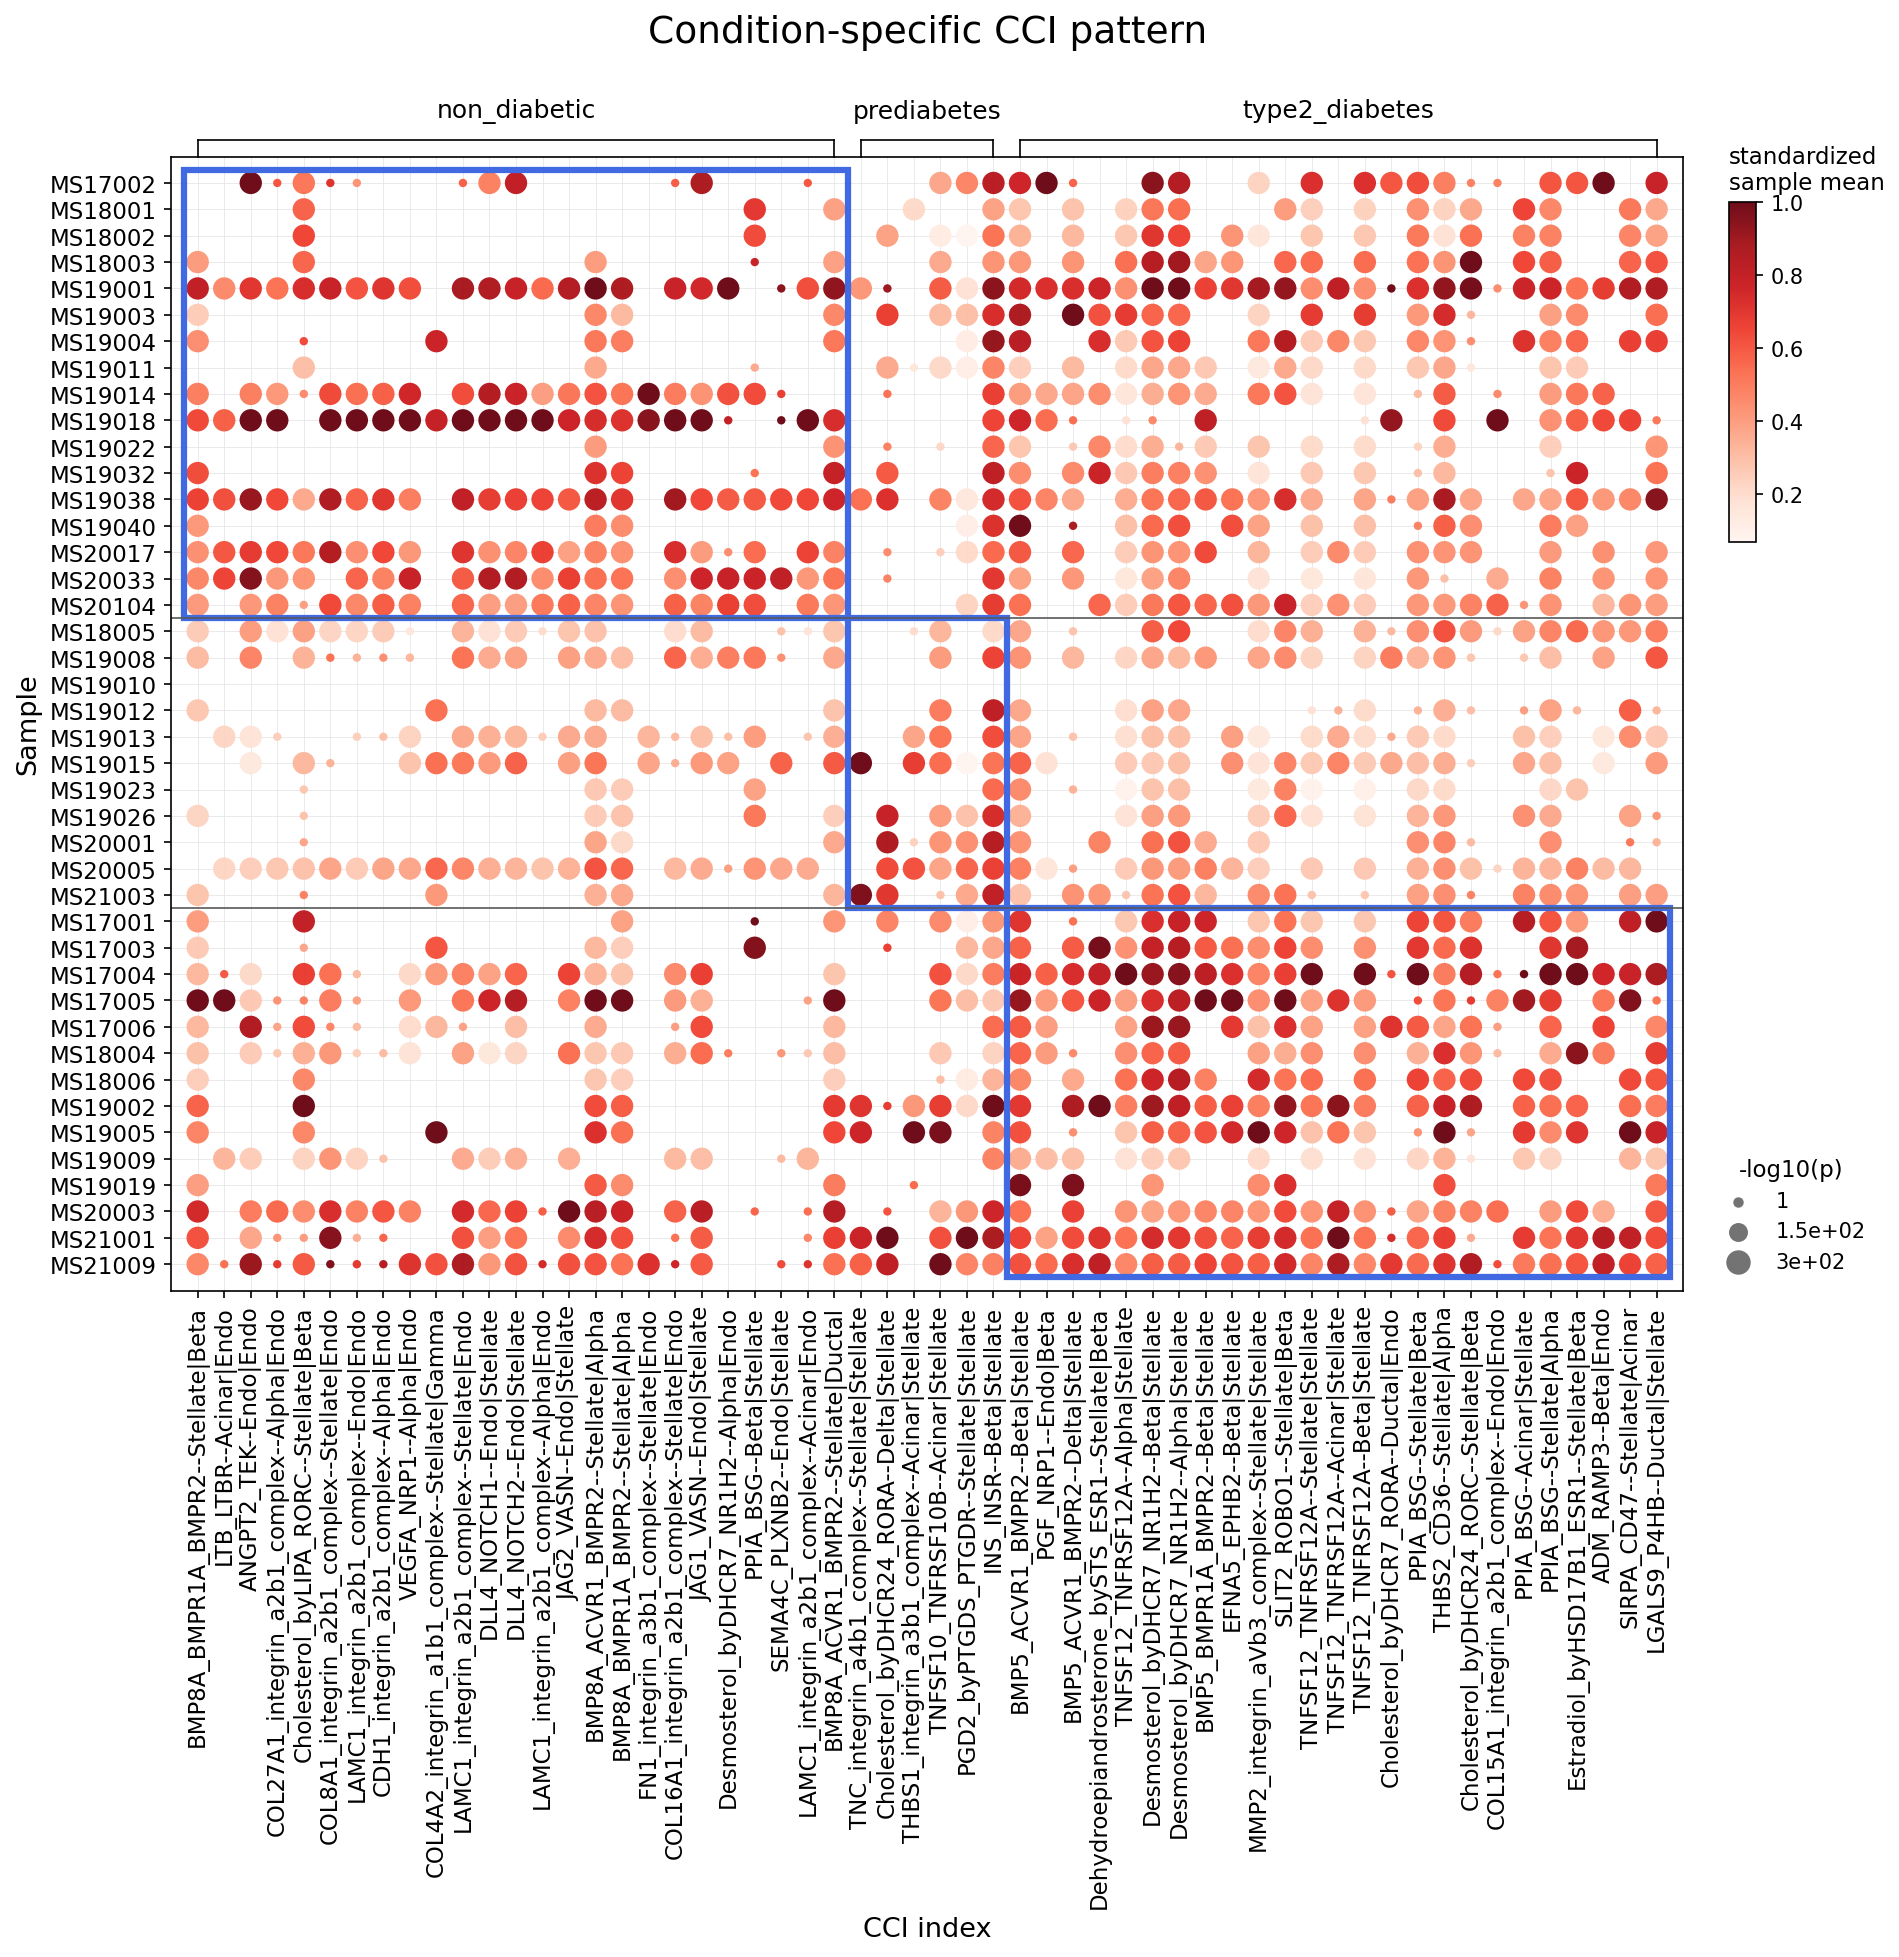
This analysis investigates statistically significant differences in cell-cell interactions (CCIs) involving major immune and stromal cells across different glycemic conditions in the human pancreas: non_diabetic, prediabetes, and type2_diabetes. The selected target cells for this analysis are Macrophages, Mast cells, Stellate cells, Endothelial cells, Smooth muscle cells, and Fibroblasts. The dot plot visualizes the standardized mean interaction strength (color intensity) and the statistical significance (-log10(p-value), dot size) of various ligand-receptor pairs between cell types, for individual samples grouped by their disease condition. The visualization focuses on the top 25 statistically significant interactions per condition.
Visual Summary
The dot plot effectively illustrates distinct patterns of cell-cell communication across the different glycemic states:
- Overall Trend: There is a clear visual gradient of increasing cell-cell interaction strength and significance from non_diabetic to prediabetes and most notably to type2_diabetes. Samples from type2_diabetes generally exhibit a higher density of larger, darker red dots, indicating more numerous, stronger, and more statistically significant interactions compared to non_diabetic and prediabetes samples.
- non_diabetic Condition: While some interactions show moderate strength (lighter red, smaller to medium-sized dots), the overall pattern is one of fewer and less intense interactions compared to the other conditions. Certain interactions, particularly those involving integrin complexes (e.g., CDH1_integrin_a2b1_complex--Alpha|Endo), show activity in specific non-diabetic samples.
- prediabetes Condition: This state presents an intermediate phenotype. Many interactions, especially those involving Endothelial and Stellate cells (e.g., LAMC1_integrin_a1b1_complex--Endo|Stellate, DLL4_NOTCH1--Endo|Stellate), show increased strength and significance compared to non_diabetic samples, suggesting the onset of pancreatic microenvironmental changes.
- type2_diabetes Condition: This condition is characterized by a widespread and pronounced increase in CCI activity. Many ligand-receptor pairs, especially those involving Stellate cells interacting with islet cells (Alpha, Beta), Acinar cells, or Endothelial cells, show strong signals (darkest red, largest dots). This suggests a significantly altered and highly active pancreatic microenvironment.
- Key Interaction Categories: Interactions involving integrin complexes (e.g., MMP2_integrin_avb3_complex--Stellate|Beta, COL15A1_integrin_a2b1_complex--Endo|Stellate), TNF superfamily members (e.g., TNFSF12-TNFRSF12A--Acinar|Stellate), BMP signaling (e.g., BMP5_ACVR1_BMPR2--Beta|Stellate), and growth factors (e.g., VEGFA_NRP1--Alpha|Endo, PGF_NRP1--Endo|Beta) are highly prominent in the diabetic state.
Biological Interpretation
The observed changes in cell-cell interactions provide critical insights into the pancreatic pathology associated with diabetes progression:
- Increased Stromal Remodeling and Fibrosis via Stellate Cells: Pancreatic Stellate Cells (PSCs) emerge as central players in the altered microenvironment of prediabetes and type 2 diabetes.
- Interactions such as TNFSF12-TNFRSF12A--Acinar|Stellate and TNFSF12-TNFRSF12A--Beta|Stellate indicate increased activity of the TNF superfamily signaling axis, which is known to mediate inflammation and fibrosis. TNFSF12 (TWEAK) and its receptor TNFRSF12A (Fn14) play roles in various inflammatory and tissue remodeling processes [GeneCards].
- The strong signal for MMP2_integrin_avb3_complex--Stellate|Beta in type 2 diabetes is highly significant. Matrix metalloproteinase 2 (MMP2) is a key enzyme in extracellular matrix (ECM) degradation and remodeling, and its interaction with integrin alphaVbeta3 highlights active fibrotic processes and changes in cell adhesion and migration between PSCs and beta cells. Pancreatic fibrosis, driven by activated PSCs, is a hallmark of progressive diabetes [PubMed Search].
- Other integrin-mediated interactions involving stellate cells (e.g., COL8A1_integrin_a2b1_complex--Stellate|Endo, LAMC1_integrin_a1b1_complex--Endo|Stellate) further underscore the dynamic ECM remodeling and altered cell-cell/cell-matrix adhesion in diabetic conditions.
- PPIA_BSG--Beta|Stellate and PPIA_BSG--Acinar|Stellate are also prominent in T2D. PPIA (cyclophilin A) and Basigin (BSG/CD147) are involved in inflammation, matrix metalloproteinase induction, and cell survival, contributing to a pro-inflammatory and pro-fibrotic environment [UniProt].
- Dysregulated Angiogenesis and Vascular Integrity through Endothelial Cells: Endothelial cells are consistently implicated in altered CCIs, particularly in prediabetes and type 2 diabetes.
- DLL4_NOTCH1--Endo|Stellate is notably active, suggesting dysregulation of Notch signaling, which is crucial for endothelial cell differentiation, arterial specification, and pathological angiogenesis [PubMed Search]. This interaction between endothelial cells and stellate cells could contribute to altered islet vascularization and microenvironmental changes.
- Interactions involving growth factors like VEGFA_NRP1--Alpha|Endo and PGF_NRP1--Endo|Beta are elevated in diabetes. VEGFA and PGF are potent angiogenic factors, and their increased signaling suggests an attempt at reparative angiogenesis or, conversely, dysfunctional vascular remodeling that fails to adequately support islet function [PubMed Search].
- Metabolic Crosstalk and Inflammation:
- Desmosterol_byDHCR7_NR1H2--Alpha|Stellate and --Beta|Stellate interactions are observed, particularly in type 2 diabetes. Desmosterol, an intermediate in cholesterol synthesis, can activate liver X receptors (LXRs), including NR1H2 (LXRβ). LXR signaling plays roles in lipid metabolism, cholesterol homeostasis, and inflammation. Elevated activity suggests altered lipid metabolism and inflammatory signaling between islet cells and PSCs in diabetes [PubMed Search].
- The increased activity of BMP signaling pathways, e.g., BMP5_ACVR1_BMPR2--Beta|Stellate, points to altered growth factor signaling that can influence cell differentiation, proliferation, and inflammation in the pancreatic microenvironment.
Clinical or Translational Implications
The robust changes in cell-cell interactions identified in this analysis have several important clinical and translational implications for type 2 diabetes:
- Therapeutic Targets: The prominent involvement of pancreatic stellate cells and endothelial cells, and the specific ligand-receptor pairs highlighted, represent promising therapeutic targets. Modulating interactions like TNFSF12-TNFRSF12A, MMP2-integrin_avb3, or DLL4-NOTCH1 could potentially mitigate pancreatic fibrosis, inflammation, and vascular dysfunction, thereby preserving beta-cell mass and function.
- Biomarkers of Disease Progression: The distinct patterns observed across non-diabetic, prediabetes, and type 2 diabetes conditions suggest that changes in these specific CCI profiles could serve as early biomarkers for the progression of pancreatic dysfunction towards overt diabetes. Monitoring the activity of these interactions might help identify individuals at high risk or track disease severity.
- Understanding Pathogenesis: This analysis deepens our understanding of how the pancreatic microenvironment is actively remodeled during diabetes progression through complex cellular crosstalk. Targeting these specific intercellular communication pathways could offer novel strategies beyond current glucose-centric treatments to address the underlying cellular and tissue pathology of type 2 diabetes.
9. Surfaceome Marker Gene Expression Across Pancreatic Cell Subsets

[Analysis Visualization Results]...
Analysis Overview
This analysis visualizes the expression of surfaceome marker genes across various celltype_subset groups identified in the human pancreas single-cell RNA-seq dataset. The primary goal is to identify unique surface-expressed markers that characterize each cell type, serving to validate the existing cell type annotations. While the initial user query requested "condition-specific markers for Fibroblasts," the parameters used for this plot (deg_key: None, target_cell: None) resulted in the identification and visualization of *general* surfaceome markers for all sufficiently represented cell types, rather than markers specific to particular conditions or exclusively for fibroblasts. Fibroblast-like cells are represented by "Stellate cells" in this plot. The focus of the interpretation is on how well these surfaceome markers support the assigned cell identities.
Visual Summary
The provided dot plot effectively displays the expression patterns of identified surfaceome markers across different pancreatic cell subsets.
- Axes: The Y-axis lists the celltype_subset annotations, while the X-axis displays individual gene symbols.
- Dot Size: The size of each dot indicates the fraction of cells within that group expressing the gene (from 0% to 100%).
- Dot Color: The intensity of the red color indicates the mean expression level of the gene within that cell group, with darker red signifying higher average expression.
- Overall Pattern: The plot demonstrates clear cell-type specificity, with distinct blocks of highly expressed and prevalent markers (dark red, large dots) primarily confined to their respective cell type rows, often highlighted by red bounding boxes. This suggests that highly specific surfaceome markers were successfully identified for most of the included cell subsets. Genes commonly expressed across multiple cell types (more than 3 groups, based on rem_mkrs_common_in_N_groups_or_more: 3) have likely been filtered out, enhancing the specificity of the displayed markers.
Biological Interpretation (Annotation Notes)
The identified surfaceome markers provide strong support for the distinct identities of the various pancreatic cell subsets.
- Acinar cells: Highly specific markers include REG1A, PRSS2, SPINK1, CTRB1, CELA3A, CPA1, CPB1, and PNLIP. These genes encode digestive enzymes and enzyme inhibitors, which are characteristic products of pancreatic acinar cells responsible for exocrine function. GeneCards: REG1A, GeneCards: PRSS2
- Alpha cells: Show strong expression of GCG (Glucagon), CHGA (Chromogranin A), and ALDH1A1. Glucagon is the primary hormone secreted by alpha cells, and Chromogranin A is a general neuroendocrine marker. GeneCards: GCG
- Beta cells: Characterized by robust expression of INS (Insulin), IAPP (Islet Amyloid Polypeptide), and PCSK1. Insulin is the hallmark hormone of beta cells, IAPP is co-secreted with insulin, and PCSK1 is involved in prohormone processing. GeneCards: INS
- Delta cells: Uniquely marked by SST (Somatostatin), consistent with their known role in regulating islet hormone secretion. GeneCards: SST
- Ductal cells: Display prominent expression of KRT19 (Keratin 19) and CFTR (Cystic Fibrosis Transmembrane Conductance Regulator). KRT19 is a widely recognized ductal epithelial marker, and CFTR is crucial for ductal fluid and bicarbonate secretion. GeneCards: KRT19
- Endothelial tip cells: Show specific markers such as ANGPT2, DLL4, and ESM1. These genes are involved in angiogenesis, Notch signaling, and endothelial cell function, consistent with the specialized role of tip cells in vessel sprouting. GeneCards: ANGPT2
- Gamma (PP) cells: Strongly express PPY (Pancreatic Polypeptide), confirming their identity as PP-secreting cells within the pancreatic islets. GeneCards: PPY
- Macrophage (M1), (M2B), (M2C) cells: These macrophage subsets share markers like CD36, MSR1, SOCS3, and SRGN. CD36 is a scavenger receptor, MSR1 is a macrophage scavenger receptor, and SOCS3 is an immune regulator. While these markers support a general macrophage identity, further specific markers or deeper analysis might be needed for definitive sub-classification based *solely* on this plot. GeneCards: CD36, GeneCards: MSR1
- Mast cells: Distinctly express TPSAB1 and TPSB2 (Tryptase Alpha/Beta 1 and 2), which are characteristic proteases found in mast cell granules. GeneCards: TPSAB1
- Smooth muscle cells: Marked by MYL9, CALD1, and TPM2, genes encoding components of the contractile apparatus, consistent with smooth muscle cell function. GeneCards: MYL9
- Stellate cells: Show robust and specific expression of COL1A1, COL1A2, COL3A1, COL6A1, COL6A3 (various Collagen genes), FN1 (Fibronectin 1), PDGFRB (Platelet Derived Growth Factor Receptor Beta), SPARC, and TIMP3. These markers are highly characteristic of pancreatic stellate cells, which are critical for extracellular matrix production and remodeling, resembling fibroblasts. This strongly supports the annotation of these cells. GeneCards: COL1A1, GeneCards: FN1
Annotation Notes
- The plot_markers_and_expression_dot tool successfully identified unique surfaceome markers for various celltype_subset annotations within the pancreas. The high specificity and biological relevance of these markers (e.g., hormone genes for islet cells, digestive enzymes for acinar cells, extracellular matrix components for stellate cells) provide strong validation for the quality of the cell type annotations.
- While the initial query mentioned "Fibroblasts," the plot displays "Stellate cells." Pancreatic stellate cells are the primary fibroblast-like cells in the pancreas and their characteristic markers, indicating extracellular matrix synthesis and remodeling, are clearly evident. Other celltype_subset categories mentioned in the data context (e.g., unassigned, Endothelial cell, Macrophage (M2A), Macrophage (M2D), Lymphatic Endothelial cell, Fibroblast explicitly) are not present in the plot. This could be due to filtering criteria such as N_cells_per_group_min (set to 40) or the inability to identify a sufficient number of *unique surfaceome* markers under the applied find_cfg parameters.
- This visualization is excellent for assessing cell identity based on surface-expressed genes, which is particularly useful for downstream applications such as flow cytometry or cell sorting. However, as deg_key was None, this plot does not provide insights into condition-specific changes in marker expression.
10. Pancreatic Mast Cell Condition-Specific Surfaceome Markers in Diabetes Progression
[Analysis Visualization Results]...
Analysis Overview
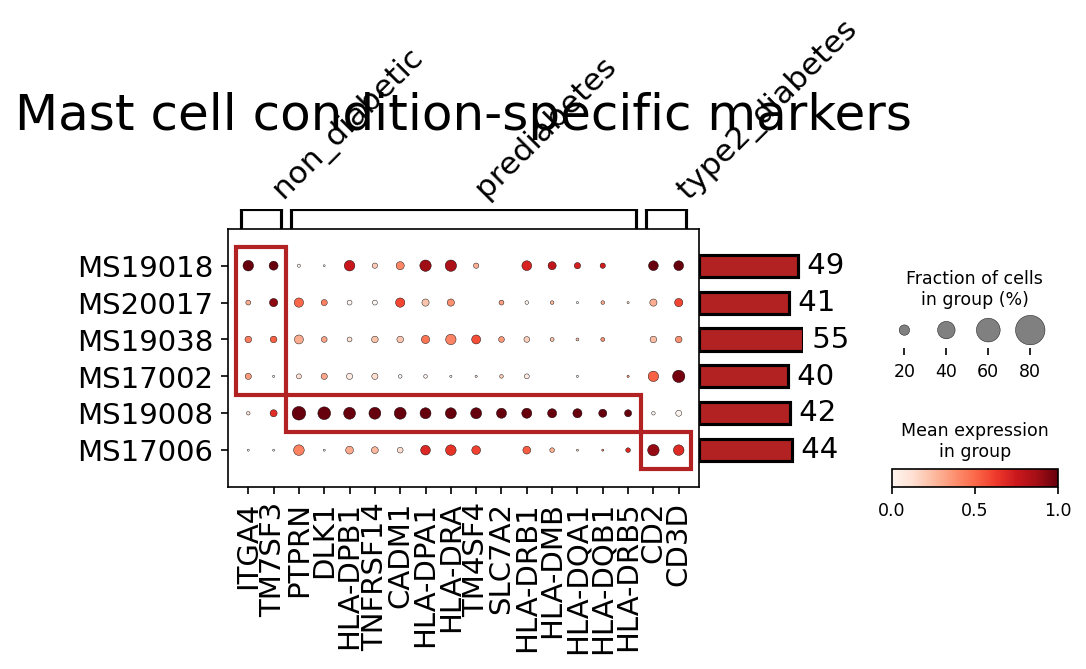
This analysis identifies condition-specific surfaceome markers for Mast cells in human pancreatic tissue, comparing non-diabetic, prediabetic, and type 2 diabetic states. The visualization, a dot plot, displays the mean expression level and the fraction of cells expressing each marker gene across individual samples, grouped by their respective disease conditions. Only surfaceome genes exhibiting a significant fold change (FC > 1.5, p-value < 0.05) and not commonly expressed across all conditions were selected to highlight distinct cellular phenotypes.
Visual Summary
The dot plot effectively visualizes patterns of gene expression in Mast cells across different disease conditions, with samples grouped under 'non_diabetic', 'prediabetes', and 'type2_diabetes'.
- Non-Diabetic Condition (Samples MS19018, MS20017, MS19038, MS17002): A distinct cluster of surfaceome genes, including ITGA4, TM7SF3, PTPRN, and DLK1, show higher expression (darker red) and prevalence (larger dot size) primarily in sample MS19018, and to a lesser extent in other non-diabetic samples. These markers appear to characterize the basal Mast cell state in healthy pancreatic tissue.
- Prediabetes Condition (Sample MS19008): Mast cells from the prediabetic sample exhibit a striking upregulation of multiple Major Histocompatibility Complex (MHC) class II related genes. These include HLA-DPB1, HLA-DPA1, HLA-DRA, HLA-DRB1, HLA-DMB, HLA-DQA1, HLA-DQB1, and HLA-DRB5. Other notable markers in this condition include TNFRSF14, CADM1, TM4SF4, and SLC7A2. These genes show high mean expression and a large fraction of expressing cells, indicating a robust and specific transcriptional shift in prediabetes.
- Type 2 Diabetes Condition (Sample MS17006): In the type 2 diabetes sample, CD2 and CD3D emerge as highly expressed and prevalent surfaceome markers. This suggests a unique Mast cell phenotype associated with established type 2 diabetes.
Overall, the plot clearly demonstrates distinct condition-specific surface marker profiles for pancreatic Mast cells, indicating their potential involvement and phenotypic shifts during the progression from a non-diabetic state to prediabetes and then to type 2 diabetes. The sample-level view also highlights some intra-group variability, particularly within the non-diabetic samples.
Biological Interpretation
The observed condition-specific surfaceome markers provide critical insights into the dynamic roles of pancreatic Mast cells in diabetes progression.
- Non-Diabetic Mast Cell Phenotype: Genes like ITGA4 (Integrin alpha-4) [GeneCards: ITGA4 GeneCards] suggest a baseline involvement in cell adhesion and potentially immune cell trafficking within the healthy pancreatic microenvironment. DLK1 has roles in adipogenesis and glucose metabolism [GeneCards: DLK1 GeneCards], which could reflect a contribution of Mast cells to metabolic homeostasis. These markers likely reflect normal Mast cell function and interactions.
- Prediabetes: Heightened Immunogenicity and Antigen Presentation: The strong upregulation of a comprehensive suite of MHC class II genes (HLA-DPB1, HLA-DPA1, HLA-DRA, HLA-DRB1, HLA-DMB, HLA-DQA1, HLA-DQB1, HLA-DRB5) is a profound finding. MHC class II molecules are critical for presenting exogenous antigens to CD4+ T helper cells, thereby initiating adaptive immune responses. While classically associated with professional antigen-presenting cells (APCs) like dendritic cells and macrophages, Mast cells are known to express MHC-II and can function as APCs, especially upon activation [PubMed search: "mast cells MHC class II antigen presentation" PubMed Search]. This suggests that in prediabetes, pancreatic Mast cells may adopt a more activated, antigen-presenting phenotype, potentially contributing to islet inflammation and the development of autoimmune components, or influencing T-cell mediated responses that can drive beta-cell dysfunction. The co-expression of TNFRSF14 (HVEM) [GeneCards: TNFRSF14 GeneCards], a co-stimulatory molecule, further supports an enhanced immune-regulatory role.
- Type 2 Diabetes: Activated or Atypical Immune Phenotype: The emergence of CD2 [GeneCards: CD2 GeneCards] and CD3D [GeneCards: CD3D GeneCards] as specific markers in type 2 diabetes is intriguing. While CD2 is widely found on T cells and NK cells, its expression on Mast cells can indicate specific activation states or subsets. CD3D is a component of the T-cell receptor (TCR) complex, typically associated with T cells. Its presence on Mast cells, though less common, has been reported in certain contexts and could signify either an atypical Mast cell subset, acquisition of T-cell-like characteristics, or potentially even membrane transfer from interacting T cells. Regardless of the exact mechanism, this profile points towards a highly distinct and potentially activated immune phenotype of Mast cells in established type 2 diabetes, which may contribute to chronic inflammation, islet fibrosis, or altered immune cell crosstalk within the diabetic pancreas.
Clinical or Translational Implications
These findings have significant implications for understanding the pathophysiology of diabetes and for developing novel diagnostic and therapeutic strategies.
- Biomarker Discovery: The identified condition-specific surfaceome markers could serve as invaluable biomarkers. HLA gene expression on pancreatic Mast cells could be explored as a diagnostic or prognostic marker for distinguishing prediabetes, potentially indicating individuals at higher risk of progression to overt diabetes. Similarly, CD2/CD3D expression could mark advanced stages of the disease. While challenging to assess in vivo for pancreatic cells, these markers could be detected in tissue biopsies or potentially through circulating extracellular vesicles.
Therapeutic Targets:
- Prediabetes Intervention: The strong MHC Class II signature in prediabetic Mast cells suggests they are active antigen-presenting cells. Modulating this activity, for instance, by targeting MHC Class II molecules or their associated co-stimulatory receptors (TNFRSF14), could offer a strategy to dampen detrimental immune responses and inflammation early in diabetes progression. This could involve small molecule inhibitors or blocking antibodies.
- Type 2 Diabetes Intervention: The CD2/CD3D positive Mast cell population in type 2 diabetes represents a unique cell state that warrants further investigation. Understanding the functional consequences of these markers could reveal novel pathways for intervention to mitigate chronic inflammation or improve beta-cell function in established T2D.
- Experimental Validation: These single-cell RNA-seq findings provide a strong basis for further experimental validation. Techniques such as multiparameter flow cytometry or immunohistochemistry on pancreatic tissue sections from non-diabetic, prediabetic, and type 2 diabetic individuals would be crucial to confirm the protein expression of these surface markers and their cellular localization. Functional studies on isolated Mast cells or in co-culture systems would then be needed to elucidate the exact roles of these altered surfaceome profiles in Mast cell activation, cytokine production, and interaction with other immune or islet cells in the context of diabetes.
11. Gene Ontology Analysis of Upregulated Pathways in Pancreatic Acinar and Ductal Cells Across Diabetes Conditions
[Analysis Visualization Results]...
Analysis Overview
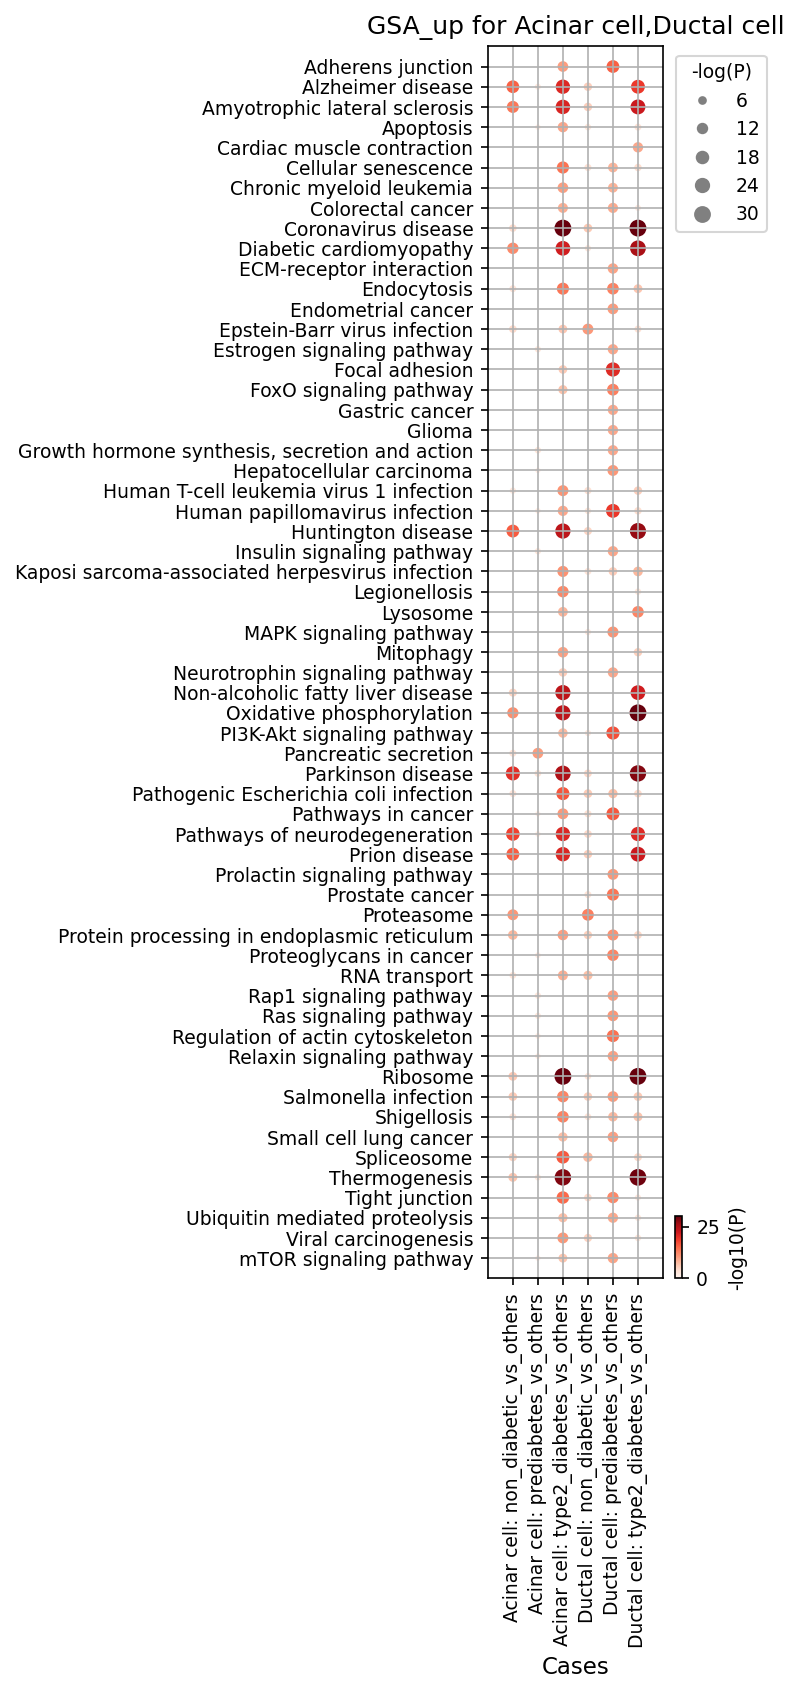
This analysis presents Gene Ontology (GO) enrichment results for upregulated genes (GSA_up) in pancreatic Acinar and Ductal cells. The enrichment was performed by comparing each specific condition (non_diabetic, prediabetes, type2_diabetes) against all other conditions combined ("_vs_others"). The results are visualized as a dot plot, where dot size and color intensity reflect the statistical significance (-log10(P-value)) of pathway enrichment. The primary goal is to identify biological processes and pathways that are significantly altered and potentially contribute to the pathophysiology of diabetes in these crucial pancreatic cell types.
Visual Summary
The dot plot displays the enrichment of 60 GO terms (pathways) across six comparison groups: Acinar cell in non_diabetic, prediabetes, and type2_diabetes conditions (each vs others), and Ductal cell in the same three conditions (each vs others).
Key observations from the plot:
- Strongest Signals in Type 2 Diabetes: The most prominent and statistically significant enrichments (largest, darkest red dots) are observed in both Acinar and Ductal cells when comparing the type2_diabetes condition against others. This indicates a substantial upregulation of specific biological pathways in these cells during overt Type 2 Diabetes (T2D).
- Progression with Disease State: Many pathways show an increase in significance (larger, darker dots) from non_diabetic_vs_others to prediabetes_vs_others and further to type2_diabetes_vs_others in both cell types. This suggests a progressive dysregulation of these pathways as the disease advances.
- Commonly Upregulated Pathways in T2D: A large set of pathways are highly significant in both Acinar and Ductal cells in T2D. These include:
- Metabolism & Energy: "Oxidative phosphorylation", "Thermogenesis", "Lysosome".
- Protein Homeostasis & Stress: "Protein processing in endoplasmic reticulum", "Ribosome", "Ubiquitin mediated proteolysis".
- Cell Signaling & Growth: "MAPK signaling pathway", "PI3K-Akt signaling pathway", "Pathways in cancer".
- Cell Structure & Adhesion: "Adherens junction", "Focal adhesion", "Regulation of actin cytoskeleton".
- Cell Fate: "Apoptosis".
- Neurodegeneration-related: "Huntington disease", "Parkinson disease", "Amyotrophic lateral sclerosis".
- Prediabetes Trends: In the prediabetes_vs_others comparisons, similar pathways as in T2D show moderate significance, albeit generally less pronounced than in the T2D state. This includes "Oxidative phosphorylation", "Protein processing in endoplasmic reticulum", "Ribosome", "Ubiquitin mediated proteolysis", and "Lysosome".
- Non-Diabetic Signatures: The non_diabetic_vs_others comparisons show fewer highly significant pathways compared to prediabetes and T2D. Some pathways, such as "Adherens junction", "Apoptosis", and "Focal adhesion", still exhibit some level of upregulation, which might reflect maintenance of baseline healthy processes that become altered in disease.
Biological Interpretation
The observed upregulation of specific GO pathways in pancreatic Acinar and Ductal cells provides crucial insights into the systemic impact of diabetes beyond the insulin-producing beta cells.
- Metabolic Dysregulation and Oxidative Stress: The strong enrichment of "Oxidative phosphorylation" and "Thermogenesis" in both Acinar and Ductal cells during prediabetes and T2D suggests altered energy metabolism and potentially increased mitochondrial activity or dysfunction. Coupled with the upregulation of "Lysosome", this points towards heightened metabolic demands, cellular stress, and altered catabolism, potentially leading to increased reactive oxygen species (ROS) production and oxidative stress. Oxidative stress is a known contributor to pancreatic damage and beta-cell dysfunction in diabetes [1].
- [1] PubMed search for "oxidative stress pancreas diabetes": https://pubmed.ncbi.nlm.nih.gov/?term=oxidative+stress+pancreas+diabetes
- ER Stress and Protein Homeostasis Perturbation: The significant upregulation of "Protein processing in endoplasmic reticulum", "Ribosome", and "Ubiquitin mediated proteolysis" indicates considerable stress on the cellular machinery responsible for protein synthesis, folding, and degradation. This points towards endoplasmic reticulum (ER) stress, a critical factor in the pathogenesis of diabetes, affecting both endocrine and exocrine pancreatic cells [2]. ER stress can impair cell function, promote inflammation, and induce apoptosis.
- [2] PubMed search for "ER stress pancreas diabetes": https://pubmed.ncbi.nlm.nih.gov/?term=ER+stress+pancreas+diabetes
- Altered Signaling and Cell Fate: The activation of "MAPK signaling pathway", "PI3K-Akt signaling pathway", and "Apoptosis" suggests changes in fundamental cell growth, survival, and death pathways. In diabetes, chronic hyperglycemia and hyperlipidemia can dysregulate these pathways, contributing to cellular dysfunction and eventual loss of pancreatic cells. Increased apoptosis could contribute to the overall decline in pancreatic function.
- Implications for Pancreatic Exocrine Function: While Acinar cells are responsible for digestive enzyme production and Ductal cells for bicarbonate secretion, the observed widespread cellular stress responses suggest that their normal functions are likely compromised in diabetes. Chronic stress and inflammation can impair enzyme secretion, ductal integrity, and overall exocrine output, potentially contributing to conditions like exocrine pancreatic insufficiency, which is more common in T2D [3].
- [3] PubMed search for "exocrine pancreatic insufficiency diabetes": https://pubmed.ncbi.nlm.nih.gov/?term=exocrine+pancreatic+insufficiency+diabetes
- Connections to Cancer Risk: The upregulation of "Pathways in cancer" and "Proteoglycans in cancer" is notable. Diabetes is a known risk factor for pancreatic cancer, and these pathways might indicate cellular changes (e.g., chronic inflammation, altered cell proliferation/survival, metabolic reprogramming) that predispose these cells to malignant transformation [4].
- [4] PubMed search for "diabetes pancreatic cancer risk": https://pubmed.ncbi.nlm.nih.gov/?term=diabetes+pancreatic+cancer+risk
- Shared Cellular Stress Mechanisms: The enrichment of pathways typically associated with neurodegenerative diseases (e.g., "Huntington disease", "Parkinson disease", "Amyotrophic lateral sclerosis") highlights shared molecular mechanisms of cellular stress, protein misfolding, and mitochondrial dysfunction that are common across various chronic and age-related diseases. This suggests a common pathogenic cellular response in pancreatic cells under diabetic stress.
Clinical or Translational Implications
The findings underscore that Type 2 Diabetes induces widespread cellular stress and metabolic dysregulation in both pancreatic Acinar and Ductal cells, not just the endocrine compartment.
- Holistic Pancreatic Health: Targeting these dysregulated pathways in Acinar and Ductal cells, such as mitigating ER stress or oxidative phosphorylation, could offer new therapeutic avenues to preserve overall pancreatic health and function in individuals with diabetes, potentially delaying or preventing complications like exocrine pancreatic insufficiency and reducing cancer risk.
- Early Biomarkers: The progressive upregulation of these pathways from prediabetes to T2D suggests they could serve as early biomarkers for pancreatic dysfunction, allowing for earlier intervention strategies.
- Drug Development: Identifying the specific genes within these enriched pathways could guide the development of novel therapeutic agents aimed at improving cellular resilience and reducing the detrimental effects of chronic metabolic stress in pancreatic exocrine cells.
- Cancer Surveillance: The activation of cancer-related pathways in diabetic pancreatic cells further emphasizes the need for vigilant surveillance for pancreatic cancer in high-risk diabetic populations.
12. Gene Set Enrichment Analysis (GSEA) of Pancreatic Cell Types in Diabetes Progression
[Analysis Visualization Results]...
Analysis Overview
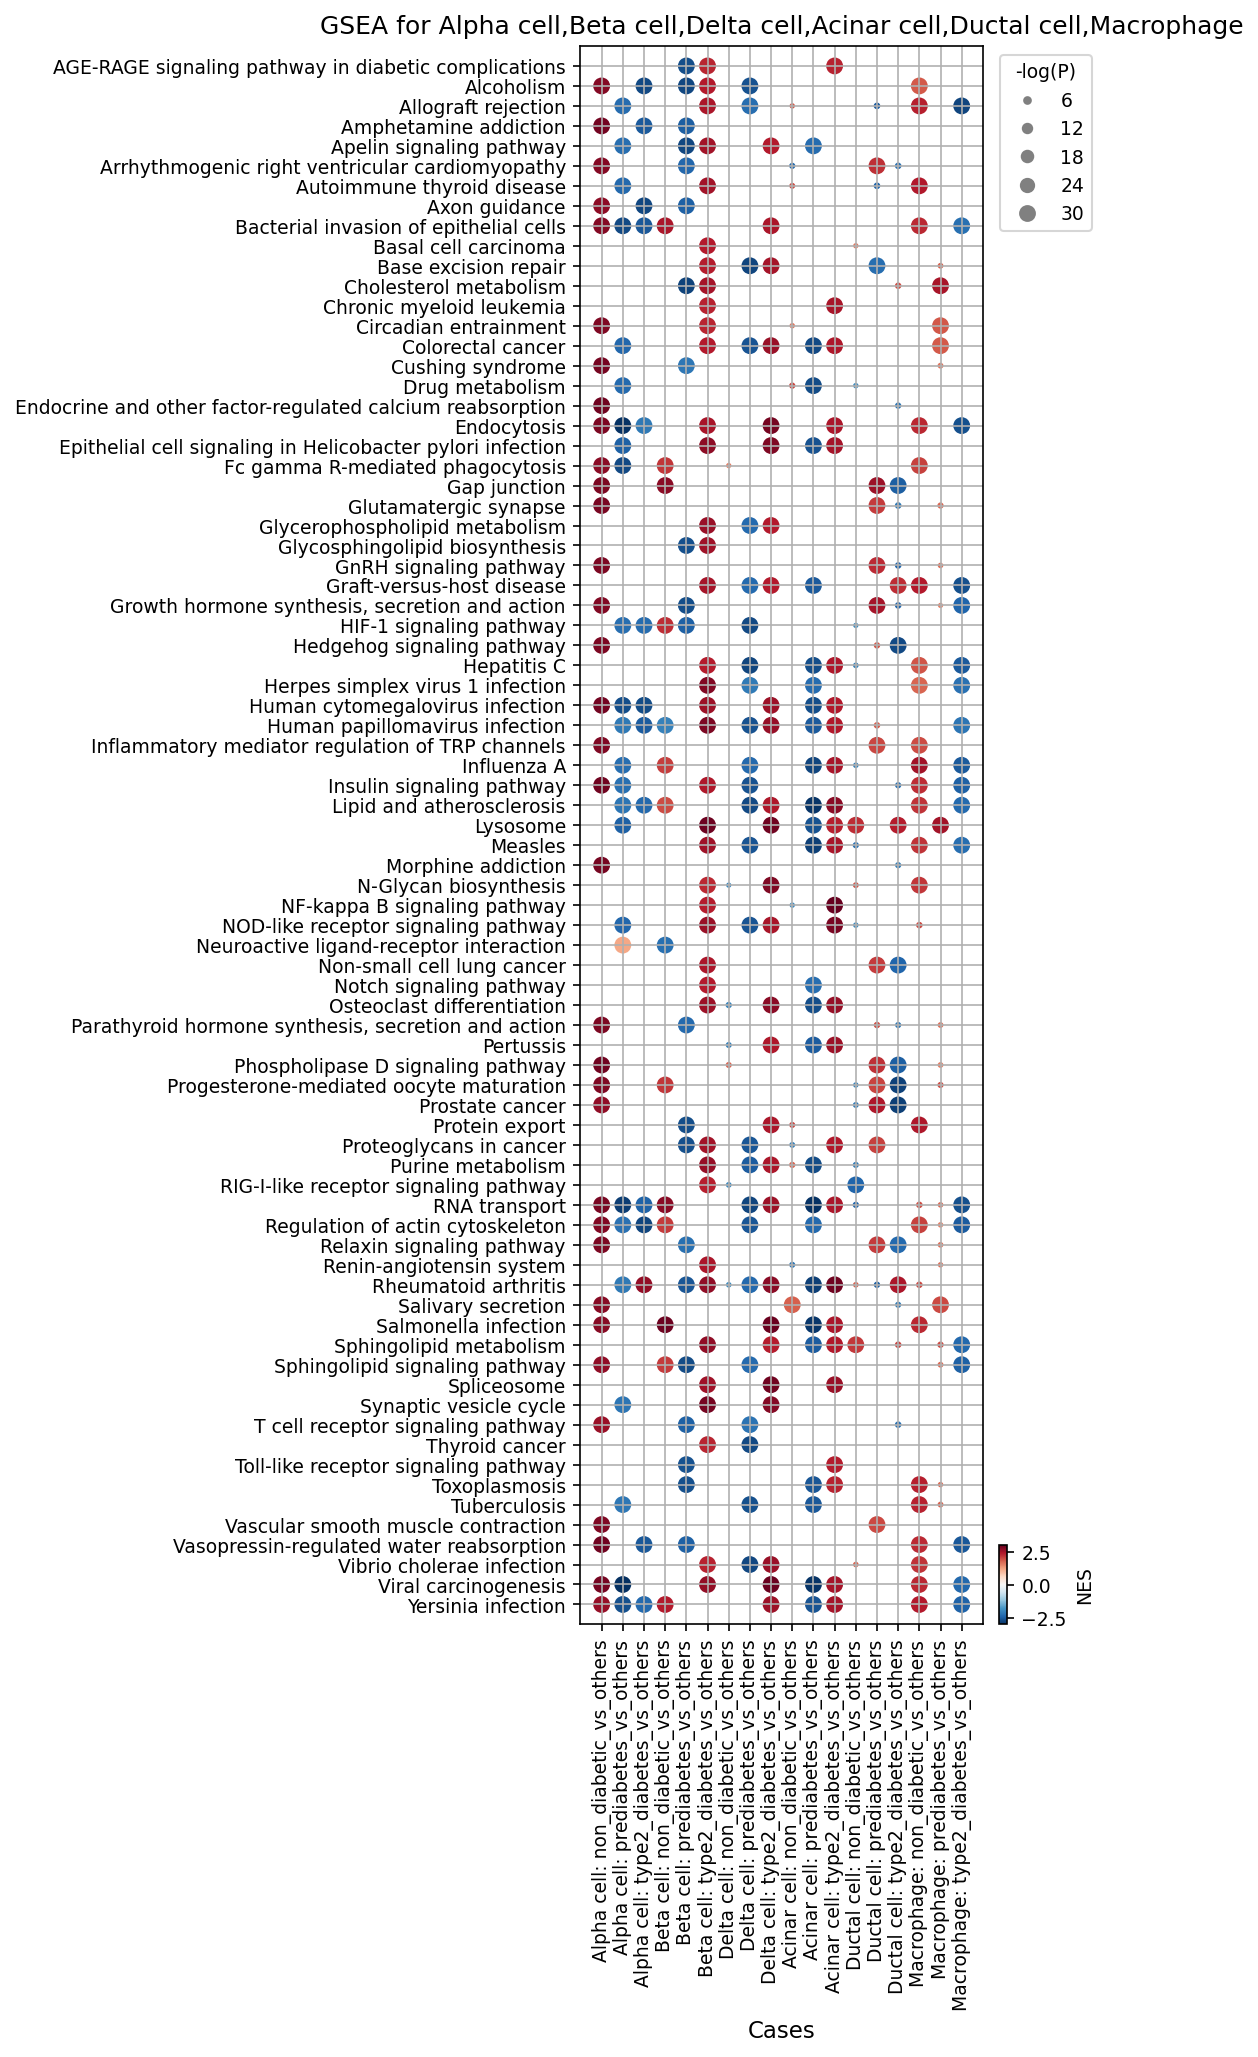
This analysis presents a Gene Set Enrichment Analysis (GSEA) in a dot plot format, comparing different conditions within specific pancreatic cell types (Alpha cell, Beta cell, Delta cell, Acinar cell, Ductal cell, and Macrophage). The comparisons are made between a particular condition (e.g., 'type2_diabetes') against the 'others' conditions (i.e., 'non_diabetic' and 'prediabetes' combined) within the same cell type. The plot displays 80 enriched gene sets (pathways) to highlight condition-specific biological changes.
Visual Summary
The dot plot visualizes the Normalized Enrichment Score (NES) and statistical significance (-log(p-value)) for various gene sets across different cell type-condition comparisons.
- X-axis represents the cell type and the specific comparison (e.g., "Alpha cell: type2_diabetes_vs_others").
- Y-axis lists the enriched gene sets/pathways.
- Dot color indicates the Normalized Enrichment Score (NES), where red signifies a positive NES (pathway is upregulated/activated relative to 'others') and blue signifies a negative NES (pathway is downregulated/inhibited relative to 'others'). The color map RdBu_r uses red for higher NES values and blue for lower NES values.
- Dot size reflects the statistical significance, with larger dots indicating a more significant p-value (higher -log(p-value)).
- A general pattern of increased redness and larger dot sizes is observed across most cell types in 'prediabetes_vs_others' and 'type2_diabetes_vs_others' columns for inflammatory and stress-related pathways, suggesting a widespread activation of these processes during diabetes progression. Conversely, some metabolic/housekeeping pathways show downregulation in 'non_diabetic_vs_others' comparisons, implying they become more active or dysregulated in prediabetic/diabetic states.
Biological Interpretation
Widespread Inflammatory and Stress Signaling in Diabetes Progression
A prominent observation is the consistent and strong upregulation of inflammatory and stress-related pathways across nearly all analyzed pancreatic cell types (Alpha, Beta, Delta, Acinar, Ductal, and Macrophage) in both prediabetes and type 2 diabetes conditions.
- AGE-RAGE signaling pathway in diabetic complications: This pathway shows a highly significant and strong positive enrichment (large red dots) across all cell types in both prediabetes and type 2 diabetes. This finding directly links to known mechanisms of diabetes pathology, where advanced glycation end-products (AGEs) and their receptor (RAGE) contribute to chronic inflammation and cellular dysfunction in diabetic complications. PubMed search: AGE-RAGE signaling diabetes pancreas
- Toll-like receptor signaling pathway, NF-kappa B signaling pathway, and NOD-like receptor signaling pathway: These key innate immune and inflammatory signaling pathways are significantly upregulated across endocrine (Alpha, Beta, Delta), exocrine (Acinar), ductal, and immune (Macrophage) cells in prediabetes and type 2 diabetes. This indicates a broad, sterile inflammatory response within the pancreas as diabetes develops. PubMed search: Pancreatic inflammation diabetes TLR NFkB
- Inflammatory mediator regulation of TRP channels: This pathway also shows significant enrichment in diabetic conditions across multiple cell types, suggesting altered ion channel activity contributing to inflammation and cellular stress.
Distinct Responses in Pancreatic Endocrine and Immune Cells
Alpha, Beta, and Delta Cells (Islet Endocrine Cells)
- Insulin signaling pathway: Interestingly, this pathway is often upregulated (red dots) in Alpha, Beta, and Delta cells in prediabetes and type 2 diabetes, while showing downregulation (blue dots) in non-diabetic contexts (compared to others). In Beta cells, this could reflect attempts at compensation, altered receptor signaling due to insulin resistance, or activation of downstream stress pathways rather than effective insulin action. GeneCards: INSR (Insulin Receptor)
- The consistent inflammatory pathway activation in these cells suggests a direct impact of the diabetic microenvironment on their function and survival, contributing to islet dysfunction.
- Macrophages: As expected for immune cells, Macrophages exhibit the strongest and most widespread activation of inflammatory and immune-related pathways in prediabetes and type 2 diabetes.
- Pathways such as FC gamma R-mediated phagocytosis and Lysosome are upregulated in diabetic conditions, indicating increased immune surveillance, antigen presentation, and cellular clearance activities.
- The significant enrichment of Rheumatoid arthritis pathway in Macrophages during type 2 diabetes further highlights a pronounced, potentially autoimmune-like, inflammatory phenotype, consistent with the known role of immune cell infiltration in diabetic pancreata. PubMed search: Macrophage islet inflammation diabetes
Alterations in Cellular Metabolism and Housekeeping
Several fundamental cellular processes show altered enrichment patterns:
- Protein export, Lysosome, Endocytosis: These pathways are frequently downregulated in non-diabetic cells (when compared to prediabetic/T2D cells). This suggests that in the progression to diabetes, these processes may become upregulated or dysregulated, potentially reflecting increased cellular stress, altered protein turnover, or changes in cellular uptake and degradation required for managing metabolic stress. For example, increased lysosomal activity in macrophages could be linked to their role in clearing cellular debris and altered lipid metabolism.
Clinical or Translational Implications
The widespread activation of inflammatory pathways, particularly AGE-RAGE and innate immune signaling, across multiple pancreatic cell types in prediabetes and type 2 diabetes underscores the central role of inflammation in disease pathogenesis.
- Early Intervention Targets: The detection of these inflammatory signals in prediabetes suggests that targeting these pathways could be crucial for preventing or delaying the progression to overt type 2 diabetes.
- Cell-Type Specific Mechanisms: Understanding how different cell types, especially insulin-producing Beta cells and immune cells like Macrophages, contribute to and respond to pancreatic inflammation offers opportunities for developing cell-type-specific therapeutic strategies. For instance, modulating macrophage activation could alleviate islet inflammation.
- Biomarker Discovery: The enriched pathways and their constituent genes could serve as potential biomarkers for assessing disease stage or therapeutic response in pancreatic health and diabetes.
13. Discussion
The single-cell analysis of the human pancreas reveals a complex and progressive pathology underlying Type 2 Diabetes (T2D) and its precursor, prediabetes. A central finding is the consistent reduction in Beta cell proportion as the disease advances from non-diabetic to prediabetes and overt T2D, aligning with the established role of Beta cell mass and function loss in diabetes. Concurrently, immune cell populations exhibit profound shifts, notably a progressive increase in the proportion of pro-inflammatory M1 macrophages across disease stages, indicating an escalating inflammatory burden within the pancreatic microenvironment. This is further supported by the activation of inflammatory signaling pathways, including AGE-RAGE, Toll-like receptor, NF-kappa B, and NOD-like receptor pathways, which are significantly upregulated across multiple pancreatic cell types (Alpha, Beta, Delta, Acinar, Ductal, Macrophage) in prediabetes and T2D.
Beyond immune cells, both pancreatic exocrine (Acinar) and ductal cells display widespread cellular stress responses in diabetic conditions. Gene Ontology analysis shows strong enrichment of pathways related to oxidative phosphorylation, ER stress, protein processing, and apoptosis in these cells, particularly in T2D. This indicates that the impact of diabetes extends beyond islet cells, affecting overall pancreatic health and potentially contributing to exocrine dysfunction.
Cell-cell interaction (CCI) analyses unveil a dynamic rewiring of intercellular communication. While prediabetes shows an attenuation of many CCIs, T2D is characterized by a widespread intensification and qualitative alteration of interactions. Pancreatic stellate cells emerge as key mediators, showing increased interactions indicative of fibrotic remodeling (e.g., MMP2-integrin_avb3_complex interactions with Beta cells, increased collagens) and inflammatory crosstalk (e.g., TNFSF12-TNFRSF12A interactions with Acinar and Beta cells). Endothelial cells also exhibit dysregulated angiogenesis-related interactions (e.g., DLL4-NOTCH1, VEGFA-NRP1) in diabetic states. Furthermore, pancreatic Mast cells display distinct activation states, with a strong MHC Class II signature in prediabetes potentially indicating enhanced antigen-presenting capabilities, and atypical T-cell-related markers (CD2, CD3D) in T2D, suggesting evolving immune roles. Collectively, these findings paint a picture of a pancreas subjected to chronic inflammation, extensive cellular stress, and active remodeling of its microenvironment, all contributing to the decline in its metabolic functions.
Hypotheses:
- Progressive M1 macrophage polarization drives chronic islet inflammation, exacerbating Beta cell dysfunction and loss in type 2 diabetes.
- Dysregulated cell-cell interactions involving pancreatic stellate cells (e.g., increased fibrotic and inflammatory signaling) are key mediators of pancreatic microenvironment remodeling and islet pathology in type 2 diabetes.
- Widespread endoplasmic reticulum stress and oxidative phosphorylation dysregulation in acinar and ductal cells contribute to overall pancreatic dysfunction and the pathogenesis of type 2 diabetes, beyond direct Beta cell damage.
- Pancreatic Mast cells undergo distinct immune activation states (e.g., MHC Class II expression in prediabetes, T-cell related markers in T2D) that contribute to localized inflammation and immune modulation during diabetes progression.
Potential therapeutic targets:
- Pancreatic Stellate Cell (PSC) Activation and Fibrotic Pathways: Increased PSC activity, evidenced by upregulated fibrotic markers and specific cell-cell interactions, drives pancreatic fibrosis which impairs islet function and contributes to T2D progression. Evidence: CCI analysis shows strong signals for MMP2_integrin_avb3_complex--Stellate|Beta, COL8A1_integrin_a2b1_complex--Stellate|Endo, LAMC1_integrin_a1b1_complex--Endo|Stellate, and TNFSF12-TNFRSF12A--Acinar|Stellate / --Beta|Stellate, all significantly elevated in T2D. Marker analysis for Stellate cells shows collagens, FN1, SPARC, and PDGFRB. Validation: Test inhibitors of MMP2, integrin alphaVbeta3, or TWEAK-Fn14 signaling in pancreatic fibrosis models (e.g., STZ-induced diabetes, high-fat diet), assessing impact on Beta cell mass, glucose homeostasis, and fibrosis markers.
- M1 Macrophage Polarization: The progressive shift towards a dominant pro-inflammatory M1 macrophage phenotype in the pancreas contributes significantly to insulitis and Beta cell dysfunction/loss in prediabetes and T2D. Evidence: Population analysis (Section 6) shows M1 macrophages consistently increasing from non_diabetic to T2D. GSEA (Section 12) shows strong upregulation of innate immune and inflammatory pathways (TLR, NF-kappa B, NOD-like receptor) in macrophages in diabetic conditions. Validation: Evaluate pharmacological agents or genetic interventions that inhibit M1 polarization or promote M2 polarization in diabetic animal models, measuring islet inflammation, Beta cell survival, and glucose control.
- AGE-RAGE Signaling Pathway: Widespread and strong upregulation of the AGE-RAGE pathway across multiple pancreatic cell types (Alpha, Beta, Delta, Acinar, Ductal, Macrophage) indicates a central role in chronic inflammation and cellular dysfunction in diabetes. Evidence: GSEA (Section 12) shows highly significant positive enrichment of 'AGE-RAGE signaling pathway in diabetic complications' across all analyzed cell types in both prediabetes and type 2 diabetes. Validation: Test inhibitors of AGE formation or RAGE antagonists in preclinical models of diabetes to assess their effects on pancreatic inflammation, ER stress, Beta cell function, and glucose homeostasis.
- Pancreatic Mast Cell MHC Class II Activation in Prediabetes: Pancreatic Mast cells in prediabetes show a strong upregulation of MHC Class II genes, suggesting they adopt an antigen-presenting phenotype that could contribute to islet inflammation and influence adaptive immune responses in early disease. Evidence: Dot plot of condition-specific markers (Section 10) shows prominent expression of HLA-DPB1, HLA-DPA1, HLA-DRA, HLA-DRB1, HLA-DMB, HLA-DQA1, HLA-DQB1, and HLA-DRB5 in prediabetic Mast cells. Validation: Develop strategies (e.g., small molecules, antibodies) to modulate MHC Class II expression or function on Mast cells, and test their impact on islet inflammation and glucose tolerance in early diabetic models.
Follow-up validation ideas:
- Validate Beta cell mass reduction and M1 macrophage infiltration (e.g., using CD68/CD86/CD163 markers) via immunohistochemistry or multiplex immunofluorescence on human pancreatic tissue from non-diabetic, prediabetic, and T2D donors. Flow cytometry on dissociated pancreatic immune cells.
- Confirm increased expression of fibrosis markers (e.g., alpha-SMA, collagen I/III) and ligand-receptor pairs (e.g., MMP2, integrins, TNFSF12, TNFRSF12A) in activated pancreatic stellate cells and their interaction with islet/endothelial cells using spatial transcriptomics, RNA-FISH, or co-culture assays.
- Assess ER stress markers (e.g., GRP78, CHOP) and mitochondrial function (e.g., ATP production, ROS levels) in isolated acinar and ductal cells from diabetic models or human tissue using targeted qPCR, Western blot, or metabolic assays.
- Use multiparameter flow cytometry or spectral cytometry to characterize surface marker expression (MHC Class II, CD2, CD3D) on pancreatic Mast cell subsets in human tissues across disease stages. Perturbation assays (e.g., targeting MHC-II on Mast cells) in ex vivo pancreatic slices.
Limitations:
The observed changes in cellular composition, cell-cell interactions, and pathway activities are correlative and do not definitively establish causality for diabetes progression. Further functional validation in appropriate in vitro and in vivo models is required to confirm biological significance. While comprehensive, single-cell RNA-seq inherently involves tissue dissociation, leading to a loss of precise spatial context, which is critical for understanding direct cell-cell interactions in situ. Although the dataset includes multiple samples, inter-individual variability and the potential for rare cell populations or transient states to be underrepresented could affect the generalizability of some findings.
14. Query List
- Show a UMAP with condition, sample, major cell type, minor cell type, and celltype_subset in 2 columns and save it.
- Show major cell type scores on UMAP and save it.
- Show the overall Celltype_subset marker expression dot plot and save it. Keep target_cell as None and keep the other arguments at their default values.
- Show a population bar plot for minor cell types and save it.
- Show a subset population bar plot for Mast cells and save it.
- Show a subset population bar plot for Macrophages and save it.
- Show cell-cell interactions by condition and save the result. Select at most 80 cell-cell interactions for each condition.
- Find statistically significant differences in cell-cell interactions for major immune and stromal cells by condition, show them as a dot plot, and save it. Set max_n_items_per_group = 25.
- Extract and show a dot plot of condition-specific markers for Fibroblasts, and save it. Include only surfaceome markers, up to 50 per condition.
- Extract and show a dot plot of condition-specific markers for Mast cells, and save it. Include only surfaceome markers, up to 50 per condition.
- Show a bar plot of Gene Ontology (GSA) analysis results for Acinar cell and Ductal cell, and save it.
- Show a dot plot of Gene set enrichment analysis results for Alpha cell, Beta cell, Delta cell, Acinar cell, Ductal cell, and Macrophage and save it. Use 'RdBu_r' as the color map and set n_pws_to_show = 80.