Single-Cell Transcriptomic Analysis of Pancreatic Cellular and Molecular Dysregulation in Type 2 Diabetes and Prediabetes
This single-cell RNA-sequencing analysis characterizes pancreatic cellular and molecular changes during Type 2 Diabetes (T2D) and prediabetes progression. Key findings include a significant reduction in Beta cell populations and a shift towards pro-inflammatory M1 macrophages. Furthermore, dysregulated cell-cell communication involving pancreatic stellate cells, particularly increased TGFB1 and SPP1 signaling, along with widespread activation of the AGE-RAGE pathway, contribute to a pro-inflammatory and pro-fibrotic microenvironment. These insights highlight critical mechanisms of pancreatic dysfunction and offer potential avenues for therapeutic intervention.
Contents
- Dataset overview
- UMAP Analysis of Pancreatic Single-Cell Transcriptomics by Condition, Sample, and Cell Type Annotation
- Cell Type Score Visualization on UMAP Embedding
- Marker Expression Profile of Pancreatic Cell Subsets
- Analysis of Minor Cell Type Population Dynamics in Pancreatic Conditions
- Macrophage Subset Population Shifts in Pancreatic Tissue Across Diabetes Progression
- Pancreatic Cell-Cell Interaction Patterns in Type 2 Diabetes and Prediabetes
- Condition-Specific Cell-Cell Interactions Involving Pancreatic Stellate Cells in Diabetes Progression
- Beta Cell Surfaceome Marker Expression in Type 2 Diabetes
- Macrophage Surfaceome Markers in Pancreatic Diabetes Progression
- Gene Ontology (GSA) Analysis of Beta Cells Across Pancreatic Metabolic States
- Gene Set Enrichment Analysis (GSEA) Across Pancreatic Cell Types in Diabetes
- Discussion
- Query List
0. Dataset overview
데이터셋 요약
- 데이터 크기: 90006개의 세포와 28920개의 유전자로 구성된 단일 세포 RNA-seq 데이터입니다.
- 종 및 조직: 인간 췌장(Pancreas) 조직에서 유래한 데이터입니다.
- 관측치(obs) 정보: 각 세포에 대해 샘플, 조건(type2_diabetes, non_diabetic, prediabetes), 조직, 질병 상태, 다양한 세포 타입 분류(celltype_major, celltype_minor, celltype_subset), 클러스터 정보가 포함되어 있습니다.
- 유전자(var) 정보: 유전자 심볼, 특성 타입, 유전자 ID, 가변 유전자 정보가 포함되어 있습니다.
- 질병 컨텍스트: 제2형 당뇨병 및 당뇨병 전증(prediabetes) 연구에 초점을 맞추고 있으며, 'non_diabetic'이 대조군으로 설정되어 있습니다.
- 사전 계산된 결과: 다음 분석 결과들이 이미 계산되어 저장되어 있습니다.
- 세포-세포 상호작용(CCI): 조건 및 샘플별 CellPhoneDB 결과.
- 차등 발현 유전자(DEG): 각 minor 세포 타입에서 조건 간 또는 대조군('non_diabetic') 대비 차등 발현 유전자 결과.
- 유전자 세트 농축 분석(GSEA): 각 minor 세포 타입에서 조건 간 또는 대조군 대비 GSEA 결과.
- 유전자 온톨로지(GO/GSA): 각 minor 세포 타입에서 조건 간 또는 대조군 대비 GO/GSA 결과.
- CNV 분석: CNV(Copy Number Variation) 추정치는 현재 이 데이터셋에서 사용할 수 없습니다.
1. UMAP Analysis of Pancreatic Single-Cell Transcriptomics by Condition, Sample, and Cell Type Annotation
[Analysis Visualization Results]...
Analysis Overview
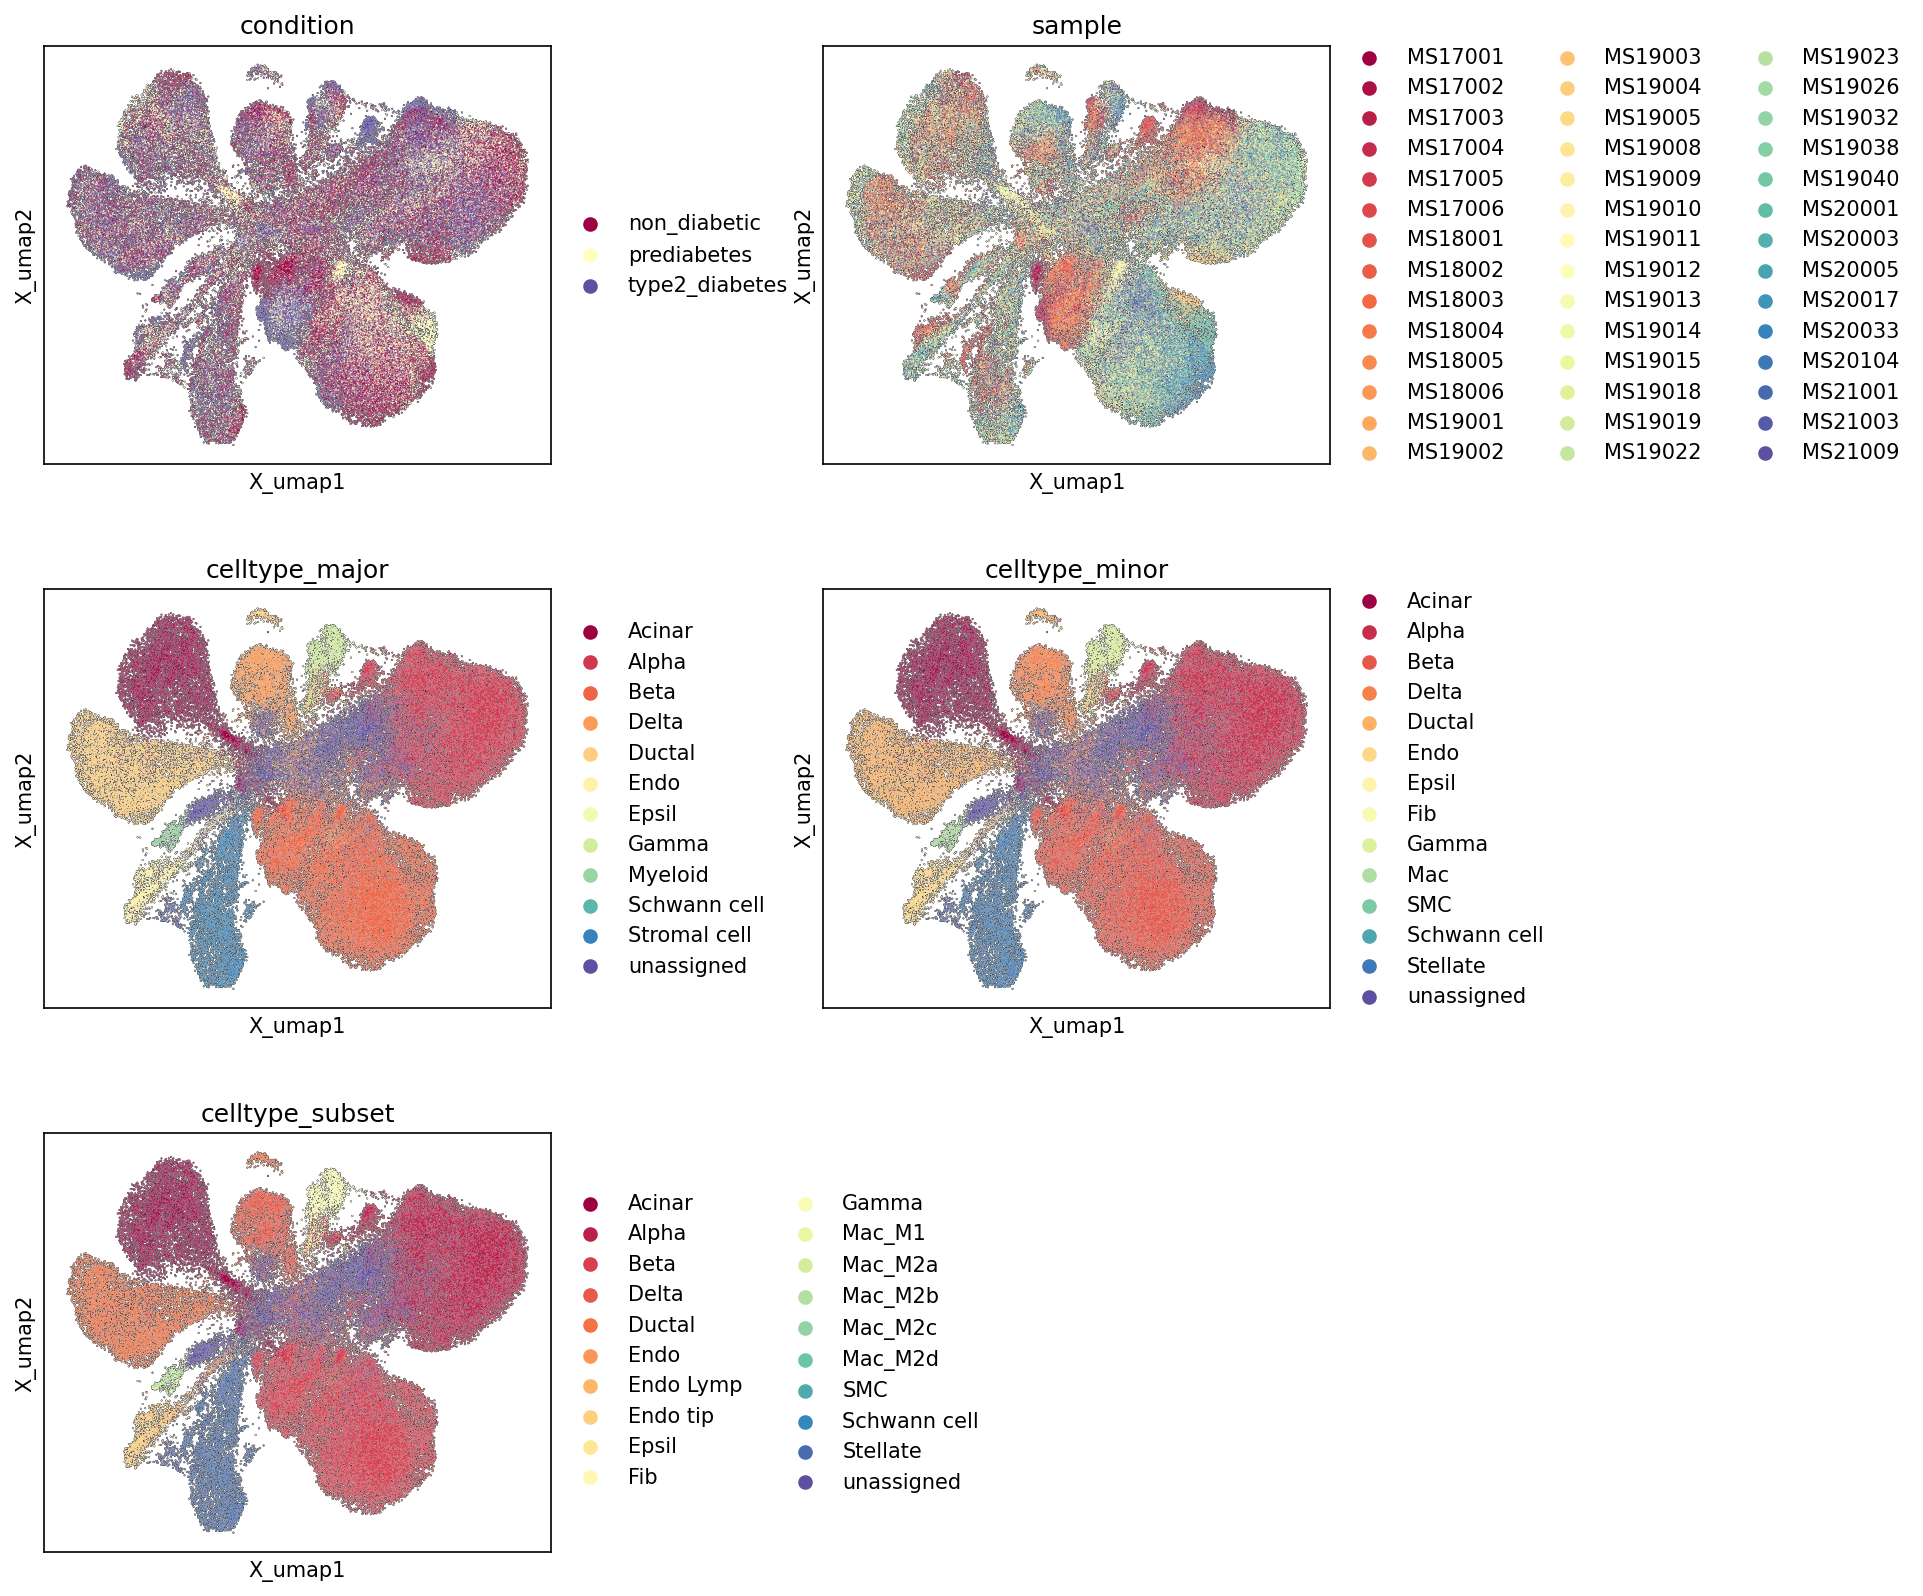
This analysis presents Uniform Manifold Approximation and Projection (UMAP) visualizations of single-cell RNA-seq data from human pancreas. The UMAPs display the relationships between individual cells in a two-dimensional space, colored by different metadata attributes: 'condition' (non_diabetic, prediabetes, type2_diabetes), 'sample', 'celltype_major', 'celltype_minor', and 'celltype_subset'. This visualization helps assess the overall data structure, the quality of cell type annotations, the presence of batch effects, and the distribution of disease conditions across cell populations.
Visual Summary
Distribution by Condition
The UMAP colored by 'condition' shows that cells from 'non_diabetic', 'prediabetes', and 'type2_diabetes' states are largely intermingled across the major cell clusters. While there isn't a complete segregation of conditions into distinct regions, subtle differences in distribution can be observed. 'non_diabetic' cells (dark red) appear to form the primary background in many clusters. 'prediabetes' cells (light yellow) and 'type2_diabetes' cells (dark blue/purple) are also broadly distributed, suggesting that the disease primarily induces changes within existing cell types rather than creating entirely new cellular populations, though specific regions may show enrichment for diseased states.
Distribution by Sample (Batch Effect Assessment)
The 'sample' UMAP, colored by individual sample identifiers, reveals a high degree of mixing of cells from different samples across the entire embedding. This indicates successful integration of data from multiple samples, as no single sample forms a large, isolated cluster. This suggests that the primary biological variance (e.g., cell type differences) outweighs technical variance or batch effects introduced by individual samples, which is crucial for robust downstream analysis.
Cell Type Resolution (Major, Minor, and Subset Annotations)
The UMAPs colored by celltype_major, celltype_minor, and celltype_subset provide a hierarchical view of cell type identification:
- celltype_major: Displays well-separated and distinct clusters for major pancreatic cell types such as Acinar, Alpha, Beta, Delta, Ductal, Endothelial, and Stromal cells. Islet cell types (Alpha, Beta, Delta, Gamma, Epsilon) generally cluster in close proximity, reflecting their anatomical and functional relationship. 'unassigned' cells form a small, relatively coherent cluster rather than being scattered, which is desirable.
- celltype_minor: This level refines the celltype_major annotations, for example, by distinguishing Stellate cells, Macrophages (from Myeloid), Fibroblasts, and Smooth muscle cells within broader stromal or immune categories. These refined cell types largely maintain distinct clustering, indicating successful resolution of these more granular populations.
- celltype_subset: At the most granular level, celltype_subset further resolves cell types, notably differentiating various Macrophage polarization states (Mac_M1, Mac_M2A, Mac_M2B, Mac_M2C, Mac_M2D) and Endothelial subtypes (Endo Lymp, Endo tip). These subtypes generally form coherent sub-clusters within their broader parent populations, or distinct clusters, confirming the high resolution of the cell type annotation pipeline.
Biological Interpretation
Pancreatic Cell Diversity and Organization
The consistent and clear segregation of cell populations across all levels of annotation (major, minor, subset) powerfully illustrates the profound cellular heterogeneity of the human pancreas. The distinct clustering of exocrine cells (Acinar, Ductal) from endocrine islet cells (Alpha, Beta, Delta, Gamma, Epsilon) and the diverse stromal/immune compartments (e.g., Fibroblasts, Stellate cells, Macrophages) aligns well with known pancreatic anatomy and function. This robust visualization supports the biological fidelity of the single-cell dataset.
Disease Context: Condition Distribution Implications
The observation that 'prediabetes' and 'type2_diabetes' cells are broadly intermingled with 'non_diabetic' cells across the UMAP suggests that Type 2 Diabetes (T2D) and prediabetes may involve widespread transcriptional alterations or shifts in cell proportions within existing cell types, rather than the emergence of entirely novel cell states. Specific enrichments of diseased cells in certain UMAP regions could highlight particular cell populations that are more susceptible to or actively involved in the pathogenesis of T2D. For instance, any shifts in the proportions of Beta cells, Alpha cells, or immune cells in the T2D clusters would be highly relevant to insulin production, glucose regulation, and pancreatic inflammation, respectively.
Annotation Notes
The UMAPs consistently demonstrate a high quality of cell type annotation at all three levels of granularity ('celltype_major', 'celltype_minor', 'celltype_subset'). The distinct and well-separated clusters for nearly all annotated cell types, including fine subtypes like macrophage polarization states and endothelial sub-populations, confirm that the underlying gene expression patterns robustly support these distinctions. The lack of significant batch effects, as evidenced by the intermingling of cells from different samples, further strengthens confidence in the biological signals observed. The minimal and coherent 'unassigned' cell cluster suggests a comprehensive and accurate annotation process.
2. Cell Type Score Visualization on UMAP Embedding
[Analysis Visualization Results]...
Analysis Overview
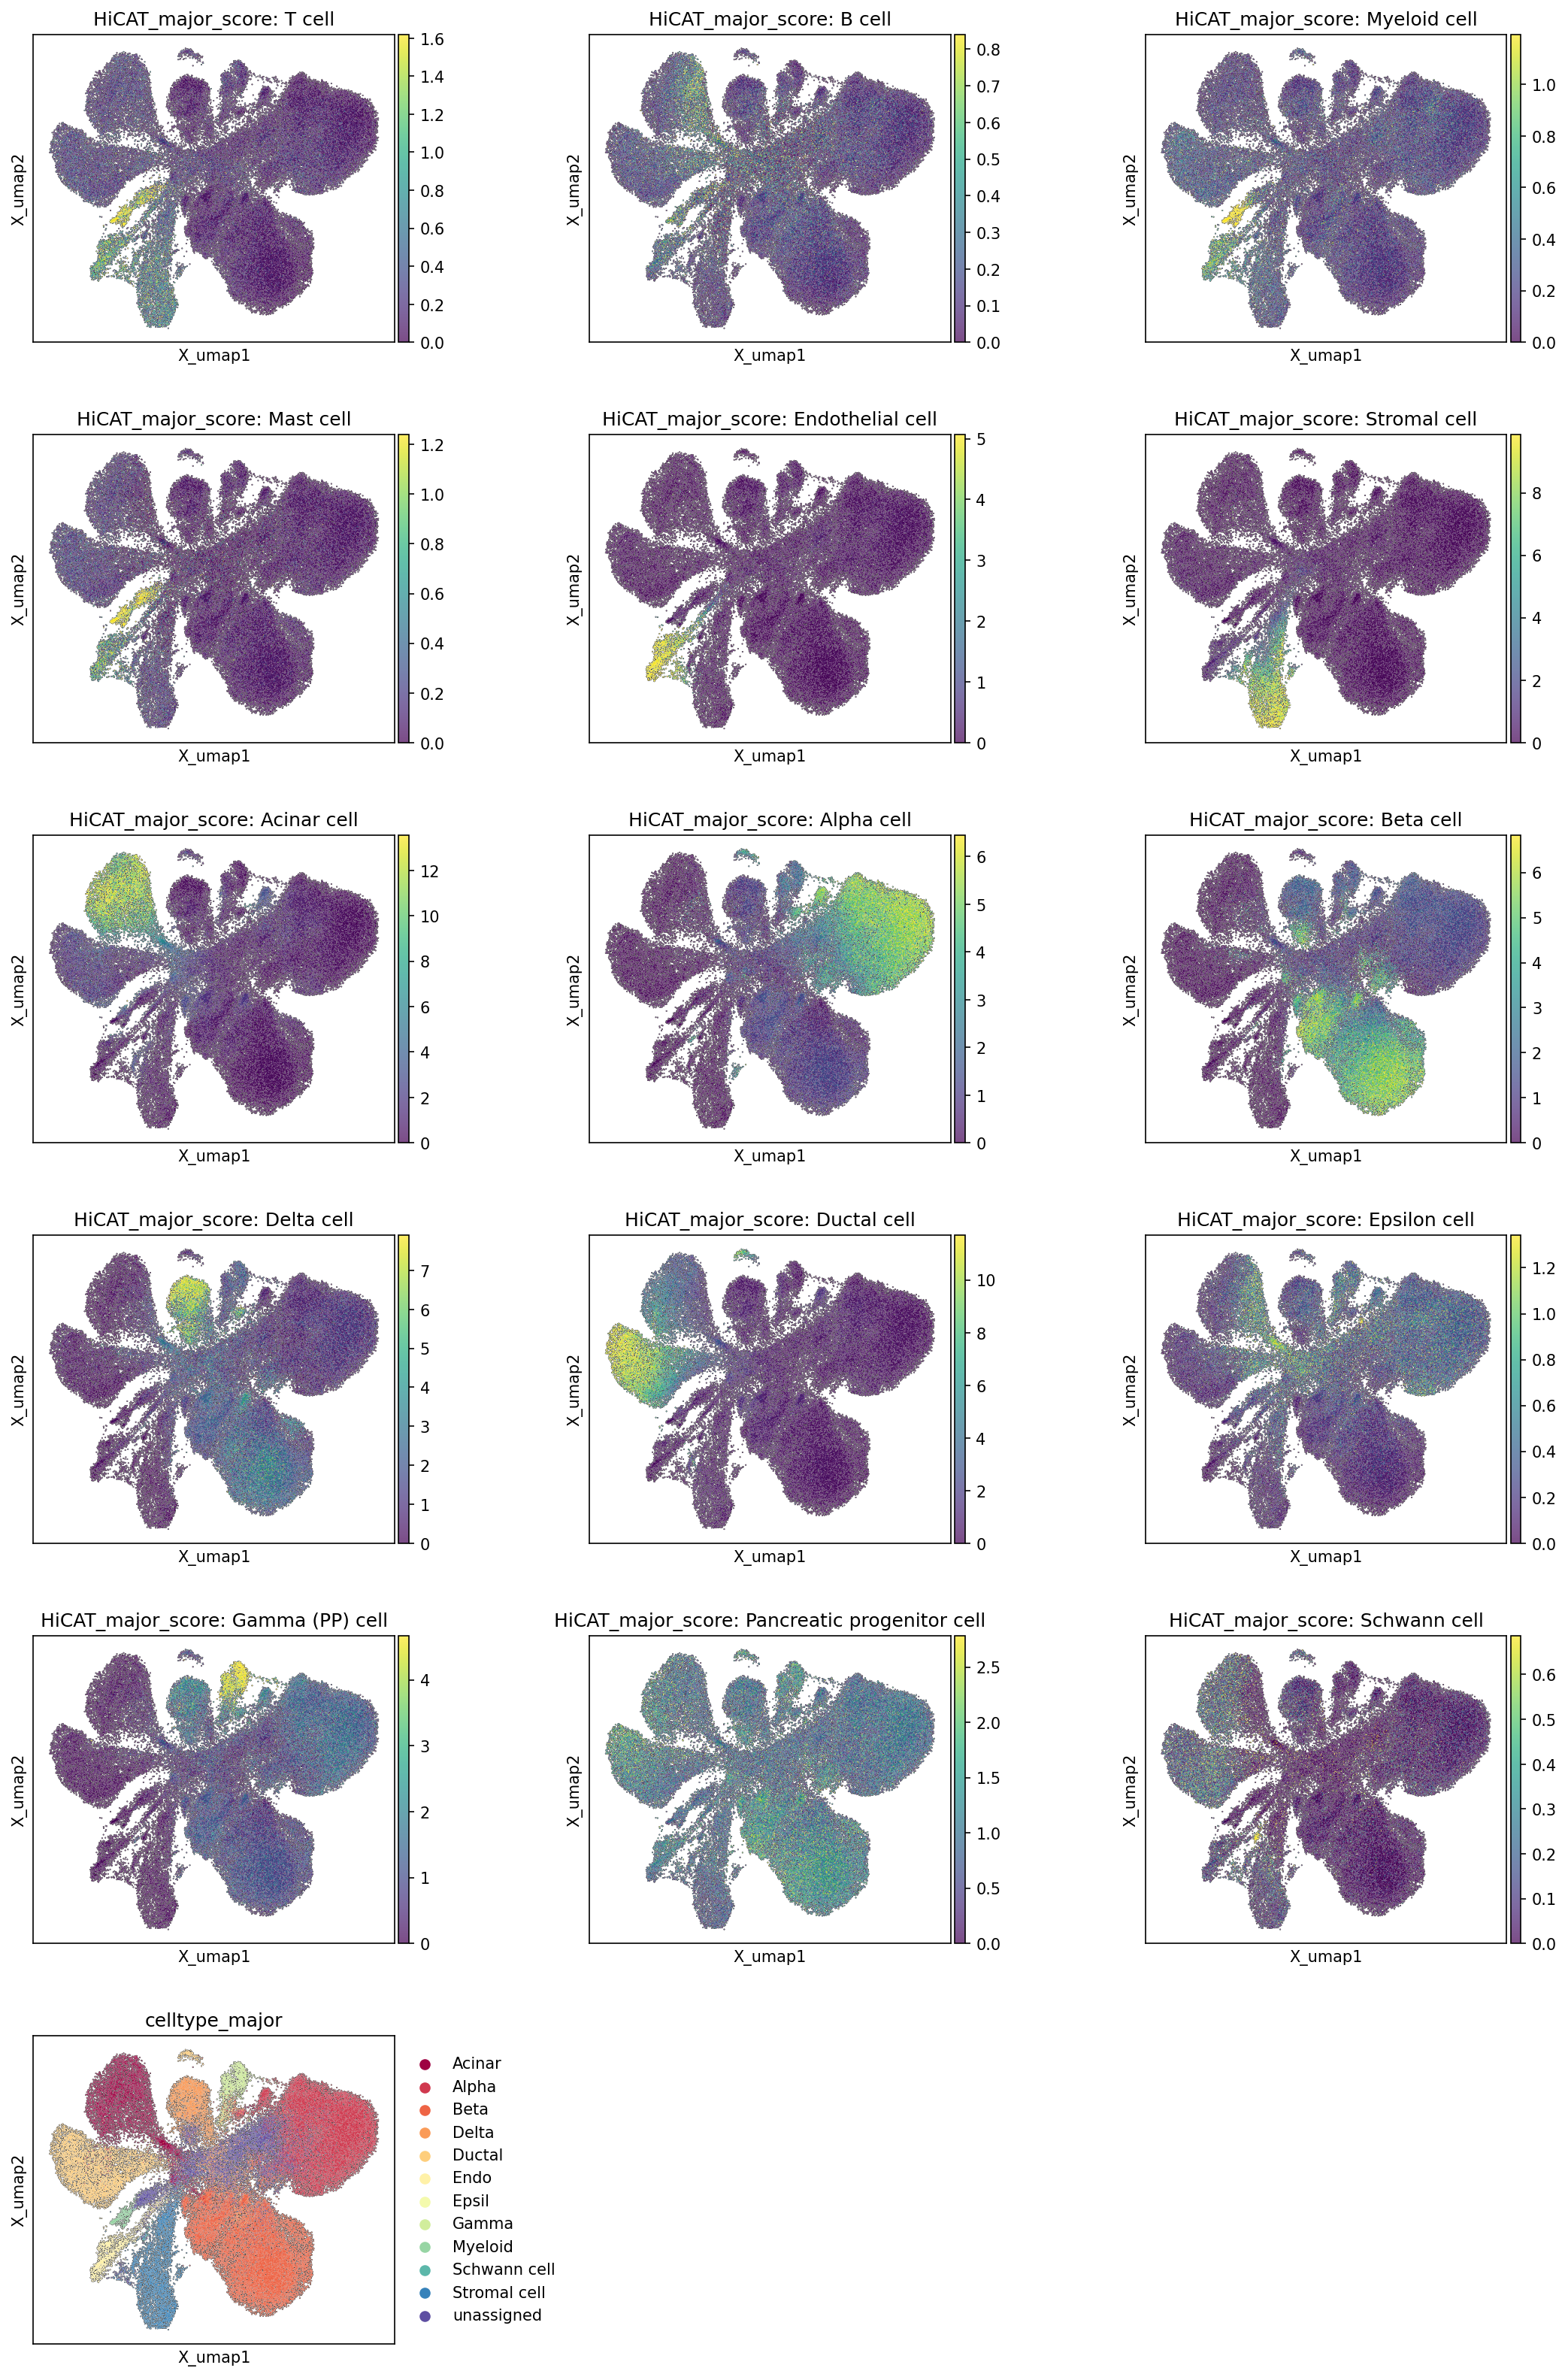
This analysis displays the computed scores for each major cell type projected onto a UMAP (Uniform Manifold Approximation and Projection) embedding of 90,006 pancreatic single cells. The purpose is to visually assess the distinctness and localization of various cell populations based on their transcriptional profiles, which directly informs the quality and accuracy of the cell type annotations. A final UMAP plot colored by the assigned celltype_major annotation is also provided for direct comparison.
Visual Summary
Major Cell Type Score Distributions
The UMAP plots illustrate the distribution and intensity of "HiCAT_major_score" for each designated major cell type. Cells with high scores for a particular cell type are colored yellow/green, indicating strong transcriptional similarity to that cell type's reference profile, while lower scores (purple) suggest less similarity.
Pancreatic Exocrine Cells:
- Acinar cell scores are distinctly high in a large, dense cluster on the far right of the UMAP, indicating a robust and transcriptionally homogeneous population.
- Ductal cell scores are high in a prominent, elongated cluster in the central-left region of the UMAP, clearly separated from the Acinar cells and most islet cells.
Pancreatic Endocrine (Islet) Cells:
- Alpha cell, Beta cell, Delta cell, Epsilon cell, and Gamma (PP) cell all show high scores concentrated in a central, interconnected cluster on the UMAP, to the left of the Acinar cluster.
- Beta cell scores dominate the lower-right and central parts of this islet cluster, representing the largest endocrine population.
- Alpha cell scores are prominent in the upper-right portion of the islet cluster.
- Delta cell, Epsilon cell, and Gamma (PP) cell scores highlight smaller, more localized regions within or adjacent to the Alpha/Beta cell clusters, consistent with their relative abundances within the islet.
Stromal and Endothelial Cells:
- Stromal cell scores are broadly distributed, primarily in the lower-left and central regions, often forming a diffuse population that can intermingle with other cell types, reflecting their supportive and structural roles.
- Endothelial cell scores are concentrated in a more defined, but still somewhat distributed, cluster in the central-left region, often adjacent to Ductal and Stromal populations.
Immune Cells:
- Myeloid cell, T cell, B cell, and Mast cell scores identify smaller, more compact, and typically peripheral clusters, predominantly located on the far left side of the UMAP, distinct from the major pancreatic epithelial and endocrine populations.
Rare/Progenitor Cells:
- Pancreatic progenitor cell scores identify a smaller, somewhat diffuse population, often found near Ductal cells, which aligns with their developmental potential.
- Schwann cell scores highlight a very small, specific cluster, typically at the periphery, reflecting a minor neural component.
Overall Cell Type Annotation
The final celltype_major plot, where each cell is colored according to its assigned major cell type, visually consolidates these findings. The distinct colored clusters in this plot correspond remarkably well with the regions of high scores observed in the individual cell type score plots, confirming the robust separation and identification of major cell populations within the pancreatic tissue. The unassigned cells, colored dark purple, appear sparsely distributed, indicating that most cells were confidently assigned to a major cell type.
Biological Interpretation
The clear segregation of high cell type scores into distinct regions on the UMAP embedding provides strong evidence for the successful classification and annotation of major cell types in the pancreatic single-cell dataset.
- Pancreatic Structure: The UMAP clearly delineates the major compartments of the pancreas:
- Exocrine Pancreas: Dominated by the large Acinar cell cluster (enzyme production) and the Ductal cell cluster (duct formation and transport), which are transcriptionally distinct.
- Endocrine Pancreas (Islets of Langerhans): Represented by the central, interconnected cluster of Alpha, Beta, Delta, Epsilon, and Gamma (PP) cells. This co-localization reflects their close physical and functional relationships within the pancreatic islets, where they coordinate hormone production (e.g., insulin from Beta cells, glucagon from Alpha cells) crucial for glucose homeostasis.
- Supportive and Immune Microenvironment: The presence of Stromal, Endothelial, and various Immune cell populations (Myeloid, T, B, Mast cells) highlights the complex cellular microenvironment of the pancreas. Their distinct clustering indicates specialized roles, such as structural support, vascularization, and immune surveillance, all of which can be altered in metabolic diseases like type 2 diabetes.
- Cellular Heterogeneity and Identity: The sharp boundaries and high-intensity scores for most cell types suggest strong transcriptional signatures, reinforcing their distinct identities. Minor populations like Pancreatic progenitor cells and Schwann cells are also identified, albeit with smaller clusters, contributing to a comprehensive cellular atlas of the pancreas.
Annotation Notes
The consistency between the individual HiCAT_major_score plots and the final celltype_major annotation plot indicates high confidence in the assigned cell identities. The distinct clustering of most major cell types on the UMAP suggests that the underlying transcriptional differences are well-captured and allow for clear separation. The minimal presence of unassigned cells (indicated by the sparse purple dots in the celltype_major plot) further supports the overall quality and comprehensiveness of the cell type annotation for this dataset. The UMAP structure effectively visualizes the inherent biological relationships and distinctions among the diverse pancreatic cell populations.
3. Marker Expression Profile of Pancreatic Cell Subsets
[Analysis Visualization Results]...
Analysis Overview
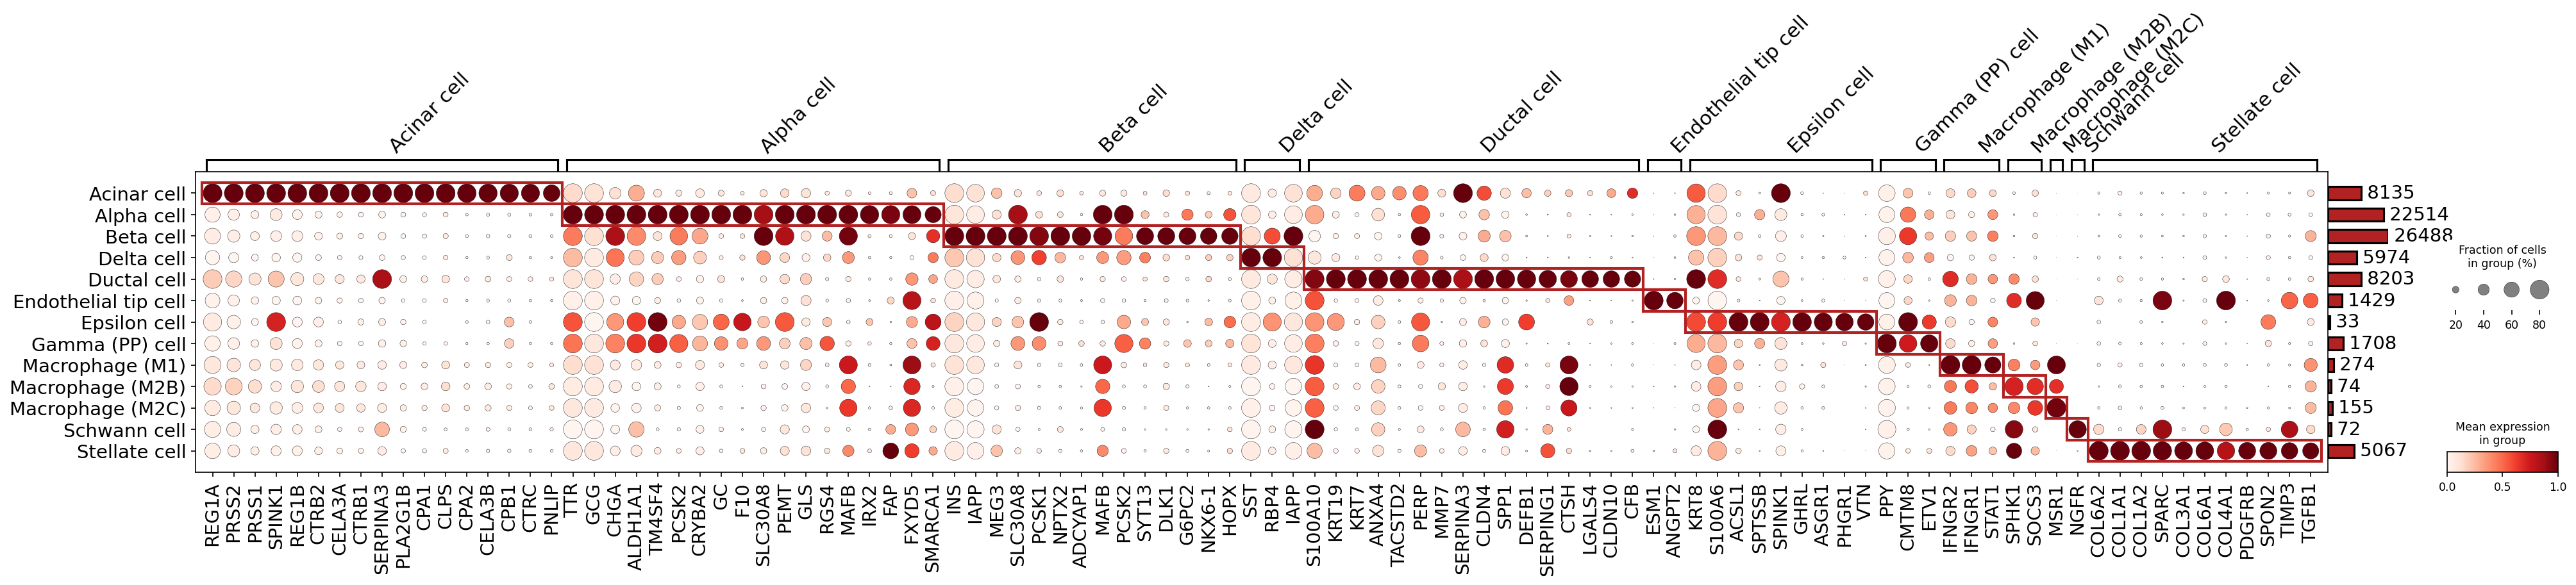
This analysis presents a marker expression dot plot to visualize the transcriptional identity of various cell subsets identified within the pancreatic single-cell RNA-sequencing dataset. The plot displays selected marker genes (columns) across different celltype_subset groups (rows). For each gene-cell type pair, the size of the dot represents the fraction of cells within that group expressing the gene, while the color intensity indicates the mean expression level of the gene in those cells. The red boxes highlight the top distinguishing markers for each cell type as determined by the marker discovery algorithm. This visualization is crucial for validating cell type annotations and understanding the molecular profiles that define each pancreatic cell population.
Visual Summary
The dot plot effectively illustrates the specific expression patterns of numerous genes across 15 distinct pancreatic cell subsets.
- Cell Type Specificity: Clear blocks of high expression (dark red, large dots) are observed along the diagonal, confirming that most celltype_subset annotations are strongly supported by unique marker gene expression. The red boxes clearly delineate these cell type-specific marker groups.
- Expression Levels and Prevalence: For instance, Acinar cells show high mean expression and prevalence for genes like *REG1A* and *PRSS2*, while Beta cells are characterized by strong expression of *INS* and *IAPP*.
- Macrophage Subtypes: Several macrophage subtypes (M1, M2A, M2B, M2C, M2D) are present, each showing distinct, albeit sometimes overlapping, marker profiles. Macrophage (M1) cells are characterized by genes such as *IFNGR1* and *STAT1*, while Macrophage (M2B) cells show markers like *MSR1*.
- Rare Cell Types: Cell types with fewer cells, such as Epsilon cells (133 cells) and Macrophage (M2C) (72 cells), still exhibit clear marker expression for their defining genes (e.g., *GHRL* for Epsilon cells).
- Gene Grouping: Marker genes are grouped by the celltype_subset they characterize, allowing for easy visual assessment of cell type-specific signatures. The var_group_rotation of 45 degrees facilitates readability of gene names.
Biological Interpretation
The marker expression profiles provide robust evidence for the accurate annotation of pancreatic cell subsets.
- Acinar Cells: Exhibit high expression of digestive enzyme genes (e.g., *REG1A*, *PRSS1*, *PRSS2*, *SPINK1*, *CTRB1*, *CPA1*, *CPA2*, *CELA3A*, *PNLIP*), which are characteristic of pancreatic exocrine function.
Islet Endocrine Cells
- Alpha Cells: Strongly express *GCG* (glucagon) and *CHGA*, consistent with their role in glucagon production and secretion.
- Beta Cells: Clearly identified by *INS* (insulin) and *IAPP* (amylin) expression, along with transcription factors like *NKX6-1* and zinc transporter *SLC30A8*, confirming their role in insulin synthesis and glucose regulation.
- Delta Cells: Marked by *SST* (somatostatin) expression, as expected for cells involved in paracrine regulation within the islets.
- Gamma (PP) Cells: Show exclusive expression of *PPY* (pancreatic polypeptide), reflecting their distinct endocrine function.
- Epsilon Cells: Identified by *GHRL* (ghrelin) expression, a relatively rare islet cell type.
- Ductal Cells: Characterized by cytokeratin genes (*KRT19*, *KRT7*) and other epithelial markers (e.g., *ANXA4*, *CLDN4*), supporting their role in forming the pancreatic duct system.
Stromal Cells
- Stellate Cells: Show expression of extracellular matrix components (e.g., *COL3A1*, *COL6A1*, *SPARC*, *TIMP3*) and growth factors (*TGFB1*, *PDGFB*), consistent with their known role in fibrosis and tissue remodeling.
- Endothelial Tip Cells: Marked by genes such as *ESM1* and *ANGPT2*, which are associated with angiogenesis and vascular development.
Immune Cells
- Macrophage Subtypes (M1, M2B): Display distinct marker sets, reflecting their functional polarization. M1 macrophages express pro-inflammatory markers like *IFNGR1* and *STAT1*, while M2B macrophages show scavenger receptor *MSR1* and collagen genes, consistent with reparative or regulatory functions.
- Schwann Cells: Identified by classic neural markers such as *S100B*, *MPZ*, and *PMP22*, reflecting their presence in the pancreatic nervous system.
Annotation Notes
The analysis confirms that the celltype_subset annotations are well-supported by highly specific and characteristic marker gene expression profiles. Each identified cell subset exhibits a unique molecular signature consistent with known pancreatic cell biology. The distinct expression patterns observed across both major cell types and their subtypes (e.g., different macrophage populations) suggest high resolution and accuracy in the single-cell annotations. This robust cell type identification forms a strong foundation for downstream differential expression, pathway, and cell-cell interaction analyses.
The presence of clear, specific markers even for relatively rare cell types like Epsilon cells or specific macrophage subtypes further validates the quality of the cell type assignments in this dataset.
4. Analysis of Minor Cell Type Population Dynamics in Pancreatic Conditions
[Analysis Visualization Results]...
Analysis Overview
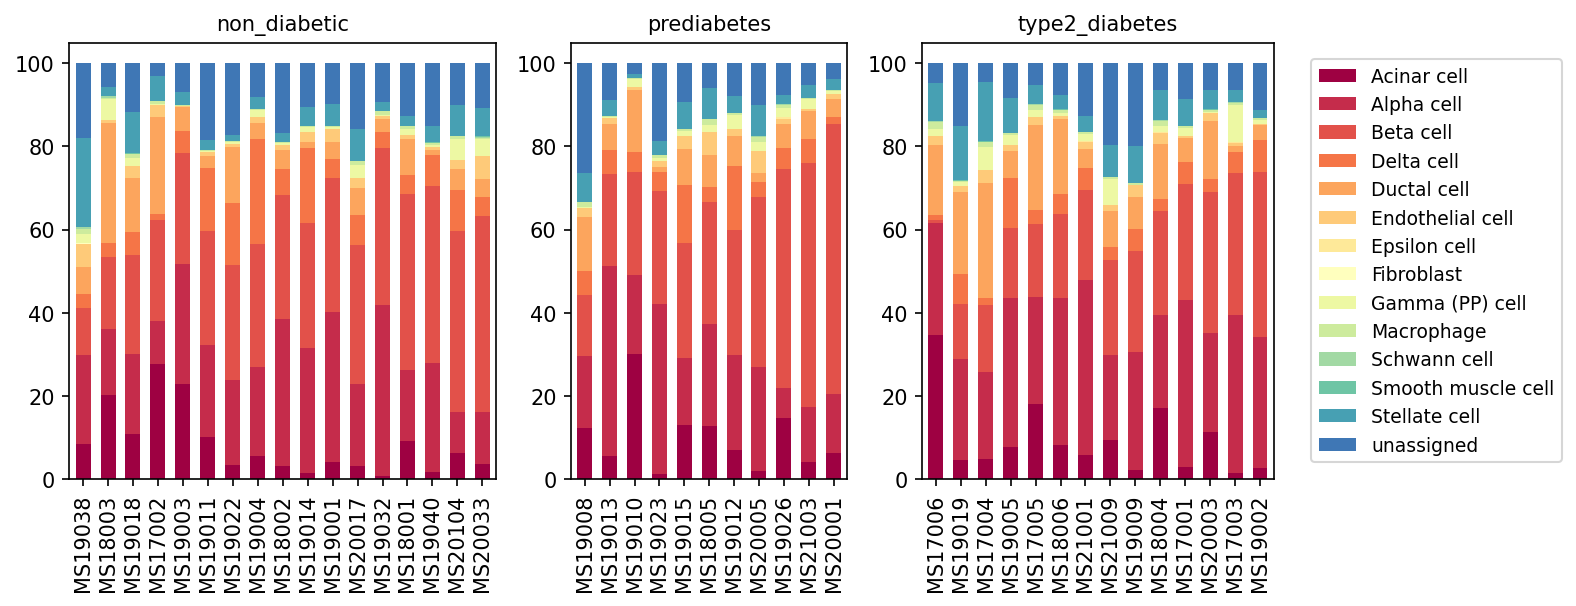
This analysis presents a population bar plot of minor cell types across individual pancreatic samples, stratified by three conditions: non_diabetic, prediabetes, and type2_diabetes. The purpose is to identify potential shifts in cell type proportions associated with the progression from a non-diabetic state through prediabetes to overt Type 2 Diabetes (T2D). This provides an initial overview of the cellular landscape changes in the pancreas under these metabolic conditions.
Visual Summary
The stacked bar plots display the relative proportions of 14 minor cell types within each sample. Samples are grouped by their respective conditions: non_diabetic, prediabetes, and type2_diabetes.
- Dominant Cell Types: Acinar cells, Alpha cells, Beta cells, Delta cells, and Ductal cells constitute the majority of the annotated cells across all conditions and samples.
- Beta Cell Proportion in T2D: A notable observation is the apparent reduction in the proportion of Beta cells (coral color) in many samples from the type2_diabetes group compared to both non_diabetic and prediabetes samples. While individual sample variability exists, a general trend of decreased Beta cell contribution to the overall pancreatic cellular composition is visible in T2D.
- Other Endocrine Cells: The proportions of Alpha cells (red) and Delta cells (orange) appear relatively stable or show slight, variable changes across the conditions.
- Ductal and Acinar Cells: Ductal cells (light orange) and Acinar cells (dark red) remain major components, without a clear, consistent trend of increase or decrease across the disease states based solely on visual inspection.
- Minor Stromal and Immune Cells: Cell types such as Endothelial cells, Epsilon cells, Fibroblasts, Gamma (PP) cells, Macrophages, Schwann cells, Smooth muscle cells, and Stellate cells constitute very small fractions of the total cell population across all samples and conditions. No dramatic shifts in these minor populations are immediately evident from this overview.
- "unassigned" Cell Population: A significant and highly variable proportion of cells in many samples across all conditions are labeled as "unassigned" (dark blue). This fraction can range from negligible to over 20-30% in some samples, introducing variability that could potentially mask subtle proportional changes in other cell types if not accounted for during more rigorous statistical analysis.
Biological Interpretation
The observed shifts in minor cell type populations, particularly the apparent reduction in Beta cells, are highly relevant to the biological context of Type 2 Diabetes within the Pancreas.
- Beta Cell Loss in T2D: The most significant finding is the visual indication of reduced Beta cell proportions in type2_diabetes samples. This aligns with the established understanding that progressive loss of functional Beta cell mass is a key pathological feature of Type 2 Diabetes, contributing to impaired insulin production and hyperglycemia PubMed Search: beta cell loss type 2 diabetes. This reduction can be due to increased apoptosis, decreased proliferation, or dedifferentiation of Beta cells in response to chronic metabolic stress and inflammation.
- Compensatory or Concomitant Changes: While not overtly apparent for all cell types, changes in the relative proportions of Alpha cells, Delta cells, or Ductal cells could reflect compensatory mechanisms or secondary effects of diabetes progression. For instance, Alpha cell hyperplasia or transdifferentiation from other islet cell types has been hypothesized in T2D, though complex and variable PubMed Search: alpha cell hyperplasia type 2 diabetes.
- Role of Immune and Stromal Cells: While the minor cell types (e.g., Macrophages, Fibroblasts, Stellate cells) do not show dramatic increases in this population overview, their subtle presence and potential shifts are biologically important. Increased pancreatic inflammation (mediated by immune cells like Macrophages) and fibrosis (mediated by Fibroblasts and Stellate cells) are known contributors to islet dysfunction and Beta cell demise in diabetes PubMed Search: pancreatic inflammation fibrosis type 2 diabetes. Further quantitative analysis would be needed to detect statistically significant changes in these smaller populations.
Annotation Notes
The substantial and variable proportion of "unassigned" cells across many samples represents a limitation in fully interpreting the cellular composition. This fraction could include cells that were difficult to classify due to low RNA content, unusual transcriptional states, or novel cell populations not captured by the current annotation scheme. Future efforts might involve re-clustering or re-annotating these "unassigned" cells to gain a more complete picture of the pancreatic cellular landscape and reduce potential bias in the relative proportions of assigned cell types.
Clinical or Translational Implications
The observed reduction in Beta cell proportions in Type 2 Diabetes samples provides direct cellular-level support for a central mechanism of the disease. Understanding the precise degree and mechanisms of Beta cell loss at a single-cell resolution is critical for developing therapies aimed at preserving or regenerating Beta cell mass. This type of analysis can:
- Identify Biomarkers: Help identify cell-type specific gene expression changes associated with Beta cell decline or altered function, potentially leading to novel diagnostic or prognostic biomarkers.
- Therapeutic Targets: Inform strategies for protecting Beta cells from apoptosis, promoting their proliferation, or inducing their differentiation from progenitor cells in diabetic patients.
- Disease Progression Monitoring: Serve as a baseline for monitoring the effectiveness of therapeutic interventions designed to influence pancreatic cell composition or function.
5. Macrophage Subset Population Shifts in Pancreatic Tissue Across Diabetes Progression
[Analysis Visualization Results]...
Analysis Overview
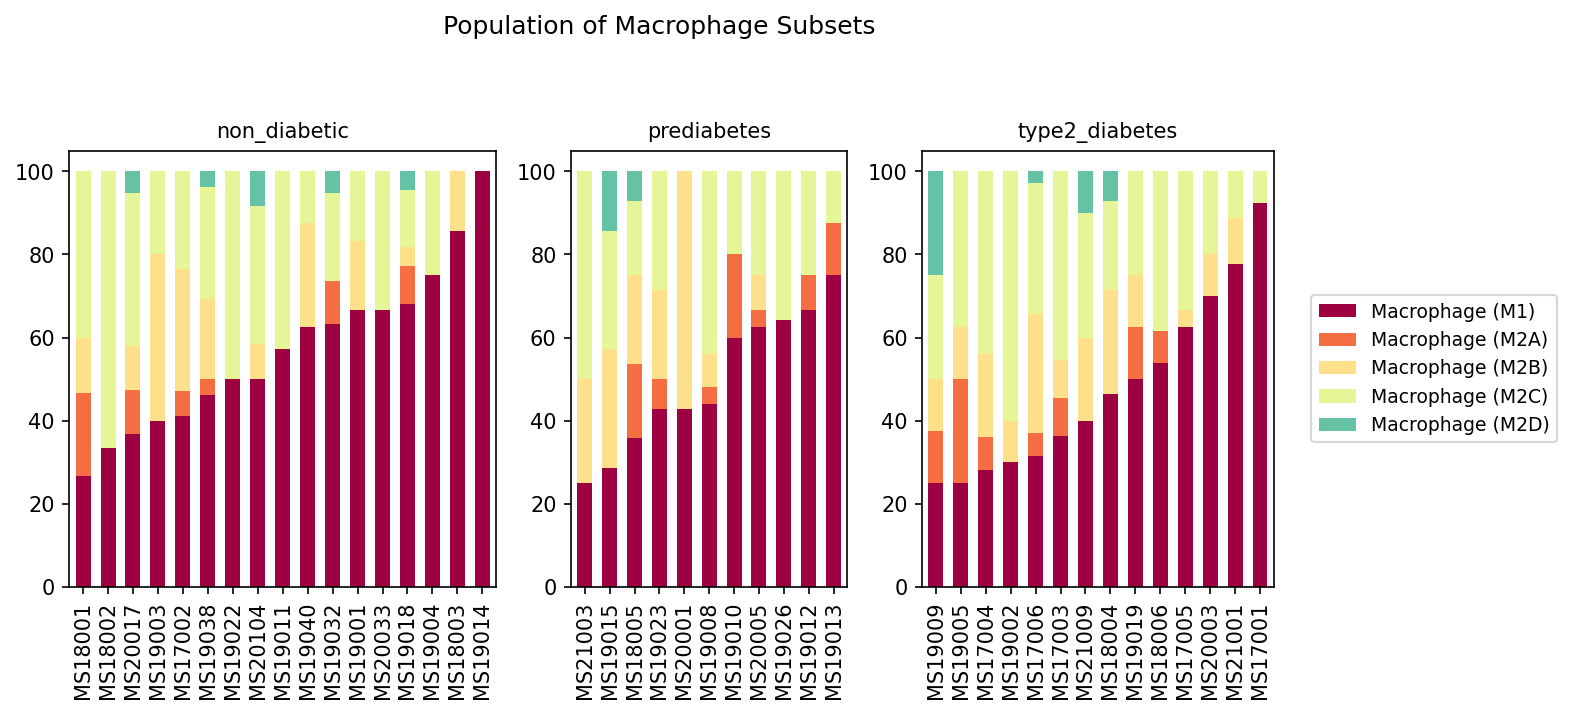
This analysis presents a population bar plot illustrating the proportions of different macrophage subsets (M1, M2A, M2B, M2C, M2D) within individual pancreatic tissue samples. The samples are grouped by their clinical condition: non_diabetic, prediabetes, and type2_diabetes, allowing for a comparison of macrophage polarization patterns across different stages of diabetes progression. The celltype_subset column was used to identify the specific macrophage subsets.
Visual Summary
The visualization displays stacked bar plots for each sample, with colors representing distinct macrophage subsets as indicated in the legend: Macrophage (M1) in deep red, Macrophage (M2A) in orange, Macrophage (M2B) in light yellow, Macrophage (M2C) in pale green, and Macrophage (M2D) in teal.
- Non-diabetic Condition: In non_diabetic samples, macrophage populations show considerable heterogeneity. Macrophage (M1) is present, often accounting for a significant portion, but M2 subtypes, particularly M2C and M2B, are also prominently represented, collectively forming a substantial fraction of the macrophage pool in many samples. Macrophage (M2A) and (M2D) are present in smaller proportions.
- Prediabetes Condition: In the prediabetes group, there appears to be a trend towards an increased proportion of Macrophage (M1) compared to the non_diabetic samples in many individuals. Concurrently, the relative proportions of M2B and M2C macrophages appear to decrease in several prediabetic samples, suggesting a shift in the overall macrophage polarization state. M2A and M2D remain relatively minor components.
- Type 2 Diabetes Condition: Samples from type2_diabetes individuals consistently show the highest proportions of Macrophage (M1), often dominating the macrophage population (frequently exceeding 50% and reaching up to ~90% in some samples). This is accompanied by a marked reduction in the proportions of M2B and M2C macrophages compared to both non_diabetic and prediabetes conditions. Macrophage (M2D) is nearly absent or at very low levels in most T2D samples, while M2A maintains a minor presence similar to prediabetes.
In summary, there is a clear trend of increasing Macrophage (M1) prevalence and a concomitant decrease in certain M2 macrophage subsets (especially M2B and M2C) as the disease progresses from non_diabetic to prediabetes and type2_diabetes within the pancreatic tissue.
Biological Interpretation
Macrophages are critical immune cells with diverse functions, broadly categorized into pro-inflammatory (M1) and anti-inflammatory/pro-resolving (M2) phenotypes. The observed shifts in macrophage subsets within the pancreas have significant biological implications for Type 2 Diabetes (T2D) pathology.
- M1 Macrophages and Inflammation in T2D: M1 macrophages are characterized by their pro-inflammatory cytokine production (e.g., TNF-α, IL-1β, IL-6), which contributes to chronic inflammation. The progressive increase in Macrophage (M1) populations from non_diabetic to prediabetes and especially in type2_diabetes suggests a heightened and sustained pro-inflammatory environment in the pancreatic tissue. In the context of T2D, such chronic inflammation in the pancreas is known to contribute to insulin resistance and the dysfunction and eventual death of pancreatic beta cells, which are responsible for insulin production [1].
- M2 Macrophages and Immune Regulation/Tissue Repair: M2 macrophages are generally associated with resolving inflammation, tissue repair, and immune suppression. The observed decrease in M2B and M2C macrophages in prediabetes and type2_diabetes suggests a diminished capacity for anti-inflammatory responses or tissue remodeling in the diseased pancreas. This imbalance, favoring M1 over M2 phenotypes, can perpetuate inflammatory cycles and hinder tissue recovery, accelerating disease progression. M2C macrophages, for instance, are known for their anti-inflammatory role through IL-10 production [2].
The shift towards an M1-dominant macrophage phenotype highlights the central role of pancreatic inflammation in the pathogenesis and progression of T2D. This inflammatory milieu likely contributes to the metabolic dysregulation characteristic of the disease.
Clinical or Translational Implications
The distinct shifts in macrophage polarization observed in the pancreas across different stages of diabetes progression offer potential clinical and translational insights:
- Biomarker for Disease Progression: The increasing proportion of M1 macrophages and the corresponding decrease in M2 macrophages could serve as a potential cellular biomarker for monitoring the progression from normoglycemia to prediabetes and full-blown Type 2 Diabetes. Further research could explore whether specific macrophage subset ratios could predict disease onset or severity.
- Therapeutic Targets: Modulating macrophage polarization could represent a novel therapeutic strategy for T2D. Interventions aimed at suppressing M1 activation or promoting M2 differentiation (particularly M2B and M2C) in the pancreas might help reduce chronic inflammation, improve insulin sensitivity, and protect beta-cell function. Such approaches could potentially slow or even reverse disease progression.
- Understanding Pathophysiology: These findings deepen our understanding of the immune landscape in the diabetic pancreas, emphasizing the role of innate immune cells in driving chronic inflammation central to T2D.
References
- M1 Macrophages in Type 2 Diabetes Pancreas Inflammation: For an overview of macrophage roles in pancreatic inflammation and insulin resistance in T2D, refer to general reviews on the topic. PubMed search: M1 macrophages type 2 diabetes pancreas inflammation
- M2 Macrophages and their Functions: For details on M2 macrophage subtypes and their roles in inflammation resolution and tissue repair. GeneCards: Macrophage M2
6. Pancreatic Cell-Cell Interaction Patterns in Type 2 Diabetes and Prediabetes
[Analysis Visualization Results]...
Analysis Overview
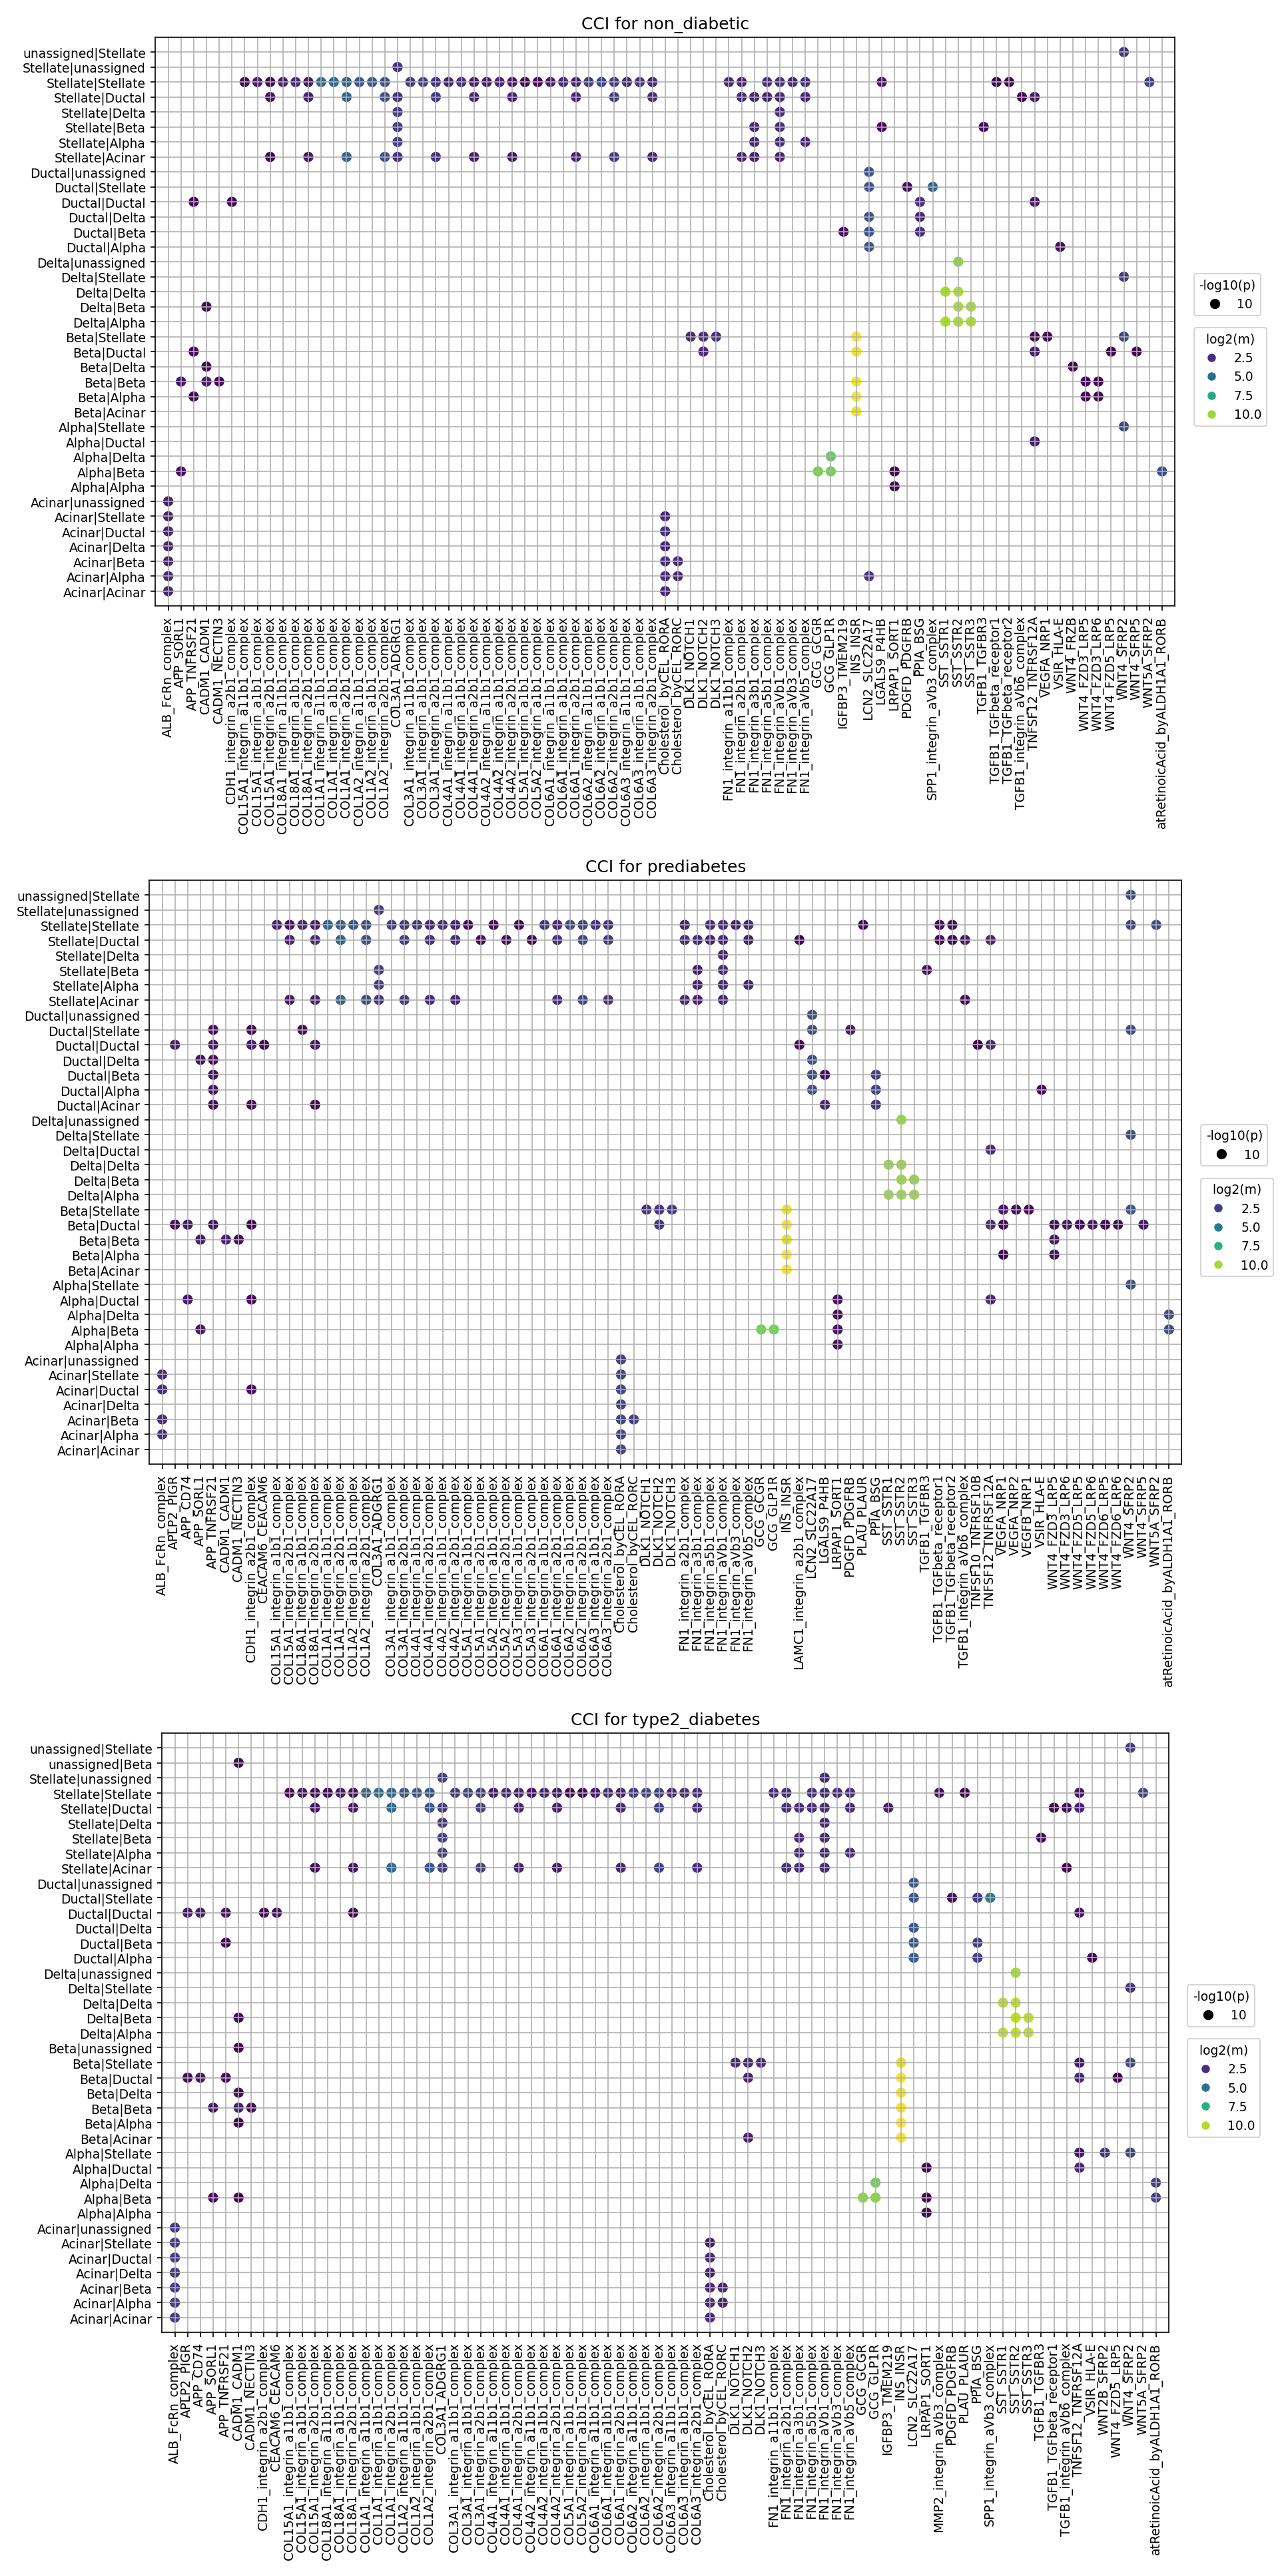
This analysis investigates cell-cell interaction (CCI) patterns within the human pancreas across different metabolic conditions: non_diabetic, prediabetes, and type2_diabetes. Utilizing CellPhoneDB, ligand-receptor interactions were identified and visualized using dot plots. The plots display the top 80 cell-cell interactions, with dot size representing the statistical significance (-log10(p-value)) and dot color indicating the mean expression level (log2(mean)) of the interacting ligand-receptor pair. The primary goal is to identify condition-specific changes in intercellular communication that may contribute to the progression of Type 2 Diabetes.
Visual Summary
The three dot plots illustrate significant cell-cell interaction profiles for non_diabetic, prediabetes, and type2_diabetes conditions.
- Widespread Integrin Signaling: Integrin complexes, including those involving COL18A1, FN1, and LAMC1, are consistently identified as major interacting partners across nearly all cell-cell pairs and conditions. These interactions generally show high significance (large dots) and varying mean expression levels (color intensity).
- Increased TGFB1 Signaling in Disease: A notable observation is the enhanced activity of TGFB1-TGFB_receptor and TGFB1-TGFBR2 interactions in both the prediabetes and type2_diabetes conditions compared to the non_diabetic state. These interactions appear more frequently, with higher significance and, importantly, substantially higher mean expression (brighter green/yellow dots), especially among Ductal, Beta, Alpha, and Acinar cells, as well as interactions involving 'unassigned' cells.
- Elevated SPP1-Integrin Interactions: Similarly, interactions involving the SPP1-integrin_aVb_complex show a marked increase in both significance and mean expression in prediabetes and type2_diabetes. This is particularly evident in interactions with Ductal, Beta, and Alpha cells.
- WNT Pathway Presence: WNT signaling components, specifically WNT4-FZD_LRP5, WNT4-FZD_LRP6, and various WNT5A interactions, are observed across conditions. While present, their changes are less dramatic than TGFB1 and SPP1 signaling, though some specific WNT5A interactions (e.g., Beta-Delta) appear more prominent in type2_diabetes.
- Cell-Type Specificity: Many interactions occur between homologous cell types (e.g., Alpha-Alpha, Beta-Beta, Ductal-Ductal), indicating autocrine or homotypic paracrine signaling. Heterologous interactions (e.g., Stellate-Alpha, Ductal-Delta) also contribute significantly to the communication landscape. Stellate cells are notably involved in several integrin-related interactions.
Biological Interpretation
The observed shifts in cell-cell communication patterns provide critical insights into the pancreatic microenvironment during the progression to Type 2 Diabetes.
- Extracellular Matrix Remodeling and Cellular Adhesion: The pervasive presence of integrin-mediated interactions underscores their fundamental role in maintaining pancreatic tissue structure, cell adhesion, and cell-matrix interactions. Integrins are essential for sensing and responding to changes in the extracellular matrix (ECM), which is known to undergo significant remodeling in diabetic pancreata. These changes can influence islet architecture, cell survival, and function. GeneCards: ITGB1
- TGFB1 as a Driver of Diabetes Pathophysiology: The prominent upregulation of TGFB1-TGFB_receptor signaling in prediabetes and Type 2 Diabetes is highly significant. Transforming Growth Factor Beta 1 (TGFB1) is a powerful pro-fibrotic and pro-inflammatory cytokine. In the context of the pancreas, elevated TGFB1 signaling can lead to:
- Islet fibrosis: Contributing to the deposition of excessive ECM, which can impair islet function and insulin secretion.
- Beta-cell dysfunction and loss: Directly inducing apoptosis or reducing the functional capacity of insulin-producing beta cells.
- Inflammation: Modulating the activity of immune cells and other stromal cells.
This finding is consistent with established mechanisms of diabetes progression involving chronic inflammation and fibrosis in the pancreatic islets. PubMed Search: TGFB1 diabetes pancreas fibrosis
- SPP1 (Osteopontin) in Inflammation and Dysfunction: The increased activity of SPP1-integrin_aVb_complex interactions in disease states points to heightened inflammatory and pro-fibrotic processes. Secreted Phosphoprotein 1 (SPP1), also known as Osteopontin, is a cytokine involved in immune cell recruitment, inflammation, and tissue remodeling. Its upregulation in prediabetes and T2D suggests its involvement in:
- Islet inflammation: Attracting and activating macrophages, contributing to immune cell infiltration within the islets.
- Beta-cell stress: Directly impacting beta-cell survival and function through inflammatory mechanisms.
The interaction of SPP1 with integrins on various cell types mediates these effects, suggesting a direct role in pancreatic pathology. GeneCards: SPP1
- WNT Signaling and Pancreatic Homeostasis: While less dramatically altered than TGFB1 and SPP1, WNT signaling plays a crucial role in pancreatic development, beta-cell proliferation, and maintenance. Subtle dysregulations in WNT pathway activity could reflect impaired regenerative capacity or altered cellular responses to metabolic stress in the diseased pancreas. PubMed Search: WNT signaling beta cell diabetes
Clinical or Translational Implications
The findings highlight specific intercellular communication pathways that are dysregulated in prediabetes and Type 2 Diabetes, offering potential avenues for therapeutic intervention and biomarker discovery.
- Therapeutic Target Prioritization: The significant increase in TGFB1-TGFB_receptor and SPP1-integrin_aVb_complex signaling identifies these pathways as prime candidates for therapeutic targeting in T2D. Strategies to inhibit TGF-beta signaling or block SPP1-integrin interactions could potentially mitigate islet fibrosis, reduce inflammation, and preserve beta-cell mass and function, thereby slowing or reversing disease progression.
- Biomarker Development: Components of the TGFB1 and SPP1 pathways, or their downstream effectors, could serve as novel circulating or tissue-specific biomarkers for early detection of prediabetes or monitoring disease severity and therapeutic response in T2D.
- Experimental Validation: The identified specific cell-cell pairs and ligand-receptor interactions warrant rigorous experimental validation. In vitro co-culture models of pancreatic islet cells (e.g., Beta-Ductal, Alpha-Acinar, Stellate-Macrophage) or in vivo diabetes models could be used to confirm the functional relevance of these interactions and test the efficacy of targeting these pathways.
- Understanding Disease Heterogeneity: The nuanced changes across various cell-cell pairs underscore the complexity of T2D and suggest that therapeutic approaches may need to consider cell-type-specific communication networks rather than broad interventions. For instance, specific integrin-ligand interactions involving Stellate cells could be targeted to address pancreatic fibrosis.
7. Condition-Specific Cell-Cell Interactions Involving Pancreatic Stellate Cells in Diabetes Progression
[Analysis Visualization Results]...
Analysis Overview
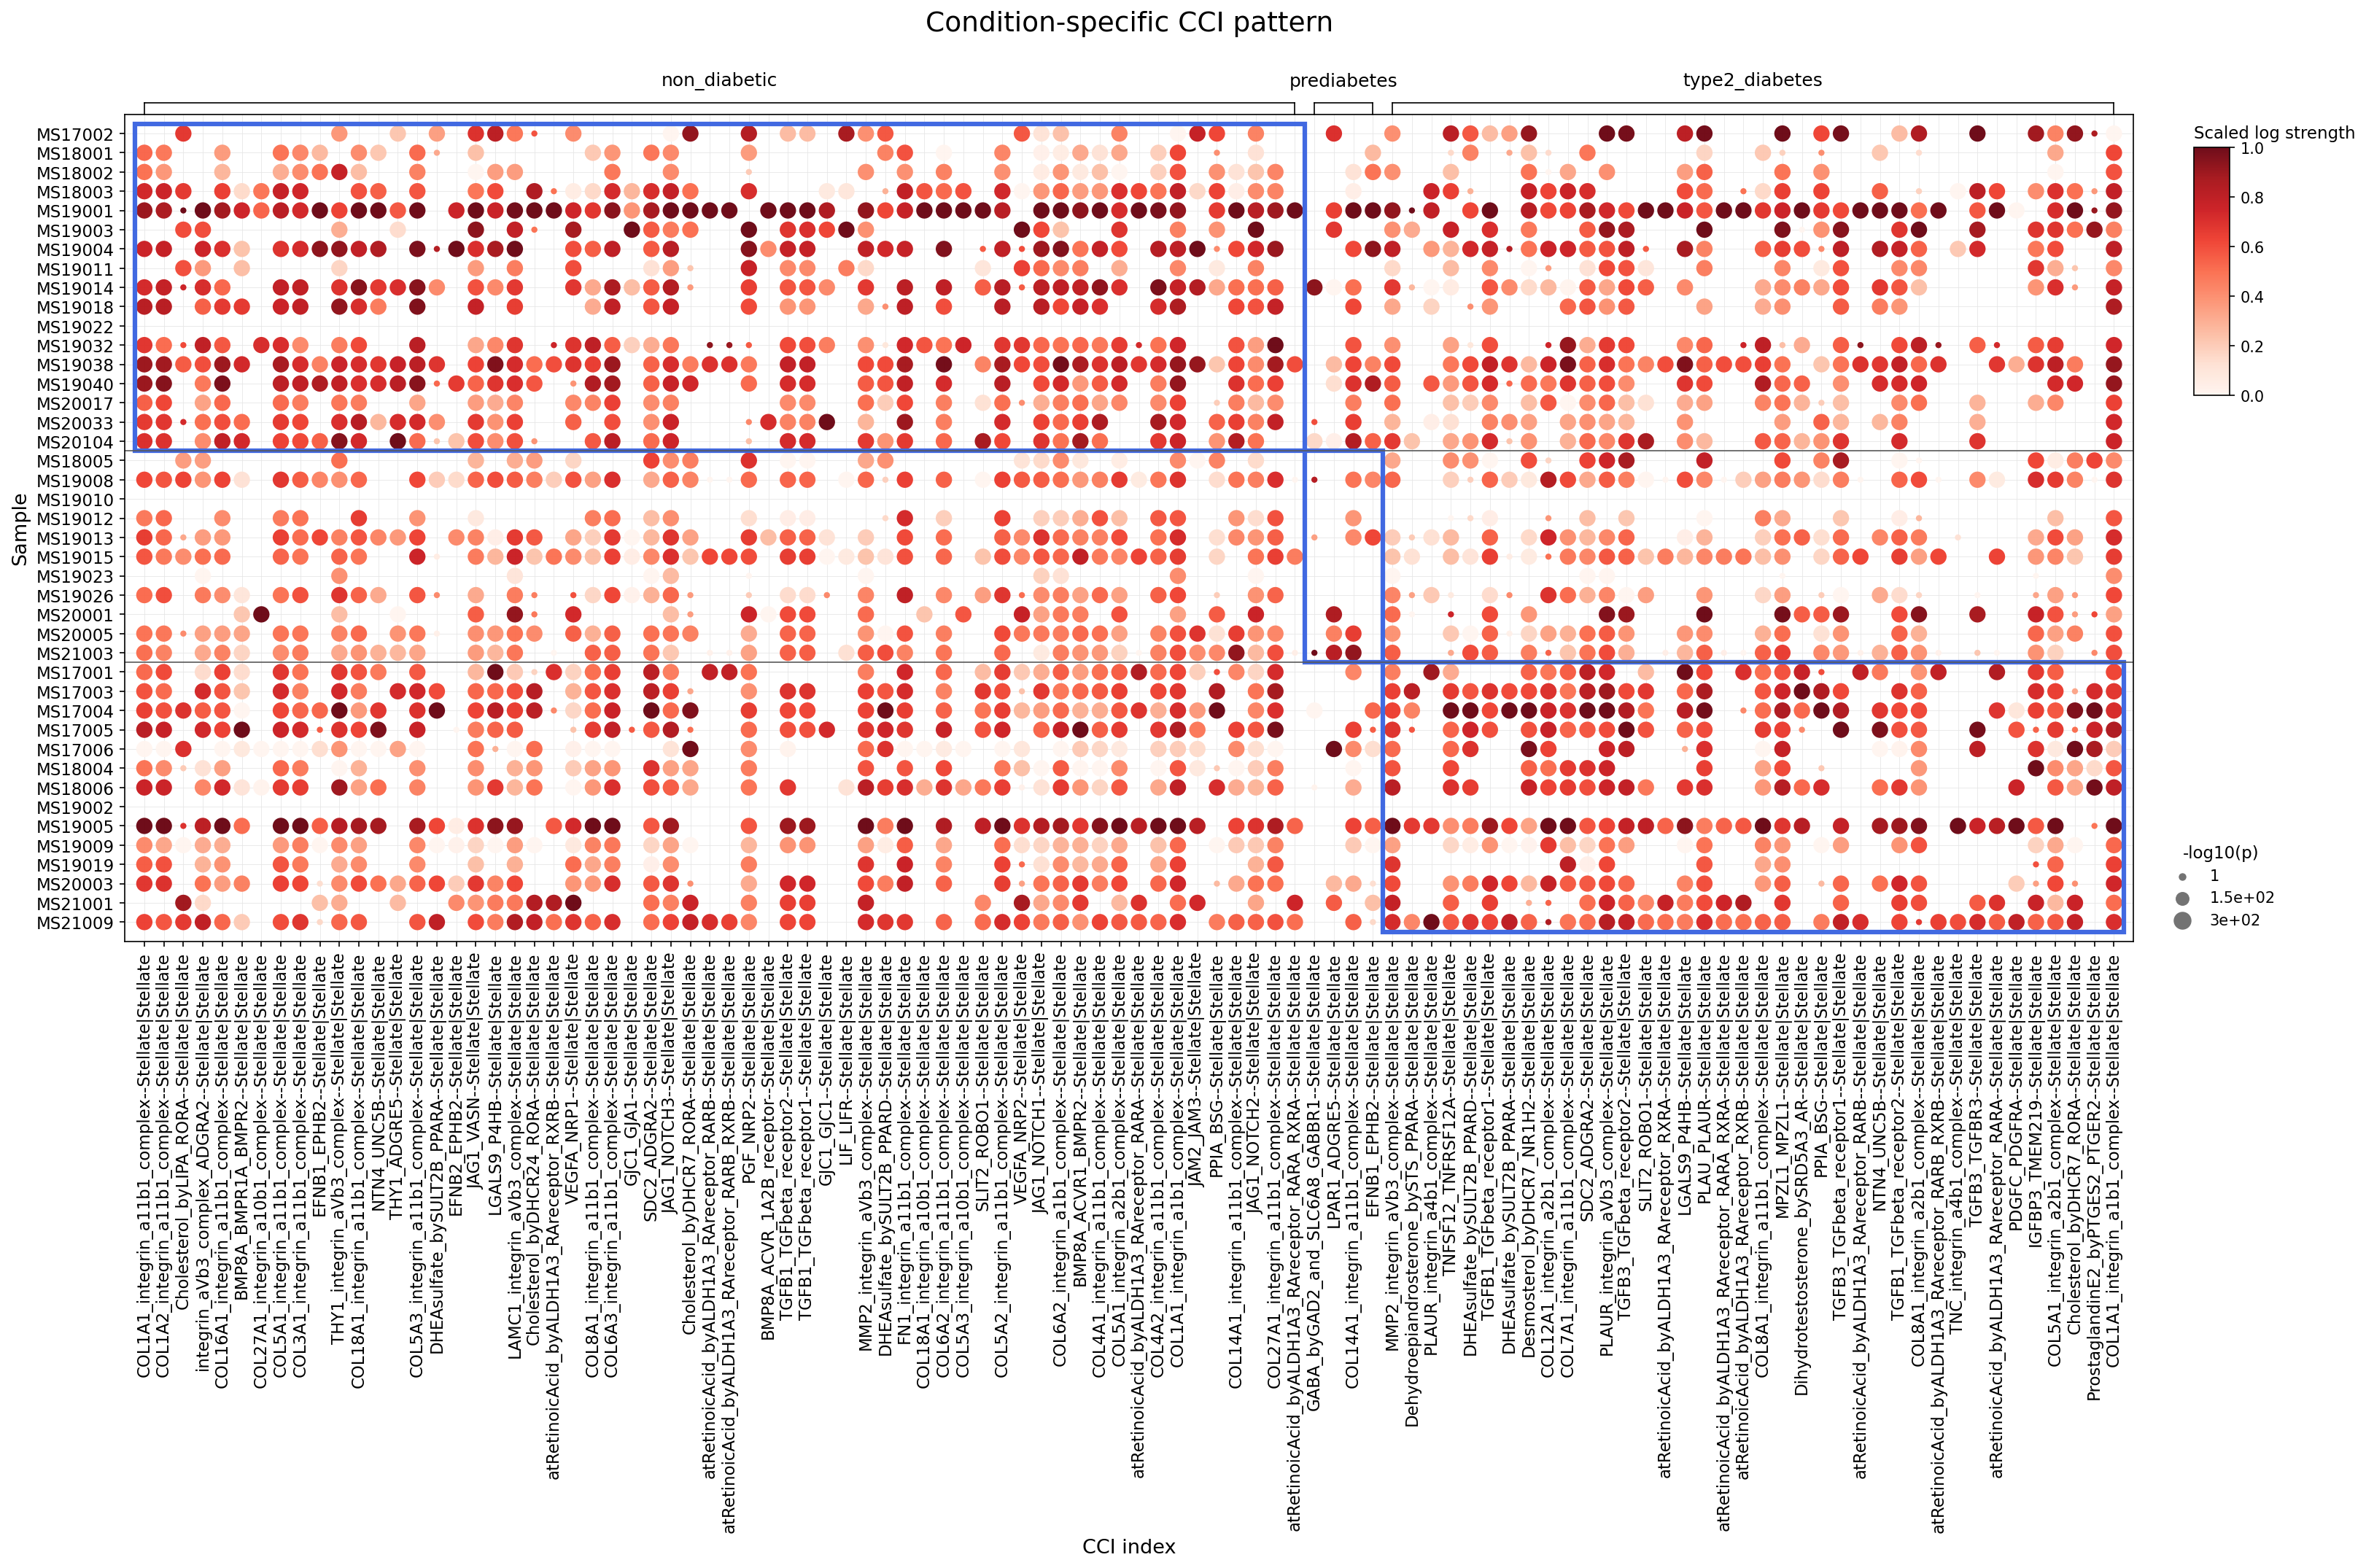
This analysis investigates condition-specific cell-cell interactions (CCI) within the pancreas, focusing on key stromal cells (Stellate cells, Fibroblast) and immune cells (Myeloid cell, Macrophage) across non_diabetic, prediabetes, and type2_diabetes conditions. The dot plot visualizes the strength and significance of these interactions between individual samples. Notably, the visualization predominantly highlights interactions between Stellate cells themselves (Stellate-Stellate interactions), suggesting these are the most significantly altered or prominent among the selected cell types and conditions as determined by the plot_dot_for_cci_with_signif_difference tool with the applied parameters.
Visual Summary
The dot plot displays a complex landscape of Stellate-Stellate cell-cell interactions, differentiated by condition and sample. Each dot's size represents the significance (-log10(p-value)), and its color intensity indicates the scaled interaction strength.
- Non-diabetic Condition: Samples from non-diabetic individuals generally exhibit strong and significant Stellate-Stellate interactions for a wide array of ligand-receptor pairs. Prominent interactions involve various Collagen-integrin complexes (e.g., COL1A1, COL1A2, COL3A1, COL4A1, COL5A1, COL5A3, COL6A2, COL7A1, COL8A1, COL14A1, COL18A1 with their respective integrin partners). Retinoic Acid signaling (atRetinoicAcid_byALDH1A3_RAReceptor), BMP8A-BMPR1A/BMPR2, and TGFB1-TGFbeta_receptor2 interactions are also notably strong.
- Prediabetes Condition: In prediabetes, there is a generalized reduction in both the strength and significance of many Stellate-Stellate interactions compared to the non-diabetic state. The dots are typically smaller and lighter in color, indicating diminished communication. This suggests an early stage of pancreatic microenvironment alteration where Stellate cell activity or responsiveness might be suppressed or altered.
- Type 2 Diabetes Condition: The pattern in type 2 diabetes (T2D) is more heterogeneous and dynamic. While some interactions remain attenuated, others appear to re-emerge or even intensify compared to prediabetes, and in some cases, exceed the levels observed in non-diabetic samples.
- Increased Activity: Interactions such as MMP2_integrin_avb3_complex--Stellate-Stellate, SDC2_ADGRA2--Stellate-Stellate, THY1_ADGRE5--Stellate-Stellate, and several Cholesterol-related interactions (e.g., Cholesterol_byDHCR7_RORA, Cholesterol_byDHCR7_SCARB1) show particularly strong signals in T2D samples.
- Variable Activity: Collagen-integrin interactions show variability, with some samples displaying stronger signals than prediabetes, suggesting complex ECM remodeling. ProstaglandinE2_byPTGES2_PTGER2 and PDGFC_PDGFRA also show notable activity in T2D.
Biological Interpretation
Pancreatic Stellate Cells (PSCs) are crucial mesenchymal cells that contribute significantly to the pancreatic microenvironment, playing roles in extracellular matrix (ECM) remodeling, inflammation, and fibrosis, which are highly relevant to Type 2 Diabetes pathogenesis.
- ECM Remodeling and Fibrosis:
- Collagen-Integrin Interactions: The widespread reduction in various collagen-integrin interactions in prediabetes may reflect an early disruption of normal ECM homeostasis. Integrins are critical for PSC adhesion, migration, and activation. Their altered interactions can influence the mechanical properties of the tissue and subsequent cellular responses. The varied pattern in T2D could indicate heterogeneous PSC activation states and ongoing, dysregulated fibrosis.
- MMP2-integrin avb3 complex: The striking increase in MMP2_integrin_avb3_complex--Stellate-Stellate interactions in T2D is highly significant. Matrix Metalloproteinase-2 (MMP2) is a key enzyme involved in degrading components of the ECM, particularly type IV collagen found in basement membranes. Activated PSCs are a major source of MMP2. Enhanced MMP2 activity contributes to ECM breakdown and remodeling, facilitating tissue fibrosis and potentially aiding PSC migration and invasion, which are hallmarks of chronic pancreatic inflammation and damage in T2D. GeneCards: MMP2
- TGFB1-TGFbeta_receptor: TGF-β signaling is a potent pro-fibrotic pathway. Its initial reduction in prediabetes might indicate early attempts to limit fibrotic progression, but its continued presence and variability in T2D suggest that it remains an active, albeit complex, driver of fibrosis.
- Retinoid Metabolism and PSC Activation:
- Retinoic Acid Signaling: Normal quiescent PSCs store vitamin A (retinoids) and exhibit active retinoic acid signaling. Upon activation, PSCs lose their retinoid stores and alter their retinoic acid metabolic pathways. The strong Retinoic Acid interactions in non-diabetic samples and their general attenuation in prediabetes align with PSC activation, which involves loss of quiescence and retinoid depletion. The re-emergence of strong signals in some T2D samples could reflect heterogeneity in PSC states or a complex feedback loop where dysregulated retinoid signaling contributes to disease progression rather than healthy maintenance. PubMed Search: pancreatic stellate cells retinoic acid diabetes
- Metabolic Dysregulation and Inflammation:
- Cholesterol-related interactions (e.g., Cholesterol_byDHCR7): The increased activity of cholesterol-related interactions in T2D suggests altered lipid metabolism within PSCs. Dysregulated cholesterol pathways are linked to lipotoxicity, which can promote inflammation and stress in pancreatic cells, including PSCs, contributing to their activation and the progression of diabetes.
- Prostaglandin E2 (PGE2) Signaling: The presence of ProstaglandinE2_byPTGES2_PTGER2 interactions in T2D is indicative of heightened inflammatory processes. PGE2 is a lipid mediator with significant pro-inflammatory effects. Increased PGE2 signaling in PSCs could exacerbate pancreatic inflammation, contributing to islet dysfunction and fibrosis in diabetes. GeneCards: PTGER2
- Growth Factor and Developmental Pathways:
- BMP8A-BMPR1A/BMPR2: The reduction in BMP signaling in prediabetes and T2D may imply impaired regenerative capacity or altered differentiation states of PSCs, as BMPs are involved in pancreatic development and β-cell survival.
- PDGFC-PDGFRA: Platelet-derived growth factor (PDGF) signaling, active in T2D, is a known mitogen for mesenchymal cells, including PSCs. Sustained PDGF signaling can drive PSC proliferation and fibrogenesis, contributing to the pathological remodeling of the pancreatic microenvironment.
- VEGFA-NRP1: Changes in VEGFA signaling, a critical angiogenic factor, could reflect alterations in the pancreatic vascular network, which is often compromised in diabetes.
Clinical or Translational Implications
The observed condition-specific changes in Stellate-Stellate interactions underscore the central role of pancreatic stellate cells in the progression of Type 2 Diabetes. Targeting these specific intercellular communication pathways could offer novel therapeutic strategies.
- Anti-Fibrotic and ECM Modulating Therapies:
- MMP2 Inhibition: Given the enhanced MMP2_integrin_avb3_complex interactions in T2D, MMP2 represents a promising therapeutic target. Inhibiting MMP2 could attenuate ECM degradation, thereby reducing pancreatic fibrosis and improving islet function. Selective MMP2 inhibitors could be investigated for their potential to reverse or slow diabetes-associated fibrotic changes. PubMed Search: MMP2 inhibitors fibrosis diabetes
- Integrin Modulators: Modulating integrin activity, particularly those involved in collagen binding (e.g., specific alpha/beta integrin subunits), could reduce PSC activation, adhesion, and matrix production, thus mitigating fibrotic progression.
- Modulation of Retinoid Signaling:
- Strategies aimed at restoring retinoid levels or specifically modulating Retinoic Acid Receptor (RAR) signaling in activated PSCs could potentially revert them to a quiescent, non-fibrogenic state. This might involve the administration of specific retinoid agonists or precursors, carefully considering their systemic effects. PubMed Search: Retinoic acid pancreatic stellate cell therapy diabetes
- Targeting Inflammation and Lipid Metabolism:
- PGE2 Pathway Intervention: The increased PGE2 signaling in T2D suggests that targeting the PGE2 pathway, either through inhibition of its synthesis (e.g., COX-2 inhibitors, with caution due to systemic effects) or antagonism of its receptor PTGER2, could reduce local pancreatic inflammation and slow disease progression.
- Cholesterol Pathway Intervention: Interventions that normalize cholesterol biosynthesis and signaling in PSCs, potentially through dietary modifications or specific pharmacological agents, could alleviate lipotoxicity and reduce PSC activation, thereby contributing to a healthier pancreatic microenvironment.
8. Beta Cell Surfaceome Marker Expression in Type 2 Diabetes
[Analysis Visualization Results]...
Analysis Overview
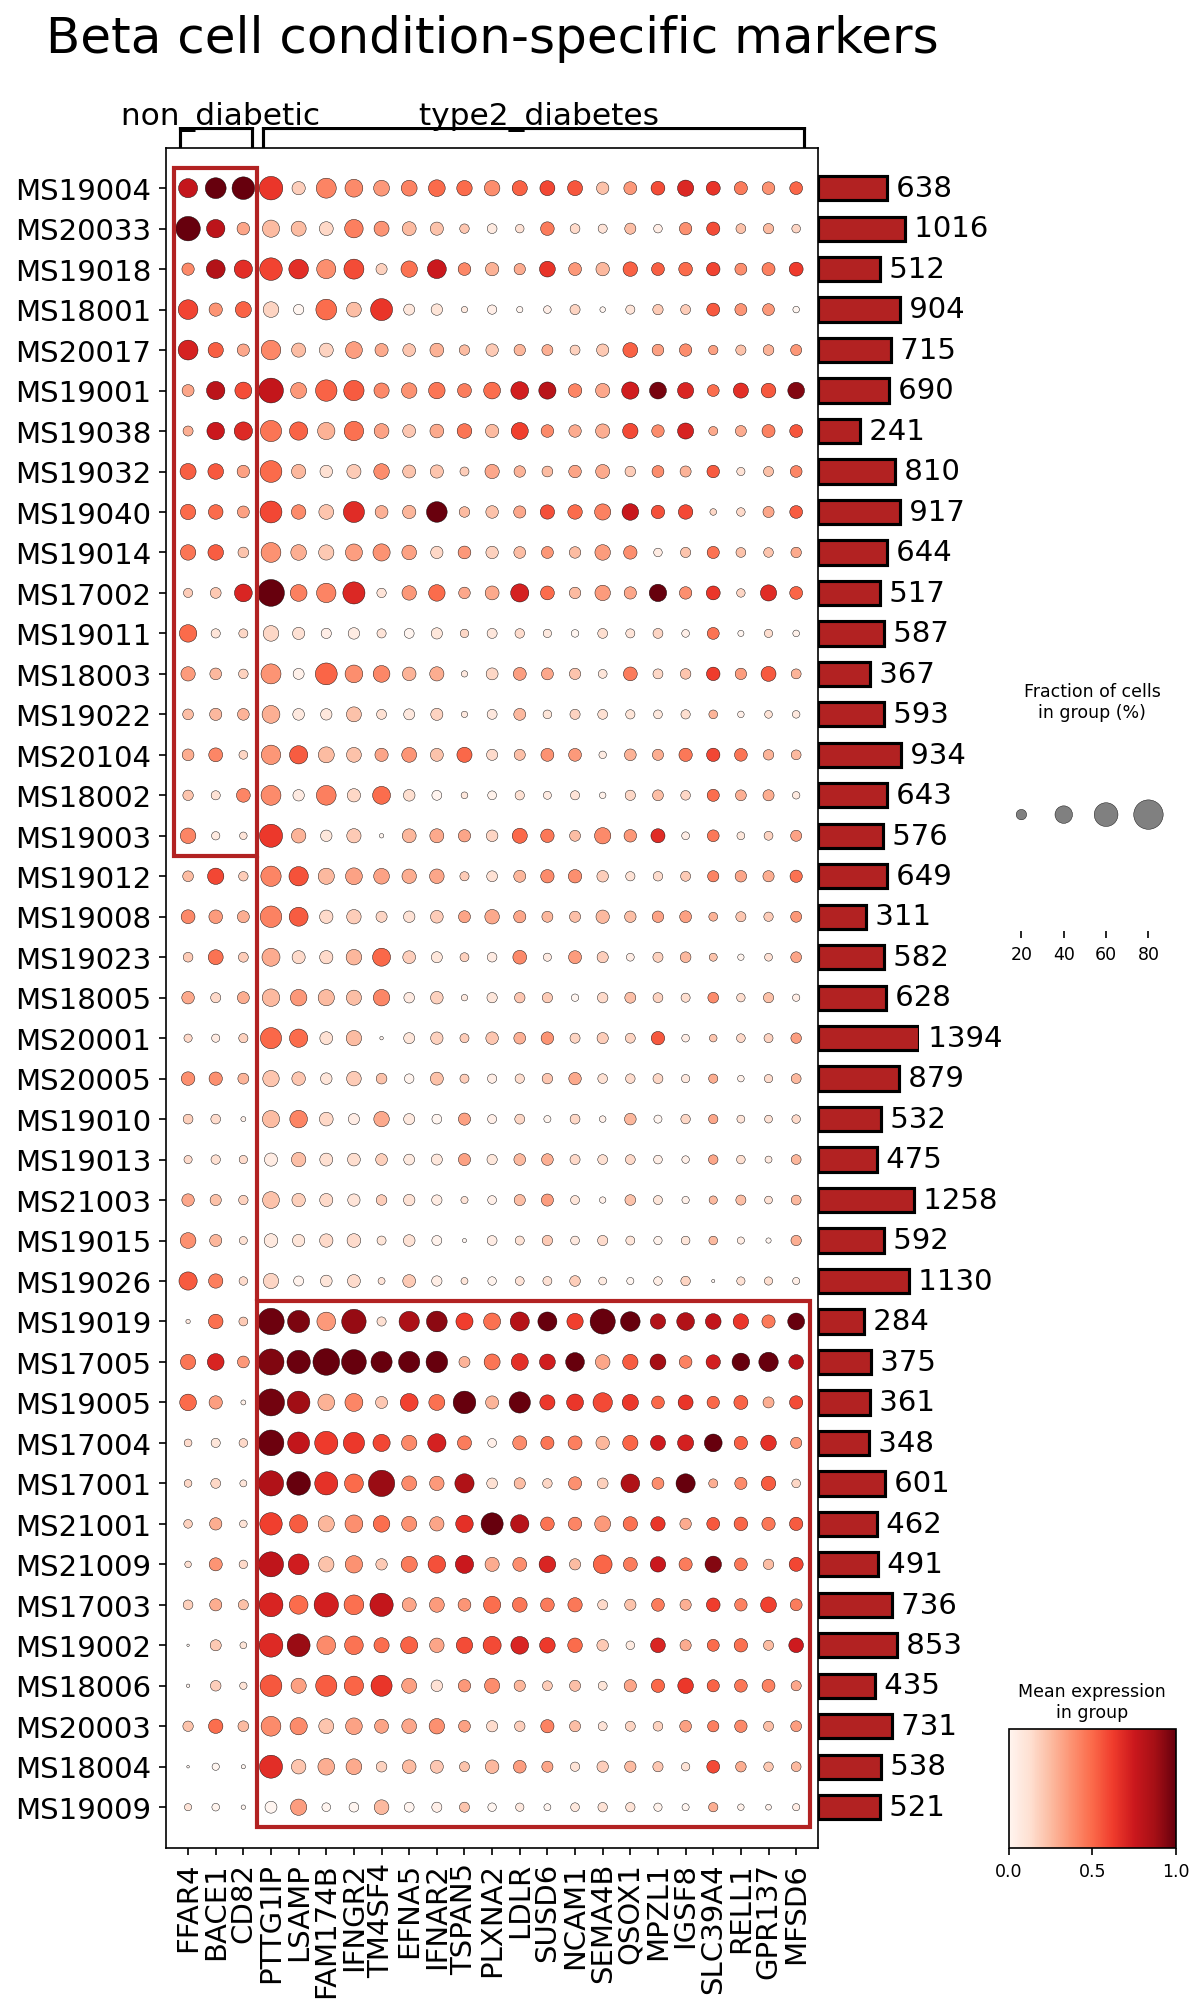
This analysis presents a dot plot illustrating the expression of selected surfaceome markers within Beta cells across 'non_diabetic' and 'type2_diabetes' conditions. The primary objective was to identify condition-specific surface markers in Beta cells, a key pancreatic cell type crucial for glucose homeostasis, and to infer their biological roles and potential as therapeutic targets for Type 2 Diabetes and prediabetes. The analysis focused on surfaceome markers due to their accessibility and relevance for cell-cell interactions and drug targeting.
Visual Summary
The dot plot displays approximately 50 surfaceome markers (y-axis) across individual samples grouped by condition (x-axis: 'non_diabetic' vs. 'type2_diabetes'). Each dot's color intensity indicates the mean expression level (reds, darker = higher expression), and its size represents the fraction of cells within that sample group expressing the marker. The bar plot on the right shows the total number of cells in each sample group.
Key observations from the plot:
- Differential Expression: A striking pattern emerges where a significant number of Beta cell surfaceome markers exhibit high expression levels (darker red dots) and a high fraction of expressing cells (larger dot sizes) in 'non_diabetic' samples.
- Reduced Expression in T2D: In contrast, most of these markers show notably reduced mean expression (lighter red or white dots) and/or a smaller fraction of expressing cells (smaller or absent dots) in 'type2_diabetes' samples. This suggests a widespread downregulation or loss of specific surface proteins on Beta cells during Type 2 Diabetes.
- Lack of Upregulated T2D Markers: The plot does not prominently feature markers that are specifically and highly upregulated in 'type2_diabetes' Beta cells compared to 'non_diabetic' cells. The markers presented primarily highlight those that are more characteristic of the non-diabetic state or are generally downregulated in T2D.
- Sample-Specific Variability: While the overall trend is clear, there is some sample-to-sample variability in marker expression within each condition, indicating heterogeneity among individuals.
Biological Interpretation
The observed downregulation of multiple surfaceome markers in Beta cells from type 2 diabetic individuals points towards profound changes in Beta cell identity, function, and interaction capabilities in the disease state. Surface proteins are critical for cell signaling, adhesion, migration, and nutrient sensing, making their altered expression highly relevant to Beta cell dysfunction in T2D.
Here, we interpret several prominent markers that are highly expressed in 'non_diabetic' Beta cells and generally diminished in 'type2_diabetes':
FFAR4 (Free Fatty Acid Receptor 4 / GPR120)
- Signaling Pathways & Mechanisms: FFAR4 is a G-protein coupled receptor that responds to long-chain fatty acids (LCFAs). Activation of FFAR4 on Beta cells can stimulate insulin secretion, promote Beta cell proliferation, and improve cell survival by activating signaling pathways such as ERK1/2 and Akt PubMed Search: FFAR4 Beta cell insulin secretion. It plays a role in lipid sensing and metabolic regulation.
- Pancreatic Relevance: In healthy Beta cells, FFAR4 contributes to glucose-stimulated insulin secretion (GSIS) and Beta cell mass maintenance. Its downregulation in T2D Beta cells could impair their ability to respond to LCFAs, contributing to reduced insulin secretion and increased susceptibility to lipotoxicity.
- Therapeutic Potential: FFAR4 agonists have been explored as potential therapeutic agents for T2D due to their insulin-sensitizing and anti-inflammatory properties, and their ability to improve Beta cell function and survival. Restoring or enhancing FFAR4 signaling could be beneficial.
CD82 (KAI1)
- Signaling Pathways & Mechanisms: CD82 is a member of the tetraspanin family, involved in cell adhesion, migration, proliferation, and signal transduction by organizing membrane microdomains and interacting with other surface proteins (e.g., integrins, growth factor receptors) GeneCards: CD82. It can modulate various signaling pathways affecting cell fate.
- Pancreatic Relevance: While not extensively studied in Beta cells specifically for diabetes, tetraspanins regulate various cellular processes. A loss of CD82 on Beta cells might disrupt cell-cell or cell-extracellular matrix interactions, potentially impacting Beta cell architecture, survival, or immune evasion mechanisms within the islet.
- Therapeutic Potential: Modulating tetraspanin interactions could be an indirect approach, but more direct evidence in Beta cell diabetes context is needed.
PTTG1IP (PTTG1 Interacting Protein)
- Signaling Pathways & Mechanisms: PTTG1IP, also known as PIMT, is involved in diverse cellular processes including proliferation, cell cycle regulation, and membrane trafficking. It can interact with PTTG1 (securin) and influence vesicular transport and protein secretion UniProt: PTTG1IP.
- Pancreatic Relevance: In Beta cells, its role might be linked to insulin granule formation, trafficking, and exocytosis. A decrease could imply impaired insulin secretion machinery.
- Therapeutic Potential: Directly targeting PTTG1IP for diabetes is not a known strategy, but understanding its role in insulin secretion could reveal novel pathways for intervention.
IFNGR2 (Interferon Gamma Receptor 2)
- Signaling Pathways & Mechanisms: IFNGR2 is a subunit of the interferon-gamma receptor, crucial for mediating the biological effects of IFN-γ, a pro-inflammatory cytokine. IFN-γ signaling typically involves the JAK-STAT pathway, leading to the activation of immune responses and regulation of cell proliferation and apoptosis GeneCards: IFNGR2.
- Pancreatic Relevance: While IFN-γ is known to induce Beta cell apoptosis in the context of autoimmunity (Type 1 Diabetes), its role in T2D Beta cells is more complex. Chronic low-grade inflammation is a hallmark of T2D. Downregulation of IFNGR2 in T2D Beta cells might suggest an altered immune surveillance or response capability, potentially making them more or less susceptible to inflammatory damage, depending on the context.
- Therapeutic Potential: Modulating IFN-γ signaling can be a target for autoimmune diseases. In T2D, if downregulation of IFNGR2 makes Beta cells less responsive to damaging inflammatory signals, it could be a compensatory mechanism. However, if it prevents beneficial immune crosstalk or immune cell clearance of dysfunctional cells, its restoration might be considered.
TSPAN5 (Tetraspanin 5)
- Signaling Pathways & Mechanisms: Like CD82, TSPAN5 is a member of the tetraspanin family, involved in organizing cell surface proteins and modulating cell adhesion, motility, and signaling UniProt: TSPAN5. It can influence membrane protein trafficking and receptor signaling.
- Pancreatic Relevance: Its presence on healthy Beta cells suggests a role in maintaining membrane integrity, cellular interactions, or specific signaling complexes necessary for normal Beta cell function. Its reduction in T2D Beta cells could contribute to a disorganized membrane environment, impacting Beta cell communication or function.
- Therapeutic Potential: Similar to CD82, direct targeting is not established, but understanding its role in Beta cell membrane organization could offer insights into novel therapeutic strategies.
LDLR (Low-Density Lipoprotein Receptor)
- Signaling Pathways & Mechanisms: LDLR is a cell surface receptor responsible for the uptake of cholesterol-rich LDL particles from the bloodstream into cells. It is crucial for maintaining cellular cholesterol homeostasis GeneCards: LDLR.
- Pancreatic Relevance: Beta cells require cholesterol for membrane synthesis and insulin granule formation. Dysregulation of cholesterol metabolism is implicated in Beta cell dysfunction and T2D progression. Reduced LDLR expression could impair cholesterol uptake, leading to intracellular cholesterol imbalances that impact insulin secretion and Beta cell survival.
- Therapeutic Potential: Enhancing LDLR activity in Beta cells could potentially improve lipid handling and reduce lipotoxicity, a known contributor to Beta cell failure in T2D. Statins, which upregulate LDLR, are widely used for dyslipidemia, but their direct Beta cell protective effects via LDLR are still an area of research.
NCAM1 (Neural Cell Adhesion Molecule 1)
- Signaling Pathways & Mechanisms: NCAM1 is a cell adhesion molecule primarily known for its roles in neural development and plasticity. It mediates homophilic (NCAM-NCAM) and heterophilic interactions, influencing cell adhesion, migration, and differentiation, often through interactions with various growth factor receptors and signaling molecules UniProt: NCAM1.
- Pancreatic Relevance: NCAM1 is expressed in pancreatic islets and plays a role in islet development and Beta cell aggregation. Loss of NCAM1 might impair Beta cell-to-cell adhesion, islet architecture, and potentially insulin secretion efficiency or Beta cell survival, contributing to islet dysfunction in T2D.
- Therapeutic Potential: Maintaining or enhancing Beta cell adhesion and integrity through molecules like NCAM1 could be a strategy to support Beta cell mass and function.
SEMA4B (Semaphorin 4B)
- Signaling Pathways & Mechanisms: Semaphorins are a large family of guidance cues involved in diverse processes, including axon guidance, immune regulation, and organogenesis. SEMA4B can act as a ligand for plexin receptors, mediating cell-cell communication and influencing cell migration and survival GeneCards: SEMA4B.
- Pancreatic Relevance: Its presence on Beta cells suggests a role in islet innervation, vascularization, or immune cell interactions within the islet microenvironment. Altered SEMA4B expression could disrupt these delicate balances, potentially contributing to islet neuropathy or impaired immune privilege in T2D.
- Therapeutic Potential: Semaphorin-plexin signaling is a complex area; specific therapeutic applications in T2D Beta cells are not yet established, but it could offer a target for modulating islet microenvironment.
SLC39A4 (Solute Carrier Family 39 Member 4 / ZIP4)
- Signaling Pathways & Mechanisms: SLC39A4 is a zinc transporter protein, responsible for zinc uptake into the cytoplasm. Zinc is essential for various cellular functions, including insulin synthesis, storage, and secretion UniProt: SLC39A4.
- Pancreatic Relevance: Beta cells have a high demand for zinc, which co-crystallizes with insulin in secretory granules. Reduced SLC39A4 expression in T2D Beta cells could lead to zinc deficiency, impairing insulin biosynthesis, processing, and storage, thereby contributing to Beta cell failure and dysfunctional insulin secretion.
- Therapeutic Potential: Improving zinc homeostasis in Beta cells through strategies that enhance zinc uptake or availability (e.g., zinc supplementation) could be a supportive therapy for T2D.
Clinical or Translational Implications
The widespread downregulation of critical surfaceome markers in Beta cells of type 2 diabetic individuals highlights a significant alteration in Beta cell phenotype, impacting their ability to sense nutrients, secrete insulin, interact with their environment, and potentially survive.
- Biomarker Discovery: The identified markers, particularly those with a clear reduction in T2D (e.g., FFAR4, LDLR, SLC39A4), could serve as potential biomarkers for Beta cell health and disease progression, potentially aiding in early diagnosis or monitoring of T2D.
- Therapeutic Target Identification:
- FFAR4: Agonists of FFAR4 represent a promising class of drugs for T2D by enhancing Beta cell function and survival, and improving insulin sensitivity.
- LDLR: Strategies to enhance Beta cell LDLR expression or function could ameliorate lipotoxicity and improve lipid handling, addressing a key pathological mechanism in T2D.
- SLC39A4: Given the critical role of zinc in Beta cell function, interventions aimed at optimizing zinc transport and homeostasis could support Beta cell health and insulin production.
- NCAM1 and Tetraspanins (CD82, TSPAN5): While not direct drug targets, understanding their role in Beta cell integrity and communication could inform strategies to preserve islet architecture and function.
- Phenotypic Reversal: The goal of T2D therapy is often to preserve or restore Beta cell function. Investigating whether these downregulated markers can be re-expressed or their functions rescued by existing or novel therapies could provide new avenues for intervention. For instance, drugs that reduce metabolic stress on Beta cells might help restore expression of these crucial surface proteins, potentially reversing some aspects of Beta cell dysfunction in prediabetes or early T2D.
- Prediabetes Relevance: Identifying these changes in early stages (prediabetes) could be crucial for preventative strategies, allowing for interventions before irreversible Beta cell damage occurs. The dataset context, including 'prediabetes' condition, supports such an investigation, although this specific plot only compares 'non_diabetic' and 'type2_diabetes'. Further analysis comparing prediabetic Beta cells could reveal earlier shifts in these markers.
In summary, the observed pattern suggests a loss of Beta cell specific surface features in Type 2 Diabetes, impacting various aspects of their function and interaction. These surface proteins represent a rich source for understanding disease mechanisms and developing targeted therapies.
9. Macrophage Surfaceome Markers in Pancreatic Diabetes Progression
[Analysis Visualization Results]...
Analysis Overview
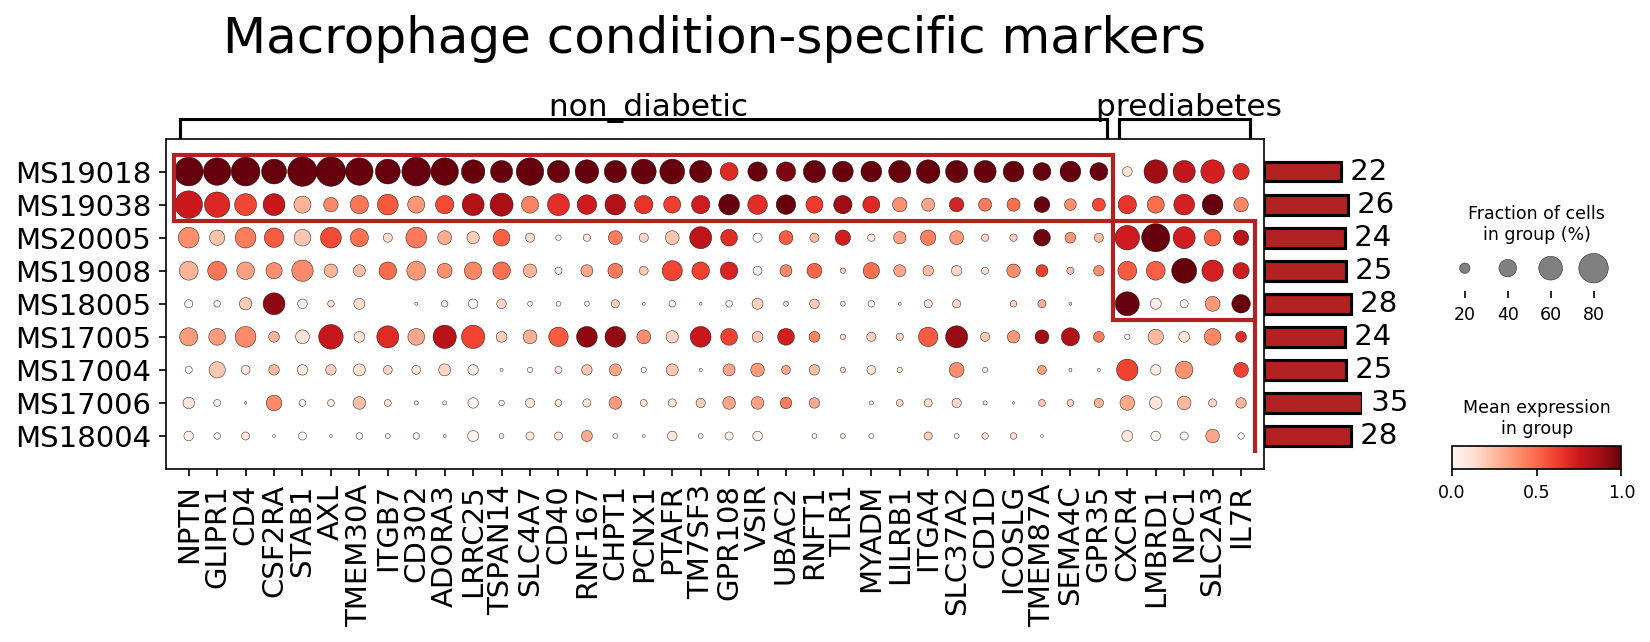
This analysis identifies condition-specific surfaceome markers expressed by Macrophage cells in the Pancreas, comparing non-diabetic and prediabetes conditions using single-cell RNA-seq data. The dot plot visualizes the expression of these markers across various samples, grouped by condition. The size of each dot represents the fraction of cells expressing the marker within a given sample, while the color intensity indicates the mean expression level of the marker in those cells. The goal is to highlight macrophage surface proteins that may play distinct roles in the healthy state versus the progression towards Type 2 Diabetes.
Visual Summary
The dot plot, titled "Macrophage condition-specific markers," displays the expression patterns of numerous surfaceome genes across several samples (e.g., MS19018, MS19038, MS20005) categorized under 'non_diabetic' and 'prediabetes' conditions.
- Non-diabetic Macrophage Profile: Samples classified as 'non_diabetic' (e.g., MS19018, MS19038) exhibit robust and widespread expression (large, dark red dots) of a broad panel of surface markers. Key examples include NPTN, GLIPR1, CD4, CSF2RA, STAB1, AXL, ITGB7, CD302, ADORA3, LRRC25, TSPAN14, SLC4A7, CD40, RNF167, CHPT1, PCNX1, PTAFR, TM7SF3, GPR108, UBAC2, RNF1, TLR1, MYADM, LILRB1, ITGA4, SLC37A2, CD1D, ICOSLG, TMEM87A, SEMA4C, GPR35. This suggests a highly active and diverse surfaceome signature in macrophages from non-diabetic pancreatic tissue.
- Prediabetes Macrophage Profile: Samples from the 'prediabetes' condition (e.g., MS17004, MS17006, MS18004) show a different pattern. While some markers are shared, a distinct set appears to be highly expressed or enriched in these samples. Notably, CXCR4, LMBRD1, NPC1, SLC2A3, and IL7R show prominent expression (large, dark red dots) in several prediabetes samples, suggesting their potential upregulation or specific expression in macrophages during the prediabetic state. Other markers like AXL are also expressed in prediabetes, sometimes with high intensity in specific samples (e.g., MS18005, MS17004, MS17006).
Overall, the plot reveals distinct surface protein signatures on macrophages in the non-diabetic and prediabetic pancreas, highlighting potential changes in immune cell function and interaction during early disease progression.
Biological Interpretation
The differential expression of surfaceome markers on macrophages in the pancreatic tissue between non-diabetic and prediabetic conditions suggests altered macrophage states, functions, and interactions during the development of Type 2 Diabetes. Macrophages are critical players in pancreatic inflammation and islet dysfunction in diabetes.
Here's a detailed interpretation of selected markers:
Markers Predominantly Expressed in Non-Diabetic Macrophages:
CD4:
- Signaling Pathways/Mechanisms: While primarily known as a T-cell co-receptor, CD4 is also expressed by certain macrophage subsets, where it can interact with MHC Class II molecules on antigen-presenting cells or with various ligands beyond traditional antigen presentation. Macrophage CD4 expression can influence their activation state, cytokine production, and phagocytic capacity.
- Pancreatic Relevance & Therapeutic Potential: Macrophages in the healthy pancreas play roles in tissue homeostasis and immune surveillance. CD4+ macrophages might contribute to maintaining immune tolerance or to specific functions that prevent inflammation. Modulating CD4 signaling on macrophages, if dysregulated, could theoretically impact immune responses, but its direct therapeutic targeting for diabetes in macrophages is less explored than in T cells.
- Related Agents: Given its primary role on T cells, many CD4-targeting agents are immunosuppressive (e.g., anti-CD4 antibodies). Their application in macrophages for diabetes would require highly specific targeting strategies.
- References: GeneCards: CD4
CD40:
- Signaling Pathways/Mechanisms: CD40 is a costimulatory receptor expressed on antigen-presenting cells (including macrophages) that binds to CD40 ligand (CD40L or CD154) on activated T cells. This interaction is crucial for initiating and sustaining adaptive immune responses, leading to macrophage activation, increased antigen presentation, and cytokine secretion (e.g., IL-12, TNF-alpha).
- Pancreatic Relevance & Therapeutic Potential: In the pancreas, CD40-CD40L interactions can drive islet inflammation and contribute to beta-cell damage in both type 1 and type 2 diabetes. High CD40 expression in non-diabetic macrophages might reflect a baseline immune surveillance or a readiness for adaptive immune responses. If this pathway becomes overactive in prediabetes, it could promote insulitis. Targeting CD40 or CD40L has been explored in autoimmune and inflammatory diseases to dampen immune responses.
- Related Agents: Anti-CD40L antibodies (e.g., efalizumab, though withdrawn for safety) or CD40 antagonists have been investigated for immunomodulation.
- References: GeneCards: CD40, PubMed Search: CD40 diabetes pancreas
TLR1:
- Signaling Pathways/Mechanisms: Toll-like receptor 1 (TLR1) forms a heterodimer with TLR2 and recognizes specific microbial components (e.g., bacterial lipopeptides). Upon ligand binding, it initiates intracellular signaling cascades (via MyD88) leading to the activation of NF-κB and MAPK pathways, resulting in the production of pro-inflammatory cytokines and chemokines.
- Pancreatic Relevance & Therapeutic Potential: Macrophages are key innate immune cells in the pancreas. TLR signaling can contribute to sterile inflammation in metabolic diseases, including diabetes, by responding to endogenous danger signals (DAMPs) released from stressed or dying cells. Baseline TLR1 expression in non-diabetic macrophages might be part of routine immune surveillance. Dysregulation or chronic activation of TLR pathways in the prediabetic state could fuel pancreatic inflammation and insulin resistance. Modulating TLR signaling could be a therapeutic strategy to reduce inflammation in diabetes.
- Related Agents: TLR antagonists or modulators are being developed for inflammatory conditions.
- References: GeneCards: TLR1, PubMed Search: TLR1 diabetes pancreas inflammation
STAB1:
- Signaling Pathways/Mechanisms: Stabilin-1 (STAB1) is a scavenger receptor expressed on specific endothelial cells and subsets of macrophages, including alternatively activated (M2) macrophages. It is involved in various processes such as lymphocyte adhesion, phagocytosis of apoptotic cells (efferocytosis), and clearance of extracellular matrix components. It can also bind to advanced glycation end products (AGEs).
- Pancreatic Relevance & Therapeutic Potential: Macrophages with high STAB1 expression might play a role in maintaining pancreatic tissue homeostasis by clearing cellular debris and reducing inflammation. In the context of prediabetes, a shift from homeostatic/M2-like macrophage functions to more pro-inflammatory states could be detrimental. Upregulation of STAB1 in non-diabetic macrophages suggests an important role in immune regulation or efferocytosis, which is critical for resolving inflammation. Enhancing efferocytosis could be a therapeutic goal in diabetes-related inflammation.
- Related Agents: No direct therapeutic agents targeting STAB1 for diabetes are currently established, but strategies aimed at boosting efferocytosis pathways could be relevant.
- References: GeneCards: STAB1, PubMed Search: STAB1 macrophage diabetes
Markers Predominantly Expressed in Prediabetes Macrophages:
CXCR4:
- Signaling Pathways/Mechanisms: C-X-C Motif Chemokine Receptor 4 (CXCR4) is a G protein-coupled receptor that binds to its ligand CXCL12 (stromal cell-derived factor-1, SDF-1). This interaction plays a critical role in cell migration, adhesion, proliferation, and survival. It is crucial for the trafficking and homing of various immune cells, including macrophages.
- Pancreatic Relevance & Therapeutic Potential: Increased CXCR4 expression on pancreatic macrophages in prediabetes could indicate enhanced recruitment of these cells to sites of inflammation in the islets or surrounding pancreatic tissue, or their retention within these areas. Macrophage infiltration is a hallmark of pancreatic inflammation in diabetes, contributing to beta-cell dysfunction and insulin resistance. Blocking CXCR4-CXCL12 signaling could potentially reduce pathogenic macrophage accumulation and alleviate pancreatic inflammation, making it a promising therapeutic target.
- Related Agents: Plerixafor (AMD3100) is a CXCR4 antagonist approved for stem cell mobilization; other CXCR4 inhibitors are under investigation for cancer and inflammatory diseases.
- References: GeneCards: CXCR4, PubMed Search: CXCR4 macrophage diabetes pancreas
SLC2A3 (GLUT3):
- Signaling Pathways/Mechanisms: Solute Carrier Family 2 Member 3 (SLC2A3), also known as Glucose Transporter 3 (GLUT3), is a high-affinity glucose transporter. While highly expressed in neurons, it can also be found in certain immune cells. Its expression reflects the cell's capacity for glucose uptake and metabolism.
- Pancreatic Relevance & Therapeutic Potential: Upregulation of GLUT3 on macrophages in prediabetes suggests an altered metabolic state, potentially indicating increased glucose demand or a shift in glucose utilization pathways within these macrophages. Macrophage metabolism is closely linked to their inflammatory phenotype. For example, some pro-inflammatory macrophages exhibit increased glycolysis. Altered glucose uptake by macrophages could influence their activation and effector functions, contributing to the inflammatory milieu in the prediabetic pancreas. Targeting macrophage glucose metabolism could offer a novel approach to modulate their inflammatory phenotype in diabetes.
- Related Agents: Indirect metabolic modulators could impact glucose uptake; however, specific GLUT3 inhibitors with macrophage specificity are not widely developed for diabetes.
- References: GeneCards: SLC2A3, PubMed Search: macrophage GLUT3 diabetes
NPC1:
- Signaling Pathways/Mechanisms: Niemann-Pick C1 protein (NPC1) is a lysosomal membrane protein essential for the intracellular transport of cholesterol and other lipids from lysosomes. Macrophages play a crucial role in lipid metabolism, particularly in the context of atherosclerosis and metabolic diseases, where they can accumulate lipids and become foam cells.
- Pancreatic Relevance & Therapeutic Potential: Upregulated NPC1 expression on macrophages in prediabetes could reflect altered cholesterol trafficking and lipid handling. Dysregulated lipid metabolism in macrophages contributes to inflammation and insulin resistance in obesity and diabetes. For example, lipid-laden macrophages accumulate in adipose tissue and islets, promoting inflammation. Modulating macrophage lipid metabolism through targets like NPC1 could reduce lipid accumulation and subsequent inflammation, potentially improving pancreatic function and insulin sensitivity.
- Related Agents: No direct therapeutic agents targeting NPC1 for diabetes are in widespread use, but approaches to improve macrophage cholesterol efflux or reduce lipid uptake could be considered.
- References: GeneCards: NPC1, PubMed Search: macrophage NPC1 diabetes
IL7R:
- Signaling Pathways/Mechanisms: Interleukin-7 Receptor (IL7R) is typically a key receptor for the cytokine IL-7, crucial for the development, survival, and proliferation of lymphocytes (T and B cells). While less commonly associated with mature macrophages, its expression could indicate specific macrophage subsets, alternative differentiation pathways, or the presence of macrophage progenitors with lymphocyte-like characteristics.
- Pancreatic Relevance & Therapeutic Potential: The presence of IL7R on macrophages in prediabetes could suggest an involvement in specific immune regulatory processes or an altered differentiation state induced by the prediabetic microenvironment. If IL7R signaling plays a role in macrophage survival or activation in the inflamed pancreas, its modulation could impact the immune landscape. This is a less conventional macrophage marker for diabetes and warrants further investigation into the functional consequences of its expression.
- Related Agents: IL-7/IL7R modulators are explored in immune reconstitution and cancer, but their role in macrophage-driven diabetes is largely unexplored.
- References: GeneCards: IL7R, PubMed Search: macrophage IL7R diabetes
Clinical or Translational Implications
The distinct surfaceome profiles observed in non-diabetic versus prediabetic pancreatic macrophages offer valuable insights into the dynamic changes occurring during the early stages of Type 2 Diabetes development.
- Biomarker Discovery: The identified condition-specific markers (e.g., CXCR4, SLC2A3, NPC1) could serve as potential biomarkers for detecting macrophage activation states associated with prediabetes, aiding in early diagnosis or risk stratification.
- Therapeutic Targeting: Markers like CXCR4 represent attractive therapeutic targets. Inhibiting CXCR4 could reduce pathogenic macrophage infiltration and inflammation in the prediabetic pancreas, potentially preventing or slowing disease progression. Similarly, modulating the lipid (NPC1) and glucose (SLC2A3) metabolism of macrophages could reduce their pro-inflammatory activity.
- Understanding Disease Pathogenesis: These markers shed light on the functional shifts in macrophages – from homeostatic roles in non-diabetic individuals to potentially more pro-inflammatory and metabolically dysregulated states in prediabetes. This understanding is crucial for developing targeted interventions that address the root causes of pancreatic inflammation and beta-cell dysfunction in diabetes.
- Experimental Validation: Further experimental validation using spatial transcriptomics, immunohistochemistry, or functional assays will be crucial to confirm the localization of these macrophage subsets within the pancreas and to elucidate the precise functional consequences of these marker expressions in the context of diabetes progression. This could involve *in vitro* studies on macrophage differentiation and activation in high-glucose or high-lipid environments, or *in vivo* studies in animal models of prediabetes.
10. Gene Ontology (GSA) Analysis of Beta Cells Across Pancreatic Metabolic States
[Analysis Visualization Results]...
Analysis Overview
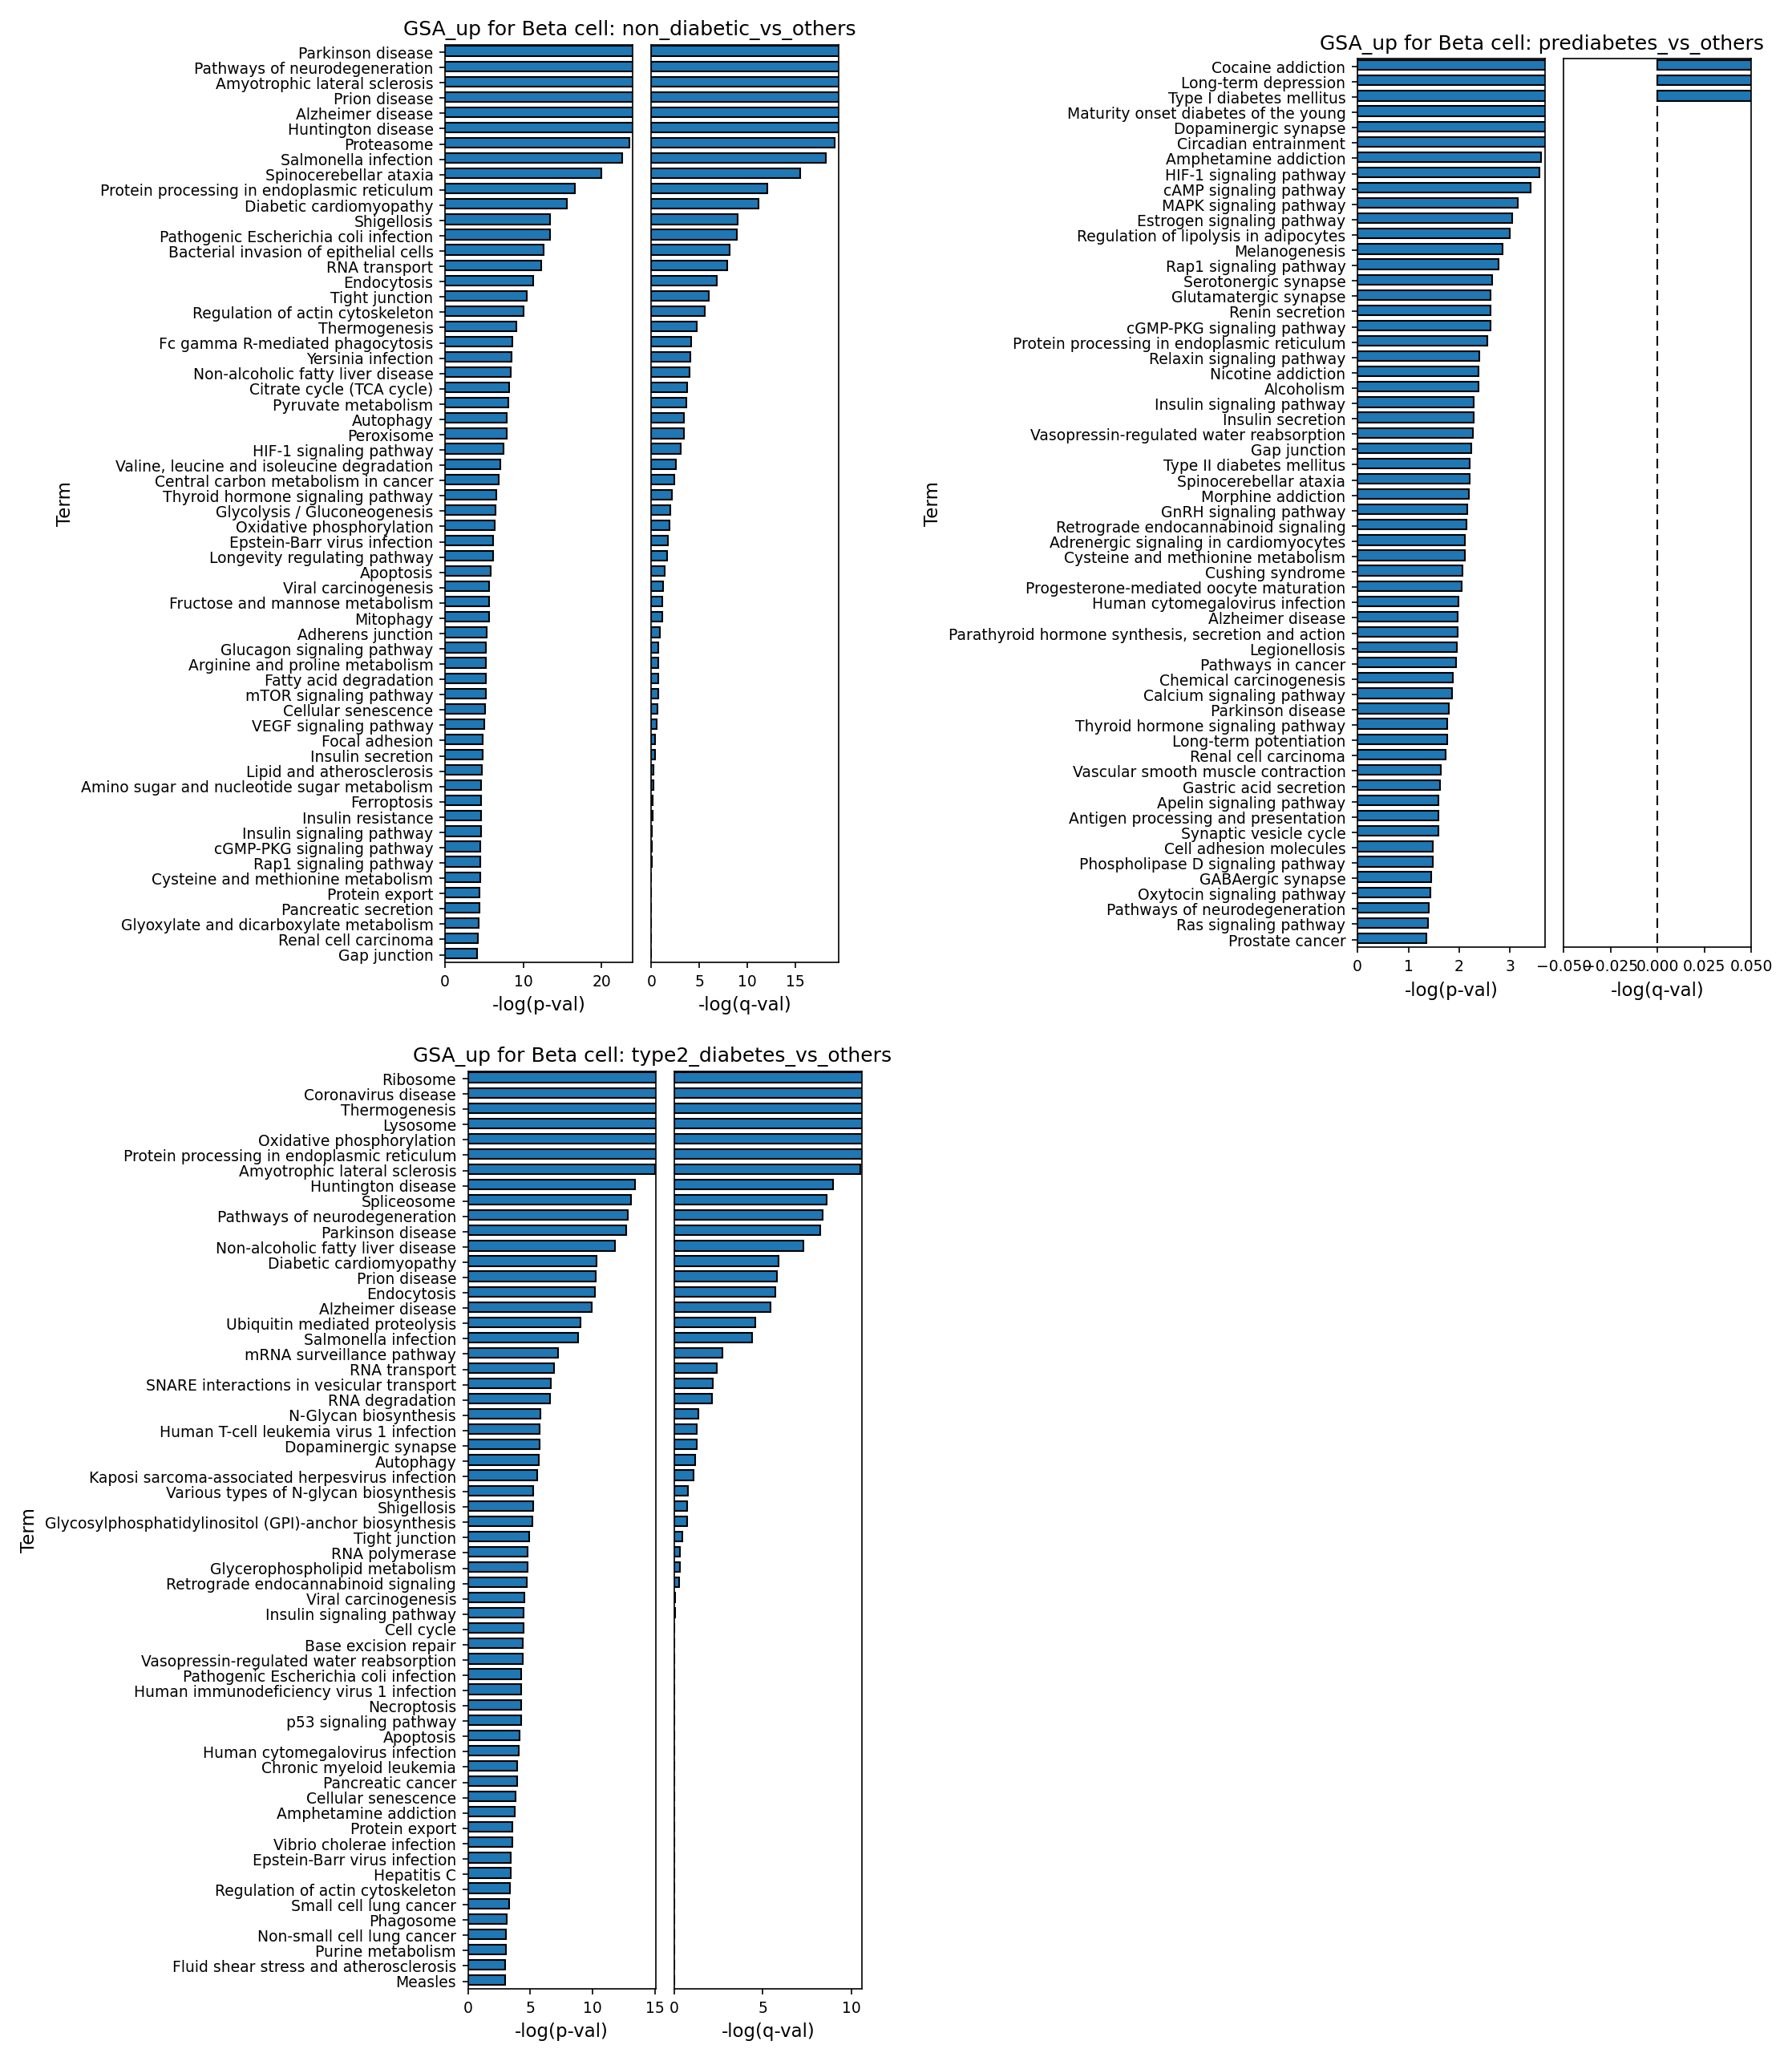
This analysis presents Gene Ontology (GO) enrichment results for Beta cells, a critical cell type in the pancreas responsible for insulin production, across different metabolic conditions: non_diabetic, prediabetes, and type2_diabetes. The Gene Set Analysis (GSA) was performed using the GO database, with a comparison strategy of each specific condition against all other conditions combined (e.g., 'non_diabetic' vs. 'prediabetes' + 'type2_diabetes'). The plots display the top enriched GO terms (up to 60) based on their statistical significance, quantified by -log(p-val) and -log(q-val). This approach aims to identify pathways uniquely upregulated (as indicated by GSA_up) in Beta cells specific to each disease state or the healthy condition.
Visual Summary
The analysis generated three bar plots, each representing GO term enrichment for Beta cells under a specific condition compared to the combined "others" conditions:
- non_diabetic_vs_others: This plot shows a substantial number of significantly enriched GO terms, with many terms exhibiting high -log(p-val) and -log(q-val) values (up to ~20). Notably, a prominent cluster of terms related to neurodegenerative diseases (e.g., 'Parkinson disease', 'Pathways of neurodegeneration', 'Alzheimer disease') appears at the top. Terms related to protein processing, stress responses, and specific metabolic pathways are also enriched.
- prediabetes_vs_others: In contrast to the other two plots, this panel shows considerably fewer significantly enriched terms, particularly when considering the -log(q-val). Only a handful of terms show minor q-value significance, and the p-values are generally much lower than in the other conditions. The most enriched terms by p-value include 'Cocaine addiction', 'Long-term depression', 'Type I diabetes mellitus', and 'Maturity onset diabetes of the young'.
- type2_diabetes_vs_others: This plot, similar to the non_diabetic comparison, displays numerous highly significant GO terms (high -log(p-val) and -log(q-val) values). Key terms related to cellular machinery, stress, and metabolism, such as 'Ribosome', 'Coronavirus disease', 'Thermogensis', 'Lysosome', 'Oxidative phosphorylation', and 'Protein processing in endoplasmic reticulum', are strongly enriched. Neurodegenerative disease terms also reappear here.
Overall, the 'prediabetes_vs_others' comparison shows a distinctly different and less robust enrichment profile compared to the 'non_diabetic_vs_others' and 'type2_diabetes_vs_others' comparisons, which both exhibit strong and numerous significant GO terms.
Biological Interpretation
The GO enrichment analysis highlights distinct pathway signatures in Beta cells depending on the metabolic state, providing insights into their functional adaptations and dysregulations.
Beta Cells in the Non-Diabetic State (non_diabetic_vs_others)
The enrichment of terms such as 'Protein processing in endoplasmic reticulum', 'Proteasome', and 'Oxidative phosphorylation' suggests active and well-regulated cellular machinery crucial for Beta cell function in the healthy state. These processes are essential for proper proinsulin synthesis, folding, degradation of misfolded proteins, and efficient ATP production to drive insulin secretion. The presence of 'Insulin signaling pathway' and 'Insulin secretion' further confirms the maintenance of key Beta cell functions. The prominent enrichment of neurodegenerative disease-associated pathways, while initially surprising in the pancreas, could reflect shared cellular stress response mechanisms, protein quality control systems, or pathways related to cellular longevity and resilience that are robustly active in healthy Beta cells and potentially compromised in diseased states. This could also suggest that genes involved in these broad processes are generally more active in a healthy, fully functional state when compared to the combined diseased states.
Beta Cells in Prediabetes (prediabetes_vs_others)
The significantly weaker enrichment signal in Beta cells from prediabetic individuals compared to the other conditions is notable. This might suggest that Beta cell dysfunction in prediabetes is either more subtle, heterogeneous, or primarily involves gene expression changes that do not strongly coalesce into broad GO terms when compared against the mixed "others" group (non_diabetic + type2_diabetes). The appearance of 'Type I diabetes mellitus' and 'Maturity onset diabetes of the young (MODY)' terms, even with moderate significance, could indicate early genetic predispositions or initial pathological shifts that share molecular underpinnings with these other forms of diabetes, potentially including early autoimmune components or specific genetic defects affecting Beta cell development and function.
Beta Cells in Type 2 Diabetes (type2_diabetes_vs_others)
The robust enrichment of terms like 'Ribosome', 'Protein processing in endoplasmic reticulum', 'Lysosome', and 'Oxidative phosphorylation' in type2_diabetes Beta cells points to increased metabolic workload, protein synthesis, and cellular stress.
- ER Stress and UPR: Upregulation of 'Ribosome' and 'Protein processing in endoplasmic reticulum' is a strong indicator of increased protein synthesis and potential endoplasmic reticulum (ER) stress. Chronic ER stress is a well-established mechanism contributing to Beta cell dysfunction and apoptosis in T2D, as the cells struggle to handle the increased demand for insulin production and processing of misfolded proteins PubMed search: Beta cell ER stress type 2 diabetes.
- Mitochondrial Dysfunction: 'Oxidative phosphorylation' enrichment suggests altered mitochondrial activity, which is crucial for glucose-stimulated insulin secretion. Mitochondrial dysfunction is a key contributor to Beta cell failure in T2D, impacting ATP generation and leading to oxidative stress GeneCards: PGC1A.
- Lysosomal Activity: Increased 'Lysosome' activity could indicate enhanced cellular degradation processes, potentially as a response to accumulated damaged organelles or proteins, or altered autophagic flux in diseased Beta cells.
- The recurrence of neurodegenerative disease terms may reflect generalized pathways of cellular stress, damage, and potential apoptosis that are active in conditions of chronic metabolic stress, extending beyond neuronal cells. Terms like 'Diabetic cardiomyopathy' and 'Insulin resistance' further confirm the pathological landscape associated with T2D.
Clinical or Translational Implications
The GSA results provide a molecular landscape of Beta cell adaptations and failures in diabetes progression, offering potential avenues for therapeutic intervention.
- Targeting ER Stress and Mitochondrial Dysfunction: The strong signals for 'Protein processing in endoplasmic reticulum' and 'Oxidative phosphorylation' in T2D Beta cells reinforce the critical role of ER stress and mitochondrial dysfunction in Beta cell failure. Modulating these pathways through pharmacological or lifestyle interventions could improve Beta cell survival and function in T2D.
- Prediabetes as a Critical Window: The relatively subdued pathway enrichment in prediabetes suggests that this stage might represent a more subtle, perhaps heterogeneous, molecular pathology. Interventions at this stage might need to be highly personalized or target specific early molecular triggers rather than broad pathway dysregulations, potentially focusing on preventing the escalation of ER stress or mitochondrial damage seen in overt T2D.
- Shared Stress Pathways: The consistent appearance of neurodegenerative disease pathways across conditions highlights common cellular stress responses or mechanisms of cellular demise that are relevant to Beta cell health. Understanding these shared pathways could uncover novel targets that promote Beta cell resilience and longevity in the face of metabolic challenges.
- Pancreatic Function: The presence of terms like 'Insulin signaling pathway' and 'Insulin secretion' across different states, with varying degrees of significance, underscores their central role. Strategies to preserve or restore these fundamental Beta cell functions remain paramount in diabetes management.
11. Gene Set Enrichment Analysis (GSEA) Across Pancreatic Cell Types in Diabetes
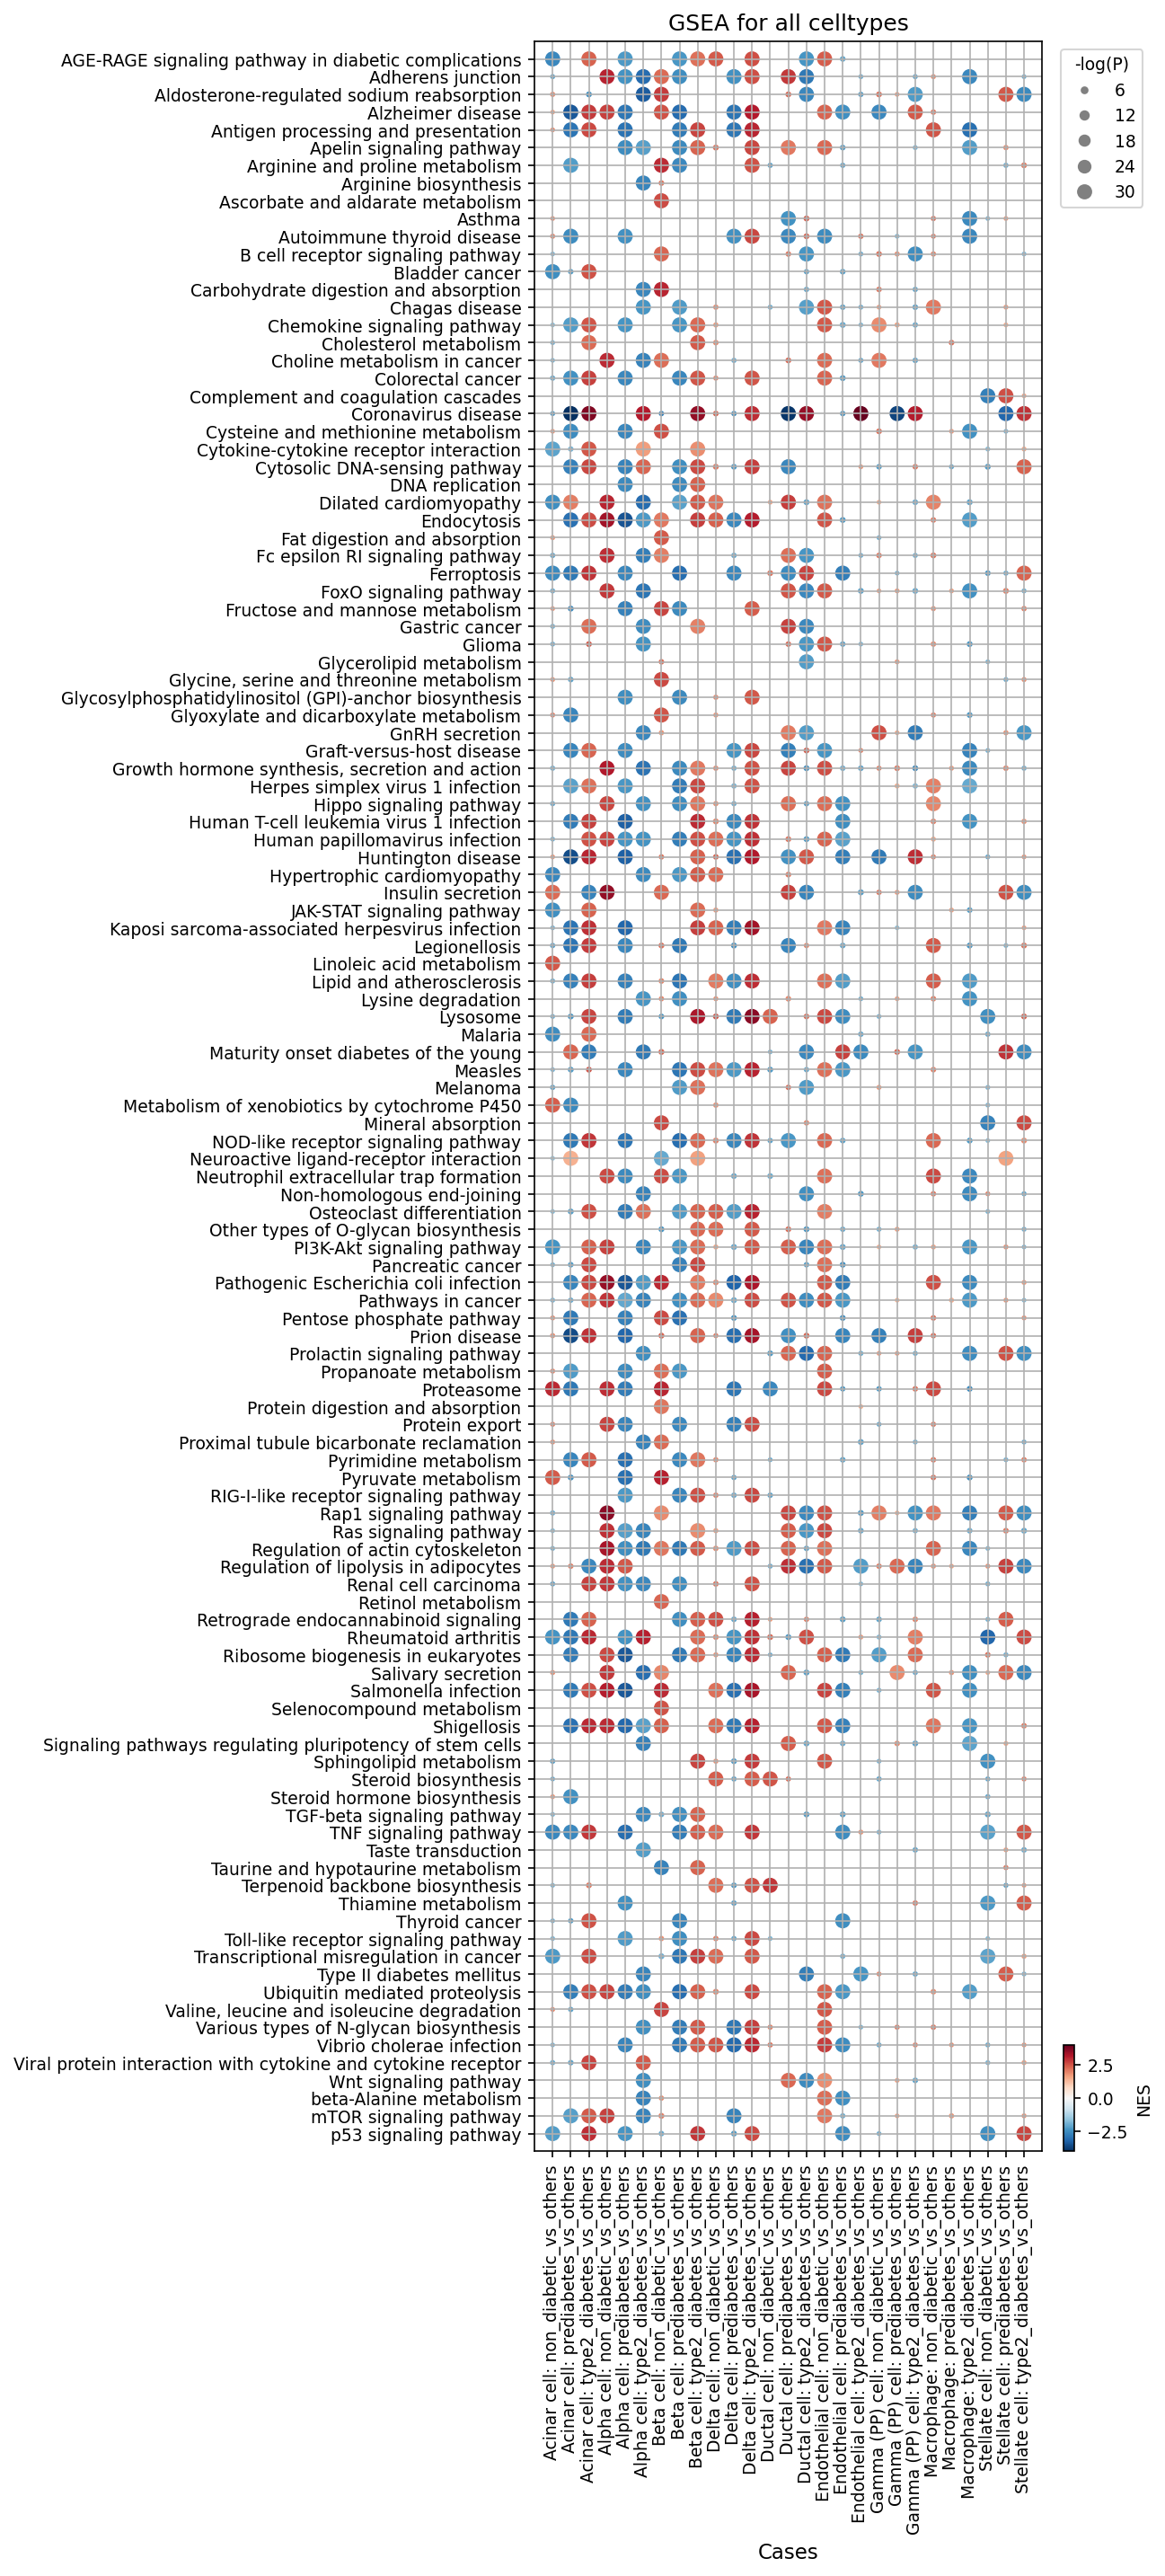
[Analysis Visualization Results]...
Analysis Overview
This dot plot presents the results of a Gene Set Enrichment Analysis (GSEA) conducted across various pancreatic cell types (celltype_minor) under different conditions: 'non_diabetic', 'prediabetes', and 'type2_diabetes'. Each comparison (referred to as a "Case") evaluates a specific cell type and condition against all other conditions combined (e.g., "Acinar cell: type2_diabetes_vs_others"). The y-axis lists the enriched gene sets or pathways. The color of each dot represents the Normalized Enrichment Score (NES): red indicates positive enrichment (upregulation of the pathway's genes), while blue signifies negative enrichment (downregulation of the pathway's genes). The intensity of the color and the size of the dot are proportional to the statistical significance (-log(p-val)), with larger and more intensely colored dots indicating more significant enrichments. The primary goal of this analysis is to identify key biological processes and pathways that are dysregulated within specific pancreatic cell types during the progression from a non-diabetic state through prediabetes to type 2 diabetes.
Visual Summary
The GSEA dot plot reveals a complex landscape of pathway alterations across different pancreatic cell types in the context of prediabetes and type 2 diabetes.
Pervasive Metabolic Dysregulation:
- The AGE-RAGE signaling pathway in diabetic complications shows highly significant positive enrichment (large, dark red dots) across nearly all examined cell types (Acinar, Alpha, Beta, Delta, Ductal, Endothelial, Macrophage, Stellate) in both 'prediabetes_vs_others' and 'type2_diabetes_vs_others' conditions.
- The Type II diabetes mellitus pathway itself is significantly enriched (large red dots) in Alpha, Beta, Ductal, Endothelial, Macrophage, and Stellate cells in both prediabetic and type 2 diabetic conditions.
- Insulin secretion is notably and significantly negatively enriched (large, dark blue dots) specifically in Beta cells for both 'prediabetes_vs_others' and 'type2_diabetes_vs_others' comparisons.
- Pathways related to lipid metabolism, such as Lipid and atherosclerosis, are consistently upregulated (red) in multiple cell types (Acinar, Alpha, Beta, Ductal, Endothelial, Macrophage, Stellate) in both diabetic and prediabetic states.
- Conversely, Carbohydrate digestion and absorption is downregulated (blue) in Acinar cells during prediabetes and type 2 diabetes.
Widespread Inflammatory and Immune Activation:
- Several immune and inflammatory pathways, including Cytokine-cytokine receptor interaction, Chemokine signaling pathway, and TNF signaling pathway, are significantly positively enriched (red) across a broad range of cell types, particularly in Alpha cells, Ductal cells, Endothelial cells, Macrophages, and Stellate cells, under prediabetic and diabetic conditions.
- Antigen processing and presentation shows strong upregulation specifically in Macrophages in the type 2 diabetes condition.
Altered Cellular Signaling:
- The PI3K-Akt signaling pathway exhibits a mixed pattern: it is upregulated in Alpha cells but downregulated in Beta cells in both prediabetes and type 2 diabetes, suggesting differential regulation or cellular stress responses.
- Apelin signaling pathway is consistently downregulated (blue) in Beta cells in both prediabetes and type 2 diabetes.
Cell Type-Specific Vulnerabilities and Responses:
- Beta cells specifically demonstrate profound impairment in Insulin secretion and Apelin signaling, coupled with activation of AGE-RAGE signaling.
- Alpha cells show a broad activation of inflammatory, metabolic, and specific signaling pathways like PI3K-Akt and TNF signaling.
- Macrophages are robustly enriched for immune-related pathways, reinforcing their central role in pancreatic inflammation.
- Acinar cells display dysregulation in digestive functions, alongside metabolic shifts like Lipid and atherosclerosis and AGE-RAGE signaling.
- Ductal cells, Endothelial cells, and Stellate cells all show significant activation of inflammatory and AGE-RAGE pathways, indicating their involvement in the broader pancreatic pathology and potential contributions to fibrosis and vascular dysfunction.
- Early Disease Manifestation: A notable finding is that many significant pathway dysregulations observed in 'type2_diabetes_vs_others' comparisons are already present and similarly significant in 'prediabetes_vs_others', indicating that key pathological processes initiate early in the disease course.
Biological Interpretation
These GSEA findings offer a comprehensive biological view of the molecular mechanisms operating within the pancreas during the development and progression of Type 2 Diabetes (T2D).
- Systemic Pancreatic Stress and Damage: The widespread and significant upregulation of the AGE-RAGE signaling pathway in diabetic complications across nearly all pancreatic cell types is a critical finding. Advanced Glycation End-products (AGEs), prevalent in hyperglycemia, activate their receptor (RAGE), leading to oxidative stress, inflammation, and cellular dysfunction. This pathway is a known driver of diabetic complications and likely contributes to the overall decline in pancreatic function PubMed search: AGE-RAGE diabetes pancreas.
- Core Beta Cell Dysfunction: The consistent and profound negative enrichment of Insulin secretion in Beta cells directly confirms the impaired insulin production that is a hallmark of T2D. The downregulation of Apelin signaling pathway in Beta cells is also significant, as apelin is known to modulate insulin sensitivity and glucose homeostasis, and its reduced activity may exacerbate Beta cell dysfunction and T2D pathology PubMed search: apelin beta cell diabetes. The observed downregulation of PI3K-Akt signaling pathway in Beta cells further suggests impaired insulin signaling, cell survival, and proliferation, which are crucial for maintaining Beta cell mass and function GeneCards: AKT1.
- Pancreatic Inflammation as a Key Driver: The broad upregulation of Cytokine-cytokine receptor interaction, Chemokine signaling pathway, and TNF signaling pathway across multiple cell types (Alpha, Ductal, Endothelial, Macrophage, Stellate) underscores a prominent inflammatory state within the diabetic pancreas. While Macrophages are central immune orchestrators, the involvement of non-immune cells indicates a wider, destructive inflammatory environment that can contribute to Beta cell apoptosis, islet remodeling, and fibrosis PubMed search: pancreatic inflammation type 2 diabetes. Activated pancreatic stellate cells, for instance, contribute to fibrotic changes under inflammatory conditions.
- Broader Metabolic Reprogramming: The widespread enrichment of Lipid and atherosclerosis pathways across diverse pancreatic cell types points to lipotoxicity and generalized metabolic stress. This suggests that not only Beta cells but other pancreatic cell populations are also affected by dysregulated lipid metabolism, which can impair their function. The downregulation of Carbohydrate digestion and absorption in Acinar cells suggests a potential impact on exocrine function, highlighting that T2D pathophysiology might extend beyond the endocrine compartment to affect the entire pancreas.
- Early Pathological Initiation: The finding that many T2D-associated pathway dysregulations are already evident in prediabetes suggests that significant molecular changes occur early, potentially offering a window for preventative interventions.
Clinical or Translational Implications
These GSEA results carry several important implications for the clinical understanding and management of Type 2 Diabetes.
- Potential Therapeutic Targets: The AGE-RAGE signaling pathway emerges as a promising pan-pancreatic therapeutic target. Modulating this pathway could potentially mitigate chronic inflammation and cellular damage across multiple cell types, offering a comprehensive approach to improve pancreatic health in diabetes. Similarly, targeting key inflammatory pathways (e.g., TNF signaling pathway, Cytokine-cytokine receptor interaction) could reduce local pancreatic inflammation, which is known to contribute to Beta cell dysfunction.
- Biomarkers for Early Disease: The identification of specific pathway dysregulations in prediabetes, such as the early impairment of Insulin secretion in Beta cells or the activation of AGE-RAGE signaling, could inform the development of novel biomarkers for early risk assessment, diagnosis, and monitoring of disease progression, even before overt T2D is established.
- Cell-Type Specific Interventions: The observed cell-type-specific pathway alterations suggest that future therapeutic strategies might need to be tailored to specific pancreatic cell populations. For example, treatments aimed at restoring Beta cell function could focus on pathways like Apelin signaling or PI3K-Akt pathways, while strategies to reduce inflammation might target specific macrophage or stellate cell activities.
- Addressing Co-morbidities: The significant enrichment of Lipid and atherosclerosis pathways across various pancreatic cell types reinforces the strong connection between T2D and cardiovascular complications, suggesting that interventions addressing lipid metabolism within the pancreas could have systemic benefits.
- Holistic Pancreatic Health: The evidence of altered exocrine functions (e.g., Carbohydrate digestion and absorption in Acinar cells) in diabetes suggests a need to consider the pancreas as an integrated organ, where endocrine and exocrine dysfunctions may be intertwined, potentially leading to new research avenues for pancreatic health in T2D.
12. Discussion
This comprehensive single-cell analysis reveals profound and multifaceted dysregulation within the pancreatic microenvironment during the progression to Type 2 Diabetes (T2D) and prediabetes. A central finding is the observed reduction in Beta cell population proportions, corroborated by Gene Ontology (GSA) analysis indicating significant Endoplasmic Reticulum (ER) stress, mitochondrial dysfunction, and impaired oxidative phosphorylation pathways in T2D Beta cells. Surfaceome marker analysis of Beta cells further shows a widespread downregulation of critical functional proteins like FFAR4, LDLR, and SLC39A4 in T2D, highlighting a loss of key nutrient sensing, lipid handling, and insulin synthesis/secretion capabilities. This suggests a progressive functional decline and altered identity of Beta cells, rather than merely a reduction in number.
Concurrently, the immune landscape undergoes a significant shift, with a notable increase in pro-inflammatory M1 macrophage populations as the disease advances from non-diabetic to T2D states. Surfaceome analysis of prediabetic macrophages reveals upregulation of CXCR4, SLC2A3 (GLUT3), and NPC1, indicating enhanced recruitment, altered glucose metabolism, and lipid handling, all contributing to a sustained inflammatory milieu. Gene Set Enrichment Analysis (GSEA) further confirms widespread activation of inflammatory pathways, including Cytokine-cytokine receptor interaction, Chemokine signaling, and TNF signaling, across various pancreatic cell types beyond just immune cells, highlighting a generalized inflammatory state.
Crucially, cell-cell interaction (CCI) analyses point to a highly dysregulated stromal compartment. Interactions involving Pancreatic Stellate Cells (PSCs) show increased TGFB1-TGFB_receptor and SPP1-integrin signaling in prediabetes and T2D, driving fibrosis and inflammation. Specifically, Stellate-Stellate interactions in T2D show an increase in MMP2-integrin_avb3_complex activity, indicating active ECM remodeling and degradation, alongside altered retinoid and cholesterol-related signaling. These findings underscore the active role of PSCs in promoting fibrosis and perpetuating inflammation, creating a destructive microenvironment for islet cells.
A pervasive theme across all analyses is the activation of the AGE-RAGE signaling pathway in diabetic complications, which is significantly enriched across nearly all pancreatic cell types in both prediabetes and T2D. This suggests a systemic response to hyperglycemia and oxidative stress that broadly impairs cellular function and fuels inflammation. Furthermore, many critical pathway dysregulations, including Beta cell insulin secretion impairment and AGE-RAGE activation, are already evident in the prediabetic state, emphasizing that the pathological processes initiate early and offering a crucial window for preventative interventions. The observation that exocrine functions, such as carbohydrate digestion and absorption in Acinar cells, are also affected underscores a holistic pancreatic dysfunction in diabetes, moving beyond an exclusive focus on islet pathology.
Hypotheses:
- Beta cell dysfunction and loss in T2D are driven by chronic ER stress, mitochondrial dysfunction, and impaired surface receptor signaling (FFAR4, LDLR, SLC39A4), exacerbated by a pro-inflammatory/fibrotic microenvironment.
- The shift to M1-dominant macrophages and their altered surfaceome (CXCR4, GLUT3, NPC1) in prediabetes actively promotes chronic pancreatic inflammation and contributes to beta-cell stress and insulin resistance.
- Activated pancreatic stellate cells, through enhanced TGFB1, SPP1, and MMP2 signaling, drive extracellular matrix remodeling and fibrosis, which structurally and functionally impairs islet integrity and contributes to beta-cell failure in T2D.
- Pervasive activation of the AGE-RAGE signaling pathway across multiple pancreatic cell types represents a central, generalized mechanism of cellular damage and inflammation in both prediabetes and T2D.
- Early interventions targeting specific macrophage activation states or stellate cell interactions in prediabetes could prevent the progression to overt T2D by mitigating inflammation and fibrosis.
Potential therapeutic targets:
- TGFB1 / TGFB receptors (TGFBR1, TGFBR2): TGFB1 signaling is significantly upregulated in prediabetes and T2D, acting as a potent pro-fibrotic and pro-inflammatory cytokine that directly contributes to islet fibrosis and Beta cell dysfunction/loss. Evidence: Cell-cell interaction analysis (Sections 6, 7) shows 'enhanced activity of TGFB1-TGFB_receptor and TGFB1-TGFBR2 interactions in both the prediabetes and type2_diabetes conditions', with strong signals in Stellate-Stellate interactions. Validation: Inhibiting TGF-beta signaling could mitigate islet fibrosis, reduce inflammation, and preserve Beta-cell mass and function. This can be validated through in vitro and in vivo testing of TGF-beta inhibitors.
- SPP1 (Osteopontin) / Integrin_aVb_complex: SPP1-integrin interactions are markedly increased in prediabetes and T2D, involving immune cell recruitment, inflammation, and tissue remodeling, thereby contributing to islet inflammation and Beta-cell stress. Evidence: Cell-cell interaction analysis (Section 6) demonstrates a 'marked increase in both significance and mean expression [of SPP1-integrin_aVb_complex interactions] in prediabetes and type2_diabetes... particularly evident in interactions with Ductal, Beta, and Alpha cells.' Validation: Blocking SPP1-integrin interactions could reduce inflammation and preserve Beta-cell function. This can be validated through in vitro and in vivo testing of SPP1 neutralizing antibodies or integrin antagonists.
- MMP2 (Matrix Metalloproteinase-2): MMP2 activity, especially in complex with integrin avb3, is strikingly increased in pancreatic stellate cells in T2D, driving extracellular matrix (ECM) degradation and fibrotic remodeling. Evidence: Condition-specific CCI (Section 7) reveals a 'striking increase in MMP2_integrin_avb3_complex--Stellate-Stellate interactions in T2D,' directly linking MMP2 to fibrotic processes. Validation: Inhibiting MMP2 could attenuate ECM degradation, reduce pancreatic fibrosis, and improve islet function. This requires investigation of selective MMP2 inhibitors in relevant diabetes models.
- CXCR4 (C-X-C Motif Chemokine Receptor 4): CXCR4 is upregulated on macrophages in prediabetes, indicating enhanced recruitment and retention of these immune cells at sites of pancreatic inflammation, contributing to Beta cell dysfunction. Evidence: Macrophage surfaceome analysis (Section 9) shows 'CXCR4... show prominent expression (large, dark red dots) in several prediabetes samples,' suggesting its role in macrophage infiltration. Validation: Blocking CXCR4-CXCL12 signaling could reduce pathogenic macrophage accumulation and pancreatic inflammation. This can be validated through testing CXCR4 antagonists (e.g., plerixafor analogs) in diabetes models.
- RAGE (Receptor for Advanced Glycation End-products): The AGE-RAGE signaling pathway is pervasively activated across nearly all pancreatic cell types in both prediabetes and T2D, serving as a central mechanism driving oxidative stress, inflammation, and cellular dysfunction. Evidence: GSEA (Section 11) indicates that the 'AGE-RAGE signaling pathway in diabetic complications' shows 'highly significant positive enrichment... across nearly all examined cell types... in both 'prediabetes_vs_others' and 'type2_diabetes_vs_others' conditions.' Validation: Modulating this pathway (e.g., RAGE antagonists, AGE inhibitors) could mitigate chronic inflammation and cellular damage across multiple cell types. This can be validated in diabetic animal models and potentially through clinical trials.
- FFAR4 (Free Fatty Acid Receptor 4 / GPR120): FFAR4 is significantly downregulated in T2D Beta cells, impairing their ability to sense long-chain fatty acids and reducing insulin secretion, proliferation, and survival. Activation of FFAR4 can improve Beta cell function. Evidence: Beta cell surfaceome analysis (Section 8) shows FFAR4 'exhibit high expression... in 'non_diabetic' samples' but 'notably reduced... in 'type2_diabetes' samples.' Validation: FFAR4 agonists could enhance Beta cell function and survival. This can be validated through in vitro studies on isolated islets and in vivo studies in diabetic models.
- LDLR (Low-Density Lipoprotein Receptor): LDLR is significantly downregulated in T2D Beta cells, impairing cholesterol uptake and contributing to intracellular cholesterol imbalances and lipotoxicity, which can impact insulin secretion and Beta cell survival. Evidence: Beta cell surfaceome analysis (Section 8) shows LDLR 'exhibit high expression... in 'non_diabetic' samples' but 'notably reduced... in 'type2_diabetes' samples.' Validation: Strategies to enhance Beta cell LDLR expression or function could ameliorate lipotoxicity and improve lipid handling. This can be validated through genetic or pharmacological approaches in Beta cell models and diabetic animal models.
- SLC39A4 (Solute Carrier Family 39 Member 4 / ZIP4): SLC39A4, a zinc transporter, is significantly downregulated in T2D Beta cells, potentially leading to zinc deficiency which is critical for insulin synthesis, storage, and secretion, thereby contributing to Beta cell failure. Evidence: Beta cell surfaceome analysis (Section 8) shows SLC39A4 'exhibit high expression... in 'non_diabetic' samples' but 'notably reduced... in 'type2_diabetes' samples.' Validation: Optimizing zinc transport and homeostasis in Beta cells through strategies that enhance zinc uptake or availability (e.g., zinc supplementation) could support Beta cell health and insulin production. This requires validation in Beta cell models and in vivo studies.
Follow-up validation ideas:
- Conduct in vitro glucose-stimulated insulin secretion (GSIS) assays in T2D patient-derived islets or iPSC-derived Beta cells to confirm functional deficits related to downregulated surface markers (FFAR4, LDLR, SLC39A4).
- Utilize spatial transcriptomics or multiplexed immunostaining to map the precise localization of distinct macrophage subsets (M1 vs. M2) and their specific surface markers (CXCR4, GLUT3, CD40) within pancreatic islets in diabetic vs. non-diabetic human tissue.
- Perform co-culture experiments between pancreatic stellate cells and islet cells (e.g., Beta cells, macrophages) to functionally validate the impact of altered TGFB1, SPP1, or MMP2 signaling on islet integrity and function.
- Employ perturbation assays using specific inhibitors for TGFB1, SPP1, MMP2, or CXCR4 in in vitro or in vivo diabetes models (e.g., NOD mice or diet-induced diabetes) to assess their impact on pancreatic inflammation, fibrosis, Beta cell survival, and glucose homeostasis.
- Analyze the expression of candidate biomarkers (e.g., circulating AGEs, soluble RAGE, specific surface markers on immune cells from pancreatic biopsies or blood) in larger human cohorts spanning prediabetes and T2D to validate their diagnostic or prognostic value.
- Investigate the effect of zinc supplementation or zinc transporter modulation (e.g., SLC39A4) on Beta cell function and survival in diabetic models to explore therapeutic potential.
Limitations:
This report is based on cross-sectional single-cell RNA-seq data, providing correlational observations rather than direct causal mechanisms of disease progression. The substantial and variable proportion of 'unassigned' cells across samples represents a limitation in fully interpreting the cellular composition and interaction networks, potentially masking subtle proportional changes or novel cell states. While cell-cell interactions and pathway enrichments suggest key molecular players, their functional validation in a dynamic physiological context requires further experimental studies. The lack of detailed patient clinical histories or longitudinal data also limits inferences regarding disease severity, duration, or direct progression within individuals.
13. Query List
- Show and save UMAPs for condition, sample, celltype_major, celltype_minor, and celltype_subset in two columns.
- Show major cell type scores on UMAP and save the result.
- Show and save a marker expression dot plot for celltype_subset. SET target_cell = None and var_group_rotation = 45. Leave all other arguments at their default values.
- Show and save a population bar plot of minor cell types.
- Show and save a population bar plot of macrophage subsets.
- Show and save cell-cell interaction patterns. Select at most 80 cell-cell interactions per group.
- Find cell-cell interactions involving major immune (Myeloid cell, Macrophage) and stromal (Stellate cell, Fibroblast) cells that differ significantly between conditions, show them as a dot plot, and save the result. Set max_n_items_per_group to 60. For each interaction identified under each condition, using the provided dataset context, describe the associated signaling pathways and mechanisms and, where relevant, its potential as a therapeutic target for Type 2 Diabetes and prediabetes and related therapeutic agents.
- Show marker expression for Beta cell, a key Pancreatic cell type relevant to Type 2 Diabetes, in a dot plot, and save the result. Use only surfaceome markers, with at most 50 markers per condition. For each marker identified under each condition, using the provided dataset context, describe the associated signaling pathways and biological mechanisms within the Pancreas and, where relevant, its potential as a therapeutic target for Type 2 Diabetes and prediabetes and related therapeutic agents.
- Show marker expressions for Macrophage in a dot plot, and save the result. Use only surfaceome markers, with at most 40 markers per condition. For each marker identified under each condition, using the provided dataset context, describe the associated signaling pathways and biological mechanisms within the Pancreas and, where relevant, its potential as a therapeutic target for Type 2 Diabetes and prediabetes and related therapeutic agents.
- Show Gene Ontology (GSA) analysis results for Beta cell, a key Pancreatic cell type relevant to Type 2 Diabetes, as a bar plot, and save the result.
- Show Gene Set Enrichment Analysis results as a dot plot, and save it. Set the color map to RdBu_r, n_pws_to_show to 120, and target_cells to None.