Single-Cell Transcriptomic Profiling of Pancreatic Remodeling and Immune Dysregulation in Type 1 Diabetes
This single-cell RNA-seq analysis illuminates profound cellular and molecular changes in the human pancreas across non-diabetic, autoantibody-positive, and Type 1 Diabetes (T1D) states. Key findings include clear evidence of Beta cell depletion in established T1D, robust inflammatory and stress responses across multiple pancreatic cell types, and significant alterations in cell-cell communication. Notably, the autoantibody-positive condition displays a unique and active cellular remodeling signature, emphasizing the critical window for intervention in early disease progression. These insights advance our understanding of T1D pathogenesis and suggest novel biomarkers and therapeutic strategies.
Contents
- Dataset overview
- UMAP Visualization of Pancreatic Single-Cell RNA-seq Data
- Major Cell Type Score Visualization on UMAP
- Marker Gene Expression Across Pancreatic Cell Subsets
- Pancreatic Minor Cell Type Population Analysis Across Type 1 Diabetes Conditions
- Cell-Cell Interaction Patterns Across Pancreatic Conditions
- Condition-Specific Cell-Cell Interaction Patterns in Autoantibody-Positive Pancreas
- Beta Cell Condition-Specific Surfaceome Markers in Pancreas
- Fibroblast Condition-Specific Surfaceome Markers in Pancreatic Tissue
- Gene Ontology (GSA) Analysis of Beta Cells Across Type 1 Diabetes Progression
- Gene Set Enrichment Analysis (GSEA) Across Pancreatic Cell Types and Diabetes Conditions
- Discussion
- Query List
0. Dataset overview
Dataset Summary
- 이 데이터는 87,200개의 세포와 30,501개의 유전자로 구성된 단일 세포 RNA 시퀀싱 (scRNA-seq) 데이터입니다.
- 종(species)은 인간(human)이며, 조직(tissue)은 췌장(Pancreas)입니다.
- 세포 유형은 celltype_major, celltype_minor, celltype_subset 세 가지 수준으로 나뉘며, 주요 세포 유형에는 Acinar cell, Ductal cell, Stromal cell, Endothelial cell, Alpha cell, Beta cell 등이 있습니다.
- 샘플은 type1_diabetes, non_diabetic, autoantibody_positive 세 가지 조건(condition)으로 구성되어 있으며, non_diabetic이 참조 조건으로 설정되어 있습니다.
- 이 데이터에는 CNV(Copy Number Variation) 추정치가 포함되어 있지 않습니다.
Precomputed Results
데이터에는 다음과 같은 사전 계산된 분석 결과들이 포함되어 있습니다:
- CCI (Cell-cell Interaction): 조건별 및 샘플별 세포-세포 상호작용 결과 (CellPhoneDB).
- DEG (Differential Expression Genes): 각 celltype_minor에서 특정 조건을 다른 조건과 비교하거나 참조 조건과 비교한 차등 발현 유전자 결과.
- GSEA (Gene Set Enrichment Analysis): 각 celltype_minor에서 조건별 유전자 세트 농축 분석 결과.
- GSA_up / GO (Gene Ontology): 각 celltype_minor에서 조건별 GO (유전자 온톨로지) 분석 결과.
1. UMAP Visualization of Pancreatic Single-Cell RNA-seq Data
[Analysis Visualization Results]...
Analysis Overview
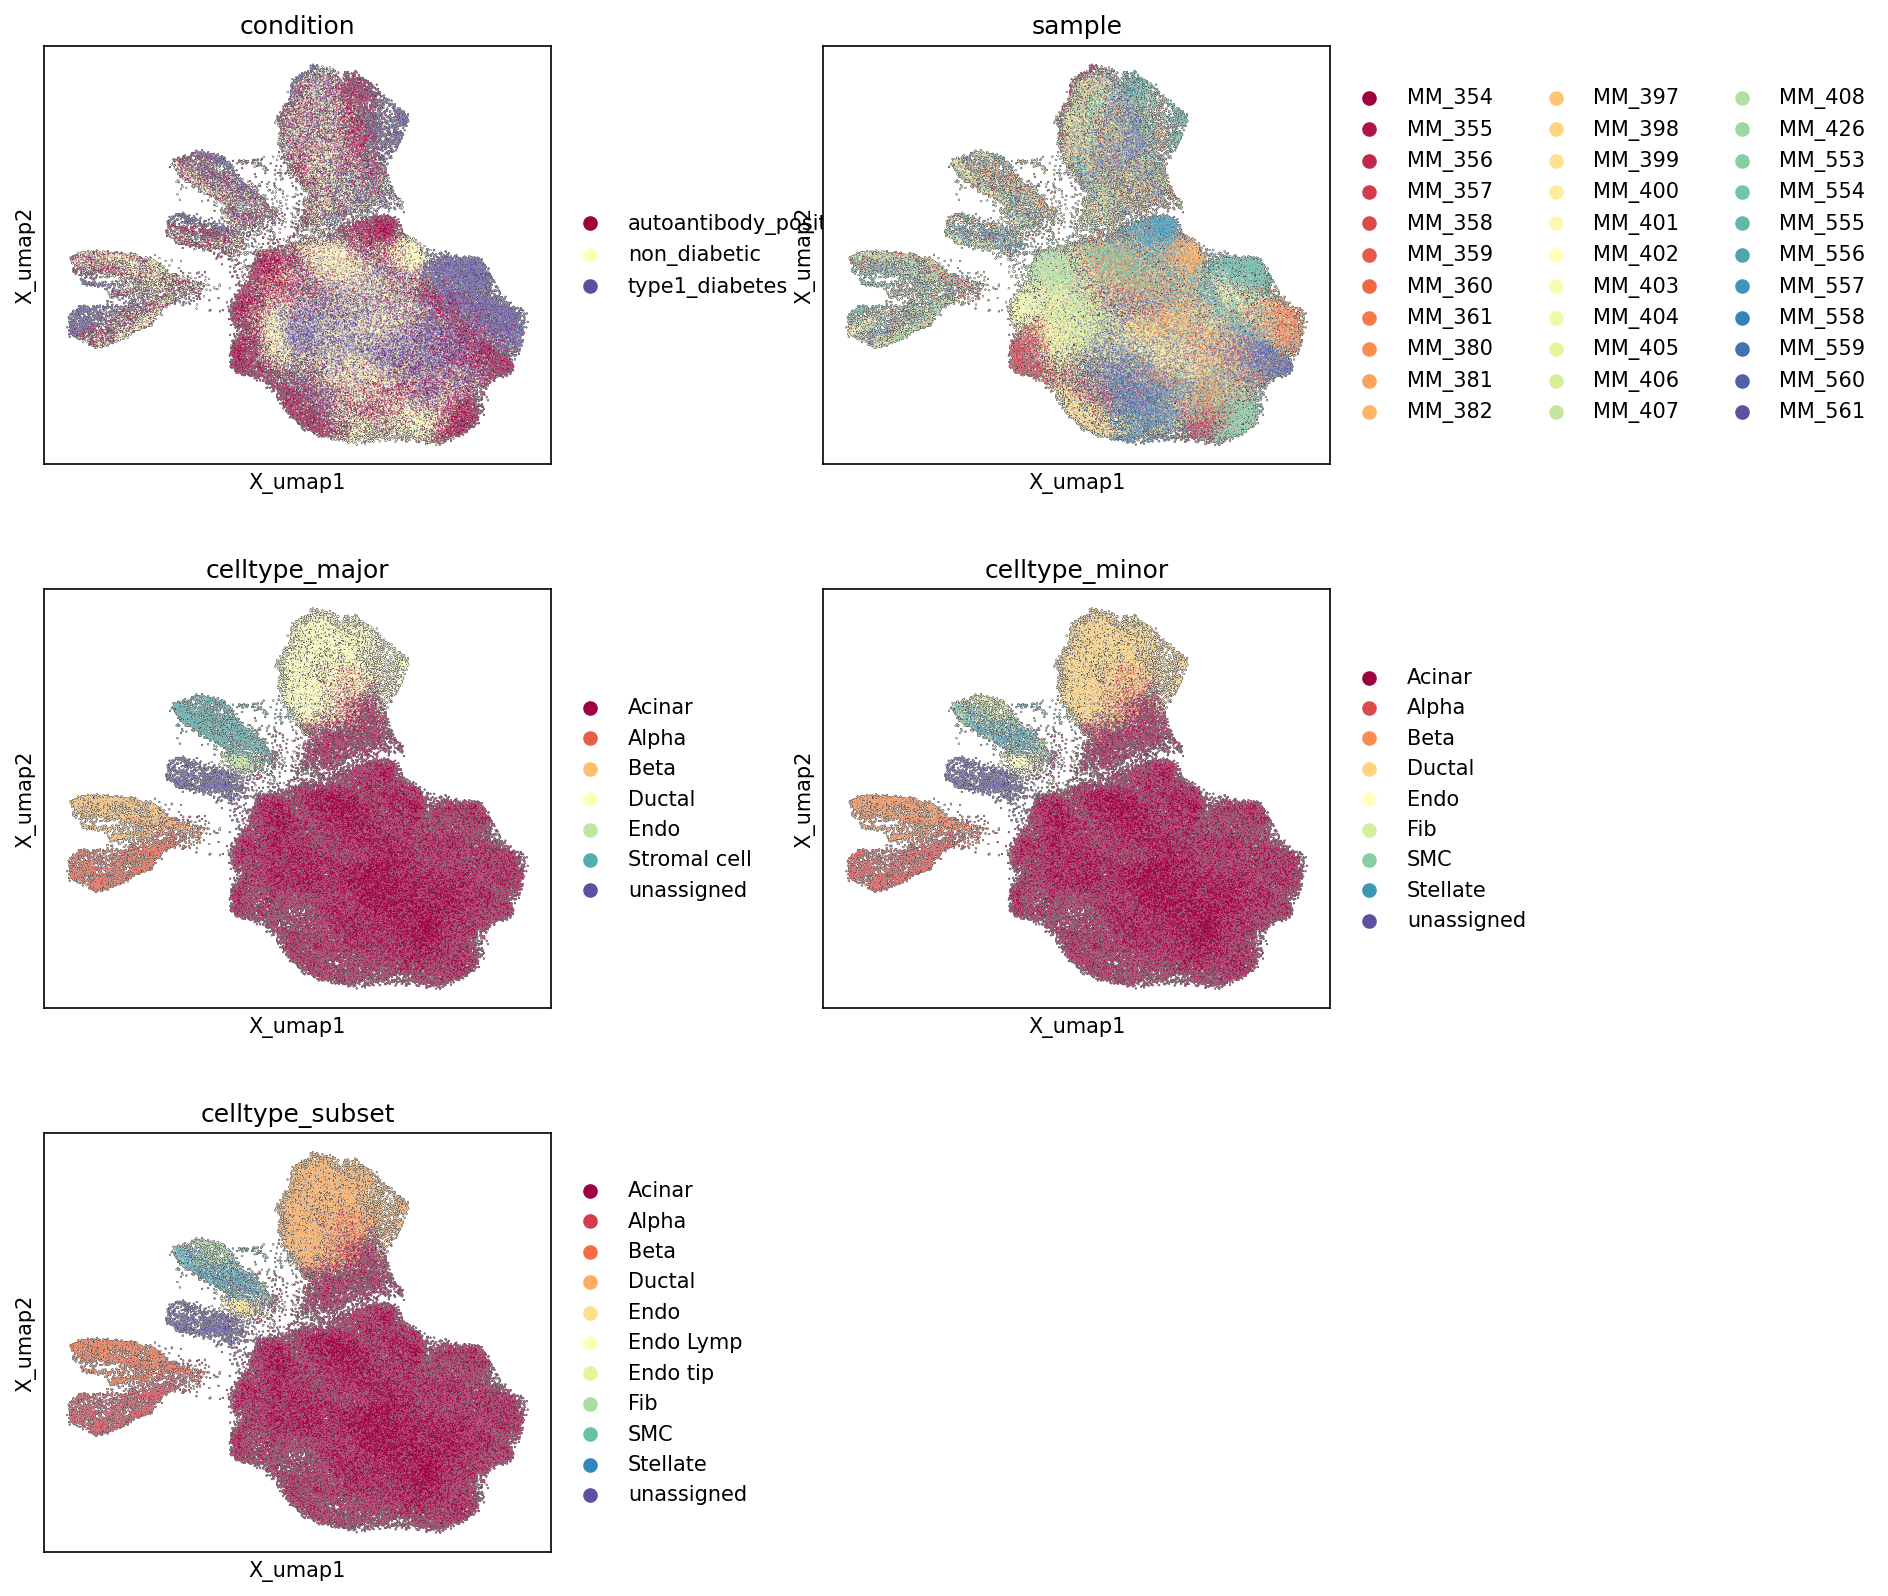
This analysis presents UMAP (Uniform Manifold Approximation and Projection) visualizations of single-cell RNA-seq data from the human pancreas. These plots aim to visualize the relationships between individual cells in a reduced-dimensional space, colored by different metadata attributes: biological condition, sample origin, and various levels of cell type annotation (major, minor, and subset). The primary goal is to assess the overall structure of the dataset, the quality of cell type annotations, and the distribution of samples and conditions within the cellular landscape.
Visual Summary
Condition
The UMAP colored by condition shows the distribution of cells across 'autoantibody_positive', 'non_diabetic', and 'type1_diabetes' states. While there is no complete segregation of conditions into distinct, non-overlapping clusters, the different conditions are intermingled, suggesting that major cell type identity is a stronger driver of transcriptional variability than the disease state in this global embedding. However, subtle differences in the density or presence of specific conditions can be observed within certain regions of the UMAP, indicating potential condition-specific changes that occur within cell types. For instance, the 'non_diabetic' cells (yellow) appear broadly distributed across the main body of cells, while 'type1_diabetes' (purple) and 'autoantibody_positive' (maroon) cells are also widespread but may exhibit regional enrichments within shared cell type clusters.
Sample
The sample UMAP displays cells colored by their individual sample identifiers. The widespread intermingling of cells from different samples across the UMAP indicates a successful integration of data, minimizing potential batch effects. Cells from various samples are broadly distributed across the different cell type clusters, rather than forming sample-specific isolated groups, which supports the robustness of the downstream analyses.
Celltype Major
The celltype_major UMAP reveals clear and well-separated clusters corresponding to the major pancreatic cell populations. Distinct groupings are evident for:
- Acinar cell (maroon): Forms a large, dominant cluster.
- Alpha cell (red) and Beta cell (orange): These endocrine cells form closely associated, yet distinct, clusters typically representing the islets of Langerhans.
- Ductal cell (yellow): Occupies a separate region, often adjacent to Acinar cells.
- Endothelial cell (light green) and Stromal cell (teal): Form their own distinct clusters, separate from the major exocrine and endocrine populations.
- 'unassigned' cells (purple) are scattered and represent a minor fraction of the dataset.
Celltype Minor
The celltype_minor UMAP provides a finer resolution of cell types, showing a more granular view within the major categories. Key observations include:
- The major cell type clusters remain distinct.
- The 'Stromal cell' population from celltype_major is further resolved into 'Fibroblast' (light green), 'Stellate' (teal), and 'Smooth muscle cell' (SMC, blue), each forming distinct sub-clusters, confirming the heterogeneous nature of the stromal compartment.
Celltype Subset
The celltype_subset UMAP presents the highest resolution of cell type annotations, further dissecting some of the celltype_minor populations:
- The 'Endothelial cell' population is refined into specific subtypes such as 'Endo' (yellow-green), 'Endo Lymp' (Lymphatic Endothelial cell, light green), and 'Endo tip' (Endothelial tip cell, darker green).
- This further stratification demonstrates the capacity of the dataset and annotation approach to capture fine-grained cellular heterogeneity within the pancreas.
Biological Interpretation
The UMAP visualizations consistently demonstrate a well-structured single-cell dataset where cell identity, particularly at the cell type level, is the primary driver of transcriptional heterogeneity. The distinct and well-separated clusters for major, minor, and subset cell types affirm the quality and accuracy of the cell type annotations. The clear separation of key pancreatic cell types such as Acinar, Ductal, Alpha, and Beta cells, along with various stromal and endothelial populations, provides a robust foundation for investigating cell-type-specific biology.
The intermingled distribution of cells from different samples indicates that batch effects are not strongly influencing the global embedding structure, which is crucial for making reliable biological comparisons across samples and conditions.
Regarding the inferred disease context of Type 1 Diabetes, the observation that cells from 'type1_diabetes', 'autoantibody_positive', and 'non_diabetic' conditions largely co-localize within cell type clusters suggests that while the disease may induce transcriptional changes, these changes might be subtle at a global transcriptomic level or localized to specific cell types and pathways, rather than causing a complete re-organization of the pancreatic cellular landscape. This setup provides an excellent basis for investigating cell-type-specific differential gene expression or pathway enrichment analyses to pinpoint disease-relevant mechanisms within specific cell populations, such as Alpha and Beta cells, which are central to diabetes pathology.
Annotation Notes
The UMAP plots provide strong evidence for the high quality and hierarchical consistency of the cell type annotations. The distinct clustering for major, minor, and subset cell types confirms robust cell identity assignment. The absence of strong sample-specific clustering (batch effects) further validates the dataset's suitability for comparative analyses. The embedding structure is biologically coherent, with related cell types clustering proximally, and distinct cell types forming well-separated populations. These observations indicate a reliable foundation for subsequent, more targeted biological investigations into Type 1 Diabetes.
2. Major Cell Type Score Visualization on UMAP
[Analysis Visualization Results]...
Analysis Overview
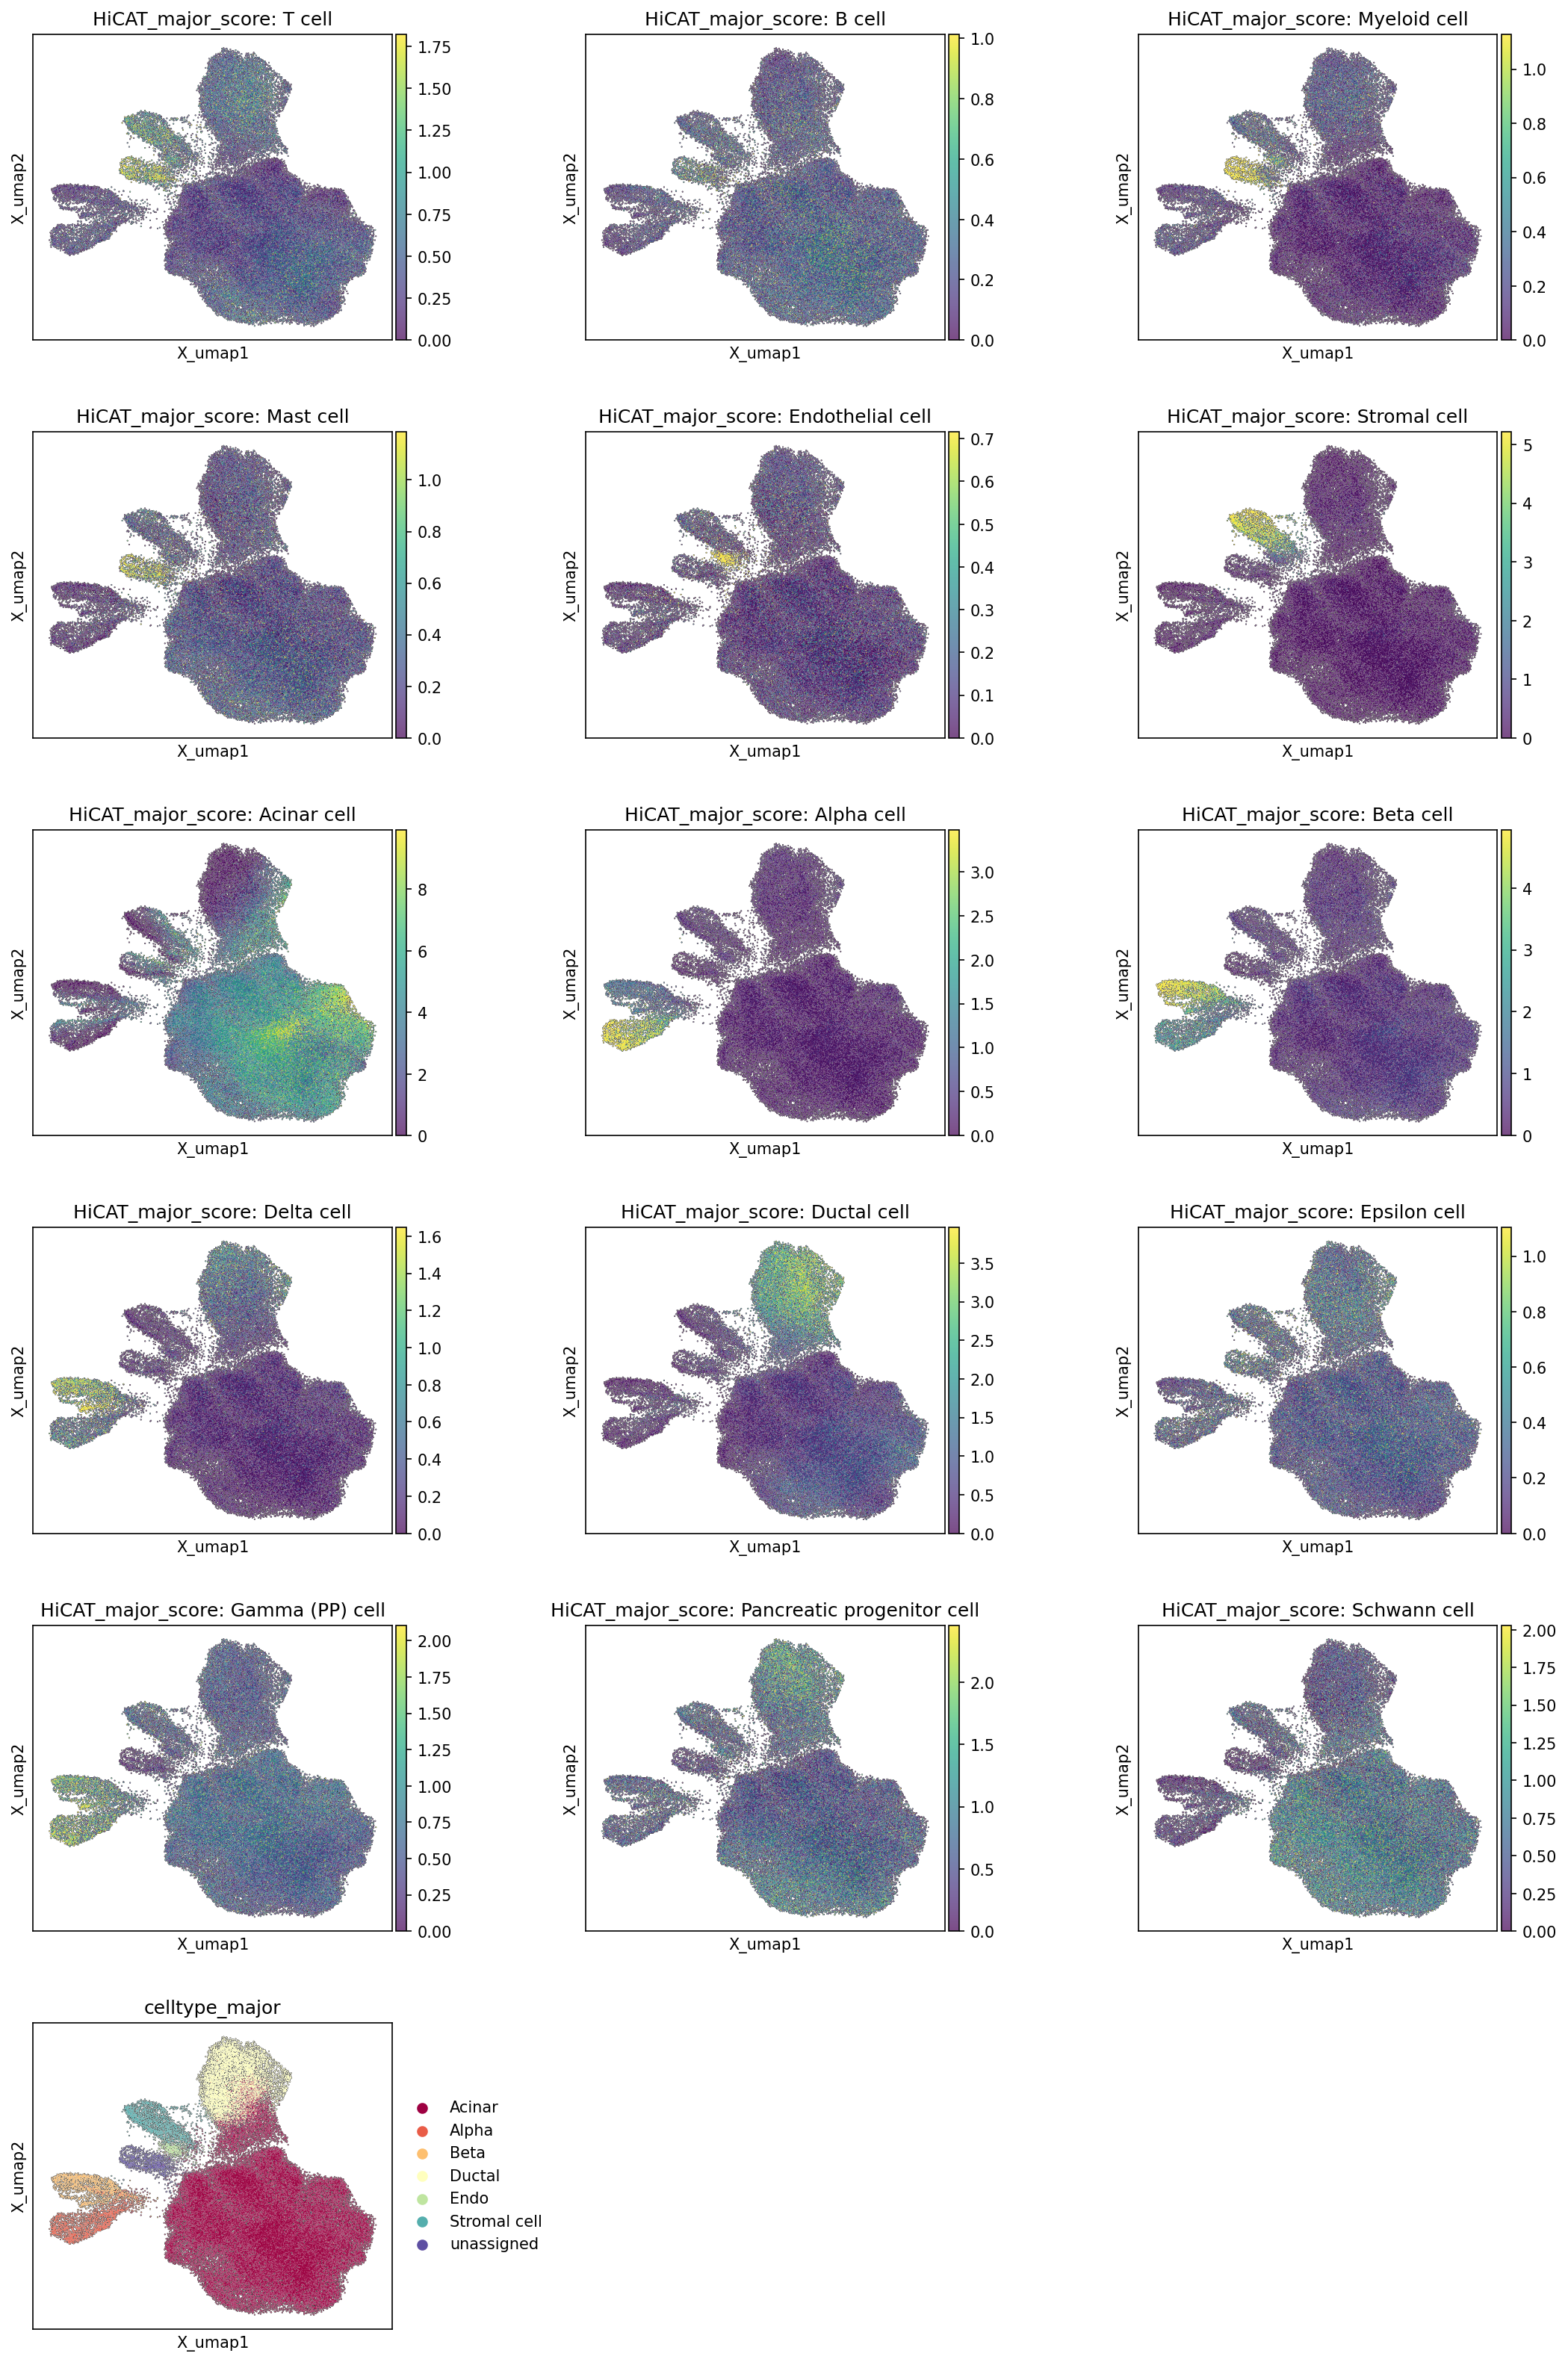
This analysis presents Uniform Manifold Approximation and Projection (UMAP) plots, a common technique for visualizing high-dimensional single-cell RNA-sequencing data in a lower-dimensional space. Each plot displays the score for a specific major cell type, illustrating the expression-based enrichment of that cell identity across the UMAP embedding. A final UMAP plot displays the discrete celltype_major annotations, allowing for a comparison between the continuous cell type scores and the assigned labels. This visualization helps to assess the quality of cell type annotation and the underlying structure of the single-cell dataset from human pancreatic tissue.
Visual Summary
The UMAP embedding reveals a complex architecture with several distinct clusters and more diffuse populations. The plots show the following key features:
- Distinct Cell Type Clustering: Many major cell types show clear enrichment in specific regions of the UMAP. For example, HiCAT_major_score: Acinar cell is highly concentrated in a large, central-right cluster, consistent with the celltype_major annotation where Acinar cells (maroon) form the predominant cluster. Similarly, Alpha cell and Beta cell scores are enriched in distinct but adjacent clusters on the left side of the UMAP, reflecting the distinct islet cell populations. Ductal cells show a clear cluster towards the top-left.
- Pancreatic Islet Cell Segregation: Alpha, Beta, Delta, Gamma (PP), and Epsilon cells, which constitute the endocrine cells of the pancreatic islets, form several distinct yet closely located clusters on the left side of the UMAP. This spatial proximity is expected given their shared origin and functional interdependencies within the islets.
Immune and Stromal Cell Distribution
- T cell, B cell, and Myeloid cell scores are enriched in smaller, more dispersed clusters, particularly visible in the central-left and top-left regions, indicating the presence of immune cell populations.
- Endothelial cell and Stromal cell scores highlight distinct clusters, often forming "branches" or peripheral populations around the main cellular masses, consistent with their role in tissue structure and vascularization.
- Consistency between Scores and Annotations: The continuous HiCAT_major_score heatmaps generally align very well with the discrete celltype_major annotation plot. High scores for a given cell type visually correspond to the regions explicitly labeled with that cell type, indicating a robust and coherent annotation strategy.
- Low Score Background: For most cell type scores, regions not corresponding to that cell type show very low scores (dark purple), indicating good specificity of the scores for their respective cell populations.
- Minor Cell Types: Mast cell, Pancreatic progenitor cell, and Schwann cell also show specific, albeit often smaller or more diffuse, enrichments on the UMAP, suggesting their presence and detection in the dataset. Epsilon cell and Gamma (PP) cell scores are also clearly delineated.
Biological Interpretation
The UMAP visualization of major cell type scores provides a comprehensive overview of the cellular landscape of the human pancreas in the context of Type 1 Diabetes research.
- Pancreatic Cell Type Architecture: The clear segregation of exocrine (Acinar, Ductal) and endocrine (Alpha, Beta, Delta, Gamma, Epsilon) cell populations on the UMAP reflects the known anatomical and functional organization of the pancreas. The close proximity of the various islet cell types (Alpha, Beta, Delta, Gamma, Epsilon) on the UMAP is biologically meaningful, as these cells interact extensively within the islets of Langerhans to regulate glucose homeostasis [PubMed Search: Pancreatic islet cell types interactions].
- Relevance to Type 1 Diabetes: Given the focus on Type 1 Diabetes, the clear identification and separation of Alpha and Beta cells are crucial. Beta cells are the primary targets of autoimmune destruction in T1D, while Alpha cells (glucagon-producing) are also affected, and their dysfunction contributes to glycemic dysregulation [PubMed Search: Type 1 diabetes beta cell alpha cell dysfunction].
- Immune Cell Presence: The presence of T cells, B cells, and Myeloid cells is highly significant in the context of autoimmune diseases like T1D. These cells mediate the immune attack on beta cells, and their specific localization and proportions within the pancreas are key areas of investigation in diabetes pathogenesis [PubMed Search: T cell B cell myeloid cells type 1 diabetes pancreas]. The UMAP shows these immune cell types forming distinct clusters, indicating their capture in the single-cell analysis.
- Stromal and Endothelial Contribution: The identification of Stromal and Endothelial cells highlights the importance of the pancreatic microenvironment. Stromal cells (e.g., fibroblasts, stellate cells) contribute to tissue remodeling, inflammation, and fibrosis, while endothelial cells form the vascular network critical for islet function and immune cell trafficking [GeneCards: VWF (Endothelial Cell Marker), ACTA2 (Smooth Muscle Actin, Stromal Marker)].
- Annotation Quality: The high consistency between the continuous cell type scores and the discrete celltype_major annotations suggests a robust cell type assignment pipeline. This strengthens confidence in downstream analyses that rely on these cell type labels.
Annotation Notes
- The HiCAT_major_score plots provide a valuable quantitative measure for cell type identification, demonstrating that cells within specific UMAP regions exhibit high scores for their annotated major cell type.
- The overall clustering and separation of cell types on the UMAP are consistent with known pancreatic cell biology, indicating a high quality of the embedding and cell annotation.
- The presence of distinct clusters for various immune and stromal cells, alongside the main pancreatic cell types, suggests comprehensive cell capture and robust identification.
- The 'unassigned' category in the celltype_major plot is relatively small and diffuse, indicating that most cells have been confidently assigned to a major cell type. Further investigation into the characteristics of these 'unassigned' cells could potentially refine the annotation or identify novel cell populations if sufficient evidence exists.
- No significant issues with cell identity, embedding structure, or annotation quality are apparent from these plots. The plots effectively confirm the expected cellular heterogeneity of the pancreas and the quality of the derived cell type labels.
3. Marker Gene Expression Across Pancreatic Cell Subsets

[Analysis Visualization Results]...
Analysis Overview
This analysis presents a marker expression dot plot for various celltype_subset populations identified in the Pancreas single-cell RNA-seq dataset. The objective is to visualize the expression patterns of top differentially expressed genes (markers) across these cell types to confirm their identity and assess the quality of cell type annotations. Each dot in the plot represents a specific gene in a particular cell type, with the dot's size indicating the fraction of cells within that group expressing the gene, and the color intensity representing the mean expression level of the gene in that group. Red boxes highlight the marker genes identified for each respective cell group.
Visual Summary
The dot plot clearly segregates distinct marker gene expression patterns across the various pancreatic celltype_subset populations.
- Highly Specific Endocrine and Exocrine Cell Markers: Acinar cells, Alpha cells, Beta cells, and Ductal cells exhibit highly specific and distinct marker gene expression profiles, with strong expression (large, dark red dots) concentrated within their respective cell type rows and corresponding marker gene columns.
- Shared Stromal and Endothelial Markers: The stromal and endothelial cell types, including Endothelial tip cells, Fibroblasts, Lymphatic Endothelial cells, and Stellate cells, show some degree of shared marker expression, particularly for genes related to extracellular matrix components. However, each of these cell types also presents unique or highly enriched markers that aid in their differentiation.
- Distribution of Expression: For most identified markers, expression is largely restricted to one or a few related cell types, indicating good specificity. Genes within the red boxes generally show high mean expression and high fraction of cells expressing within their target group.
Biological Interpretation
The observed marker expression patterns align well with the known biology of pancreatic cell types, supporting the given celltype_subset annotations:
- Acinar cells demonstrate strong expression of digestive enzyme-related genes such as *PNLIPRP1*, *CPA2*, *PRSS1*, *CTRB1*, *CELA3B*, and *AMY2B*. These genes encode for lipases, proteases, and amylases, which are canonical products of acinar cells responsible for exocrine function. GeneCards: PRSS1
- Alpha cells are clearly marked by high expression of *GCG* (Glucagon), the hormone responsible for raising blood glucose, and *CHGA* (Chromogranin A), a general neuroendocrine marker. Other specific markers like *RFX6* (a transcription factor crucial for alpha cell development) are also observed. GeneCards: GCG
- Beta cells show robust expression of *INS* (Insulin), the primary hormone regulating blood glucose, and *SLC30A8* (Zinc Transporter 8), which is critical for insulin storage and secretion. These are definitive markers of pancreatic beta cells. GeneCards: INS
- Ductal cells are characterized by markers such as *CFTR* (Cystic Fibrosis Transmembrane Conductance Regulator), which is essential for ductal fluid and bicarbonate secretion, and *ANXA4*. GeneCards: CFTR
- Fibroblasts show strong expression of collagen genes (*COL1A1*, *COL1A2*, *COL3A1*, *COL5A1*, *COL6A2*) and *DCN* (Decorin), which are integral to extracellular matrix production and maintenance, consistent with their role in tissue structure and repair. GeneCards: DCN
- Lymphatic Endothelial cells are uniquely identified by prominent expression of *PROX1* and *PDPN* (Podoplanin), which are well-established markers for lymphatic vessel formation and identity. GeneCards: PROX1
- Endothelial tip cells and Stellate cells exhibit markers related to extracellular matrix components and growth factor signaling, such as *PDGFRA*, *PDGFRB*, *TIMP3*, *COL1A1*, *COL1A2*, and *SPARC*. While these markers show some overlap with other stromal cells (e.g., fibroblasts), their specific combinations and quantitative expression levels likely contribute to distinguishing these subtypes, representing specialized functions within the stromal compartment of the pancreas. Pancreatic stellate cells are known for their role in fibrosis and expression of ECM proteins.
Annotation Notes
The marker expression dot plot provides strong evidence supporting the distinct identities of the majority of celltype_subset annotations.
- High Confidence for Endocrine/Exocrine Cells: The annotations for Acinar cells, Alpha cells, Beta cells, and Ductal cells are highly confident, as they express canonical and specific marker genes with high specificity and expression levels.
- Robust Stromal Cell Identification: Fibroblasts and Lymphatic Endothelial cells are also well-supported by their highly specific canonical markers (*DCN*, *PROX1*, *PDPN*).
- Closely Related Stromal Subtypes: While Endothelial tip cells and Stellate cells show distinct marker gene clusters, there is some shared expression of general stromal/ECM-related genes among these and other fibroblast-like populations. This is biologically expected for mesenchymal cell types in the pancreatic stroma but suggests that the distinction between these specific stromal/endothelial subtypes might rely on subtle quantitative differences or a broader panel of markers beyond those presented, rather than entirely unique genes. Nevertheless, the plot shows clear enrichment of certain marker panels for each group, which is sufficient for annotation support in this context.
4. Pancreatic Minor Cell Type Population Analysis Across Type 1 Diabetes Conditions
[Analysis Visualization Results]...
Analysis Overview
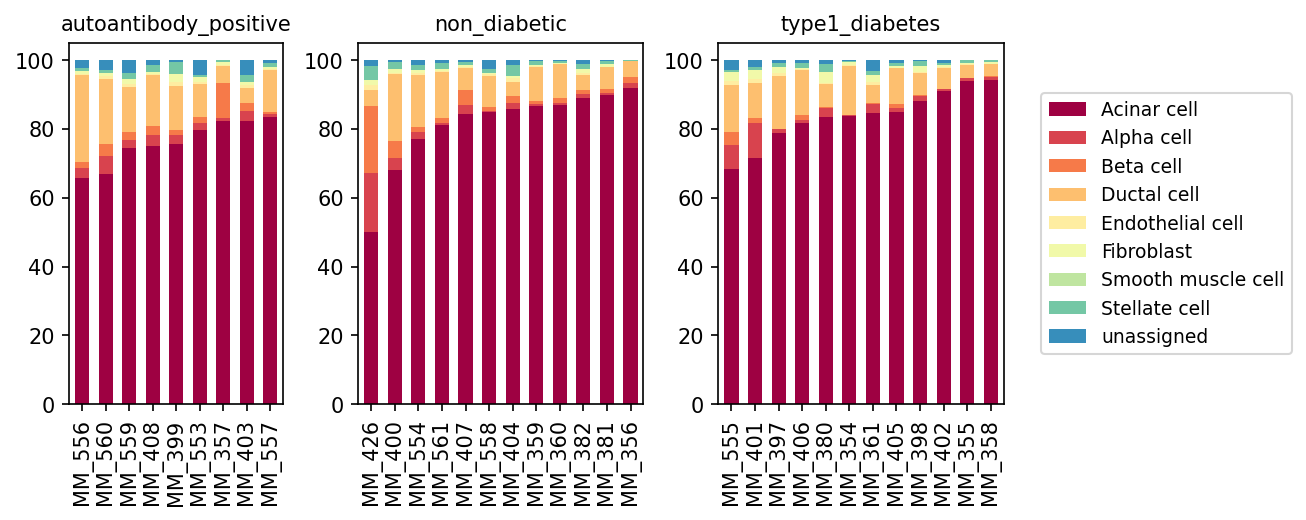
This analysis presents a population bar plot illustrating the relative proportions of minor cell types within individual pancreatic samples. Samples are grouped by their clinical condition: 'autoantibody_positive' (a pre-diabetic state), 'non_diabetic' (reference healthy control), and 'type1_diabetes'. This visualization helps to identify potential shifts in cell composition associated with Type 1 Diabetes (T1D) pathogenesis.
Visual Summary
The stacked bar plots display the percentage contribution of each minor cell type (as indicated in the legend) to the total cellular population per sample. Each bar represents a single sample, and samples are arranged by condition.
- Dominant Cell Type: Acinar cells (burgundy) constitute the overwhelming majority of cells across all samples and conditions, typically accounting for over 60-70% of the total population. This is consistent with the pancreas being an exocrine-dominant organ.
- Beta Cell Proportions: Beta cells (orange), crucial for insulin production, generally appear reduced in samples from the 'type1_diabetes' group compared to the 'non_diabetic' group. Some samples in the 'autoantibody_positive' group also show potentially lower Beta cell proportions than the 'non_diabetic' samples, suggesting early changes.
- Alpha Cell Proportions: Alpha cells (red), which produce glucagon, are present in relatively small proportions across all conditions. While their absolute proportions are low, they may appear relatively maintained or slightly increased in the 'type1_diabetes' group when Beta cells are depleted, altering the Alpha:Beta cell ratio.
- Ductal Cell Proportions: Ductal cells (light orange/yellowish) represent the second most abundant non-acinar cell type. Their proportions appear somewhat variable across samples but do not show a clear, consistent trend of increase or decrease across conditions by visual inspection, although subtle changes might exist.
- Other Cell Types: Endothelial cells (light yellow), Fibroblasts (pale green), Smooth muscle cells (light green), Stellate cells (teal), and unassigned cells (blue) are present in low proportions and do not show striking visual differences across conditions.
Biological Interpretation
The observed shifts in minor cell type populations provide insights into the cellular landscape of the pancreas in Type 1 Diabetes.
- Beta Cell Depletion in T1D: The most significant observation is the apparent reduction in Beta cell proportions in 'type1_diabetes' samples. This is a hallmark pathological feature of T1D, where autoimmune destruction selectively targets insulin-producing Beta cells. The variability in Beta cell proportions within the 'autoantibody_positive' group could reflect different stages of immune-mediated destruction, where some individuals are closer to overt diabetes onset with more significant Beta cell loss than others.
- Alpha Cell Relative Abundance: Despite overall low numbers, the relative contribution of Alpha cells to the islet composition is known to increase as Beta cells are destroyed in T1D. While not dramatically evident in absolute percentages here due to the dominance of acinar cells, the preservation of Alpha cell proportions amidst Beta cell loss suggests a shift in the endocrine cellular balance within the islets.
- Pancreatic Exocrine vs. Endocrine: The consistent high proportion of Acinar cells across all conditions underscores that T1D primarily affects the endocrine pancreas (islets of Langerhans), while the exocrine pancreas (acinar and ductal cells) is relatively preserved in terms of gross cellular abundance.
- Potential Early Changes in Autoantibody-Positive Individuals: The 'autoantibody_positive' group, representing individuals at high risk for T1D, shows intermediate or variable Beta cell proportions. This aligns with the understanding that T1D pathogenesis involves a prolonged prodromal phase of progressive Beta cell decline before clinical diagnosis.
Clinical or Translational Implications
Understanding the changes in pancreatic cell populations in T1D and pre-diabetic states has several clinical implications:
- Biomarker Identification: Quantifying Beta cell proportions, particularly in relation to other islet cells (like Alpha cells), could serve as a potential biomarker for disease progression or risk stratification in autoantibody-positive individuals.
- Disease Monitoring: Changes in Beta cell mass can be critical for monitoring the efficacy of therapeutic interventions aimed at preserving Beta cells or for understanding disease progression.
- Pathogenesis Insights: The data supports the known pathology of T1D involving Beta cell loss. Further investigation into the remaining cell types and their interactions could uncover compensatory mechanisms or contributing factors to disease progression.
- Therapeutic Development: A more precise understanding of the cellular composition in different disease states could inform strategies for Beta cell regeneration, protection, or replacement therapies. The relative stability of other cell types provides context for interventions targeting islet-specific processes.
5. Cell-Cell Interaction Patterns Across Pancreatic Conditions
[Analysis Visualization Results]...
Analysis Overview
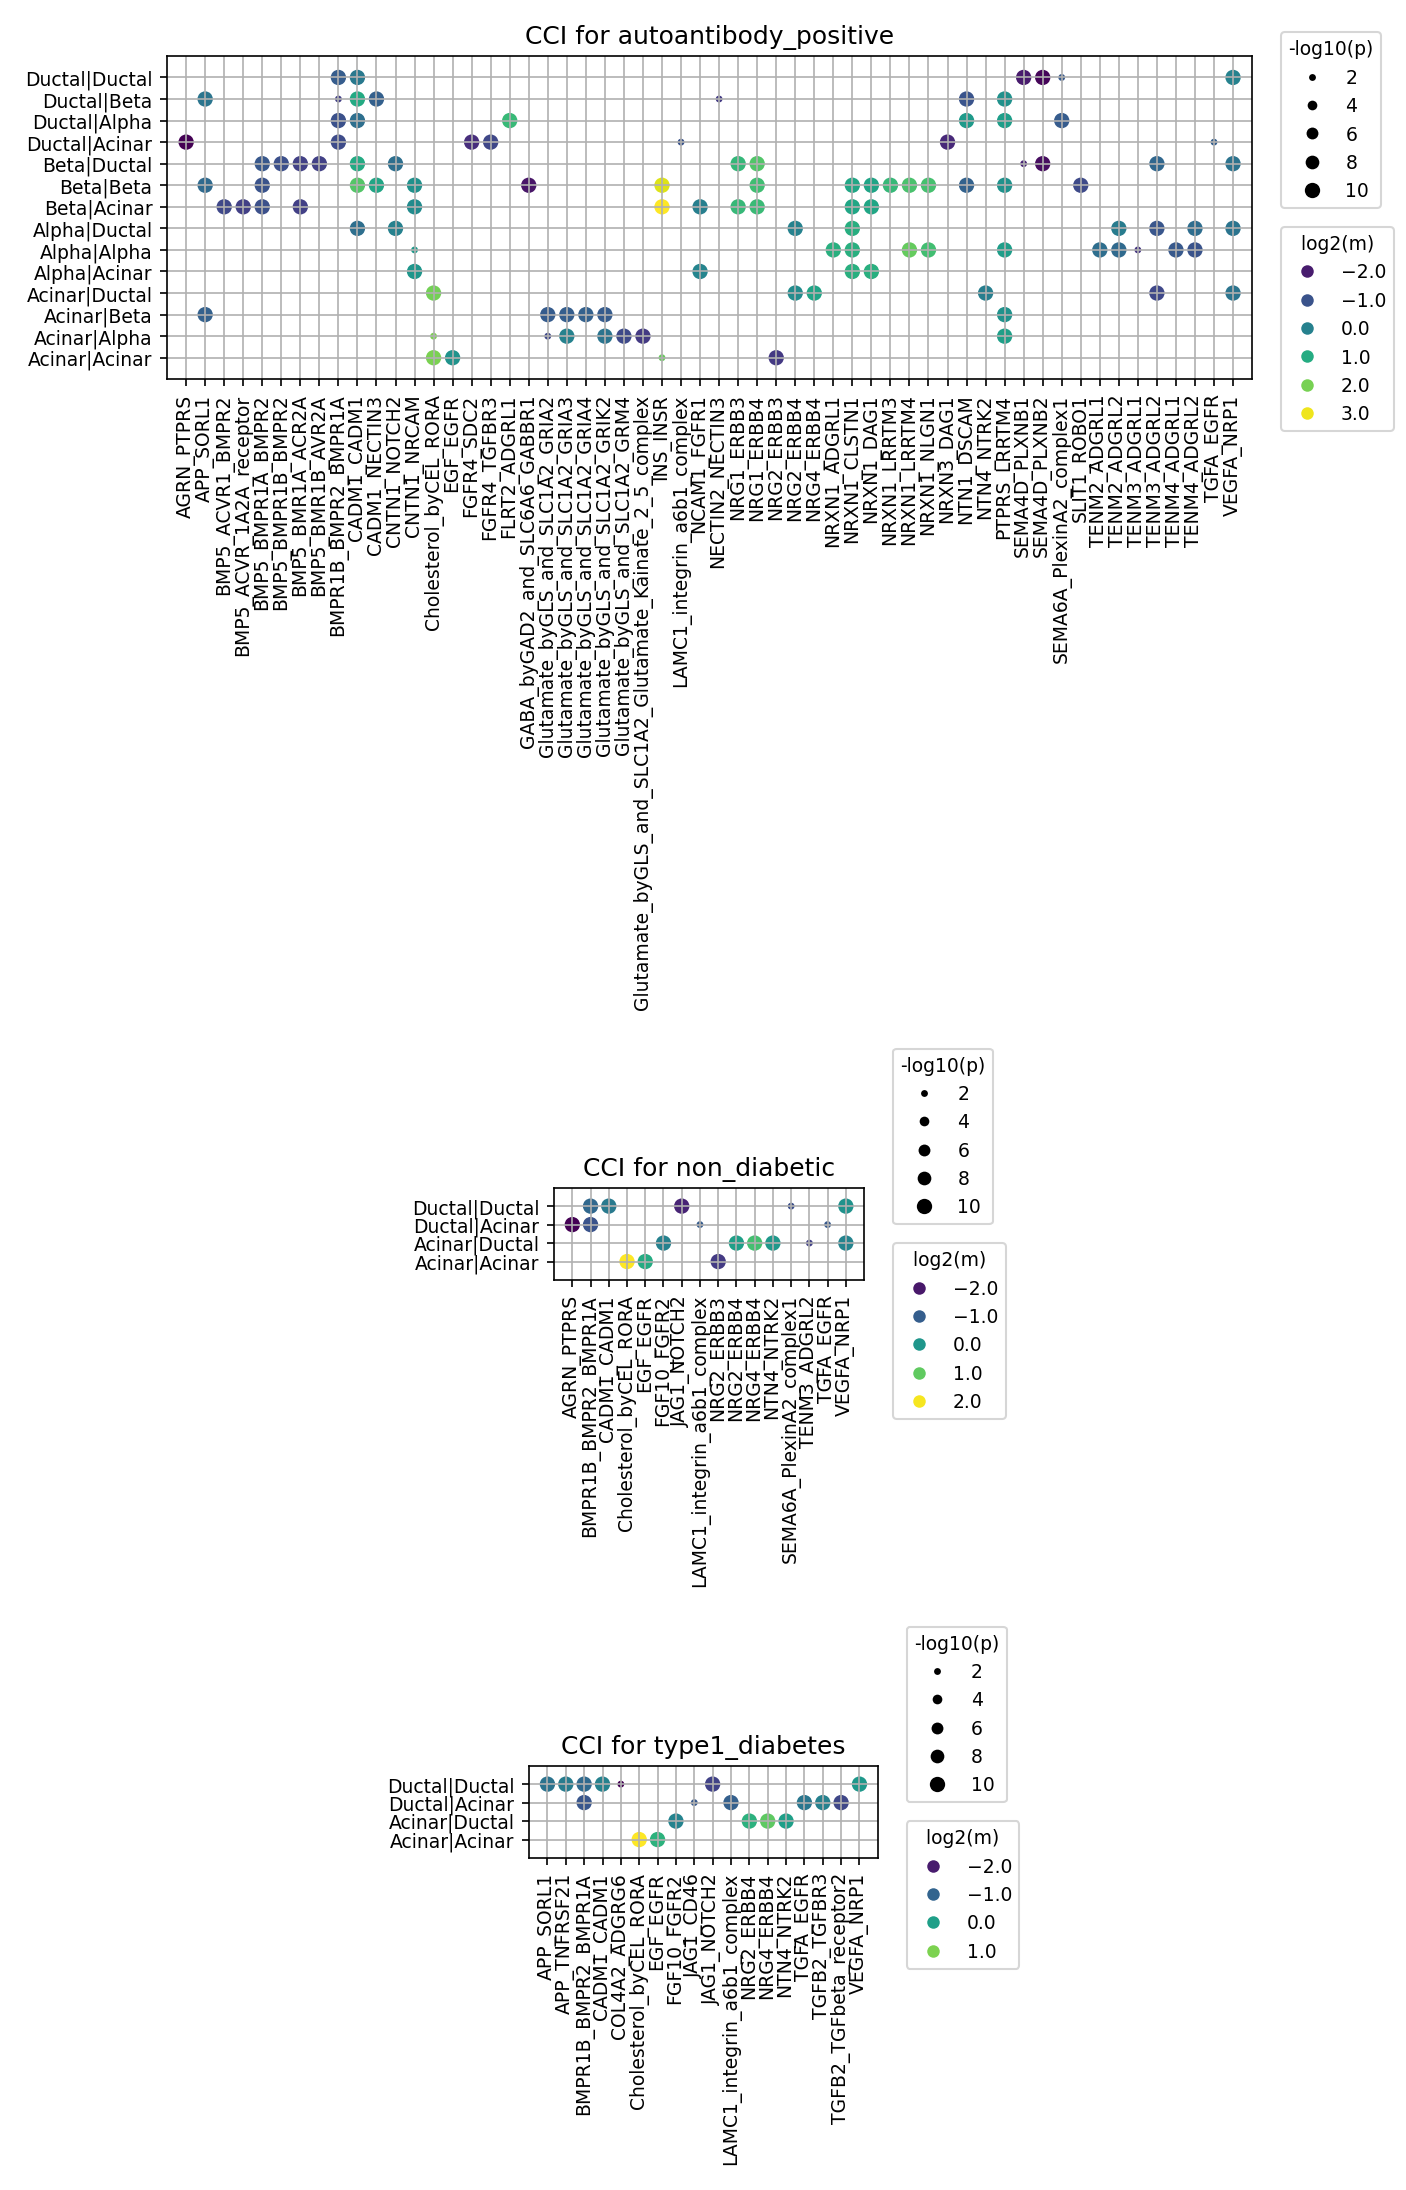
This analysis visualizes cell-cell interaction (CCI) patterns within the pancreas for three distinct conditions: 'autoantibody_positive', 'non_diabetic', and 'type1_diabetes'. The plots display the top 80 significant ligand-receptor interactions, where the dot size represents the statistical significance (-log10(p-value)) and the color indicates the mean expression level of the ligand-receptor pair (log2(mean)). Interactions are shown between various pancreatic cell types, including Acinar, Ductal, Alpha, and Beta cells.
Visual Summary
The three dot plots illustrate distinct cell-cell communication landscapes corresponding to each condition:
- 'autoantibody_positive' Condition: This condition exhibits the most extensive and diverse array of significant cell-cell interactions. A large number of distinct ligand-receptor pairs are active across multiple cell type combinations, including extensive interactions among Ductal, Alpha, Beta, and Acinar cells. Notably, there are numerous interactions involving Alpha-Alpha, Beta-Beta, Alpha-Beta, and Beta-Alpha cell pairs. Several interactions show high mean expression levels (indicated by yellow/green colors), particularly those involving Glutamate signaling (e.g., Glutamate_byGLS and SLC1A2_GLIA2/GLIA4) between Alpha and Beta cells, and various Neuregulin (NRG) pathways (e.g., NRG1-ADGRL1, NRG2-ERBB3/ERBB4, NRG3-ERBB4, NRG4-ERBB4) prominently feature in Beta-Beta, Beta-Alpha, and Alpha-Alpha interactions. BMP signaling (e.g., BMP5-ACVR1-BMPR2, BMPR1B-BMPR2-BMPR1A) is also broadly present.
- 'non_diabetic' Condition: This plot shows a considerably more limited set of significant cell-cell interactions compared to the 'autoantibody_positive' state. The interactions are predominantly observed between Ductal and Acinar cells. While some growth factor pathways like FGF10-FGFR2, JAG1-NOTCH2, NRG2-ERBB4, NTN4-NTRK2, TGFA-EGFR, and VEGFA-NRP1 are present, the overall density and diversity of interactions, especially those involving Alpha and Beta cells, are much lower than in the 'autoantibody_positive' group.
- 'type1_diabetes' Condition: Similar to the 'non_diabetic' condition, the 'type1_diabetes' plot displays a restricted number of top cell-cell interactions. The most prominent interactions are again observed between Ductal and Acinar cells, with some shared ligand-receptor pairs with the 'non_diabetic' group (e.g., FGF10-FGFR2, JAG1-NOTCH2, NRG2-ERBB4, NTN4-NTRK2, TGFA-EGFR). Alpha and Beta cell specific interactions are minimal among the top 80 displayed pairs, suggesting a potential reduction or shift in their communication patterns in established Type 1 Diabetes compared to the autoantibody-positive state.
A key visual difference is the extensive and unique communication network observed in the 'autoantibody_positive' state, particularly within the islet endocrine compartment (Alpha and Beta cells), which is significantly diminished in both 'non_diabetic' and 'type1_diabetes' conditions when considering the top 80 interactions.
Biological Interpretation
The observed cell-cell interaction patterns provide crucial insights into the pancreatic microenvironment in the context of Type 1 Diabetes (T1D) pathogenesis:
- Early Disease Remodeling in Autoantibody Positivity: The 'autoantibody_positive' condition, representing a pre-diabetic or early stage of T1D, demonstrates a robust and diverse intercellular communication network. This suggests significant biological activity and potential remodeling of the pancreatic milieu, particularly within the islets.
- Glutamate Signaling: The prominent and highly expressed Glutamate-related interactions (GABA_byGAD2 and SLC4A2_GLIA2, Glutamate_byGLS and SLC1A2_GLIA2/GLIA4) between Alpha and Beta cells in the 'autoantibody_positive' group are highly significant. Glutamate acts as an important intra-islet signaling molecule, influencing both insulin and glucagon secretion, and potentially playing roles in islet development and stress responses [1]. Enhanced glutamate signaling could represent a compensatory mechanism, an early sign of stress, or dysregulation preceding overt diabetes.
- Neuregulin (NRG)-ERBB Signaling: The widespread presence of various NRG-ERBB interactions (NRG1-ADGRL1, NRG2-ERBB3/ERBB4, NRG3-ERBB4, NRG4-ERBB4) among Alpha and Beta cells in 'autoantibody_positive' individuals is notable. The ERBB receptor family (HER1-4) mediates critical processes such as cell proliferation, survival, differentiation, and tissue repair [2]. Their activity could indicate attempts at islet cell regeneration, heightened stress responses, or early pathological changes in intercellular communication.
- BMP and Notch Signaling: The presence of BMP and Notch signaling pathways (JAG1-NOTCH2) in Ductal and Acinar cells, and BMP signaling in endocrine cells, points to their roles in pancreatic development, differentiation, and maintenance, which might be altered in the context of T1D progression.
- Reduced Interaction Landscape in Established T1D: In contrast to the 'autoantibody_positive' state, the 'type1_diabetes' condition shows a reduced and less diverse set of top cell-cell interactions, particularly among Alpha and Beta cells. This might reflect:
- Loss of Beta Cell Mass: The destruction of beta cells in T1D could directly lead to a reduction in the number and strength of interactions involving these cells.
- Altered Microenvironment: The chronic inflammatory environment in T1D might lead to a different set of compensatory or destructive signaling pathways, not necessarily captured by the top 80 interactions shared across conditions in this plot.
- Filtering Effects: It is important to note that only the top 80 interactions are displayed per condition. It is possible that other significant interactions exist but did not meet the stringent criteria for inclusion in these plots.
- Comparison to Non-Diabetic: The 'non_diabetic' condition also shows a limited interaction profile, primarily within exocrine (Ductal-Acinar) compartments. This could represent a basal, healthy state of pancreatic communication, where the specific endocrine-endocrine interactions prominent in the 'autoantibody_positive' state are not activated or do not rank among the top 80.
Clinical or Translational Implications
The distinct cell-cell interaction patterns observed across the different conditions have several potential clinical and translational implications:
- Early Biomarker Discovery: The unique and extensive interaction network in 'autoantibody_positive' individuals, particularly involving glutamate and neuregulin pathways in Alpha and Beta cells, could serve as a source for novel early diagnostic biomarkers for T1D. Identifying specific ligand-receptor pairs or signatures that are uniquely altered in this pre-diabetic stage could enable earlier intervention.
- *PubMed search for "Type 1 Diabetes autoantibody positive glutamate signaling islet"*: https://pubmed.ncbi.nlm.nih.gov/?term=Type+1+Diabetes+autoantibody+positive+glutamate+signaling+islet
- *GeneCards for SLC1A2 (EAAT2)*: https://www.genecards.org/cgi-bin/carddisp.pl?gene=SLC1A2
- Therapeutic Targets: Key ligand-receptor interactions that are significantly altered or highly active in the 'autoantibody_positive' state (e.g., those involving NRG-ERBB or specific glutamate receptors) could represent novel therapeutic targets to halt or delay beta cell destruction and disease progression in individuals at high risk for T1D. Modulating these pathways might protect beta cells from immune attack or promote their survival and function.
- *PubMed search for "Type 1 Diabetes neuregulin ERBB therapy"*: https://pubmed.ncbi.nlm.nih.gov/?term=Type+1+Diabetes+neuregulin+ERBB+therapy
- Understanding Disease Mechanisms: Further investigation into the specific roles of these enriched communication pathways in the 'autoantibody_positive' state can provide deeper insights into the initiating events and progression of T1D. Understanding how these interactions contribute to islet stress, immune cell recruitment, or altered beta cell function is crucial for developing targeted therapies.
- *PubMed search for "Type 1 Diabetes islet cell-cell communication"*: https://pubmed.ncbi.nlm.nih.gov/?term=Type+1+Diabetes+islet+cell-cell+communication
The analysis highlights the dynamic nature of intercellular communication in the pancreas during the progression of Type 1 Diabetes, emphasizing the 'autoantibody_positive' phase as a critical window for intervention and biomarker discovery.
---
References:
[1] Genecards entry for SLC1A2 (EAAT2/GLT1): https://www.genecards.org/cgi-bin/carddisp.pl?gene=SLC1A2
[2] PubMed search for "ERBB signaling pancreatic beta cell": https://pubmed.ncbi.nlm.nih.gov/?term=ERBB+signaling+pancreatic+beta+cell
6. Condition-Specific Cell-Cell Interaction Patterns in Autoantibody-Positive Pancreas
[Analysis Visualization Results]...
Analysis Overview
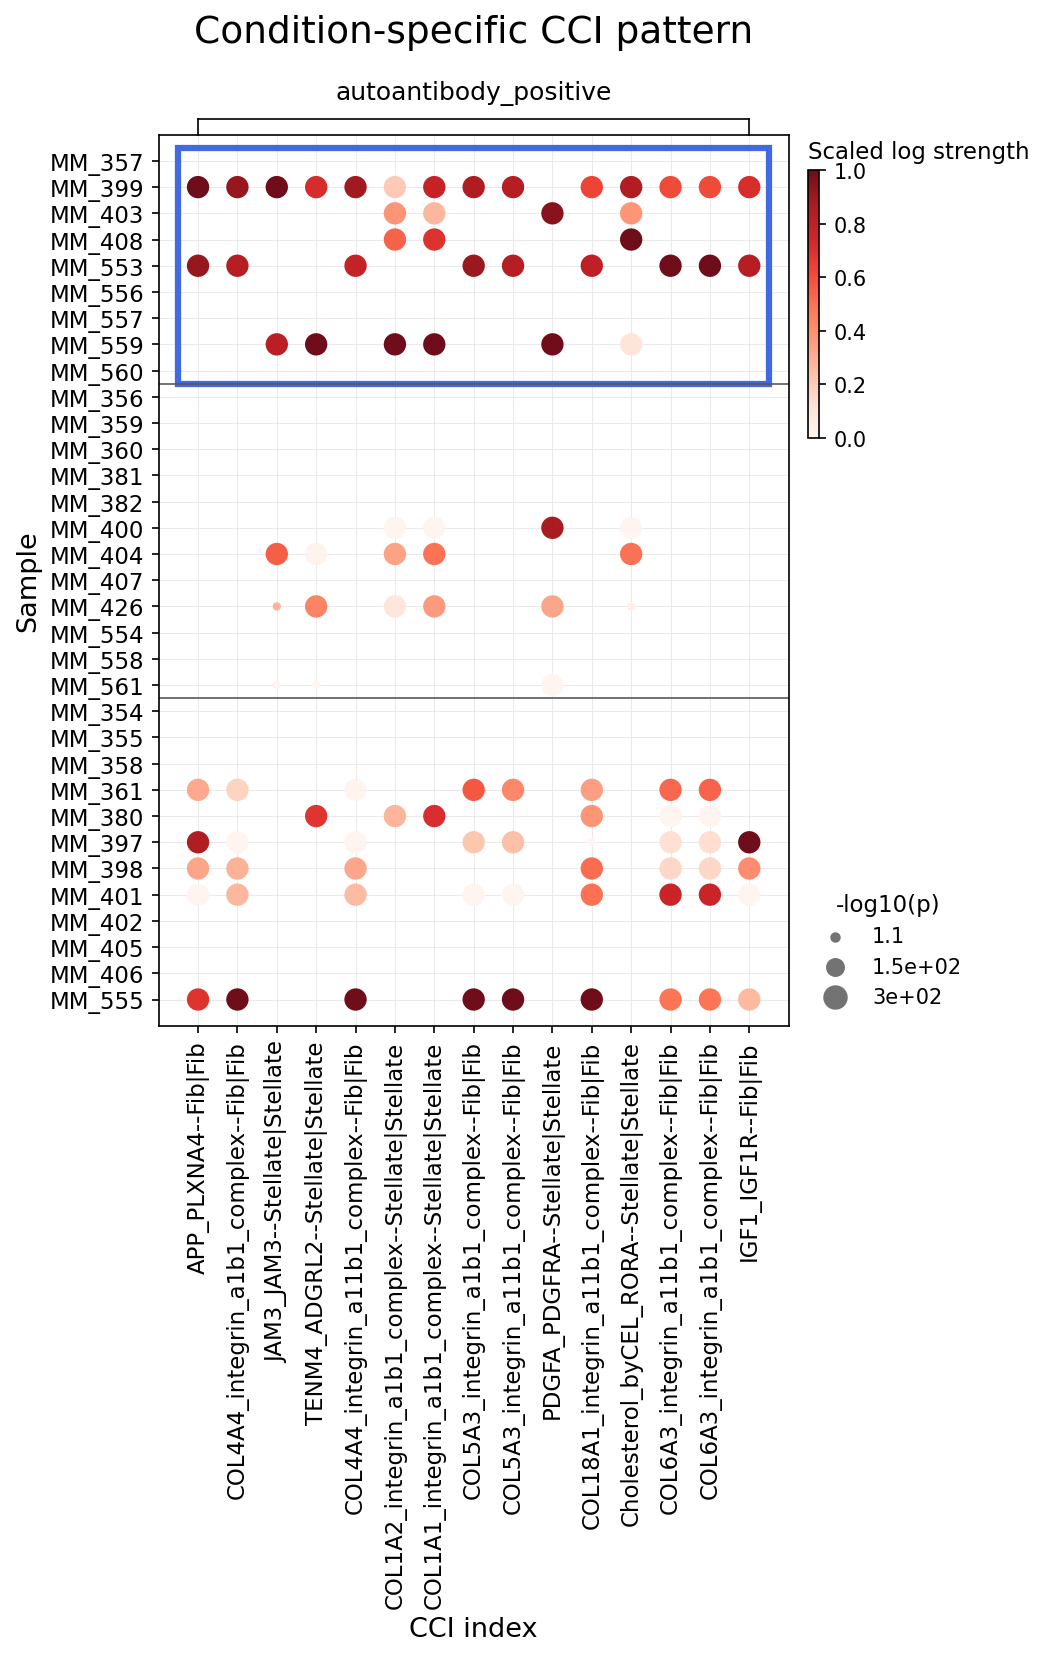
This analysis investigates condition-specific cell-cell interaction (CCI) patterns within the 'autoantibody_positive' group, focusing on interactions involving stromal cells in the pancreas. The dot plot visualizes the strength and statistical significance of specific ligand-receptor interactions between different stromal cell populations (Fibroblasts and Stellate cells) across individual samples. The primary goal is to identify prominent interactions that may characterize the autoantibody-positive state, which is considered a pre-diabetic or early stage of Type 1 Diabetes (T1D).
Visual Summary
The dot plot displays a matrix where each row represents an individual sample and each column represents a specific cell-cell interaction pair.
- Interaction Strength: The color intensity of each dot reflects the scaled log strength of the interaction, with darker red indicating stronger interactions.
- Statistical Significance: The size of each dot corresponds to the -log10(p-value), meaning larger dots represent more statistically significant interactions (smaller p-values).
Key observations from the plot:
- Sample Heterogeneity: There is considerable variability in CCI patterns among individual samples within the 'autoantibody_positive' condition.
- Highly Interacting Samples: A distinct cluster of samples (e.g., MM_357, MM_399, MM_403, MM_408, MM_553, MM_556, MM_557, MM_559, MM_560), highlighted by the blue box, consistently exhibits strong and significant interactions across multiple ligand-receptor pairs.
Prominent Interactions:
- Integrin-Collagen interactions: Multiple interactions involving various collagen types (COL4A4, COL1A1, COL1A2, COL5A3, COL18A1, COL6A3) and integrin complexes (integrin_a1b1_complex, integrin_a11b1_complex) are frequently observed as strong and significant, particularly in the highly interacting samples. These typically occur between Fibroblasts and Fibroblasts, or Stellate cells and Stellate cells.
- PDGFA-PDGFRA--Stellate|Stellate: This interaction appears consistently strong and highly significant across many samples, including those outside the top cluster (e.g., MM_380, MM_397, MM_555).
- IGF1_IGF1R--Fib|Fib: This interaction also shows notable strength and significance in several samples.
- Other notable interactions: APP_PLXNA4--Fib|Fib, JAM3-ADGRL2--Stellate|Stellate, TENM4-ADGRL2--Stellate|Stellate, and Cholesterol_byCEL_RORA--Stellate|Stellate are present with varying degrees of strength and significance, mostly within the highly interacting samples.
Biological Interpretation
The observed cell-cell interactions primarily involve stromal cells (Fibroblasts and Stellate cells) interacting with themselves. This suggests a significant role of the stromal compartment in the 'autoantibody_positive' state, potentially in processes related to extracellular matrix remodeling, cell survival, proliferation, and intercellular communication, which can influence pancreatic inflammation and tissue integrity.
- Integrin-Collagen Axis (e.g., COL4A4-integrin_a1b1_complex--Fib|Fib, COL1A2-integrin_a1b1_complex--Stellate|Stellate):
- Signaling Pathways/Mechanisms: Integrins are key cell surface receptors that mediate cell-extracellular matrix (ECM) and cell-cell adhesion. They transmit mechanical and biochemical signals into the cell, influencing cell proliferation, differentiation, migration, and survival. Collagen types I, IV, V, VI, and XVIII are major components of the ECM. Their interactions with integrin alpha1beta1 and alpha11beta1 complexes are crucial for maintaining tissue architecture, providing mechanical support, and regulating cellular functions.
- In the pancreas, fibroblasts and stellate cells are major producers of collagen and interact extensively with the ECM. Altered collagen-integrin interactions can lead to increased ECM deposition and stiffness, contributing to pancreatic fibrosis, which is often observed in chronic pancreatitis and can accompany islet inflammation in T1D.
- Reference: Integrins and Cell Adhesion - PubMed Search
- PDGFA-PDGFRA Signaling (PDGFA-PDGFRA--Stellate|Stellate):
- Signaling Pathways/Mechanisms: Platelet-Derived Growth Factor (PDGF) signaling, specifically through PDGFRA, is a potent mitogenic and chemotactic pathway. When PDGFA binds to PDGFRA on pancreatic stellate cells, it activates downstream signaling cascades (e.g., MAPK, PI3K/Akt), leading to stellate cell activation, proliferation, migration, and increased production of ECM components. This process is a central driver of fibrosis in various organs, including the pancreas.
- Relevance to T1D: Activated pancreatic stellate cells contribute to inflammation and fibrosis, which can negatively impact islet function and survival, exacerbating T1D progression.
- Reference: PDGFRA - GeneCards
- IGF1-IGF1R Signaling (IGF1_IGF1R--Fib|Fib):
- Signaling Pathways/Mechanisms: Insulin-like Growth Factor 1 (IGF1) binding to its receptor (IGF1R) activates downstream pathways such as PI3K/Akt and MAPK, promoting cell growth, survival, and differentiation. In fibroblasts, IGF1R signaling can enhance cell proliferation and survival, contributing to fibrotic processes and tissue remodeling.
- Relevance to T1D: Dysregulation of IGF1/IGF1R signaling can impact metabolic homeostasis. In the pancreas, it could support the survival and proliferation of fibroblasts under inflammatory conditions, contributing to the fibrotic microenvironment.
- Reference: IGF1R - GeneCards
- APP-PLXNA4 Interaction (APP_PLXNA4--Fib|Fib):
- Signaling Pathways/Mechanisms: Amyloid Precursor Protein (APP) is known for its role in neurobiology, but it is also expressed in other tissues. Plexin-A4 (PLXNA4) is a receptor for semaphorins, mediating cell guidance and migration. This interaction may regulate fibroblast migration, morphology, or interactions with the ECM, potentially impacting tissue organization in the pancreas. Its specific role in pancreatic fibrosis or T1D context is less defined and warrants further investigation.
- JAM3-ADGRL2 Interaction (JAM3-ADGRL2--Stellate|Stellate):
- Signaling Pathways/Mechanisms: Junctional Adhesion Molecule 3 (JAM3) is involved in tight junction formation and leukocyte transendothelial migration. Adhesion G Protein-Coupled Receptor L2 (ADGRL2, also LPHN2) is an adhesion GPCR with diverse functions in cell adhesion and signaling. This interaction suggests a role in maintaining cell-cell integrity, modulating cell communication, or influencing immune cell trafficking within the pancreatic stellate cell network, potentially affecting inflammatory responses.
- TENM4-ADGRL2 Interaction (TENM4-ADGRL2--Stellate|Stellate):
- Signaling Pathways/Mechanisms: Teneurin Transmembrane Protein 4 (TENM4) are large cell-surface adhesion molecules. Their interaction with ADGRL2 could further modulate stellate cell-cell adhesion, recognition, or signaling, thereby impacting tissue patterning, remodeling, or the fibrotic response in the pancreas.
- Cholesterol_byCEL_RORA Interaction (Cholesterol_byCEL_RORA--Stellate|Stellate):
- Signaling Pathways/Mechanisms: This intriguing interaction involves cholesterol, likely mediated by Carboxylesterase Lipase (CEL), and Retinoid-related Orphan Receptor Alpha (RORA). CEL is involved in lipid metabolism, particularly cholesterol ester hydrolysis. RORA is a nuclear receptor that regulates lipid metabolism, inflammation, and circadian rhythms. Pancreatic stellate cells are known for their lipid droplet content, which is lost upon activation. This interaction could link cholesterol metabolism and RORA-mediated gene regulation in stellate cells, potentially influencing their activation status and contribution to pancreatic pathology in autoantibody-positive individuals.
Clinical or Translational Implications
The significant and strong cell-cell interactions, particularly those involving stromal cells in autoantibody-positive individuals, highlight potential mechanisms underlying the earliest stages of pancreatic remodeling in the context of T1D risk.
- Biomarkers of Disease Progression: The presence and strength of specific interactions, such as those involving integrins, PDGFRA, and IGF1R, could serve as early biomarkers for identifying individuals at higher risk of progressing from an autoantibody-positive state to overt T1D, or for monitoring the extent of pancreatic stromal activation and fibrosis.
Therapeutic Targets:
- PDGFRA: The prominent PDGFA-PDGFRA axis in stellate cells is a well-established pro-fibrotic pathway. Inhibitors of PDGFRA (e.g., imatinib, nintedanib) are already used in other fibrotic conditions and cancers. Targeting this pathway in pancreatic stellate cells could be a strategy to attenuate fibrosis and inflammation in the autoantibody-positive pancreas, potentially preserving islet function.
- Integrins: Given the numerous significant collagen-integrin interactions, specific integrin subunits (e.g., alpha1beta1, alpha11beta1) could represent therapeutic targets. Modulating these interactions might reduce ECM deposition, alleviate tissue stiffness, and potentially lessen the inflammatory environment. However, integrins have broad physiological roles, requiring highly specific targeting.
- IGF1R: Inhibitors of IGF1R signaling, explored in oncology, could potentially be repurposed to reduce fibroblast proliferation and survival in the fibrotic pancreas.
- Further research into the precise roles of APP-PLXNA4, JAM3-ADGRL2, TENM4-ADGRL2, and Cholesterol_byCEL_RORA in the autoantibody-positive pancreas could uncover novel therapeutic avenues. For instance, understanding how cholesterol metabolism and RORA signaling influence stellate cell activation could lead to metabolic interventions.
- Personalized Medicine: The observed heterogeneity among samples suggests that a personalized approach might be necessary. Stratifying autoantibody-positive individuals based on their specific stromal CCI profiles could allow for targeted interventions for those most likely to benefit from anti-fibrotic or anti-inflammatory therapies.
7. Beta Cell Condition-Specific Surfaceome Markers in Pancreas
[Analysis Visualization Results]...
Analysis Overview
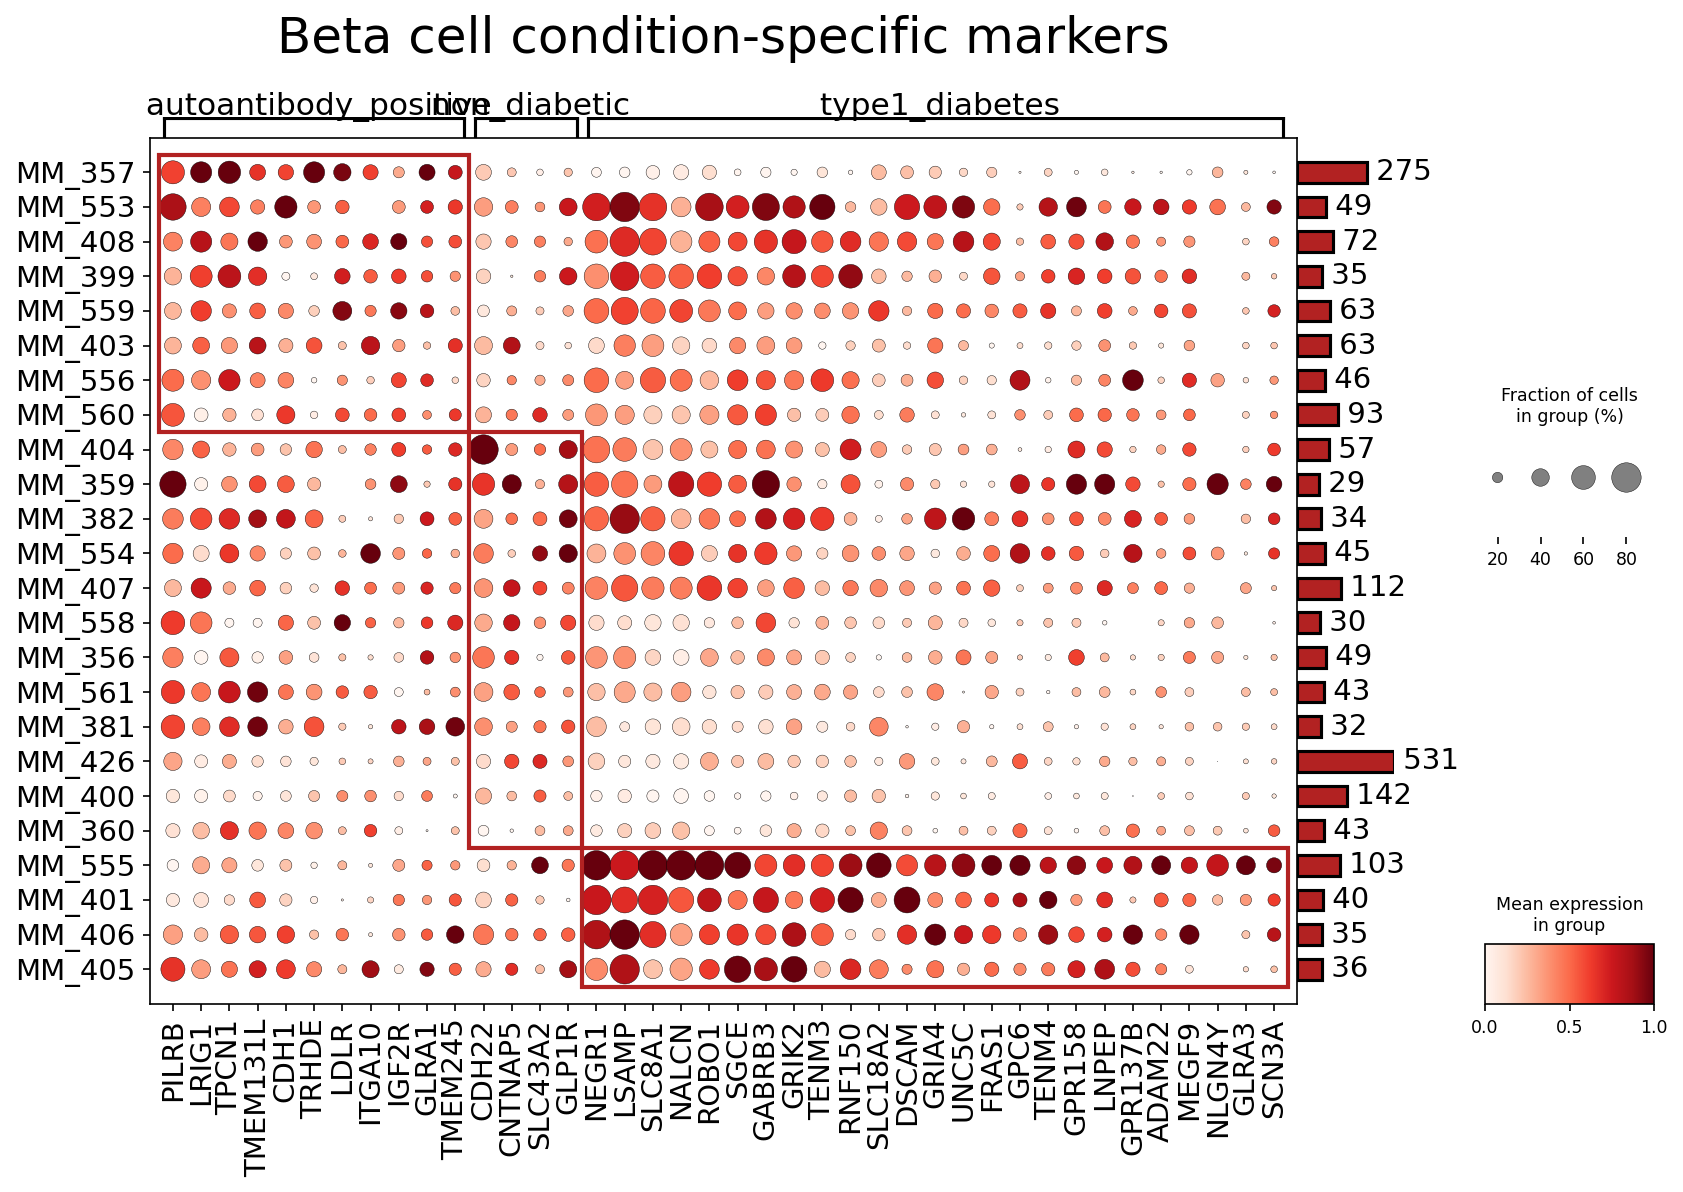
This analysis identifies condition-specific surfaceome markers in Beta cells from pancreatic tissue across three conditions: non_diabetic, autoantibody_positive, and type1_diabetes. The goal is to pinpoint surface proteins whose expression patterns are altered in pre-diabetic (autoantibody_positive) and Type 1 Diabetes (T1D) states compared to non-diabetic controls, with a focus on their biological mechanisms and potential as therapeutic targets. A dot plot visualizes the expression of these markers across various samples/donors, grouped by condition. Dot size indicates the fraction of cells expressing the marker, while color intensity represents the mean expression level within those cells.
Visual Summary
The dot plot displays the expression profiles of numerous surfaceome markers in Beta cells. Key observations include:
- Markers associated with non-diabetic and autoantibody-positive states: A cluster of markers, including PILRB, LRIG1, TPCN1, CDH1, TRHDE, LDLR, ITGA10, IGF2R, GLRA1, and TMEM245 (highlighted by the top-left red box), show strong and widespread expression (large, dark red dots) across most non_diabetic and autoantibody_positive samples. Their expression is notably reduced or absent in the majority of type1_diabetes samples. This pattern suggests these markers might be indicative of healthy Beta cell function or early adaptive responses.
- Markers associated with type1_diabetes and a subset of autoantibody-positive samples: A large and prominent cluster of markers (highlighted by the lower-middle and right red boxes) displays negligible or very low expression in non_diabetic Beta cells. However, these markers, which include NEGR1, LSAMP, SLC8A1, EFNA5, NALCN, PTPRK, ROBO1, SGCE, PDLIM5, GABRB3, ABCC5, TENM3, RNF150, NCAM1, DSCAM, UBAC2, ATP13A3, UNC5C, CNNM2, CPD, DSCAML1, FRAS1, STT3B, BMPR1A, SCARB2, GPC6, GPR158, EMP2, LNPEP, LMBR1, GPR137B, ADAM22, ANO5, MEGF9, TSPAN2, and TSPAN5, are significantly upregulated in a distinct subset of type1_diabetes samples (e.g., MM_401, MM_406, MM_405) and some autoantibody_positive samples (e.g., MM_359, MM_382, MM_554). This heterogeneity suggests that Beta cells in individuals with T1D or pre-diabetic autoimmunity may adopt diverse stress responses or undergo distinct pathological changes.
- Variability within conditions: Even within the type1_diabetes group, there's considerable heterogeneity in marker expression across different samples, highlighting the diverse disease progression and Beta cell states among individuals.
Biological Interpretation
The differential expression of surfaceome markers in Beta cells provides insights into the cellular changes occurring during the progression of Type 1 Diabetes. These changes can reflect altered function, stress responses, dedifferentiation, or attempts at repair. We focus on a selection of notable markers:
Markers Generally Reduced in Type 1 Diabetes (Higher in Non-Diabetic/Autoantibody-Positive)
- GLP1R (Glucagon-Like Peptide 1 Receptor)
- Expression Pattern: Robust expression in most non_diabetic and autoantibody_positive Beta cells; diminished or absent in many type1_diabetes samples.
- Signaling Pathways & Mechanisms: GLP1R is a G-protein coupled receptor that, upon binding GLP-1, activates adenylyl cyclase, leading to increased intracellular cAMP and downstream activation of PKA. This pathway is critical for glucose-dependent insulin secretion, promoting Beta cell proliferation, enhancing survival, and exerting anti-apoptotic effects [UniProt: P43220 ]. In healthy Beta cells, GLP1R signaling is essential for maintaining glucose homeostasis.
- T1D Relevance: The observed reduction in GLP1R expression in T1D Beta cells suggests an impairment in crucial signaling pathways that support Beta cell function and survival. This could contribute to reduced insulin secretion capacity, increased susceptibility to immune-mediated apoptosis, or a shift towards a dysfunctional Beta cell phenotype.
- Therapeutic Potential: GLP-1 receptor agonists are established therapeutic agents for Type 2 Diabetes [PubMed: 33100589 ]. In T1D, restoring or enhancing GLP1R signaling through agonists could be investigated to preserve residual Beta cell mass, improve glycemic control, and potentially protect Beta cells from further destruction, especially in early stages or in combination with immunomodulatory therapies [PubMed: 28854911 ].
- CDH1 (E-cadherin)
- Expression Pattern: Highly expressed in most non_diabetic and autoantibody_positive Beta cells; significant reduction or absence in several type1_diabetes samples.
- Signaling Pathways & Mechanisms: CDH1 encodes E-cadherin, a classic cadherin that mediates calcium-dependent, homophilic cell-cell adhesion. It is a fundamental component of adherens junctions, which are crucial for maintaining tissue architecture, cell polarity, and intercellular communication [GeneCards: CDH1 ]. In pancreatic islets, E-cadherin is vital for Beta cell cluster integrity, ensuring efficient intercellular coupling and coordinated insulin secretion. Loss of E-cadherin is a hallmark of epithelial-mesenchymal transition (EMT).
- T1D Relevance: Decreased CDH1 expression in T1D Beta cells suggests a breakdown in Beta cell-Beta cell adhesion, potentially leading to disruption of islet architecture and increased vulnerability to immune cell infiltration. This loss of intercellular connections may also contribute to Beta cell dysfunction, impaired insulin secretion, and processes resembling dedifferentiation, where Beta cells lose their mature functional identity.
- Therapeutic Potential: Strategies aimed at preserving or restoring E-cadherin-mediated cell-cell adhesion could potentially protect Beta cell integrity, function, and resilience against autoimmune attack. Agents that stabilize adherens junctions or counteract EMT-like changes in Beta cells could be explored as potential adjunctive therapies in T1D.
- PILRB (Paired Immunoglobulin-Like Type 2 Receptor Beta)
- Expression Pattern: Strong and widespread expression in non_diabetic and autoantibody_positive Beta cells; markedly reduced or absent in the majority of type1_diabetes samples.
- Signaling Pathways & Mechanisms: PILRB is a surface receptor belonging to the paired immunoglobulin-like type 2 receptor family, often found on immune cells where it generally functions as an inhibitory receptor [UniProt: Q9UBK2 ]. While its precise ligand and role in Beta cells are still being investigated, in other cellular contexts, it can modulate immune responses and cellular signaling, potentially influencing cell survival or immune recognition.
- T1D Relevance: The significant reduction of PILRB in T1D Beta cells is noteworthy. If PILRB plays a role in mediating protective signals or dampening local immune activation within the islet, its loss could render Beta cells more susceptible to autoimmune destruction. It might be part of an intrinsic Beta cell mechanism to evade or counter immune surveillance.
- Therapeutic Potential: Further research into PILRB's function in Beta cells could uncover novel immune checkpoint mechanisms. Strategies to maintain or enhance PILRB expression or function could potentially provide a new avenue for protecting Beta cells from immune destruction in T1D, possibly through gene therapy or small molecule modulators.
Markers Generally Increased in Type 1 Diabetes (Higher in Diseased Subsets)
- NCAM1 (Neural Cell Adhesion Molecule 1 / CD56)
- Expression Pattern: Generally low or absent in non_diabetic Beta cells; notably upregulated (large, dark red dots) in a distinct subset of autoantibody_positive and type1_diabetes samples.
- Signaling Pathways & Mechanisms: NCAM1 is a cell adhesion molecule involved in various cell-cell interactions, neuronal development, and cell plasticity [GeneCards: NCAM1 ]. In the context of pancreatic islets, its re-expression in adult Beta cells is often associated with Beta cell dedifferentiation, a process where mature, functional Beta cells lose their specialized identity and revert to a more progenitor-like, less functional state, or acquire a neuroendocrine-like phenotype.
- T1D Relevance: The upregulation of NCAM1 in a subset of T1D Beta cells is a strong indicator of cellular stress and dedifferentiation. This phenotypic shift is frequently observed in Beta cells subjected to chronic stress, inflammation, and immune attack in diabetes, leading to impaired glucose-stimulated insulin secretion and increased vulnerability.
- Therapeutic Potential: NCAM1 could serve as a valuable biomarker for monitoring Beta cell dedifferentiation and stress during T1D progression. Therapeutic strategies aimed at preventing or reversing Beta cell dedifferentiation (e.g., through targeted gene therapies or small molecules that modulate specific transcription factors or signaling pathways) could potentially restore Beta cell function and identity, thereby preserving residual Beta cell mass.
- SLC8A1 (Solute Carrier Family 8 Member A1 / NCX1)
- Expression Pattern: Predominantly absent or low in non_diabetic Beta cells; significantly upregulated in the same subset of autoantibody_positive and type1_diabetes samples exhibiting high NCAM1 expression.
- Signaling Pathways & Mechanisms: SLC8A1 encodes the Na+/Ca2+ exchanger 1 (NCX1), a plasma membrane protein crucial for maintaining intracellular Ca2+ homeostasis by exchanging Na+ and Ca2+ ions [GeneCards: SLC8A1 ]. Precise Ca2+ dynamics are fundamental for glucose-stimulated insulin secretion and Beta cell excitability.
- T1D Relevance: Dysregulation of intracellular Ca2+ handling is a critical factor in Beta cell dysfunction and death in diabetes. The upregulation of NCX1 could represent an adaptive attempt by stressed Beta cells to cope with altered Ca2+ dynamics or, conversely, a maladaptive response that further impairs Beta cell function by altering the finely tuned Ca2+ oscillations required for insulin secretion. Chronic activation of NCX1 could also contribute to ionic imbalance and Beta cell demise.
- Therapeutic Potential: Modulating NCX1 activity or expression offers a potential avenue to restore proper Ca2+ homeostasis in stressed Beta cells, which could enhance insulin secretion and improve Beta cell survival. However, precise targeting would be crucial due to the complex and multifaceted role of NCX1 in cellular physiology. It could also serve as a biomarker for Beta cell stress and dysfunction.
- BMPR1A (Bone Morphogenetic Protein Receptor Type 1A)
- Expression Pattern: Low or absent in non_diabetic Beta cells; upregulated in a subset of autoantibody_positive and type1_diabetes samples, mirroring the patterns of NCAM1 and SLC8A1.
- Signaling Pathways & Mechanisms: BMPR1A is a transmembrane serine/threonine kinase receptor that mediates the signaling of Bone Morphogenetic Proteins (BMPs), which belong to the TGF-beta superfamily. BMP signaling is involved in embryonic development, cell proliferation, differentiation, and apoptosis across various tissues [GeneCards: BMPR1A ]. In the pancreas, it plays roles in islet development and Beta cell mass regulation.
- T1D Relevance: Altered BMP signaling in adult pancreatic Beta cells can impact processes such as regeneration, survival, or dedifferentiation. The upregulation of BMPR1A in diseased Beta cells might indicate a dysregulated attempt at tissue repair or regeneration. Alternatively, it could be part of a maladaptive signaling cascade that contributes to Beta cell dysfunction, increased apoptosis, or impaired Beta cell identity under the inflammatory and metabolic stress of T1D.
- Therapeutic Potential: Modulating BMPR1A activity could be a target to influence Beta cell fate in T1D. Depending on the specific BMP ligands and the context-dependent cellular responses, therapies could aim to either promote beneficial Beta cell responses (e.g., regeneration, improved survival) or block detrimental ones (e.g., apoptosis, dedifferentiation) by precisely regulating BMPR1A signaling.
Clinical or Translational Implications
The identification of these condition-specific surfaceome markers provides several potential clinical and translational implications for Type 1 Diabetes:
- Biomarkers for Disease Progression and Heterogeneity: Markers like NCAM1, SLC8A1, and BMPR1A could serve as biomarkers for Beta cell stress, dysfunction, or dedifferentiation, potentially aiding in monitoring disease progression, identifying subsets of patients with distinct Beta cell pathologies, and predicting response to therapies. Conversely, the reduction of markers like GLP1R, CDH1, and PILRB could indicate loss of functional Beta cell mass or protective mechanisms.
- Novel Therapeutic Targets: Given their location on the cell surface, these markers are highly accessible for therapeutic intervention.
- For markers like GLP1R and CDH1 that are reduced in T1D, strategies could focus on enhancing their expression or function to support Beta cell survival, integrity, and insulin secretion.
- For markers such as NCAM1, SLC8A1, and BMPR1A that are upregulated in diseased states, targeting them with specific antibodies or small molecule inhibitors might help prevent dedifferentiation, restore calcium homeostasis, or modulate maladaptive signaling pathways, thereby improving Beta cell function and survival.
- Personalized Medicine: The observed heterogeneity in marker expression within the type1_diabetes samples suggests that T1D may involve diverse underlying Beta cell pathologies. This highlights the potential for personalized therapeutic approaches where treatments are tailored to the specific molecular profile of an individual's Beta cells, potentially identified through these surface markers.
- Experimental Validation: These identified markers warrant further experimental validation in in vitro Beta cell models and in vivo animal models of T1D. Functional studies would be essential to confirm their causal roles in T1D pathogenesis and to test the efficacy of targeted therapeutic agents.
8. Fibroblast Condition-Specific Surfaceome Markers in Pancreatic Tissue
[Analysis Visualization Results]...
Analysis Overview
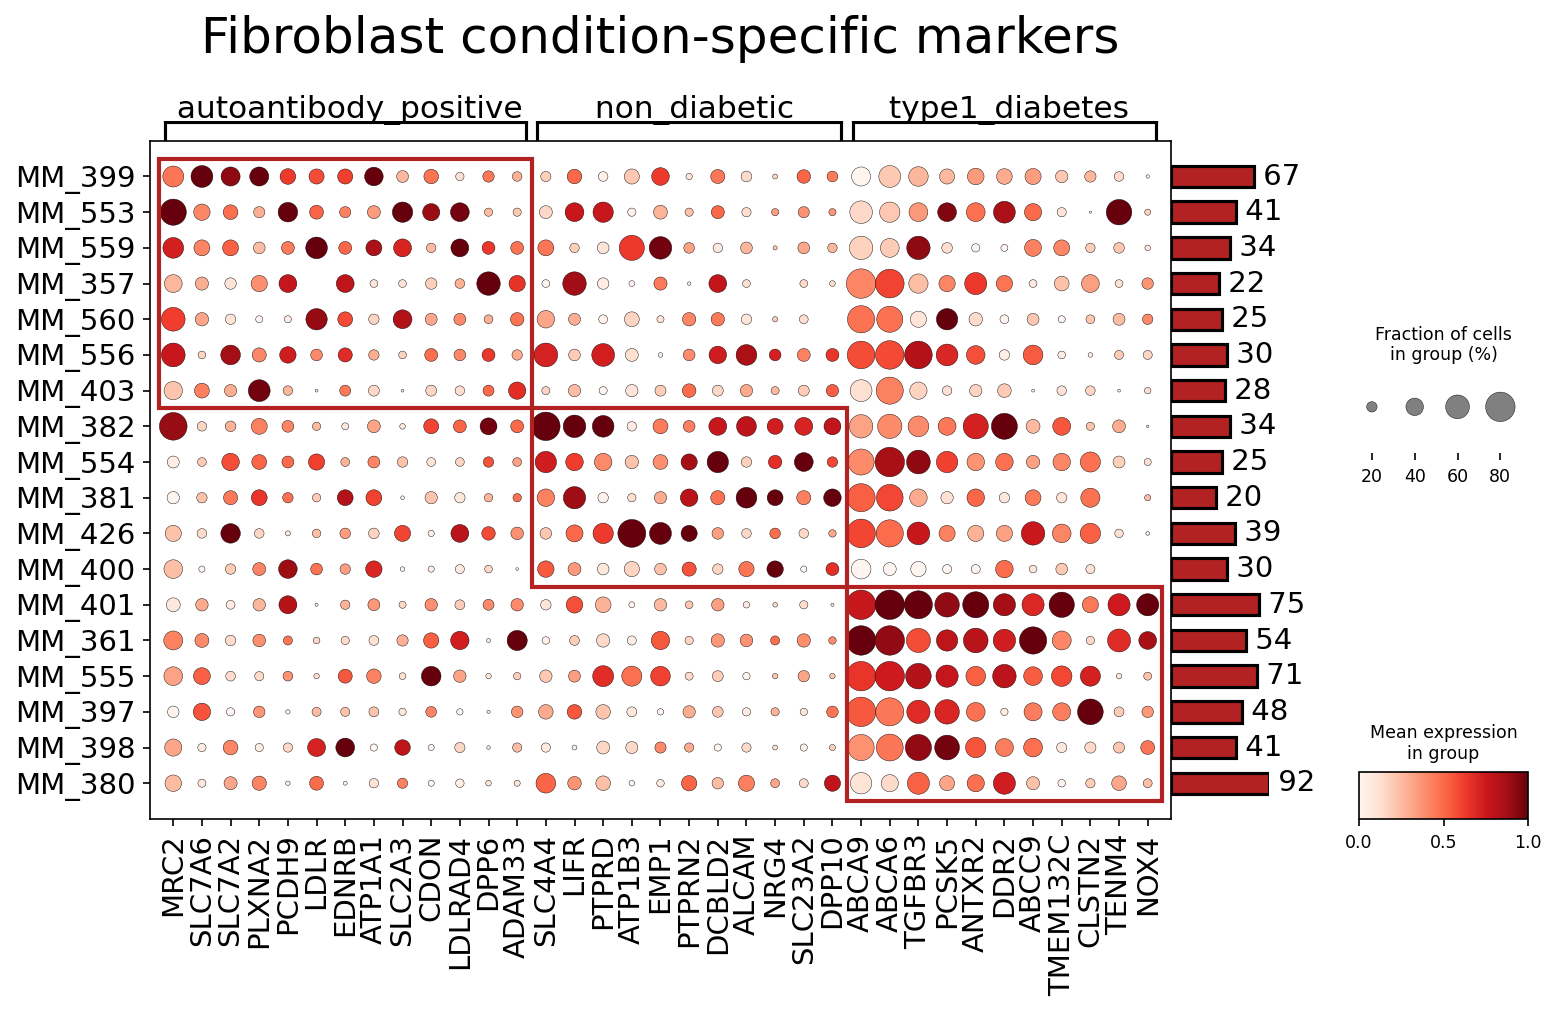
This analysis identifies condition-specific surfaceome markers in Fibroblast cells from human pancreatic tissue across three conditions: autoantibody_positive, non_diabetic (reference), and type1_diabetes. The dot plot visualizes the mean expression level (color intensity) and the fraction of cells expressing each marker (dot size) for Fibroblasts in each condition. The focus is on identifying potential biomarkers and therapeutic targets for Type 1 Diabetes (T1D) and related pre-diabetic states. The analysis specifically looked for surfaceome markers, which are highly relevant for cell-cell interactions and drug targeting.
Visual Summary
The dot plot displays the expression of 40 Fibroblast surfaceome markers across the autoantibody_positive, non_diabetic, and type1_diabetes conditions.
Condition-specific patterns are evident:
- A cluster of markers (e.g., MRC2, SLC7A6, SLC7A2, PCDH9, LDLR, ATP1A1, EDNRB, SLC2A3, CDON, LDLRAD4, DPP6, ADAM33, SLC4A4, LIFR) shows generally higher expression and/or prevalence in both autoantibody_positive and type1_diabetes conditions compared to non_diabetic Fibroblasts. This suggests these markers are associated with disease initiation or progression.
- Another group of genes (e.g., PTPRD, ATP1B3, EMP1, ALCAM, PTPRN2, DCBLD2, NRG4, SLC23A2) exhibits comparatively higher expression and prevalence in non_diabetic Fibroblasts, implying their potential role in maintaining healthy pancreatic tissue or their downregulation during disease.
- A distinct set of markers (e.g., DPP10, ABCA9, ABCA6, TGFBR3, PCSK5, ANTXR2, DDR2, ABCC9, TMEM132C, CLSTN2, TENM4, NOX4) shows particularly high expression and cell fraction specifically in type1_diabetes Fibroblasts, indicating these could be strong disease-specific markers. Some of these are also elevated in autoantibody_positive samples, suggesting a continuum of change.
- Expression levels and prevalence: Markers vary significantly in both mean expression intensity (color saturation) and the fraction of expressing cells (dot size) within and across conditions, highlighting their differential relevance. For example, some markers like MRC2 and TGFBR3 show high expression in a large fraction of cells in disease conditions, making them robust candidates.
Biological Interpretation
Fibroblasts are critical components of the pancreatic microenvironment, playing roles in extracellular matrix (ECM) remodeling, inflammation, and immune modulation. Changes in their surfaceome can reflect altered cell states and interactions in the context of T1D.
Markers Elevated in Autoantibody-Positive and Type 1 Diabetes Fibroblasts:
This group of genes suggests a shift in Fibroblast function during the progression towards and presence of T1D.
- MRC2 (CD280 / Endo180): A C-type lectin receptor involved in collagen and matrix turnover, and macrophage scavenging. Upregulation could indicate increased matrix remodeling or altered immune interactions in the inflammatory environment of T1D pancreas. GeneCards: MRC2
- SLC7A6 and SLC7A2 (LAT2 and LAT1 subunits): These are subunits of L-type amino acid transporters, crucial for transporting large neutral amino acids. Upregulation could reflect altered metabolic demands or nutrient sensing in diseased Fibroblasts, potentially supporting their activated state or proliferation in a T1D context. GeneCards: SLC7A6
- PCDH9: A protocadherin involved in cell-cell adhesion and signaling, particularly in neuronal development but also implicated in tissue organization. Its altered expression might affect Fibroblast-to-cell adhesion or tissue structure. GeneCards: PCDH9
- LDLR (Low-Density Lipoprotein Receptor): Involved in cholesterol uptake. Dysregulated lipid metabolism is linked to diabetes complications, and altered LDLR expression on Fibroblasts could reflect changes in their metabolic environment or contribute to lipid accumulation/signaling. GeneCards: LDLR
- EDNRB (Endothelin Receptor Type B): A G-protein coupled receptor for endothelin peptides, involved in vasoconstriction, cell proliferation, and inflammation. Elevated EDNRB could indicate increased endothelin signaling, contributing to fibrosis or altered blood flow in the inflamed pancreas. GeneCards: EDNRB
- LIFR (Leukemia Inhibitory Factor Receptor): LIF signaling is involved in inflammation, tissue repair, and immune regulation. Upregulation of LIFR on Fibroblasts suggests enhanced responsiveness to inflammatory signals in T1D, potentially mediating Fibroblast activation and remodeling. GeneCards: LIFR
Markers Elevated in Non-Diabetic Fibroblasts:
These genes might represent homeostatic Fibroblast functions that are perturbed in T1D.
- PTPRD (Receptor-Type Tyrosine-Protein Phosphatase Delta): Involved in cell adhesion and growth, often acting as a tumor suppressor. Its downregulation in T1D might contribute to altered cell growth or signaling pathways that become dysregulated during inflammation. GeneCards: PTPRD
- ALCAM (Activated Leukocyte Cell Adhesion Molecule / CD166): A cell adhesion molecule involved in immune cell trafficking and cell-cell interactions. Its reduced expression in T1D could affect Fibroblast interactions with immune cells or other stromal components, potentially impairing normal tissue organization or immune surveillance. GeneCards: ALCAM
- NRG4 (Neuregulin 4): A growth factor involved in metabolism and energy homeostasis, particularly in regulating lipid metabolism and insulin sensitivity. Its reduced expression could signify a loss of a protective or metabolic regulatory function in Fibroblasts during T1D. GeneCards: NRG4
Markers Specifically Elevated in Type 1 Diabetes Fibroblasts:
This set highlights robust candidates for T1D-specific Fibroblast pathology.
- ABCA9 and ABCA6 (ATP-Binding Cassette Transporters): These transporters are involved in lipid efflux and cholesterol homeostasis. Their upregulation could reflect altered lipid handling or a stress response in T1D Fibroblasts. GeneCards: ABCA9
- TGFBR3 (TGF-beta Receptor Type 3 / Betaglycan): While not signaling directly, TGFBR3 modulates TGF-beta signaling by binding TGF-beta ligands and presenting them to the signaling receptors (TGFBR1/2). TGF-beta signaling is a key driver of fibrosis and inflammation. Elevated TGFBR3 suggests altered responsiveness or potentiation of pro-fibrotic TGF-beta pathways in T1D Fibroblasts, contributing to pancreatic remodeling. GeneCards: TGFBR3
- DDR2 (Discoidin Domain Receptor Tyrosine Kinase 2): A collagen-sensing receptor tyrosine kinase involved in matrix remodeling and cell proliferation. Upregulation suggests increased interaction with collagen in the T1D pancreas, potentially driving Fibroblast activation and fibrosis. GeneCards: DDR2
- NOX4 (NADPH Oxidase 4): A reactive oxygen species (ROS)-generating enzyme, implicated in oxidative stress, inflammation, and fibrosis in various tissues, including the pancreas. Elevated NOX4 in T1D Fibroblasts suggests increased oxidative stress, which is a known contributor to beta-cell dysfunction and tissue damage in diabetes. GeneCards: NOX4
Clinical or Translational Implications
The identification of condition-specific surfaceome markers in Fibroblasts offers valuable insights into T1D pathogenesis and potential therapeutic avenues. Fibroblasts, as key regulators of the tissue microenvironment and immune responses, are increasingly recognized as therapeutic targets.
- Biomarker Potential: Genes like TGFBR3, DDR2, and NOX4 showing strong elevation specifically in type1_diabetes Fibroblasts could serve as diagnostic or prognostic biomarkers for T1D progression or disease activity within the pancreatic microenvironment. Monitoring these markers, perhaps via imaging or liquid biopsy approaches, could help assess disease stage or therapeutic response.
Therapeutic Targets for Fibrosis and Inflammation:
- TGFBR3: While not a direct signaling receptor, its role in modulating TGF-beta signaling makes it an indirect target. Strategies to dampen excessive TGF-beta signaling, which is known to drive fibrosis in diabetes, could involve targeting Fibroblast responsiveness.
- DDR2: As a collagen receptor, DDR2 plays a direct role in Fibroblast activation and matrix remodeling. Inhibitors of DDR2 could potentially mitigate pancreatic fibrosis, a common feature in chronic inflammation and T1D.
- NOX4: The involvement of NOX4 in oxidative stress and fibrosis makes it a highly attractive therapeutic target. Pharmacological inhibitors of NOX4 are under investigation for various fibrotic conditions. Reducing NOX4-mediated ROS production in pancreatic Fibroblasts could protect beta cells, reduce inflammation, and attenuate fibrosis in T1D. PubMed search: NOX4 inhibitors fibrosis
- Immunomodulation via Fibroblasts: Markers like LIFR and EDNRB suggest that Fibroblasts are actively sensing and responding to inflammatory cues. Targeting these pathways on Fibroblasts could modify the immune microenvironment, potentially reducing autoimmune attack on beta cells.
- Early Intervention: The presence of elevated markers (e.g., MRC2, LIFR) in autoantibody_positive individuals suggests that Fibroblast activation and maladaptive remodeling might begin early in the disease process, even before overt diabetes. This opens possibilities for early intervention strategies targeting Fibroblast activities to prevent or slow down disease progression.
- Experimental Validation: The identified markers warrant further experimental validation using techniques such as immunohistochemistry, flow cytometry, or spatial transcriptomics to confirm their cell-type specificity, localization, and functional roles in human T1D pancreatic tissue. *In vitro* studies using patient-derived Fibroblasts could also explore the impact of modulating these surfaceome proteins on Fibroblast activation, interaction with immune cells, and matrix production.
9. Gene Ontology (GSA) Analysis of Beta Cells Across Type 1 Diabetes Progression
[Analysis Visualization Results]...
Analysis Overview
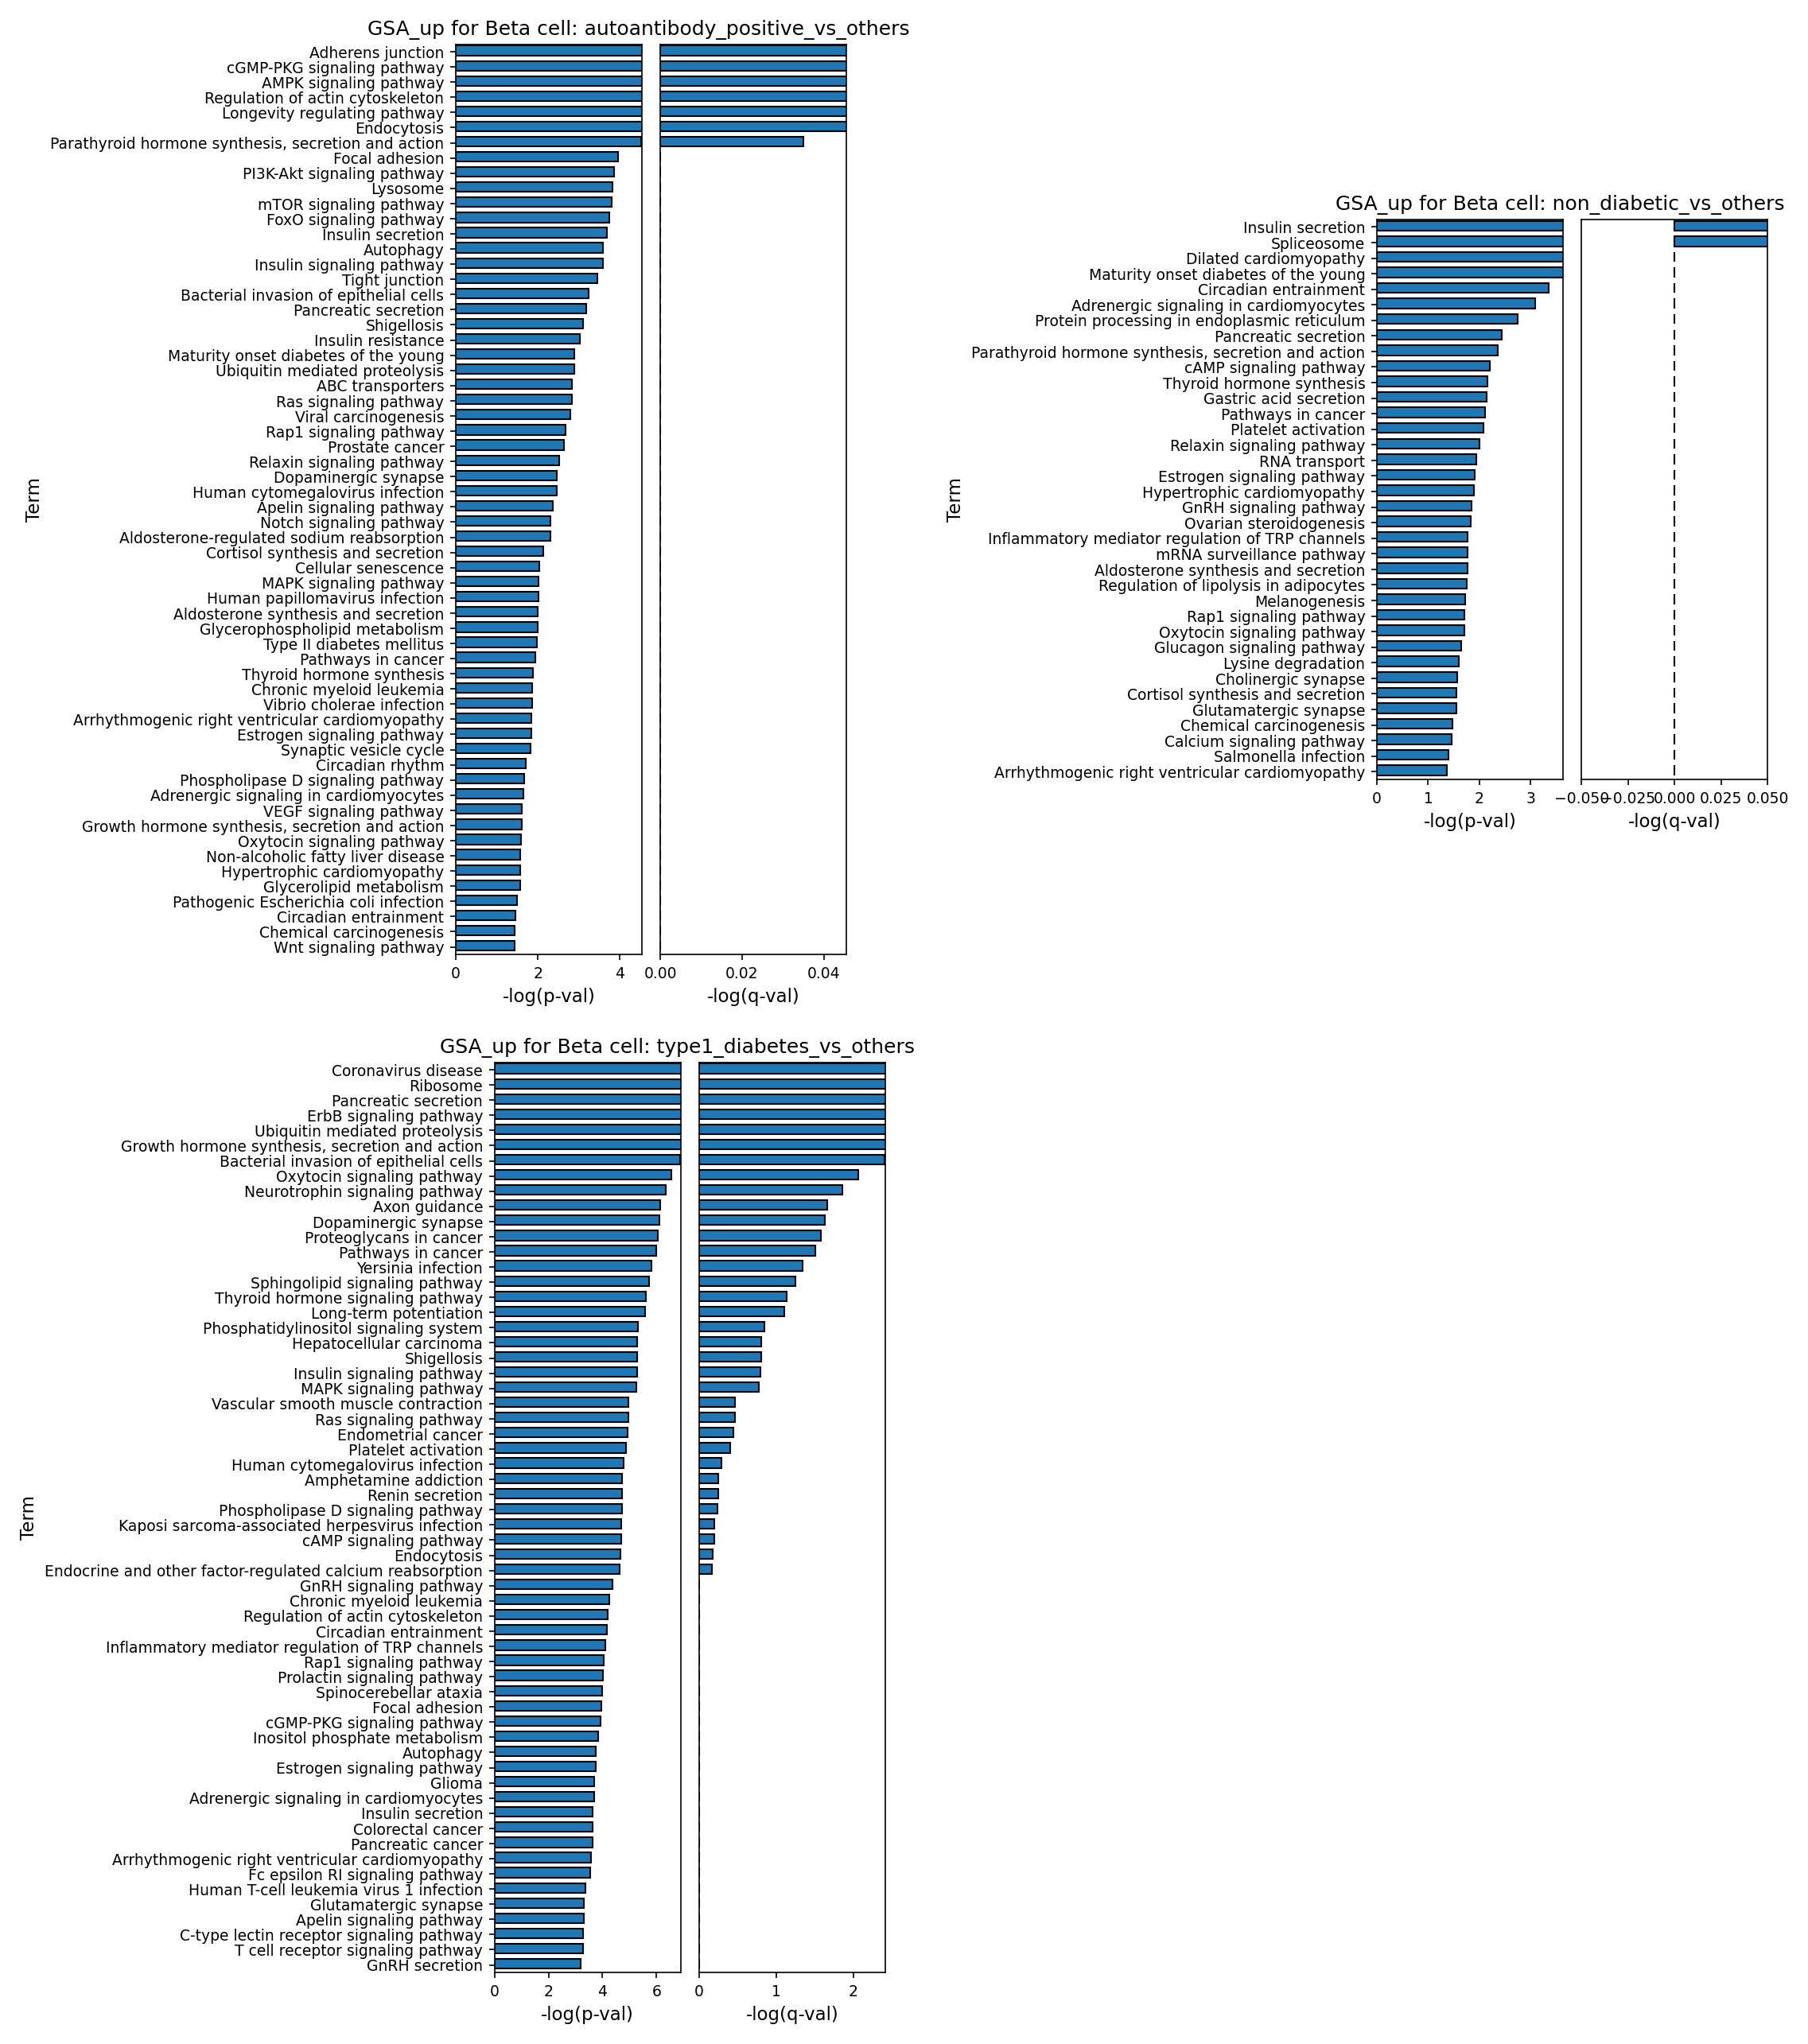
This analysis presents Gene Ontology (GSA) results for Beta cells, comparing specific conditions against all other conditions present in the dataset. The analysis aims to identify biological pathways that are significantly upregulated in Beta cells under different disease statuses: autoantibody_positive, non_diabetic, and type1_diabetes. The plots display enriched GO terms ranked by their nominal p-value (-log(p-val)) and their corresponding False Discovery Rate (FDR) adjusted p-value (-log(q-val)). This provides insights into the cellular processes and molecular mechanisms active in Beta cells at various stages related to Type 1 Diabetes.
Visual Summary
The provided bar plots illustrate the top enriched Gene Ontology terms in Beta cells for three distinct comparisons:
- GSA_up for Beta cell: autoantibody_positive_vs_others: This plot reveals a substantial number of significantly enriched pathways. Key terms with high -log(p-val) and strong -log(q-val) include those related to cell adhesion and structure (Adherens junction, Regulation of actin cytoskeleton, Tight junction), various signaling cascades (cGMP-PKG, AMPK, PI3K-Akt, mTOR, FoxO, Insulin signaling pathway), metabolic processes (Insulin regulation, Autophagy, Lysosome, Endocytosis), and longevity regulation. The robust -log(q-val) for many terms indicates strong statistical significance after multiple testing correction.
- GSA_up for Beta cell: non_diabetic_vs_others: In contrast to the other conditions, this plot shows fewer terms with high significance, particularly after FDR correction. While nominal p-values suggest enrichment for terms like Insulin secretion, Spliceosome, and Protein processing in endoplasmic reticulum, the -log(q-val) bars are notably shorter, with most terms failing to cross the typical FDR significance threshold (e.g., q-val < 0.05, indicated by a dashed line around -log(q-val) = 1.3). This suggests that Beta cells in a non-diabetic state do not exhibit a strongly upregulated and uniquely distinct set of pathways when compared against a heterogeneous group of 'other' conditions (autoantibody_positive and type1_diabetes combined), at least not to the same degree of statistical robustness as observed in the disease/pre-disease states.
- GSA_up for Beta cell: type1_diabetes_vs_others: This plot displays a wide array of highly significant GO terms, characterized by very high -log(p-val) and corresponding strong -log(q-val). Prominently enriched categories include terms associated with viral and bacterial infections (Coronavirus disease, Bacterial invasion of epithelial cells, Yersinia infection, Shigellosis, Human cytomegalovirus infection), cellular stress and protein handling (Ribosome, Ubiquitin mediated proteolysis), various signaling pathways (ErbB, Neurotrophin, Insulin signaling pathway, MAPK, Ras, Sphingolipid), and even terms typically associated with cancer (Pathways in cancer, Proteoglycans in cancer). Pathways directly relevant to pancreatic function like Pancreatic secretion and Insulin signaling pathway are also notably enriched.
Biological Interpretation
The GSA results provide critical insights into the functional status of pancreatic Beta cells at different stages relevant to Type 1 Diabetes (T1D):
Autoantibody-Positive State: Adaptive and Stress Responses
Beta cells in the autoantibody_positive state, often considered a pre-diabetic phase, show robust enrichment of pathways involved in cellular maintenance, metabolism, and stress responses. The prominence of Insulin signaling pathway [GeneCards: Insulin Signaling Pathway] and Insulin regulation suggests active metabolic adjustments, which could be either compensatory efforts to maintain glucose homeostasis or early signs of dysregulation. Pathways related to cell structure (Adherens junction, actin cytoskeleton, tight junction) might indicate changes in cell-cell communication or tissue remodeling. The enrichment of AMPK, PI3K-Akt, mTOR, and FoxO signaling pathways points towards altered nutrient sensing, energy metabolism, cell growth, and survival mechanisms, which are often implicated in cellular stress and adaptation to hostile environments [PubMed Search: Beta cell stress metabolism]. The activation of Autophagy and Lysosome pathways further supports a stress response, where cells attempt to clear damaged components and recycle resources.
- Non-Diabetic State: Baseline Function with Limited Differential Upregulation
The non_diabetic_vs_others comparison, while showing some nominal enrichment for core Beta cell functions like Insulin secretion and Protein processing in endoplasmic reticulum [UniProt: Proinsulin], demonstrates a relative lack of statistically robust, uniquely upregulated pathways after FDR correction. This suggests that the healthy Beta cell transcriptome, when compared to a combined group of diseased and pre-diseased states, may primarily represent a baseline or homeostatic functional state, rather than a state with highly distinct and robustly *upregulated* compensatory or stress pathways. The absence of strong differential upregulation might also be a consequence of the 'others' group being heterogeneous, diluting specific disease signatures.
- Type 1 Diabetes State: Infection, Immune Response, and Widespread Dysregulation
The Beta cells in the type1_diabetes condition exhibit a dramatically altered functional landscape, marked by a strong signature of infection and immune activation. The enrichment of multiple viral and bacterial infection pathways (e.g., Coronavirus disease, Bacterial invasion, Human cytomegalovirus infection) is highly significant and strongly supports the long-standing hypothesis of environmental factors, particularly viral infections, triggering or exacerbating T1D pathogenesis [PubMed Search: Type 1 diabetes viral infection]. This could reflect direct infection of Beta cells, or an indirect immune response cascade affecting them.
Furthermore, pathways related to cellular stress (Ribosome, Ubiquitin mediated proteolysis) are indicative of perturbed protein synthesis, folding, and degradation machinery, consistent with ER stress and general cellular damage during autoimmune attack. The widespread dysregulation of various signaling pathways (ErbB, Neurotrophin, MAPK, Ras) points to profound changes in cellular growth, differentiation, and survival mechanisms. The unexpected enrichment of cancer-related pathways might suggest aberrant survival attempts, impaired apoptosis, or uncontrolled proliferation in response to chronic injury and immune pressure, potentially reflecting maladaptive regenerative processes or resistance to cell death, though this requires further investigation. The presence of Insulin signaling pathway in this context likely reflects its dysfunction or altered regulatory feedback rather than normal function.
Clinical or Translational Implications
The GSA findings offer several important clinical and translational implications for Type 1 Diabetes:
- Early Disease Mechanisms (Autoantibody-Positive): The identification of altered metabolic and stress response pathways (AMPK, PI3K-Akt, mTOR, Autophagy) in autoantibody_positive Beta cells suggests that early interventions targeting these pathways might modulate Beta cell survival or function even before the onset of overt diabetes. This highlights a window for preventive strategies.
- Role of Infection in T1D Pathogenesis: The striking enrichment of viral and bacterial infection pathways in type1_diabetes Beta cells strongly reinforces the environmental trigger hypothesis for T1D. This finding supports continued research into the specific pathogens involved and could inform strategies for prevention (e.g., vaccination) or early therapeutic intervention aimed at mitigating infection-induced Beta cell damage or immune responses.
- Targeting Beta Cell Stress and Survival: The pervasive evidence of cellular stress, protein handling dysfunction, and dysregulated signaling in type1_diabetes Beta cells indicates that therapeutic approaches aimed at reducing ER stress, enhancing protein quality control, or modulating specific survival pathways could be beneficial in preserving Beta cell mass and function [PubMed Search: Beta cell ER stress T1D].
- Potential Biomarkers: The identified pathways, particularly those robustly enriched in the autoantibody_positive and type1_diabetes states, could contain novel candidate biomarkers for monitoring disease progression or therapeutic response.
10. Gene Set Enrichment Analysis (GSEA) Across Pancreatic Cell Types and Diabetes Conditions
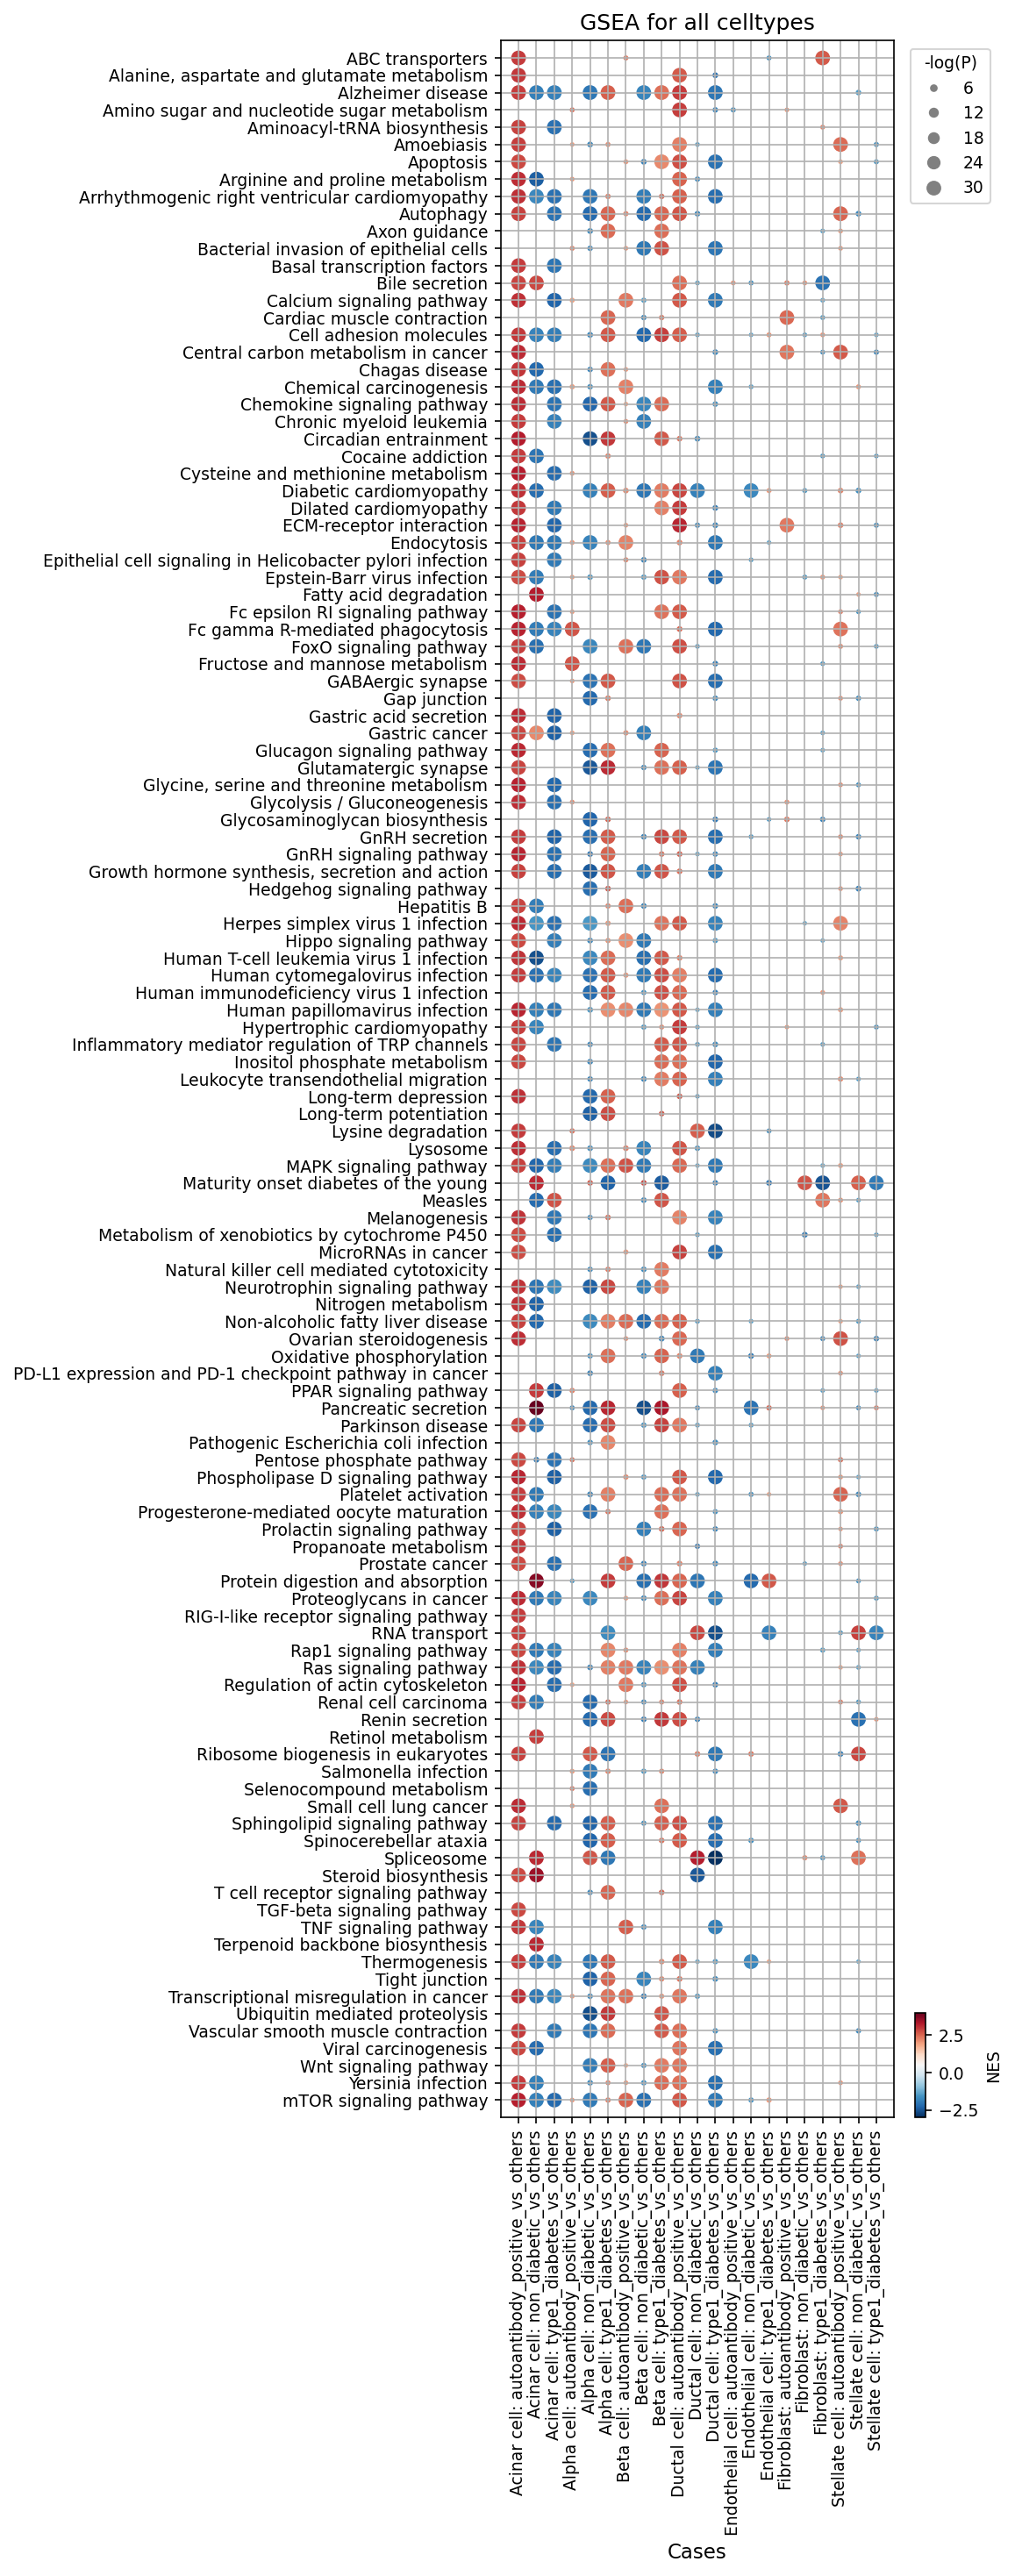
[Analysis Visualization Results]...
Analysis Overview
This analysis presents Gene Set Enrichment Analysis (GSEA) results visualized as a dot plot. The plot evaluates the enrichment of various biological pathways (gene sets) across different pancreatic cell types (Acinar cell, Alpha cell, Beta cell, Ductal cell, Endothelial cell, Fibroblast, Stellate cell) under three conditions: autoantibody positive, non-diabetic, and type 1 diabetes. For each cell type, the analysis compares gene expression in cells from a specific condition against all other conditions combined (e.g., 'type1_diabetes_vs_others'). The size of each dot represents the statistical significance (-log(P-value)), while the color indicates the Normalized Enrichment Score (NES): red signifies enrichment (positive NES), and blue indicates depletion (negative NES) in the "test" condition compared to the "others" group.
Visual Summary
The dot plot displays a complex landscape of pathway activity modulated by diabetes status and cell type.
- Immune and Inflammatory Pathways: Many immune-related pathways, such as "T cell receptor signaling pathway," "TNF signaling pathway," "Chemokine signaling pathway," "Leukocyte transendothelial migration," and "Natural killer cell mediated cytotoxicity," show significant enrichment (red, large dots) across multiple cell types in both the type1_diabetes_vs_others and autoantibody_positive_vs_others comparisons. This indicates a widespread inflammatory and immune response in both established Type 1 Diabetes (T1D) and its pre-diabetic (autoantibody positive) state.
- Beta Cell-Specific Changes: In Beta cells, "Apoptosis" is notably enriched in type1_diabetes_vs_others, highlighting beta cell death as a key pathological feature. Other pathways like "Oxidative phosphorylation" and "Pancreatic secretion" also show enrichment in T1D Beta cells.
- Metabolic and Stress Pathways: Pathways related to metabolism (e.g., "Glycolysis / Gluconeogenesis") and cellular stress (e.g., "FoxO signaling pathway") exhibit varied enrichment patterns across cell types and conditions. "mTOR signaling pathway" is consistently depleted (blue) in the non_diabetic_vs_others comparison across several cell types, suggesting it might be upregulated in diseased/pre-diseased conditions.
- Stromal and Exocrine Pancreas Involvement: Acinar, Ductal, Endothelial, Fibroblast, and Stellate cells also display significant alterations, including immune activation and, in some cases, "Apoptosis" enrichment in T1D, indicating broader pancreatic involvement beyond islet cells. "ECM-receptor interaction" is enriched in Fibroblasts in T1D, suggesting extracellular matrix remodeling.
- Pre-Diabetic State (Autoantibody Positive): The autoantibody_positive_vs_others columns frequently mirror the type1_diabetes_vs_others patterns, particularly for immune pathways, suggesting that significant pathological processes are already active in individuals with autoantibodies.
Biological Interpretation
General Immune and Inflammatory Response
The pervasive enrichment of immune-related pathways across nearly all pancreatic cell types in type1_diabetes_vs_others and autoantibody_positive_vs_others comparisons strongly underscores the autoimmune nature of Type 1 Diabetes.
- T cell receptor signaling pathway, TNF signaling pathway, and Chemokine signaling pathway: These are central to adaptive and innate immune responses, indicating active immune cell recruitment, activation, and cytokine-mediated inflammation within the pancreas.
- Leukocyte transendothelial migration: Its enrichment suggests increased infiltration of immune cells into the pancreatic tissue, a hallmark of insulitis in T1D [PubMed search: insulitis type 1 diabetes].
- Natural killer cell mediated cytotoxicity: Enrichment of this pathway, particularly in Alpha, Beta, Ductal, Fibroblast, and Stellate cells in T1D, points to potential direct cytolytic activity by NK cells or other immune cells against pancreatic cells.
- PD-L1 expression and PD-1 checkpoint pathway in cancer: Enrichment in T1D-related conditions might reflect attempts by pancreatic cells to evade immune attack, or it could be part of a broader inflammatory response.
Islet Cell-Specific Changes (Beta & Alpha Cells)
Beta Cells (Target of Autoimmunity):
- Apoptosis: The significant enrichment of "Apoptosis" in Beta cells in type1_diabetes_vs_others is a critical finding, directly linking to the progressive destruction of insulin-producing beta cells, the defining feature of T1D [GeneCards: INS].
- Oxidative phosphorylation: Its enrichment could indicate increased metabolic stress or altered mitochondrial function in surviving beta cells under inflammatory attack.
- Pancreatic secretion: Enriched in T1D Beta cells, potentially reflecting dysregulated insulin secretion or stress-induced secretory changes.
- FoxO signaling pathway: Enriched in T1D Beta cells, suggesting activation of stress response pathways involved in cell fate decisions, metabolism, and oxidative stress [UniProt: FOXO1].
- Alpha Cells (Glucagon-Producing): Alpha cells, while not the primary target, are also affected. They show enrichment of many of the same immune activation pathways as Beta cells, supporting the concept of widespread insulitis. "Pancreatic secretion" and "Oxidative phosphorylation" are also enriched, suggesting functional dysregulation in glucagon-producing cells.
Exocrine Pancreas and Stromal Cell Involvement
The findings extend beyond the islets, indicating broader pancreatic pathology.
- Acinar and Ductal Cells: Exhibit enrichment for immune activation pathways and "Apoptosis" in T1D, suggesting that the exocrine pancreas is also impacted by inflammation and cell death. "Pancreatic secretion" is enriched here, likely indicating stress responses or dysfunction in digestive enzyme secretion.
- Stromal Cells (Endothelial, Fibroblast, Stellate cells): Show significant immune pathway enrichment in T1D, suggesting their active role in shaping the inflammatory microenvironment.
- ECM-receptor interaction: Enriched in Fibroblasts in T1D, points to extracellular matrix remodeling and potential fibrosis, common features in chronic inflammation.
- Diabetic cardiomyopathy: Its enrichment in Endothelial cells in type1_diabetes_vs_others suggests that systemic complications of diabetes, such as cardiovascular disease, are reflected at the cellular level in endothelial dysfunction within the pancreas.
- Tight junction: Depletion in Fibroblasts in T1D could indicate impaired barrier function and increased permeability within the pancreatic stroma.
Pre-Diabetic (Autoantibody Positive) State Insights
The strong overlap in enriched immune and inflammatory pathways between autoantibody_positive_vs_others and type1_diabetes_vs_others suggests that the pathogenic immune processes are already well underway in individuals who are autoantibody positive, even before clinical diagnosis. This highlights the importance of early intervention strategies.
Healthy Pancreas (non_diabetic_vs_others) Insights
Pathways like "mTOR signaling pathway," "RNA transport," and "Ribosome biogenesis in eukaryotes" are significantly *depleted* (blue NES) in non-diabetic cells compared to the combined diseased/pre-diseased groups. This implies that these pathways are relatively *upregulated* in the T1D and autoantibody-positive conditions. Aberrant mTOR signaling, for instance, has been implicated in both beta cell dysfunction and immune cell activation in T1D, suggesting a perturbed anabolic state or stress response in disease [PubMed search: mTOR signaling type 1 diabetes pancreas].
Clinical or Translational Implications
- Biomarker Discovery: The identified enriched pathways, especially those consistently activated in autoantibody-positive individuals, could serve as potential early diagnostic or prognostic biomarkers for T1D progression.
- Therapeutic Targets: Pathways involved in immune activation (e.g., T cell receptor signaling, TNF signaling), apoptosis, and metabolic stress (e.g., mTOR signaling, FoxO signaling) represent promising targets for therapeutic interventions aimed at halting beta cell destruction, modulating the immune response, or preserving pancreatic function in T1D.
- Understanding Disease Progression: The similarity between autoantibody-positive and T1D profiles reinforces the concept of a continuum of disease, suggesting that interventions initiated in the pre-diabetic phase could be critical to prevent or delay overt T1D.
- Holistic Pancreatic Health: The involvement of exocrine and stromal cells highlights that T1D is not solely an islet disease but affects the broader pancreatic microenvironment. Targeting these broader inflammatory and remodeling processes could offer additional therapeutic avenues.
11. Discussion
This comprehensive single-cell analysis of human pancreatic tissue provides a granular view of the dynamic cellular and molecular landscape throughout Type 1 Diabetes (T1D) progression. The study confirms Beta cell depletion as a hallmark of T1D, with population bar plots showing a reduction in Beta cell proportions in affected individuals. Beyond Beta cells, the widespread immune and inflammatory pathway enrichment, observed across nearly all pancreatic cell types in both autoantibody-positive and T1D conditions, underscores the pervasive nature of insulitis and broader pancreatic inflammation.
Crucially, the autoantibody-positive state, representing a pre-diabetic phase, emerges as a highly active and critical period. Beta cells in this phase exhibit robust cell-cell interaction networks, particularly involving glutamate and neuregulin-ERBB signaling, suggesting compensatory or stress-adaptive responses before overt Beta cell destruction. This intricate communication, largely diminished in established T1D, highlights a potential window for early intervention. Gene Ontology analysis further reveals significant enrichment of metabolic and stress response pathways (e.g., AMPK, PI3K-Akt, mTOR, Autophagy) in autoantibody-positive Beta cells, indicating active cellular adjustments.
The study also delineates specific changes in Beta cell surface markers: a reduction in key functional/protective markers like GLP1R, CDH1, and PILRB in T1D, alongside an upregulation of markers like NCAM1, SLC8A1, and BMPR1A. These latter markers are indicative of Beta cell dedifferentiation, altered calcium homeostasis, and maladaptive signaling, contributing to functional decline and increased vulnerability. Furthermore, a striking enrichment of viral and bacterial infection pathways in T1D Beta cells from GSA results provides strong support for environmental triggers in T1D pathogenesis.
Beyond islet cells, the stromal compartment, comprising Fibroblasts and Stellate cells, is actively involved in pancreatic pathology. Condition-specific surfaceome markers in Fibroblasts point to altered extracellular matrix remodeling, lipid metabolism, and increased oxidative stress. Notably, high expression of TGFBR3, DDR2, and NOX4 in T1D Fibroblasts indicates active pro-fibrotic and inflammatory processes. Cell-cell interaction analysis in autoantibody-positive samples reveals strong integrin-collagen, PDGFA-PDGFRA, and IGF1-IGF1R interactions within stromal cells, suggesting early activation of pro-fibrotic pathways that could exacerbate islet damage. The observation of 'Diabetic cardiomyopathy' pathway enrichment in Endothelial cells in T1D further emphasizes systemic complications reflected locally within the pancreas.
Collectively, these findings paint a dynamic picture of T1D progression, where early protective or adaptive responses in the autoantibody-positive phase gradually give way to profound Beta cell loss, widespread immune dysregulation, and maladaptive remodeling of the entire pancreatic microenvironment in established disease. The extensive involvement of stromal cells in pro-fibrotic responses, coupled with the direct impact on Beta cells, provides a holistic understanding of pancreatic pathology in T1D.
Hypotheses:
- The extensive and diverse cell-cell interaction network, particularly involving glutamate and Neuregulin-ERBB signaling, observed in islet cells during the autoantibody-positive phase represents a critical adaptive response or early dysregulation preceding overt Beta cell destruction in Type 1 Diabetes.
- The altered expression of key surfaceome markers (e.g., reduced GLP1R, CDH1, PILRB; increased NCAM1, SLC8A1, BMPR1A) in Beta cells across disease stages directly correlates with progressive Beta cell dedifferentiation, functional impairment, and heightened susceptibility to autoimmune attack.
- Activation of pancreatic stromal cells (Fibroblasts, Stellate cells) and their associated pro-fibrotic signaling pathways (e.g., PDGFRA, DDR2, NOX4) in the autoantibody-positive and T1D states contribute significantly to extracellular matrix remodeling, inflammation, and the creation of a microenvironment detrimental to Beta cell survival and function.
- The strong enrichment of viral and bacterial infection pathways in T1D Beta cells suggests that specific environmental pathogens play a direct role in triggering or exacerbating Beta cell pathology and immune responses, either through direct infection or molecular mimicry.
Potential therapeutic targets:
- GLP1R agonists: GLP1R expression is significantly reduced in T1D Beta cells, indicating a loss of crucial pro-survival and insulinotropic signaling pathways. Agonists could compensate for this deficiency, enhancing remaining Beta cell function and survival. Evidence: GLP1R agonists are established therapeutics for Type 2 Diabetes, known to promote glucose-dependent insulin secretion, Beta cell proliferation, and anti-apoptotic effects. Their observed reduction in T1D Beta cells suggests a missing protective mechanism in disease. Validation: In vitro: Test GLP1R agonists on human T1D Beta cells to evaluate glucose-stimulated insulin secretion, proliferation, and resistance to apoptosis. In vivo: Administer GLP1R agonists to T1D animal models (e.g., NOD mice) to assess effects on Beta cell mass, function, and disease progression.
- PDGFRA inhibitors: PDGFA-PDGFRA signaling is a strong and significant cell-cell interaction within pancreatic stellate cells in the autoantibody-positive state, a known driver of fibrosis and stellate cell activation. Inhibition could mitigate pro-fibrotic processes. Evidence: PDGFRA is a well-established receptor in pro-fibrotic pathways. Inhibitors of PDGFRA (e.g., imatinib, nintedanib) are already used in other fibrotic conditions and cancers, demonstrating clinical feasibility. Validation: In vitro: Treat human pancreatic stellate cells from T1D patients or relevant models with PDGFRA inhibitors to measure proliferation, extracellular matrix (ECM) production, and activation markers. In vivo: Test in T1D animal models for effects on pancreatic fibrosis and inflammation.
- NOX4 inhibitors: NADPH Oxidase 4 (NOX4), a reactive oxygen species (ROS)-generating enzyme, is specifically elevated in T1D Fibroblasts and implicated in oxidative stress and fibrosis. Inhibition could reduce oxidative damage and attenuate fibrotic remodeling. Evidence: NOX4 is a key mediator of oxidative stress and fibrosis in various tissues, including the pancreas. Elevated NOX4 in T1D Fibroblasts strongly suggests its contribution to pancreatic pathology and Beta cell dysfunction. Validation: In vitro: Test NOX4 inhibitors on T1D patient-derived fibroblasts for ROS production, collagen synthesis, and activation markers. In vivo: Assess anti-fibrotic and Beta cell protective effects in T1D animal models, measuring oxidative stress markers and Beta cell survival.
- Modulators of NCAM1/SLC8A1/BMPR1A: Upregulation of NCAM1, SLC8A1, and BMPR1A in T1D Beta cells indicates processes like dedifferentiation, altered Ca2+ homeostasis, or maladaptive BMP signaling. Modulating these could help restore Beta cell identity and function. Evidence: NCAM1 is a recognized marker of Beta cell dedifferentiation. SLC8A1 (Na+/Ca2+ exchanger 1, NCX1) dysregulates Ca2+ dynamics, crucial for insulin secretion. BMPR1A mediates BMP signaling, which impacts Beta cell fate and could be aberrantly activated in disease. Validation: In vitro: Use small molecules or genetic tools to modulate NCAM1, SLC8A1, or BMPR1A expression/activity in stressed Beta cells and assess dedifferentiation markers, glucose-stimulated insulin secretion, and survival. In vivo: Test targeted interventions in T1D animal models to evaluate Beta cell recovery and function.
Follow-up validation ideas:
- Perform spatial transcriptomics or proteomics on human pancreatic tissue from different T1D stages to validate the precise localization of altered cell-cell interactions and marker expression patterns in situ, particularly for Beta-Alpha cell interactions and stromal remodeling.
- Conduct immunohistochemistry and multiplex immunofluorescence on human pancreatic biopsies or isolated islets to confirm protein-level changes of key surface markers (e.g., GLP1R, NCAM1 on Beta cells; TGFBR3, NOX4 on Fibroblasts) and assess their co-localization with immune cell infiltrates.
- Utilize patient-derived induced pluripotent stem cell (iPSC)-derived Beta cells and pancreatic fibroblast cultures to functionally test the impact of modulating identified pathways (e.g., GLP1R agonism, PDGFRA inhibition, NOX4 suppression) on cell survival, function, and fibrotic responses under inflammatory or metabolic stress conditions.
- Employ in vivo animal models of T1D (e.g., NOD mice) to evaluate the therapeutic efficacy of targeting specific pathways (e.g., through gene therapy, small molecule inhibitors, or neutralizing antibodies) on Beta cell mass, function, and overall disease progression.
- Analyze the expression of key genes and proteins (from GSA/GSEA) in sorted cell populations via targeted qPCR or Western blot to corroborate transcriptomic findings at the protein level and confirm cell-type specificity.
- Develop human islet microfluidic or co-culture models to investigate the functional consequences of specific cell-cell interactions (e.g., Alpha-Beta cell glutamate/Neuregulin signaling, Fibroblast-Beta cell crosstalk) on Beta cell health and insulin secretion in a controlled environment.
- Establish longitudinal cohort studies for autoantibody-positive individuals to correlate specific marker expression profiles (e.g., from circulating exosomes or liquid biopsy) with progression to overt T1D, assessing their potential as early diagnostic or prognostic biomarkers.
Limitations:
This report primarily describes associations and correlations derived from single-cell RNA sequencing data, and thus does not definitively establish causal relationships. Further functional experiments are required to validate the mechanistic roles of the observed cellular and molecular changes. The findings are based on a specific human pancreatic dataset, and while highly informative, the generalizability to all T1D patient populations may be influenced by patient demographics, disease stage, and cohort heterogeneity. Single-cell RNA sequencing provides transcriptomic snapshots, which may not fully capture dynamic cellular processes, post-translational modifications, or protein activity. Finally, the proposed therapeutic targets are candidate suggestions that require extensive preclinical and clinical validation, with careful consideration of potential off-target effects and systemic implications.
12. Query List
- Show and save UMAPs for condition, sample, major cell type, minor cell type, and celltype_subset in two columns.
- Show major cell type scores on UMAP and save the result.
- Show and save a marker expression dot plot for celltype_subset. SET target_cell = None and var_group_rotation = 45. Leave all other arguments at their default values.
- Show and save a population bar plot of minor cell types.
- Show and save cell-cell interaction patterns. Select at most 80 cell-cell interactions per group.
- Find cell-cell interactions involving major immune and stromal cells that differ significantly between conditions, show them as a dot plot, and save the result. Set max_n_items_per_group to 60. For each interaction identified under each condition, using the provided dataset context, describe the associated signaling pathways and mechanisms and, where relevant, its potential as a therapeutic target and related therapeutic agents.
- Show marker expressions for Beta cells in a dot plot, and save the result. Use only surfaceome markers, with at most 50 markers per condition. For each marker identified under each condition, using the provided dataset context, describe the associated signaling pathways and biological mechanisms within the tissue and, where relevant, its potential as a therapeutic target for Type 1 Diabetes and related therapeutic agents.
- Show marker expressions for Fibroblast cells in a dot plot, and save the result. Use only surfaceome markers, with at most 40 markers per condition. For each marker identified under each condition, using the provided dataset context, describe the associated signaling pathways and biological mechanisms within the tissue and, where relevant, its potential as a therapeutic target for Type 1 Diabetes and related therapeutic agents.
- Show Gene Ontology (GSA) analysis results for Beta cells as a bar plot, and save the result.
- Show Gene Set Enrichment Analysis results as a dot plot, and save it. Set the color map to RdBu_r, n_pws_to_show to 120, and target_cells to None.